Food Price Elasticities from Household Survey Data in...
13
Journal of Emerging Issues in Economics, Finance and Banking (JEIEFB) An Online International Monthly Journal (ISSN: 2306-367X) Volume:2 No.2 August 2013 655 www.globalbizresearch.com Food Price Elasticities from Household Survey Data in India: An Application of Single Equation and System Demand Models James L.T. Thanga Department of Economics, Mizoram University, Aizawl, Mizoram, India. E-mail: [email protected] ________________________________________________________________________ Abstract The effectiveness of any policy measure to control food prices, especially subsidy, should depend on the recognition and knowledge of the structure of food demand. This paper intends to analyse food consumption patterns from household survey data and the performances of single equation and system demand models. Un-tabulated NSS data for Mizoram State, India, has been analysed using Working-Lesser (WL) and Almost Ideal Demand System (AIDS) models. It was found that all food items have negative own price elasticities supporting the proposition of the traditional ‘law of demand’. The two demand models showed slightly different results in respect of cross price elasticities, and it was concluded that WL model could be successfully adopted to analyse even small sample survey data as its admits frequency weigh. At the same time, AIDS model provides more comprehensive results because it takes into account all desirable properties of demand system; however, its computational complication setbacks its universal applicability. ________________________________________________________________________ Key words: Elasticities, food, demand, AIDS, cross price.
Transcript of Food Price Elasticities from Household Survey Data in...
Journal of Emerging Issues in Economics, Finance and Banking (JEIEFB) An Online International Monthly Journal (ISSN: 2306-367X)
Volume:2 No.2 August 2013
655
www.globalbizresearch.com
Food Price Elasticities from Household Survey Data in India: An
Application of Single Equation and System Demand Models
James L.T. Thanga
Department of Economics,
Mizoram University, Aizawl,
Mizoram, India.
E-mail: [email protected]
________________________________________________________________________
Abstract
The effectiveness of any policy measure to control food prices, especially subsidy, should depend
on the recognition and knowledge of the structure of food demand. This paper intends to analyse
food consumption patterns from household survey data and the performances of single equation
and system demand models. Un-tabulated NSS data for Mizoram State, India, has been analysed
using Working-Lesser (WL) and Almost Ideal Demand System (AIDS) models. It was found that
all food items have negative own price elasticities supporting the proposition of the traditional ‘law
of demand’. The two demand models showed slightly different results in respect of cross price
elasticities, and it was concluded that WL model could be successfully adopted to analyse even
small sample survey data as its admits frequency weigh. At the same time, AIDS model provides
more comprehensive results because it takes into account all desirable properties of demand
system; however, its computational complication setbacks its universal applicability.
________________________________________________________________________ Key words: Elasticities, food, demand, AIDS, cross price.

Journal of Emerging Issues in Economics, Finance and Banking (JEIEFB) An Online International Monthly Journal (ISSN: 2306-367X)
Volume:2 No.2 August 2013
656
www.globalbizresearch.com
1. Introduction
The rapid increase in prices of rice, wheat, corn and other food staples has sent a shock wave
through poor households around the world, as well as through governments and international policy
makers. While food prices are always volatile, recent increases are of a magnitude last seen in the
1970s (Polaski, 2008). India is among the developing countries which are seriously affected by the
rise in food price. Food prices remains the major political issues of the country till today since the
rising food price seriously affected the poor and is even considered as a ‘political good’
(Pangaribowo and Tsegai, 2011). Therefore, controlling the prices of food items would have
significant impact in an attempt to reduce poverty and hunger in the country. At the same time, the
effectiveness of the public policy measures on the control of food prices, especially subsidy, should
depend on the recognition and knowledge of the demand structure while formulating such policies.
That is, it is important for public policy to be well informed on how consumers change their
expenditure in response to changes in prices and income level. Thus, an in-depth analysis of food
demand provides better insights about important factors such as prices, including prices of related
goods, and income that will affect food consumption.
The knowledge of demand structure and consumer behaviour is essential for a wide range of
development policy questions like improvement in nutritional status, food subsidy, sectoral and
macroeconomic policy analysis, etc., (Mittal, 2006). It is understood that various demand models
give different results for food demand, price elasticities in particular. Meanwhile, the market
demand structures are generally analysed using time series data (Thanga, 2010); while the
household demand structures are usually analysed using survey data by fitting the functional
relationship between expenditure on particular item and total expenditure or income. So, household
consumer expenditure survey data is usually used to study the pattern of household expenditure
with the changes in income level, without taking into consideration the effect of prices. So, it is
tried, in this paper, to analyse and evaluate the performances of single equation and system demand
models to explain household food demand pattern using cross sectional survey data in the state of
Mizoram, India. The entire analysis being made in this paper is based on the un-tabulated primary
data of the various rounds of the National Sample Survey Organization (NSSO), Ministry of
Statistics and Programme Implementation, Government of India. The pertinent question that needs
to be answered, in using survey data to analyse household food demand pattern, is whether price
variations can be obtained from these surveys to estimate a complete demand system (Koç and
Alpay, 2000). However, Deaton (1988) states that these household surveys contain information on

Journal of Emerging Issues in Economics, Finance and Banking (JEIEFB) An Online International Monthly Journal (ISSN: 2306-367X)
Volume:2 No.2 August 2013
657
www.globalbizresearch.com
the spatial distribution of prices, and thus, by covering this information in a useful form one can
easily obtain the impact of prices on quantity demanded. The rest of the paper is organized as
follows, Section-II: overview of related literature, Section – III: Methodology, Section-IV: results
and discussion, and Section-V: conclusion.
2. Overview of Related Literature
Different food demand patterns have evolved on account of different socio-economic,
demographic and institutional factors. These differences within a food distribution network can be
detected from the values of various food price and expenditure elasticities (E. Erjavec, et.al, 1998).
Broadly, two basic approaches are used in demand analysis. The first is the traditional one, which
is based on the estimation of Engel curves where food expenditure and income elasticities are
subsequently derived. Another way to perform econometric estimation is to construct a demand
system and from it to compute uncompensated (Marshallian) price and compensated (Hicksian)
and expenditure elasticities.
Since the pioneering work of Engel in 1857, the estimation of Engel curves and expenditure
elasticities has been an important part in family budget studies with estimated expenditure
elasticities having been the main behavioural parameter. The Log-Linear, or sometimes called
Double-Log (DL) function, has been the most commonly adopted functional form to estimate
Engel’s curve and found its place in the study by Stuvel & James (1950), Houthakker (1957),
Iyengar (1960), Liviatan (1964), Theil (1965), Iyengar, et al (1968), NSS, Bhattacharya (1973),
Coondoo, et al (1981). The apparent advantages of log-linear Engel’s curve over any other
functional form is its assumption of constant elasticity of expenditure and the possibility of
introducing an additional variables, generally family size, enabling the estimation of economies of
scale in consumption. However, the general problem with this approach to household demand is
model misspecification due to the exclusion of price terms and other demographic factors affecting
food demand. Consequent upon the theoretical limitations of the traditional Engel’s curve, there
come a number of attempts to reconstruct the demand model. The new models give emphasis on
utility-based approaches as a system of equations which satisfies the condition of adding-up, non-
negativity of consumptions, etc. The Working-Leser (WL) model proposed by Working (1943) and
Leser (1963) and the almost ideal demand system (AIDS) of Deaton and Muellbauer (1980) have
become the most popular new demand models, the former being single equation while the latter is
considered as system model.

Journal of Emerging Issues in Economics, Finance and Banking (JEIEFB) An Online International Monthly Journal (ISSN: 2306-367X)
Volume:2 No.2 August 2013
658
www.globalbizresearch.com
WL model relates budget shares linearly to the logarithm of total household expenditure and
other variables of logarithm of prices and demographic dummy variables like age of household
head, log of family size, number of wage earners, regional dummy, etc. This model was used by
Chern, et.al (2002), Castaldo and Reily (2007), Tey, et. al (2008), Tey, et.al (2007), Lippe, et.al
(2010). Being a system model, AIDS model ensures flexibility and the model automatically
satisfies the adding-up restriction, non-negativity of expenditure, and with simple parametric
restrictions, homogeneity and symmetry can be imposed (Maschini, 1998). AIDS model has
attracted the attention of many researchers since 1980. Buse (1994) reported that during 1980-91
as many as 89 empirical works used the AIDS demand studies. These include Baharumshah and
Mohamed (1993), Mustapha (1994), Brester and Schoebet (1995), E.Erjavec, et.al (1998),
Mustapha, et.al (1999, 2000), Tey et.al (2007), Wadud (2006), Chern, et. al (2002), Xu and Veenam
(1996), Mittal (2006), Wadud (2006), Bopape (2006), Tey, et al., (2008), Mittal (2006), Chatterjee,
et al., (2007).
3. Methodology
3.1 Data Source
The whole analysis is based on the ungrouped primary data of National Sample Survey (NSS)
and the study used the consumer expenditure survey data of the 45th, 51st, 55th, 61st and 66th NSS
Rounds covering the period of 1989-90, 1994-95, 1999-00, 2004-05 and 2009-10 respectively.
Price for each food item was worked out by dividing the total monetary expenditure by total
quantity consumed. However, there are some food items which have no data on quantity
consumption, resulting in our inability to determine their prices. So, it was decided to drop all these
items, and finally, only 6 items were included in the analysis, namely, cereals, edible oils, pulses
& products, salt, spices and sugar.
3.2 Analytical Methods
Two models are adopted in the study, namely, Working-Leser (WL), i.e. single equation model,
and Almost Ideal Demand System (AIDS), i.e. system model. They are given as follows:
0
log logi i ij j ik k i
j k
w x p H
(WL Model) Eq. (1)
log( ) log , 1,2,....,11i i ij j j i
j
xw p u i
P
(AIDS Model) Eq. (2)

Journal of Emerging Issues in Economics, Finance and Banking (JEIEFB) An Online International Monthly Journal (ISSN: 2306-367X)
Volume:2 No.2 August 2013
659
www.globalbizresearch.com
where (i,j) = food items, iw = expenditure share of food i among six food items, jp = price of
food j, x = total expenditure on all food items, P = price index, Hk includes other variables like log
of household size and regional dummy (urban or rural) and i ’s & uj are random disturbances. The
following restrictions were imposed while estimating AIDS Model:
1i
i
w for all j; * *1
( ) , 1,...112
ij ij ji ji j
1, 0 0i i kj
i i k
and
As the price index in Eq.(2) raises the estimation difficulties due to non-linearity in
parameters, Stone index is widely used for AIDS estimation (Asche and Wessel, 1997).
Present study also adopt Stone index so that the model may be called Linearly
Approximated AIDS model (LA-AIDS). The Stone index is given by
*log( ) log( ) 1,..11.i i
i
P w p i Eq. (3)
where w is budget share among six selected commodities. The Stone index is an
approximation proportional to the translog, i.e. *P P where 0(log ))E . The AIDS
model with the Stone index can be seen as follows:
*
*log( ) logi i ij j j i
j
xw p u
P
Eq. (4)
where * * (log( ) (log( )))i i i i i i iand u u E .
Expenditure and price elasticities corresponding to these models are:
i) Expenditure Elasticities:
WL Model :
1 ii
i
ew
AIDS Model : 1
1 1log( )
i ii
i i
we
w x w
ii) Price Elasticities:
WL Model : ij
ij ij
i
ew

Journal of Emerging Issues in Economics, Finance and Banking (JEIEFB) An Online International Monthly Journal (ISSN: 2306-367X)
Volume:2 No.2 August 2013
660
www.globalbizresearch.com
AIDS Model :
1,..ij i
jij ij
i i
e w i nw w
where ij is the Kronecker delta that is unity if i=j and zero otherwise. AIDS model was
estimated by Full Information Maximum Likelihood Method (FIML) and the sample means were
adopted to be the point of normalization.
4. Results and Discussion
4.1 Expenditure Elasticities
Table 1 shows expenditure elasticities for six food items calculated from WL and AIDS models.
Cereals have shown unitary elasticities for both models that percentage expenditure for this item
would increase at the same rate as the increase in income level. In view of the high budget share,
this item shows itself to be the staple food item of the study area whose demand would have been
inelastic. So, the magnitude of this elasticity may be taken to reflect the weak purchasing power of
the people to purchase even their basic necessities of life. It may also be stated that large proportion
of the population in rural areas are rearing livestock and are feeding their animal with rice and
wheat; and hence, this may led to the increasing expenditure with the increase in income level.
Table: 1 Expenditure Elasticities of Demand
Items Average Budget Share+ (%) WL Model AIDS Model
Cereals 62.04 1.00** 1.0233
Edible Oils 13.5 1.19** 0.8661**
Pulse & Products 10.5 0.95** 0.8121**
Salt 1.2 0.63** 0.6759**
Spices 5.23 1.11** 1.2369**
Sugar 7.54 0.66** 0.8508** +percentage share in the total expenditure of the six items included in the model **Significant at 5% level of significance
As expected, the calculated expenditure elasticity is found to be lowest in case of salt for both
models for being the most inelastic items of consumption; while spices are most volatile with
respect to price change as its elasticities are more than unity for both models. Thus, spices may be
taken as superior items whose consumption tended to increase with the increase in income levels.
Journal of Emerging Issues in Economics, Finance and Banking (JEIEFB) An Online International Monthly Journal (ISSN: 2306-367X)
Volume:2 No.2 August 2013
661
www.globalbizresearch.com
It may be noted that normal goods are those whose demand (expenditure) increases with the
increase in income levels but less than proportionately; while demand are increasing more than
proportionately with the increase in income levels for superior goods. Meanwhile, the two models
(WL and AIDS) showed different elasticities in respect of edible oils. That is, it may be called
superior good in case of WL model while it is normal for AIDS model.
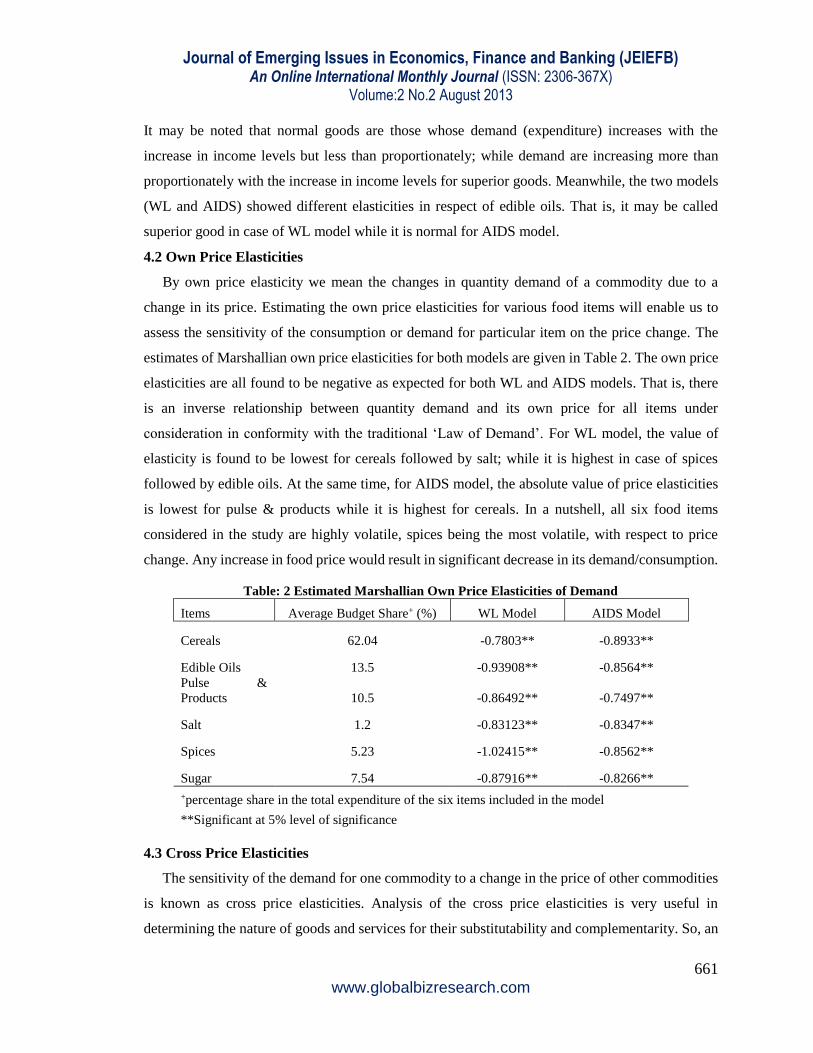
4.2 Own Price Elasticities
By own price elasticity we mean the changes in quantity demand of a commodity due to a
change in its price. Estimating the own price elasticities for various food items will enable us to
assess the sensitivity of the consumption or demand for particular item on the price change. The
estimates of Marshallian own price elasticities for both models are given in Table 2. The own price
elasticities are all found to be negative as expected for both WL and AIDS models. That is, there
is an inverse relationship between quantity demand and its own price for all items under
consideration in conformity with the traditional ‘Law of Demand’. For WL model, the value of
elasticity is found to be lowest for cereals followed by salt; while it is highest in case of spices
followed by edible oils. At the same time, for AIDS model, the absolute value of price elasticities
is lowest for pulse & products while it is highest for cereals. In a nutshell, all six food items
considered in the study are highly volatile, spices being the most volatile, with respect to price
change. Any increase in food price would result in significant decrease in its demand/consumption.
Table: 2 Estimated Marshallian Own Price Elasticities of Demand
Items Average Budget Share+ (%) WL Model AIDS Model
Cereals 62.04 -0.7803** -0.8933**
Edible Oils 13.5 -0.93908** -0.8564**
Pulse &
Products 10.5 -0.86492** -0.7497**
Salt 1.2 -0.83123** -0.8347**
Spices 5.23 -1.02415** -0.8562**
Sugar 7.54 -0.87916** -0.8266**
+percentage share in the total expenditure of the six items included in the model
**Significant at 5% level of significance
4.3 Cross Price Elasticities
The sensitivity of the demand for one commodity to a change in the price of other commodities
is known as cross price elasticities. Analysis of the cross price elasticities is very useful in
determining the nature of goods and services for their substitutability and complementarity. So, an

Journal of Emerging Issues in Economics, Finance and Banking (JEIEFB) An Online International Monthly Journal (ISSN: 2306-367X)
Volume:2 No.2 August 2013
662
www.globalbizresearch.com
attempt is made here to study the nature of cross price elasticities for the six food items being
considered in the analysis. If cross elasticity for two goods are negative, they are said to be
complementary; while they may be called competitive or substitutes if they have positive cross
elasticities. The results are shown in Table 3 and Table 4 for WL and AIDS models respectively. It
is found that cross price elasticities are significantly lower than own price elasticities for all items
and the cross price elasticities of demand are all below 10 percent of the total price variation. So,
prices of other food items do not have much impact upon the demand of the commodity in question,
and hence, own price remains the main determinant of food demand in the study area.
Table: 3 Estimated Own and Cross Price Elasticities (WL Model)
Items Cereals Edible Oils Pulses Salt Spices Sugar
Cereals -0.78030** -0.00864** -0.03963** -0.02481** 0.00782** -0.02208**
Edible Oils -0.93908** 0.07714** 0.02066** 0.02112** 0.00952**
Pulse & Products -0.86492** 0.04246** -0.00789** 0.04339**
Salt -0.83123** -0.04767** 0.04637**
Spices -1.02415** 0.02278**
Sugar -0.87916**
**Significant at 5% level of significance
Table: 4 Marshallian Cross Price Elasticities, after imposing symmetric restriction ( AIDS Model)
Items Cereal Edible Oils Pulse Salt Spices Sugar
Cereal -0.0304** -0.0384** -0.0057** -0.0219** -0.0390**
Edible Oils 0.0504** -0.0063** 0.0176** 0.0311**
Pulse & Products -0.0053** 0.0153 0.0445**
Salt -0.0624** 0.0530**
Spices -0.0349**
**Significant at 5% level of significance
The above tables showed slightly different result on the nature of cross price elasticity that edible
oils are competitive with pulses, salt, spices, and sugar for WL model; while it is complementary
to salt in case of AIDS model. First, in WL model, pulses is competitive to salt and sugar; while it
is complementary with spices, and, cereal is substitute items to all other food items except sugar.
Similarly, salt is found to be complementary to spices while it is substitute with sugar, and, spices

Journal of Emerging Issues in Economics, Finance and Banking (JEIEFB) An Online International Monthly Journal (ISSN: 2306-367X)
Volume:2 No.2 August 2013
663
www.globalbizresearch.com
are complementary to sugar. Second, in AIDS model, cereal is found to be competitive with the
remaining food items, and pulse is complementary with salt; while it is competitive with salt and
sugar. Further, salt is complementary to spices; while it is competitive to sugar and spices is also
found to be competitive items to sugar.
5. Conclusion
The analysis of expenditure elasticities shows that the item groups of cereals and spices have
characteristics of normal goods whose consumption tended to increase with the increase in family
income. It may be argued that the population at lower income bracket has been stayed away from
consuming spices and even for their staple food, i.e. cereals, which have shown volatility in the
face of price rise affecting the family’s real income. This phenomenon can also be taken to reflect
the improverishment of the society which cannot afford to make certain food items universally
accessible.
All food items considered in the analysis are found to have negative own price elasticities
supporting the proposition of the traditional ‘law of demand’. The result shows that food demands
in the study area are significantly sensitive to the changes in prices that, specifically, any 10 percent
increase in food price would result in the reduction of its consumption by more than 6 percent. The
result, therefore, suggests controlling prices for food items shall have unequivocal impact upon the
standard of living, especially, of the relatively poorer sections of the society, and which will
indirectly results in the reduction of poverty ratio.
Two models, Working-Leser (WL) Model and Almost Ideal Demand System (AIDS) Model,
applied in the study to analyse food demand from household survey data have shown their own
advantages and disadvantages. As it takes into account the effects of income, prices, and other
demographic factors in estimating individual demand function, WL model shows its wide
applicability in demand analysis with impressive goodness of fit. Like any other single equation
model its estimation ensures the possibility of applying frequency weight, which is usually
generated in a systematic survey by various survey organizations. This enables us to have better
estimates even in case of small sample. However, its theoretical limitation to take into account
certain desirable properties of demand models, including adding-up, symmetry, homogeneity, etc,
impedes its wider applications in advanced empirical research. AIDS model being more flexible
nature, which satisfies all these theoretical requirements, has attracted the attentions of many
researchers. However, its inappropriateness to lend itself suitable for applying frequency weight
Journal of Emerging Issues in Economics, Finance and Banking (JEIEFB) An Online International Monthly Journal (ISSN: 2306-367X)
Volume:2 No.2 August 2013
664
www.globalbizresearch.com
usually leads the results of test for small sample size to be insignificant. Further, its computational
complicacy should have also been a serious setback for its application.
Acknowledgement
The author acknowledged the financial support of the Indian Council of Social Science Research
(ICSSR), Ministry of Human Resources, Government of India, for the study.
References
Alston, J.M, Kenneth, A.F and Green, R.D (1994), ‘Estimating Elasticities with the Linear
Approximate Almost Ideal Demand System’, Economic Letters 71: 351-56.
Asche, F. and Wessels, C.R (1997), ‘On Price Indices in the Almost Ideal Demand System’,
American Journal of Agricultural Economics, 79: 1182-85.
Baharumashah, A.Z. (1993), ‘Applying the Almost Ideal Demand Systems to Meat Expenditure
Data: Estimation and Specification Issues, Malaysian Journal of Agricultural Economics, 10.
Blundell, R., Duncan A and Pendakur, K (1998), ‘Semiparametric Estimation of Consumer
Demand’, Journal of Applied Econometrics 13: 435-461.
Blundell, R., Pashardes, P and Weber, G (1993), ‘What do we learn about consumer demand
patterns from Micro data?, American Economic Review, 83: 570-597.
Bopape, L (2006), ‘Heterogeneity of Household Food Expenditure Patterns in South Africa’,
Selected Paper prepared for presentation at the American Agricultural Economics Association
Annual Meeting, Long Beach, California, July 23-26, downloaded from
http://ageconsearch.umn.edu/bitstream/21300/1/sp06bo03.pdf on 23.08.2009.
Bryne, P., Capps, O and Saha, A (1996), ‘Analysis of Food Away from Home Expenditure Patterns
for US Households’, American Journal of Agricultural Economics, 78: 614-627.
Buse, A (1994), ‘Evaluating the Linearized Almost Ideal Demand System’, American Journal of
Agricultural Economics, 76: 781-793.
Chern, S Wen; Kimiko Ishibashi; Kiyoshi Taniguchi and Yuki Tokoyama (2002), Analysis of Food
Consumption Behaviour By Japanese Households, Food and Agriculture Organization, Working
Paper No.0206/2002, downloaded from www.fao.org/es/esa on 6.07.2007.
Chung, Rebecca; Jonq-Ying Lee, & Mark G. Brown (2002), An Engel Curve Analysis of Household
Expenditure in Taiwan: 1996-98, Economic and Market Research Department, Florida Department
of Citrus, downloaded from http://econpapers.repec.org/paper/agsfdcr05/53388.htm on 01.06.2012
Coondoo, Dipankor (1969), ‘The Effect of Relative Prices on Engel Elasticity of Cereals in India’,
Arthaniti, Vol.12.

Journal of Emerging Issues in Economics, Finance and Banking (JEIEFB) An Online International Monthly Journal (ISSN: 2306-367X)
Volume:2 No.2 August 2013
665
www.globalbizresearch.com
Deaton, A.S. (1988), ‘Quality, Quantity, and Spatial Variation of Price’, American Economic
Review, 78: 418-30.
Deaton, A.S. (1990), ‘Price Elasticities from Survey Data: Extensions and Indonesian Results’,
Journal of Ecnometrics, 44(3):281-309.
Deaton, Angus., Parikh, Kirit and Subramaniam, Shankar (1994), ‘Food Demand Pattern and
Pricing Policy in Maharashtra: An Analysis Using Household Level Survey Data’, Sarvekshana,
October-December:11-34.
Deaton, A.S. and Muellbauer, J (1980), ‘An Almost Ideal Demand System’, American Economic
Review, 70: 312-326.
Directorate of Economics & Statistics (2009), Statistical Abstract of Mizoram: 2009, Government
of Mizoram.
Erjavec, E., Mergos, G.J., Mizzi, L and Turk, J (1998), ‘Food Demand in Slovenia’, Die
Bodenkultur, 49(4), downloaded from http://www.boku.ac.at/diebodenkultur/volltexte/band-
49/heft-4/erjavec.pdf on 01.06.2012
Green, R. and Alston, J.M (1990), ‘Elasticities in AIDS Models’, American Journal of Agricultural
Economics, 72: 442-45.
Houthakker, H.S. (1952), ‘Compensated Change in Quantities and Qualities Consumed’, Review
of Economic Studies, 19: 155-64.
Houthakker, H.S (1957), ‘An International Comparison of Household Expenditure Patterns,
Commemorating the Centenary of Engel's Law’, Econometrica, 25(4): 532-551
Intrilligator, Michael., Bodkin, Ronald and Hsiao, Cheng (1996), ‘Application to Households:
Demand Analysis’, in Econometric Models, Techniques, and Applications, New Jersey; Prentice-
Hall.
Iyengar, N. Sreenivasa (1960), ‘On a Method of Computing Engel Elasticities from Concentration
Curves’, Econometrica, 28(4): 882-891.
Koc, Ali and Alpay, Savas (2000), ‘Household Demand in Turkey: An Application of Almost Ideal
Demand System With Spatial Cost Index’, Ankara, downloaded from
http://www.erf.org.eg/CMS/uploads/pdf/1185354701_FM-B_Koc_&_Alpay.pdf on 01.06.2012
Lippe, Rattiya Suddeephong and Isvilanonda, Samporn (2010), ‘Food Demand Elasticities among
Urban Households in Thailand’, Thammasat Economic Journal, 28(2): 1-29.
Leser, C.E.V. (1963) ‘Forms of Engel Functions’, Econometrica, 31: 694-703.
Journal of Emerging Issues in Economics, Finance and Banking (JEIEFB) An Online International Monthly Journal (ISSN: 2306-367X)
Volume:2 No.2 August 2013
666
www.globalbizresearch.com
Mittal, Surabhi (2006), Structural Shift in Demand for Food: Projections for 2020, Indian Council
for Research On International Economic Relations, Working Paper No. 184, downloaded from
http://dspace.cigilibrary.org on 10.01.2012.
Moschini, G. (1995), ‘Units of Measurement and the Stone Index in Demand System’, American
Journal of Agricultural Economics, 77:63-68.
Moschini, G. (1998), ‘The Semiflexible Almost Ideal Demand System’, European Economics
Review, 42: 346-64.
Mustapha, R.A. (1994), ‘Incorporating Habit in the Demand for Fish and Meat Products in
Malaysia’, Malaysian Journal of Economic Studies, 31(2): 25-35.
Pangaribowo, Evita Hanie and Tsegai, Daniel (2011), Food Demand Analysis of Indonesian
Households with Particular Attention to the Poorest, Zentrum für Entwicklungsforschung (ZEF),
downloaded from http://www.zef.de/fileadmin/webfiles/downloads/zef_dp/zef_dp_151.pdf on
1.06.2012
Planning & Programme Implementation (2011), Economic Survey Mizoram 2010-11, Government
of Mizoram.
Polaski, Sandra (2008), ‘Rising Food Prices, Poverty, and the Doha Round’, CARNEGIE,
downloaded from http://www.carnegieendowment.org/files/polaski__food_prices.pdf on
1.06.2012
Pollak, R. A. and Wales, T.J (1980), ‘Comparison of the Quadratic Expenditure System and
Translog Demand Systems with Alternative Specifications of Demographic Effects’,
Econometrica, 48: 595-612.
Pollak, R. A. and Wales, T.J (1981), ‘Demographic Variables in Demand Analysis’, Econometrica,
49: 1533-1551.
Prais, S.J. and Houthakker, H.S (1955), The Analysis of Family Budgets, Cambridge University
Press.
Prasad, A.R (2001), Consumption Behaviour in India: Theory and Evidence. Reliance Publishing
House, New Delhi.
Sinha, R.P (1966), ‘An Analysis of Food Expenditure in India’, Journal of Farm Economics,
48(1):113-123.
Stone, J. (1954), ‘Linear Expenditure Systems and Demand Analysis – An Application to the
Pattern of British Demand, Economic Journal, 64:511-27.
Journal of Emerging Issues in Economics, Finance and Banking (JEIEFB) An Online International Monthly Journal (ISSN: 2306-367X)
Volume:2 No.2 August 2013
667
www.globalbizresearch.com
Thanga, L.T, James (2010), Consumer Behaviour in North-East India, Anshah Publishing House,
New Delhi, 2010.
Tey, Yeong-Sheng, Shamsudin, et. al (2008), Demand Analysis of Food in Malaysia: Effects of
Model Specifications and Demographic Variables, MPRA, downloaded from http://mpra.ub.uni-
muenchen.de/15063/ on 10.01.2012.
Theil, H. (1965), ‘The Information Approach to Demand Analysis’, Econometrica, 33:67-87.
Wadud, Md Abdul (2006), ‘Analysis of Meat Demand in Bangladesh Using Almost Ideal Demand
System’, The Empirical Economics Letter, 5(1); 29-35.
Working, H. (1943), ‘Statistical Laws of Family Expenditure’, Journal of the American Statistical
Association, 38:257-74.