Canonical Correlation Analysis to relate a Genomic Dataset ...

Robust Canonical Correlation Analysis:MCD Approach
Muthukrishnan.R1 and Thanga malar.K2
1,2Department of Statistics,Bharathiar University,
Coimbatore, Tamil Nadu, [email protected],
Abstract
Canonical Correlation Analysis (CCA) is an exploratory statistical methodto highlight correlation between two data sets acquired on the same experi-mental units. The objective is to find linear combination of the variables ineach data set having maximal correlation. Its standard computation is basedon sample covariance matrices, which are however very sensitive to outlyingobservations. There is a need to find alternative which can tolerate the ex-treme observations. In this context, a new procedure has been introduced inthis paper, namely robust canonical correlation analysis (RCCA). The pro-posed method uses the MCD procedure to find the covariance matrix insteadof conventional sample covariance matrix while performing CCA. Further, thesuperiority of the proposed procedure, RCCA is demonstrated with conven-tional CCA under real environment.
Key Words: Canonical correlation; CCA; MCD; RCCA.
1 Introduction
Canonical correlation analysis (CCA) is a strong statistical tool quantifying cor-relations between two sets of multidimensional variables. The method of data reduc-tion which helps to understand composite relationships among sets of variables froma broad range of applied field [4]. The canonical coefficients, variates, and correla-tions are estimated by taking the sample covariances and computing the eigenvaluesand eigenvectors of the matrices. The influence functions of the essential param-eters in canonical variates analysis and to compute eigenvectors and eigenvaluesbased on the sample covariance matrices derived [8]. An observable approach to
International Journal of Pure and Applied MathematicsVolume 117 No. 14 2017, 9-17ISSN: 1311-8080 (printed version); ISSN: 1314-3395 (on-line version)url: http://www.ijpam.euSpecial Issue ijpam.eu
9

robust canonical correlation analysis (RCCA) is to estimate the population covari-ance matrix based on robust procedures. Kernel [6] took an M-estimator as robustestimator of covariance matrices. However, it has inadequate robustness propertiesin higher dimensions. The high breakdown point of MCD estimator [3]. Distribu-tion properties for CCA based on robust estimates of the covariance matrix havebeen studied by Taskinen [11]. CCA cannot detect nonlinear relationship, and it isprecious to derive canonical variates for high-dimensional data.
The paper is organized as follows: The concept of CCA and RCCA is described insection 2. Section 3 presents results of the comparative study of these two procedureswith numerical examples. The last section ends with conclusion.
2 Canonical Corrleation Analysis Procedures
2.1 Conventional Approach
Canonical correlation analysis (CCA) is a method used for measuring the linearrelationship between two multidimensional variables which was introduced [7]. Thegoal of CCA is to recognize and measure the relations between the mean vector andcovariance matrices for two sets of variables X and Y . Let, X is a p-dimensionalrandom variable; Y is a q-dimensional random variable and is assumed that p ≤ q.The mean and covariance are respectively given by
E(X) = µX , E(Y ) = µY , COV (X) = ΣXX , COV (Y ) = ΣY Y andCOV (X, Y ) = EXY = Σ′Y Y
the covariance matrix between X and Y is Σ =
(ΣXX ΣXY
ΣXY ΣY Y
)Where ΣXX and
ΣY Y are non- singular. Consider two linear combinations of two sets of X and Y ,respectively such that,
X′
= α′X = α1X1 + α2X2 + · · · + αpXpandY
′= β
′Y = β1X1 + β2Y2 + · · · + βpYp (1)
then V (α′X) = α
′ΣXXα,V (β
′Y ) = β
′ΣY Y β, COV (X
′,′) = α
′ΣXY β and the corre-
lation coefficient is
ρ(α, β) = arg maxα,β
Corr(α′X, β
′Y ) (2)
The objective of canonical correlations analysis is to find ρ(α, β) is maximum, thencalculate U = α′X and V = β
′Y , called the canonical variates and they can be
used for dimension reduction and graphical display.
2.2 Minimum Covariance Determinant Approach
The Minimum Covariance Determinant (MCD) estimator is one of the first affineequivariant and highly robust estimators of multivariate location and scatter [8].Consider subsets from the half set of observation. It gives the minimum value of thedeterminant of the variance-covariance matrix. The resulting estimate of locationis the sample mean vector and dispersion is the sample variance-covariance matrixof the points multiplied by an appropriate constant to ensure consistency. The
International Journal of Pure and Applied Mathematics Special Issue
10

MCD estimator is obtained by looking for that subset of size h of the data whichhas h ∼ n
2. The resulting estimator is then nothing else but the covariance matrix
computed over that optimal subset. A capable algorithm for computing the MCDestimator [9], in order to increase the efficiency of high robustness of reweightedestimators. The mean vector and covariance is defined and denoted by
µ̂ =Σni=1WiXi
Σni=1Wi
and Σ0 = C1Σni=1Wi(Xi − µ)((Xi − µ)
′
Σni=1Wi
(3)
where, Wi is appropriate weight function and C1 is constant, a consistency factor.After computing location and scale estimator by using MCD. In the usual procedure,the classical mean vector and covariance matrix is replaced by mean vector andcovariance matrix which is obtained by the equation 3, and then proceed to performRCCA with the usual steps which as in CCA.
3 Numerical Study
3.1 Example 1
To study the performance of CCA and RCCA a real dataset which consists oftwo groups, namely, psychological variables (Y ) and academic variables (X), eachwith 600 observations (Source: Freshman dataset, (Mark Silverberg (2015), UCLA)were considered. The first group of psychological variables Y are locus of control(y1), self motivation (y2) and stimulus (y3). The second group of variables X arestandardised tests in reading (x1), writing (x2), maths (x3) and science (x4). Further,the categorical variable gender was excluded from the analysis part. The canonicalcorrelation coefficients were computed by conventional and robust approach andare displayed in the table 1. Further the extreme observations are identified byusing one of the outlier detection techniques namely, distance-distance plot. Thesame experiment was performed after discarding the extreme observations and thusobtained results are displayed in the table 1.
Table:1 Estimated Canonical Correlation CoefficientMethod With outlier Without outlierCCA 0.4464 0.4545
RCCAMCD 0.4570 0.4594
It is observed that the estimated canonical coefficients are almost similar byrobust approach under with and without outliers. It is concluded that the conven-tional procedure get affected when outlying observations are present in the data.The relationship among the variables of the two datasets in the context of canonicalcorrelation plots are summarised in the figure 1.
The conventional CCA plot indicates that the variable, science is not an impor-tant variable and write variable is related with motivation. Further, it is noted thatthe write variable is not closed to the motivation variable, since ρ value is affectedby the outlier. But it is very close under with and without outlier in the case ofRCCA. The other results, such as canonical cross loading, redundancy analysis, etcare summarised and is given in appendix. Table 1.3 indicates that the variables
International Journal of Pure and Applied Mathematics Special Issue
11

Figure 1: Canonical Correlation Plots
y1, y2 and y3 explained the variables x1, x2 and x3 are 12%/14% in classical CCA,RCCA approach explains 14%/14% under with/without outliers.
3.2 Example 2
To illustrate the performance of RCCA, another experiment was carried out byusing the real data set (William D. Rohwer). The data description is as follows:The performance of kindergarten children a set of paired-associate (PA) tasks canmeasures of aptitude and achievement. The first set, performance in a PA tasksare denoted as variables X, which are named still (x1), named action (x2) andsentence still (x3). The second set, score on a test are denoted as variables Y , whichare student achievement test (y1), Peabody picture vocabulary test (y2) and Ravenprogressive matrices test (y3). The computed canonical correlation under CCA andRCCA is displayed in the table 2. Further the extreme observations are identifiedby using one of the outlier detection techniques namely, distance-distance plot. Thesame experiment was performed after discarding the extreme observations and thusobtained results are displayed in the table 2.
Table:2 Estimated Canonical Correlation CoefficientMethod With outlier Without outlierCCA 0.6385 0.6724
RCCAMCD 0.6795 0.6780
It is observed that the estimated canonical coefficients are almost similar byrobust approach under with and without outliers. It is concluded that the conven-tional procedure get affected when outlying observations are present in the data.The relationship among the variables of the two datasets in the context of canonicalcorrelation plots are summarised in the figure 2.
The conventional CCA plot indicates that the variable named still (ns) is relatedbut variable student achievement test (SAT) cant have the independent variable.
International Journal of Pure and Applied Mathematics Special Issue
12
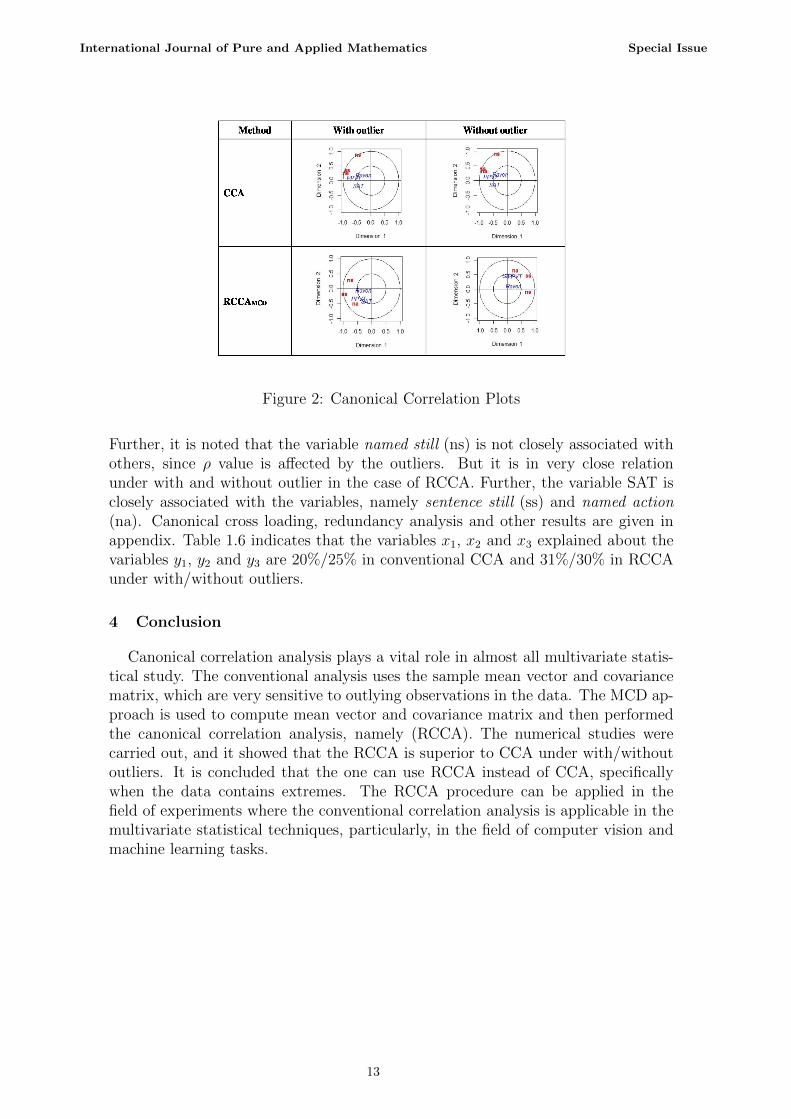
Figure 2: Canonical Correlation Plots
Further, it is noted that the variable named still (ns) is not closely associated withothers, since ρ value is affected by the outliers. But it is in very close relationunder with and without outlier in the case of RCCA. Further, the variable SAT isclosely associated with the variables, namely sentence still (ss) and named action(na). Canonical cross loading, redundancy analysis and other results are given inappendix. Table 1.6 indicates that the variables x1, x2 and x3 explained about thevariables y1, y2 and y3 are 20%/25% in conventional CCA and 31%/30% in RCCAunder with/without outliers.
4 Conclusion
Canonical correlation analysis plays a vital role in almost all multivariate statis-tical study. The conventional analysis uses the sample mean vector and covariancematrix, which are very sensitive to outlying observations in the data. The MCD ap-proach is used to compute mean vector and covariance matrix and then performedthe canonical correlation analysis, namely (RCCA). The numerical studies werecarried out, and it showed that the RCCA is superior to CCA under with/withoutoutliers. It is concluded that the one can use RCCA instead of CCA, specificallywhen the data contains extremes. The RCCA procedure can be applied in thefield of experiments where the conventional correlation analysis is applicable in themultivariate statistical techniques, particularly, in the field of computer vision andmachine learning tasks.
International Journal of Pure and Applied Mathematics Special Issue
13

References
[1] A. Alkenani and K. Yu, A Comparative Study for Robust Canonical CorrelationMethods, Journal of Statistical Computation and Simulation, 83(4) (2013),692-720.
[2] J.A. Branco, C. Croux, P. Filzmoser, and M.R. Olivera, Robust CanonicalCorrelations: A Comparative Study, Computational Statistics, 20 (2), (2005),203-229.
[3] C. Croux, and G. Haesbroeck, Influence Function and Efficiency of the Mini-mum Covariance Determinant Scatter Matrix Estimator, Journal of Multivari-ate Analysis, 71, (1999), 161-190.
[4] S. Das, and P.K. Sen, Canonical correlations. In: P. Armitage and T. Colton(eds.), Encyclopedia of Biostatistics, 1, (1998), 468-482.
[5] C. Dehon, P. Filzmoser, and C. Croux, Robust Methods for Canonical Cor-relation Analysis, Data analysis, Classification and Related Methods (2000),321-326.
[6] G. Karnel, Robust canonical correlation and correspondence analysis. In: TheFrontiers of Statistical Scientific and Industrial Applications, The First Interna-tional Conference on Statistical Computing, American Sciences Press, 2 (1991),415-420.
[7] H. Hotelling, Relations between Two Sets of Variates, Biometrika, 28 (1936),321-377.
[8] S. Romanazzi, Influence in canonical correlation, Psychometrika, 57 (1992),237-259.
[9] P.J. Rousseeuw, Multivariate Estimation with High Breakdown Point, In Math-ematical Statistics and Applications, (1985), 283-297.
[10] P.J. Rousseeuw, and K.V. Driessen, A Fast Algorithm for the Minimum Co-variance Determinant Estimator, Technometrics, 41,(1999), 212-223.
[11] S. Taskinen, C. Croux, A. Kankainen, E. Ollila, and H. Oja, Canonical analysisbased on scatter matrices. Manuscript, (2003).
International Journal of Pure and Applied Mathematics Special Issue
14

Appendix:
International Journal of Pure and Applied Mathematics Special Issue
15

International Journal of Pure and Applied Mathematics Special Issue
16

17

18