FOOD DESERT VERSUS FOOD OASIS: AN EXPLORATION OF …
166
FOOD DESERT VERSUS FOOD OASIS: AN EXPLORATION OF RESIDENTS’ PERCEPTIONS OF FACTORS INFLUENCING FOOD BUYING PRACTICES by Renee Erin Walker BA, Biology, Lake Forest College, 1998 MPH, Drexel University, 2005 Submitted to the Graduate Faculty of the Graduate School of Public Health in partial fulfillment of the requirements for the degree of Doctor of Public Health University of Pittsburgh 2009
Transcript of FOOD DESERT VERSUS FOOD OASIS: AN EXPLORATION OF …

FOOD DESERT VERSUS FOOD OASIS: AN EXPLORATION OF RESIDENTS’
PERCEPTIONS OF FACTORS INFLUENCING FOOD BUYING PRACTICES
by
Renee Erin Walker
BA, Biology, Lake Forest College, 1998
MPH, Drexel University, 2005
Submitted to the Graduate Faculty of
the Graduate School of Public Health in partial fulfillment
of the requirements for the degree of
Doctor of Public Health
University of Pittsburgh
2009

ii
UNIVERSITY OF PITTSBURGH
Graduate School of Public Health
This dissertation was presented
by
Renee Erin Walker
It was defended on
June 16, 2009
and approved by
Dissertation Advisor: Jessica G. Burke, PhD, MHS
Assistant Professor Department of Behavioral and Community Health Sciences
Graduate School of Public Health University of Pittsburgh
Committee Member:
James Butler, MEd, DrPH Assistant Professor
Department of Behavioral and Community Health Sciences Graduate School of Public Health
University of Pittsburgh
Committee Member: Craig Fryer, DrPH Assistant Professor
Department of Behavioral and Community Health Sciences Graduate School of Public Health
University of Pittsburgh
Committee Member: Christopher Keane, ScD, MPH
Assistant Professor Department of Behavioral and Community Health Sciences
Graduate School of Public Health University of Pittsburgh
Committee Member:
Andrea Kriska, PhD, MS Associate Professor
Department of Epidemiology Graduate School of Public Health
University of Pittsburgh

iii
Copyright © by Renee Erin Walker

iv
Jessica G. Burke, PhD, MHS
FOOD DESERT VERSUS FOOD OASIS: AN EXPLORATION OF RESIDENTS’ PERCEPTIONS OF FACTORS INFLUENCING FOOD BUYING PRACTICES
Renee E. Walker, DrPH
University of Pittsburgh, 2009
Utilizing concept mapping, the primary goal of this dissertation research was to explore
the range of factors that influence food buying practices. A total of twenty five participants from
two low-income zip codes in Pittsburgh, PA completed the concept mapping process. The
participants were recruited based on residential proximity to a supermarket.
This dissertation is organized around the presentation of three manuscripts. The first
manuscript presents an exhaustive review of the literature related to food deserts. The research
presented in manuscript two identified perceptions of factors influencing food buying practices
among residents of an urban food desert (n=12) compared to a food oasis (n=13). Results
identified 121 unique statements that were grouped by participants into 12 clusters, or unique
concepts. Analyses show that overall, the average cluster ratings for residents of the food desert
were higher than residents of the food oasis.
Research presented in manuscript three addressed how residents’ perceptions of factors
influencing food buying practices differ by food security status. Findings show that food
insecure participants rated clusters higher than food secure participants. A secondary aim was to
explore how important these factors are to hindering healthy eating based on food desert and
food security statuses. Overall, cluster rankings were similar for food secure participants in a
food desert and food secure participants in a food oasis. However, participants in the food desert
rated all of the clusters higher than participants in the food oasis. In comparing food insecure

v
participants in a food desert to a food oasis, findings show that although cluster rankings were
different, average cluster ratings were similar.
The public health significance of this study is that it contributes to our understanding of
factors that influence food buying practices based on neighborhood and individual-level
characteristics, an area that has received limited consideration. Based on findings from this
research, areas for future research, and policy and program development have been uncovered to
address the lack of access to healthy foods for urban residents of low-income areas.

vi
TABLE OF CONTENTS
ACKNOWLEDGEMENTS ........................................................................................................... xi
1.0 CHAPTER ONE: INTRODUCTION .......................................................................................1
1.1 Statement of the Problem ..............................................................................................1
1.2 Research Questions .......................................................................................................5
1.3 Dissertation Organization .............................................................................................6
2.0 CHAPTER TWO: MANUSCRIPT ONE .................................................................................8
2.1 Abstract .........................................................................................................................9
2.2 Introduction .................................................................................................................10
2.3 Article Results .............................................................................................................18
2.3.1 Access to Supermarkets ...............................................................................18
2.3.2 Racial/Ethnic Disparities in Food Deserts ...................................................19
2.3.3 Socioeconomic Status in Food Deserts ........................................................21
2.3.4 Differences in Chain Versus Non-chain Stores ...........................................22
2.4 Discussion ...................................................................................................................23
3.0 CHAPTER THREE: METHODS ..........................................................................................27
3.1 Identification of Focal Areas ......................................................................................27
3.2 Recruitment .................................................................................................................31
3.3 Data Collection ...........................................................................................................32
3.3.1 Generation of Statements/Brainstorming .....................................................34
3.3.2 Administration of Questionnaires/Structuring & Representation ................36
3.3.3 Interpretation & Utilization of Maps ...........................................................43
3.4 Data Analysis ..............................................................................................................45
3.4.1 Pattern Match ...............................................................................................49
3.4.2 Go-zone ........................................................................................................50
4.0 CHAPTER FOUR: MANUSCRIPT TWO .............................................................................52
4.1 Abstract .......................................................................................................................53
4.2 Introduction .................................................................................................................54
4.3 Methods.......................................................................................................................56

vii
4.3.1 Recruitment ..................................................................................................57
4.3.2 Concept Mapping Methodology ..................................................................58
4.4 Data Analysis ..............................................................................................................60
4.5 Results .........................................................................................................................61
4.5.1 Participant Characteristics ...........................................................................61
4.5.2 Average Cluster and Statement Ratings ......................................................65
4.5.3 Cluster Interpretation ...................................................................................74
4.6 Discussion ...................................................................................................................77
5.0 CHAPTER FIVE: MANUSCRIPT THREE ..........................................................................84
5.1 Abstract .......................................................................................................................85
5.2 Introduction .................................................................................................................86
5.3 Methods.......................................................................................................................88
5.3.1 Recruitment ..................................................................................................89
5.3.2 Concept Mapping Methodology ..................................................................90
5.4 Data Analysis ..............................................................................................................93
5.5 Results .........................................................................................................................94
5.5.1 Participant Characteristics ...........................................................................94
5.5.2 Cluster Ratings .............................................................................................95
5.5.3 Differences in Cluster Ratings .....................................................................99
5.5.4 Cluster Interpretation .................................................................................100
5.5.5 Secondary Aim: Exploring the Discordant Pairs .......................................102
5.6 Discussion .................................................................................................................108
6.0 CHAPTER SIX: DISCUSSION ..........................................................................................114
6.1 Manuscript One ........................................................................................................114
6.2 Manuscript Two ........................................................................................................116
6.3 Manuscript Three ......................................................................................................120
6.4 Methodological Limitations ......................................................................................123
6.4.1 Sample size ................................................................................................123
6.4.2 Sampling technique ....................................................................................123
6.4.3 Definition of a Food Desert .......................................................................124
6.4.4 Concept Mapping Process..........................................................................124

viii
6.5 Concept Mapping and Theory Development ............................................................126
6.6 Policy Implications ...................................................................................................127
6.7 Future Research ........................................................................................................129
6.8 Conclusions ...............................................................................................................130
APPENDICES ............................................................................................................................132
Appendix A: Recruitment Flyer...................................................................................................132
Appendix B: Zip code 15207 statement list .................................................................................133
Appendix C: Zip code 15201 statement list .................................................................................135
Appendix D: Master list with statement numbers ........................................................................137
Appendix E: Participant Questions ..............................................................................................139
Appendix F: USDA Food Security Scale ....................................................................................142
Appendix G: Statements grouped by cluster ...............................................................................143
Appendix H: Participant Demographics ......................................................................................145
BIBLIOGRAPHY .......................................................................................................................146

ix
LIST OF TABLES
Table 2.1 Review articles with measures used……………………………………….. 14
Table 2.2 Article summaries by food desert category………………………………... 15
Table 3.1 Characteristics of selected zip codes………………………………………..30
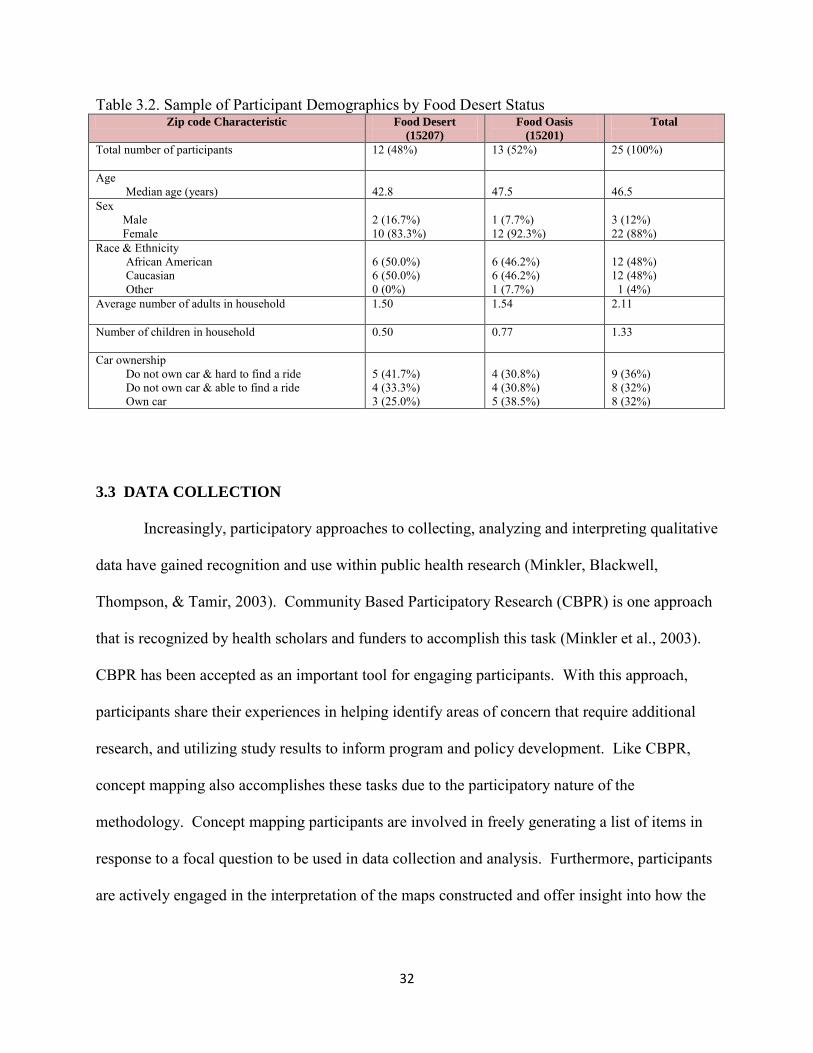
Table 3.2 Sample of participant demographics by food desert status………… ……... 32
Table 3.3 Focus statement and definitions……………………………………………. 35
Table 3.4 Rating statements and rating scales………………………………………... 39
Table 3.5 Cluster labels for a 9-cluster solution map………………………………… 42
Table 3.6 Clusters selected for interpretation and instructions for interpretation…….. 44
Table 3.7 Average bridging values for a 12-cluster solution map……………………. 47
Table 4.1 Participant characteristics by food desert status…………………………….62
Table 4.2 Cluster labels for a 12-cluster solution map……………………………….. 64
Table 4.3 Average cluster and statement ratings by food desert status………………. 67
Table 5.1 USDA Food Security Scale………………………………………………... 92
Table 5.2 Participant characteristics by food security status…………………………. 95
Table 5.3 Average cluster ratings by food security status……………………………. 96
Table 5.4 Average statement ratings for the cluster Concerns About the Stores……...100
Table 5.5 Relationship of cluster rankings and ratings for results of secondary aim….106
Table 5.6 Average cluster ratings and importance for Hindering Healthy Eating…….108

x
LIST OF FIGURES
Figure 3.1 Map of Pittsburgh with selected zip codes highlighted……………………. 29
Figure 3.2 Point map for the 121 unique statement…………………………………… 41
Figure 3.3 Cluster point map with 9 clusters…………………………………………...41
Figure 3.4 Final 12-cluster solution map……………………………………………….45
Figure 3.5 Spanning analysis of statement within the cluster Making Ends Meet…………………………………………………………. 46
Figure 3.6 Example of a highly bridged cluster……………………………………….. 48
Figure 3.7 Example of a highly anchored cluster……………………………………… 49
Figure 3.8 Example of a pattern match………………………………………………... 50
Figure 3.9 Example of a go-zone for the cluster Budgeting…………………………... 51
Figure 4.1 Point cluster map for 12 clusters…………………………………………… 64
Figure 4.2 Pattern match comparing factors that influence food buying practices between food desert and food oasis participants……………………………72 Figure 5.1 Pattern match comparing factors that hinder healthy eating for food secure and food insecure participants……………………………………… 98 Figure 5.2 Pattern match comparing food secure participants in a food desert to food secure participants in a food oasis…………………………………. 103 Figure 5.3 Pattern match comparing food insecure participants in a food desert to food insecure participants in a food oasis……………………………….. 105

xi
ACKNOWLEDGEMENTS
I have been on what seemed like a never-ending journey. It has been a long process filled
with ups and downs, victories and setbacks, rewards and disappointments. There are so many
people I want to acknowledge for their role in molding me into the person I am today-for their
unwavering love and support through this process. First and foremost I want to thank God for
the many opportunities I have been afforded and for seeing me through some difficult times. For
every mountain You've brought me over. For every trial You've seen me through. For every
blessing, hallelujah; for this I give You praise.
To my amazing family, my parents, Robert and Rosemary Walker, I could not have done
this without you. You paid my bills when I could not. You paid my rent when I was about to be
evicted. You bought a new car when I was walking. You paid tuition and funded my
dissertation when I exhausted every resource. You loved me when I didn’t deserve it. You
believed in me when nobody else did. You have wiped away many tears and always convinced
me that I could do anything. Thank you for your unconditional love and support. I love you
both. To my sister, Rhonda and my brother, Robert Erik, you two have encouraged me over the
years and have provided undying support. Thank you for listening to all of my school-related
stories when I’m sure you had no idea what I was talking about. To my grandmother, Johnnie
Jenkins, my aunts: Dorothy Watson, Grace Grayson, Yvette Gary, Yvonne Parker, and Beverly
Greene, uncles and cousins, thank you for words of wisdom, monetary gifts, encouraging words
and support. I share this accomplishment with you for I could not have done it without you.
You mean the world to me! To David Justin and Reese Erika, the bar has been set. You are
destined to accomplish great things in your lives. You have an amazing family that serves as the
village. You are in the world to change the world. I love you both!

xii
To my friends who have put up with my complaints and encouraged me to stay focused
when I wanted to quit: Jennifer Smith, Tiffani Helberg, Jason Neal, Melanie Gordon, Loria
Awadallah and Michael McLeod. I owe you! Thanks a bunch. To my GSPH classmates,
LaShawn Curtis, thank you for your guidance and support; Tina Bhargava, Chongyi Wei and
Luis Duran, thank you for the mental health breaks in the form of dinner parties and post-exam
celebrations. To Dr. Jobe Payne, can you believe it has been 11 years?!?! You were there in the
beginning and never left my side. I can’t thank you enough for going through this journey with
me . . . and for the countless letters of reference! Dr. Tina Harralson, thank you for hiring me
when I was broke, for the opportunity to learn from you at CUHPR and for the many letters of
recommendation. You have truly been an inspiration. I want to be like you when I grow up!
I want to thank the participants of this dissertation research for their perspectives. To the
staff at the Hazelwood YMCA and the staff at the Lawrenceville Public Library, thank you for
accommodating our group sessions. I really appreciate your kindness. To Jamie Bialor, thank
you for your help with the CM sessions.
Lastly, to the greatest dissertation committee, my dissertation chair, Dr. Jessica Burke, I
can’t thank you enough for all you have done for me professionally and personally. You have
had my back when things started to go awry; you always found a way to calm me down when I
became frantic. Thank you. You have been an advisor, a mentor and a friend. I am so thankful
for the many ways you have impacted my life and career. To my committee members, Drs.
James Butler, Craig Fryer, Christopher Keane, and Andrea Kriska, thank you for your expertise
and for helping me get through this process. It has been an honor working with you and I hope
to have the opportunity to work with you again.

1
1.0 CHAPTER 1. INTRODUCTION Little is known about the range of factors that influence food buying practices among
low-income individuals. A variety of factors including cultural, economical, individual and
environmental are believed to play a role in food buying practices. The extent to which these
factors influence food buying practices, and subsequently healthy eating, is unknown. Exploring
the role these factors have in influencing food buying practices will assist in the development of
effective programs and policies focusing on increasing healthy eating. Furthermore,
understanding these factors will offer insight into decreasing rates of chronic disease with diet as
a risk factor and adverse health outcomes such as obesity.
1.1 Statement of the Problem
An extensive body of literature has been generated focusing on the importance of
consuming fresh fruits and vegetables. Four of the ten leading causes of death in the United
States (US) are chronic conditions for which diet is a major risk factor ("U.S. Department of
Health and Human Services, Centers for Disease Control and Prevention, National Center for
Chronic Disease Prevention and Health Promotion," 2008). It is widely accepted that consuming
fruits and vegetables can lower risks associated with cardiovascular disease, diabetes, certain
types of cancers, and being overweight and obese (Hendrickson, Smith, & Eikenberry, 2006;
Lewis, Sloane, Nascimento, Diamant, Guinyard, Yancey et al., 2005; Winkler, Turrell, &
Patterson, 2006; Zenk, Schulz, Israel, James, Bao, & Wilson, 2005). Similarly, it is documented
that a diet filled with processed foods, frequently containing high contents of fat, sugar and
sodium, often lead to poorer health outcomes compared to a diet high in complex carbohydrates

2
and fiber (Block, Scribner, & DeSalvo, 2004; Lewis et al., 2005; "Mari Gallagher Research &
Consulting Group. 2006.,"; Swinburn, Caterson, Seidell, & James, 2004).
As a result, it is recommended by dieticians and other healthcare providers that fresh
fruits and vegetables be consumed to maintain a proper, balanced diet. Dieticians and healthcare
providers are fighting an uphill battle given the tactics associated with food marketing that
appeals to the consumer’s desire to obtain familiar, easily prepared and tasty food (Chambers,
2007). This is illustrated in the budget allotted the food industry for food advertising.
Approximately 20 times the United States Department of Agriculture (USDA) education
expenditure is devoted to advertising, primarily in the form of promoting processed and
packaged foods (Gallo, 1999). To help counter the adverse affects caused by food marketing,
dietary guidelines have been encouraged to promote the consumption of fruits and vegetables.
According to the Dietary Guidelines for Americans, 2005, a joint report by the US Department
of Health and Human Services (HHS) and the US Department of Agriculture (USDA), 4-5 daily
servings of both fruits and vegetables are recommended to promote health and minimize the risk
of chronic diseases ("Dietary Guidelines for Americans, 2005,"). Unfortunately, there are people
who are not able to access such foods readily due to various individual, economic, and
environmental factors.
Individual factors include the lack of transportation needed to get to supermarkets and the
ability to transport groceries safely. Transportation-related concerns include the lack of a
personal vehicle, reliance on infrequent bus times, and inadequate bus routes associated with
public transportation (Kimberly Morland, Wing, Roux, & Poole, 2002b). Economic factors
pertain to the cost of purchasing healthy and nutritious foods that studies report are more
expensive than eating less healthy foods high in fat (Chung & Myers, 1999; Hendrickson et al.,

3
2006). Environmental factors involve the built environment and where people live. Residing in
a neighborhood that does not have a supermarket, referred to in the literature as a food desert,
poses another challenge to accessing healthy and nutritious foods (Giang, Karpyn, Laurison,
Hillier, & Perry, 2008; Inagami, Cohen, Finch, & Asch, 2006). These factors can lead to barriers
to healthy eating, especially for low-income residents. Oftentimes, this inaccessibility leads to
hunger, malnutrition and poor health (Bhattacharya, Currie, & Haider, 2004).
In 2003, 66% of adults in the US were overweight or obese ("National Center for Health
Statistics, 2003-2004,"). Poor health stemming from consequences associated with overweight
and obesity is becoming more common in the U.S. (Block et al., 2004). For example, the
number of overweight adults at increased risk for chronic diseases has increased dramatically,
particularly since 1990 (Flegal, Carrol, Kuczmarski, & Johnson, 1998). This finding in
conjunction with relevant research on the topic suggests that environment may be more
important in addressing the rates of overweight and obesity than genetics (Birch & Davison,
2001; Campfield & Smith, 1999; Jebb, 1997). As a result, the neighborhood food environment is
crucial to understanding food buying and healthy eating practices due to the convenience
afforded residents (Lewis et al., 2005; Pollard, Kirk, & Cade, 2002). There are challenges to
shopping locally that include higher prices than at chain supermarkets (Philip R. Kaufman,
MacDonald, Lutz, & Smallwood, 1997), diminished quantity of foods, and poorer quality of food
items (Hendrickson et al., 2006). To counter the adverse affects caused by the lack of an
adequate diet, it is important to understand factors that influence food buying practices given the
context in which people live. These factors, which have been poorly studied to date, do not take
into account neighborhood-level characteristics such as differences in supermarket access or
individual-level characteristics such as household food security.

4
In order to address this complex topic, an ecological approach must be taken. An
ecological approach takes into account that individuals are not only influenced by physical
environment (e.g., geography) and social environment (e.g., culture, economic), but also
personal factors including behavioral and psychological disposition (Stokols, 1992). An
understanding of the interplay between behavioral, environmental, and personal factors that
influence an individual is imperative to address concerns related to food buying practices and
the promotion of healthy eating.
An ecological approach assumes that optimal health outcomes will result when
coordination occurs at different levels. These levels include the individual, interpersonal,
organizational/institutional, community, and policy levels (Stokols, 1992; Yoo, Weed, Lempa,
Mbondo, Shada, & Goodman, 2004). The individual level targets individual perceptions,
attitudes, beliefs and values about healthy eating; interpersonal level focuses on social networks
such as family members and friends who influence the individual; organizational/institutional
level targets the food purveyors including supermarkets, convenience stores and restaurants; at
the community level is a focus on community organizations that provide services such as soup
kitchens and food pantries; and the policy level targets policy makers and public health officials
who are instrumental in policy and program development. Utilizing an ecological approach
highlights the importance of a multifaceted examination of food buying practices and subsequent
healthy eating that requires an interdisciplinary team of professionals to address.

5
1.2 Research Questions
The primary goal of this study is to explore the range of factors that influence food
buying and healthy eating practices. Specifically, this research seeks to understand the factors
that influence food buying practices among residents living in a low-income food desert
compared to residents living in a low-income food oasis. A second goal of the study is to
explore the association between food security and food desert statuses. Food security is a
household measure of hunger assessed annually in the U.S. by the United States Department of
Agriculture. Literature searches revealed no previous research on this topic. Understanding
residents’ perceptions will offer insight into factors that influence buying practices and
facilitators and barriers to healthy eating. Specifically, the two research questions that will be
answered are:
1. What are perceptions of factors influencing food buying practices among residents of
an urban food desert and residents of an urban food oasis?
2. How do residents’ perceptions of factors influencing food buying practices differ by
food security status?
a. A secondary aim is to explore how residents’ perceptions of factors
influencing food buying practices differ by both food security and food desert
status.
While there is ongoing debate about the definition of a food desert (Hendrickson et al.,
2006; Raja, Ma, & Yadav, 2008), for the purpose of this study, a food desert is defined as a
geographic area that does not have a large chain supermarket within 0.5 miles from the zip code

6
centroid, the center of the defined area identified by latitude and longitude coordinates. A
distance of 0.5 miles is consistent with the literature that defines food deserts in terms of time
required to walk a distance to the nearest supermarket. It is suggested that an approximate one-
way walking time in excess of 15 minutes for an adult in an urban area is a proxy for a food
desert (Apparicio, Cloutier, & Shearmur, 2007). In Pittsburgh, examples of large supermarkets
include Giant Eagle, Shop ‘N Save, and Save-A-Lot. A food oasis will be used to describe a
geographic area that contains a supermarket within 0.5 miles of the center of the zip code.
Specifics regarding the operationalization of this definition can be found in Chapter 3, which
provides details about the research methods.
1.3 Dissertation organization
This dissertation is based on the three manuscript format and is organized into six
chapters. This chapter provided a statement of the problem and introduced the research
questions to be addressed. Chapter 2 presents a literature review on food deserts in the United
States. Measured variables were grouped into constructs to help orient the reader to how the
topic is conceptualized in the literature. Chapter 3 is a description of the methods used for the
dissertation research. This chapter explains in detail how the areas selected in the study were
identified, the process of recruitment, and data collection and data analysis procedures for each
manuscript. Chapter 4 is a concept mapping results oriented manuscript exploring factor
influencing food buying practices among residents of a food desert compared to a food oasis.
Chapter 5 is also a concept mapping results oriented manuscript, but it focuses on presenting the
results of analyses comparing factors that influence food buying practices among food secure
and food insecure households. A discussion of the results, policy implications and future

7
research is presented in Chapter 7. Following these chapters is an appendix that includes
questionnaires and other relevant materials that were used in the concept mapping sessions.
The goal of manuscript one was to provide a comprehensive literature review of
empirical studies conducted in the United States on food deserts. This manuscript summarizes
the constructs that have been studied in this area and concludes with a discussion outlining gaps
in the literature and areas for future research.
Manuscript One
Concept mapping is a participatory research method that has received increased
recognition as a research tool for hypotheses generation and theory development. Manuscript
two used the concept mappping results to explore factors that influence food buying practices
among residents of a food desert compared to residents of a food oasis. This manuscript
identifies factors, how they are related and their role in influencing food buying practices.
Manuscript Two
Manuscript three sought to explore factors that hinder healthy eating in food secure
households compared to food insecure households. Using concept mapping these factors were
identified and the relationship between them was explored. A secondary aim of this manuscript
was to explore how strongly factors that influence food buying practices hinder healthy eating
based on food security and food desert statuses.
Manuscript Three

8
2.0 CHAPTER TWO: MANUSCRIPT ONE
DISPARITIES AND ACCESS TO HEALTHY FOOD IN THE UNITED STATES:
A REVIEW OF FOOD DESERTS LITERATURE
Renee E. Walker, M.P.H.
University of Pittsburgh
Graduate School of Public Health
Department of Behavioral and Community Health Sciences
Pittsburgh, PA

9
2.1 ABSTRACT
Increasingly, studies are focusing on the role the local food environment plays in
residents’ ability to purchase affordable, healthy and nutritious foods. Studies that explore
differences in neighborhoods that have access to a supermarket and neighborhoods that lack a
supermarket focus on a limited number of factors including cost, access, and location (urban
versus rural and/or suburban), and the implications these factors have for impacting healthy
eating and health outcomes. Yet, there is little known about additional factors, namely factors
that influence food buying practices, within these areas with different supermarket access. The
goal of this paper is to identify existing studies that have focused on food deserts in the United
States. This paper provides a brief overview of the research that has focused on food deserts and
categorizes these articles based on measures studied in order to identify areas that have been
studied extensively compared to areas that require additional research. This paper concludes
with a discussion of the policy implications and areas for future research related to access to
healthy and nutritious foods within areas that lack a supermarket.

10
2.2 INTRODUCTION
The phrase “food desert” was first used in the early 1990s in Scotland by a resident of a
public housing sector scheme (S. Cummins & Macintyre, 2002). Since that time, the phrase has
been used differently by different researchers. For example, in a study by Hendrickson et al.
(2006) food deserts were defined as “urban areas with 10 or fewer stores and no stores with more
than 20 employees” (2006: 372). Cummins and Macintyre (2002) define food deserts as “poor
urban areas where residents cannot buy affordable, healthy food” (S. Cummins & Macintyre,
2002). The latter definition focuses on the type and quality of foods rather than the number, type
and size of food stores available to residents. Beyond these descriptions, there is a lack of
consensus on the definition of food deserts (Hendrickson et al., 2006), and what measures are
required for identifying food deserts, thereby contributing to the debate about their actual
existence (S. Cummins & Macintyre, 2002; S. C. J. Cummins, 2003; Reisig & Hobbiss, 2000;
Shaw, 2006).
To date, there is a relatively limited amount of research on food deserts conducted in the
U.S. One explanation for this finding is that household food security, opposed to food deserts, is
assessed in the U.S. annually, and forms the basis of numerous research studies in the U.S. In
Europe, the U.S., Canada, and other developing countries, food deserts are believed to be created
and exist via similar mechanisms although mediated by different factors. These factors are
differences between the countries and include racial/ethnic composition of each country,
geographical and residential segregation of the citizens, social inequality, and the infrastructure
of the food environment (Shaw, 2006). In the U.S. several theories to how food deserts formed
have been postulated.

11
One theory has been associated with both the development and closure of stores (Curtis
& McClellan, 1995; Guy, Clarke, & Eyre, 2004). It is believed that the growth of large chain
supermarkets on the outskirts of inner-cities in more affluent areas offer consumers a better
quality, variety, and price for food options. Additionally, these venues tend to have longer
business hours and better parking options that are attractive to consumers (Alwitt & Donley,
1997; Guy et al., 2004). The expansion of these supermarkets have forced the smaller,
independent, neighborhood grocery stores to close, thereby creating areas where affordable,
varied food is accessible to those who have access to a car, or those able to pay public
transportation costs (Guy et al., 2004). This theory has led one independent retailer to define a
food desert as ‘an area where high competition from the multiples [large chain supermarkets] has
created a void’ (Furey, Strugnell, & McIlveen, 2001).
Another theory of how food deserts formed in the inner cities pertain to changes in
demographics in larger U.S. cities between 1970 and 1988. It is speculated that during this
period, economic segregation became more prominent with more affluent households emigrating
from inner cities to suburban areas (Bianchi, Farley, & Spain, 1982; Nyden, Lukehart, Maly, &
Peterman, 1998; Wienk, Reid, Simmons, & Eggers, 1979). This shift caused the median income
in the inner cities to decrease and forced nearly one-half of the supermarkets in the three largest
U.S. cities to close (Alwitt & Donley, 1997; Diesenhouse, 1993; Miller, 1994).
Other factors that make the establishment of businesses in inner cities less desirable are
inaccurate perceptions of these areas, declining demand for low-skilled workers, low-wage
competition from international markets, and zoning laws (Gittell & Thompson, 1999). For
instance, in urban areas, it is difficult for large supermarkets to find land that is appropriate for
the size of the supermarket due to fragmentation of property that results from the ease of selling

12
smaller pieces of land (Alwitt & Donley, 1997). It is plausible that urban food deserts would
have a competitive advantage as sites for a supermarket due to its prime location near the city
center, ability to address an unmet demand, and access to a large labor force. However, financial
gain is often an underlying factor that tends to override these characteristics and deter retailers
from establishing in urban areas (Gittell & Thompson, 1999).
The goal of this paper is to explore the current state of research on food deserts in the
U.S. and to identify areas in need of future research. This paper will categorize constructs of
food deserts. In doing so, attention will be brought to measures that have been well studied and
others that are in need for additional research. The articles included in this review were
identified from January – September 2008 by two mechanisms: keyword searches in the
Agricola, Anthropology, Environmental Studies, Geography, Public Affairs, and Sociology
databases, and by reviewing the references of the articles identified from these databases. The
keyword “food desert” was used to identify relevant articles. Only articles written in English
were included in the review. No constraints were made for year of article publication. Abstracts
were then reviewed to ensure that articles that did not meet certain criteria were excluded from
the review. Abstracts excluded were: 1. editorials, 2. non-empirical papers including review
articles and book reviews, and 3. articles with outcomes that did not focus on food deserts.
Thirty-six abstracts were identified in the initial review. After reading the abstracts, it was found
that only 22 remained after 5 were excluded based on the first exclusion criterion, 6 for the
second criterion, and 3 abstracts for the third criterion. After reading the 22 articles, it became
apparent that findings from the selected articles represented 11 categories based on similar
measures used in the studies. For example, articles that focused on racial/ethnic differences in
the neighborhood food environment were grouped under the category “Race/Ethnicity.”

13
Similarly, articles that compared food stores between urban areas versus rural and/or suburban
were grouped under the category “Location.” Table 2.1 represents the articles included in the
review and the measures that were included in the study. Table 2.2 lists each of the measures
that represent the existing food desert literature and the corresponding articles.

14
Table 2.1. Review Articles with Measures Used in the Study
Author, year Measure Access
to stores Income/SES Race/
Ethnicity Food Store Density
Cost Location Store Type
Availability Perception Quality of Available Foods
Impact
Alwitt & Donley, 1997 X X Block et al., 2004 X X Chung & Myers, 1999 X X X X X Cotterill & Franklin, 1995 X X Gallagher et al., 2006 X X Garasky et al., 2004 X Giang et al., 2008 X X Glanz et al., 2007 X X X X X Hendrickson et al., 2006 X X X X X X Inagami et al., 2006 X Kaufman et al., 1997 X X X Kaufman, 1999 X X Lewis et al., 2005 X X X X Moore & Diez Roux, 2006 X X X Morland et al., 2002a X X Morland et al., 2002b X X X Morris et al., 1990 X X X Morris et al., 1992 X X X Powell et al., 2007 X X X Raja et al., 2008 X X X Rose & Richards, 2004 X Zenk et al. 2005 X X

15
Table 2.2. Article Summaries by Food Desert Category Categories Article Results
Access to Stores
Alwitt & Donley, 1997- Poor residents travel a greater distance to access the same resources as non-poor residents. Chung & Myers, 1999- Poor residents have less access to chain stores. Cotterill & Franklin, 1995- More low income residents lack transportation which limits access to food outlets. Gallagher et al., 2006- African Americans have the lowest access to grocery stores and greatest access to fast food outlets. A decrease in grocery store access is associated with an increase in obesity. Giang et al., 2008- Access to food is unevenly distributed in Philadelphia. In areas where access is limited the most, residents suffer greater health challenges with diet as a risk factor. Inagami et al., 2006-Residents who shopped in more disadvantaged neighborhoods had higher BMIs than those who did not shop in a more disadvantaged neighborhood, suggesting that neighborhood SES of the grocery store is a proxy for quality of the grocery store. Kaufman, 1999- More than 70% of the total low-income population in the catchment area had accessibility challenges. Morland et al., 2002a-Fewer supermarkets were observed for neighborhoods where both black study participants and white study participants resided. However, there were 5 times as many supermarkets in the areas where white participants resided compared to blacks. Raja et al., 2008-There are no food deserts in Erie County, New York Rose & Richards, 2004-
Easy access to supermarkets was associated with increased household fruit intake.
Income/SES
Alwitt & Donley, 1997-Poor areas have fewer and smaller food outlets than non-poor areas. Chung & Myers, 1999- Residents of poor neighborhoods pay more for shopping locally Cotterill & Franklin, 1995- Low income areas have 30% fewer supermarkets compared to higher income areas. Giang et al., 2008- Low income residents have limited access to supermarkets. Glanz et al., 2007- Non-poor neighborhoods were more likely to have healthier food options than poor neighborhoods Kaufman et al., 1997- There is little evidence that food prices are higher in poor areas compared to non-poor areas. Lewis et al., 2005- Poorer neighborhoods have fewer healthy food options compared to non-poor neighborhoods Moore & Diez Roux, 2006- Low-income neighborhoods had four times as many grocery stores (non-chain stores) and half as many supermarkets (chain stores) compared to more affluent neighborhoods. Morland et al., 2002b-There were 3 times as many supermarkets in non-poor neighborhoods compared to poor neighborhoods. Non-poor neighborhoods were less likely to have smaller grocery stores (non-chain), convenience stores (without a gas station), and specialty stores compared to poor neighborhoods. Powell et al., 2007-Poor neighborhoods have fewer supermarkets, only 75%, of that in middle-income neighborhoods Zenk et al. 2005-
Supermarket access was similar among the least impoverished neighborhoods regardless of race/ethnicity.
Race/Ethnicity
Block et al., 2004- Predominantly black neighborhoods have six times more fast food restaurants than predominantly white neighborhoods. Gallagher et al., 2006- African Americans travel the greatest distance to any type of grocery store. Lewis et al., 2005-Predominantly African American neighborhoods have fewer healthy food options compared to areas with a lower percentage of African American residents. Moore & Diez Roux, 2006-stores (non-chain stores) and half the number of supermarkets (chain stores) than predominantly white neighborhoods.
Predominantly minority and racially mixed neighborhoods had more than twice as many grocery
Morland et al., 2002a-The presence of one supermarket was associated with a 32% increase in fruit and vegetable consumption among blacks and 11% increase in fruit and vegetable consumption among whites.

16
Morland et al., 2002b-Supermarkets were 4 times more likely to be found in predominantly white neighborhoods compared to predominantly black neighborhoods. Powell et al., 2007-Predominantly African American neighborhoods have 52% of the supermarkets that are available in predominantly white neighborhoods. Hispanic neighborhoods have only 32% of the supermarkets that are available in non-Hispanic neighborhoods. Raja et al., 2008-There is a lack of supermarkets in neighborhoods of color compared to white neighborhoods Zenk et al. 2005
-Compared to the most impoverished white neighborhoods, African American neighborhoods were 1.1 miles farther from the nearest supermarket.
Food Store Density
Block et al., 2004- Neighborhoods with 80% black residents have 2.4 fast-food restaurants/mile2 compared to 1.5 fast food restaurants/mile2 in neighborhoods with only 20% black residents. Lewis et al., 2005-The comparison group for the study (more affluent, smaller percentage of African American residents) contained 50% more full-service restaurants than the target area. Morland et al., 2002b
-With the exception of bars and taverns, all food outlets were more common in racially mixed and predominantly white neighborhoods than predominantly black neighborhoods. Full-service restaurants were 2 times more common in white neighborhoods. Carryout food outlets serving specialty food items are 9-11 times more common in racially mixed and predominantly white areas.
Cost
Chung & Myers, 1999- Prices at chain stores are lower than smaller convenience stores. Glanz et al., 2007- The prices for most healthy options (low fat, low calorie) were not significantly different from the comparable regular item. The greatest cost difference found in the cost of lean ground beef, low-fat hot dogs, baked chips and 100% fruit juice compared to the regular items (p<0.01). Hendrickson et al., 2006- Food prices were higher in both rural and urban food deserts compared to non-food deserts Kaufman et al., 1997- Food items in supermarkets offer greater variety and quality at a lower cost. Morris et al., 1990- The average cost of one week’s worth of Thrifty Food Plan groceries was 36% higher than the maximum weekly food stamp allotment of $75 for a family of four. Morris et al., 1992
-The average thrifty food plan cost for small/medium stores was $102 compared to $81 in supermarkets.
Location
Chung & Myers, 1999- More chain stores are located outside inner cities where there is low poverty. Hendrickson et al., 2006- Food prices in the urban food desert were more expensive than the market basket price. Kaufman, 1997-Supermarkets in inner cities have somewhat higher prices than those in suburban areas. Kaufman, 1999- Poor residents of rural areas depend on smaller convenience stores than residents in metropolitan cities. Morris et al., 1990-Rural poor depend on limited, more expensive food outlets. Morris et al., 1992-In 1988, the number of supermarkets per county in rural America versus urban America was 3.8 and 29, respectively. Powell et al., 2007
-Food outlets are more common in urban areas compared to suburban, rural and farm areas.
Store Type
Chung & Myers, 1999- For specific food items, chain stores offer prices that are 10-40% less than non-chain stores. Glanz et al., 2007- Convenience stores were found to have lower food price compared to grocery stores. Moore & Diez Roux, 2006-Poorer areas were less likely to have fruit and vegetable markets, bakeries, specialty stores, and natural food stores compared to affluent areas. These areas were more likely than affluent areas to have liquor stores. Raja et al., 2008-Smaller grocery stores (non-chain) are more prevalent in neighborhoods of color compared to white neighborhoods.
Table 2.2 continued

17
Availability Glanz et al., 2007- Grocery stores were found to have greater availability of healthier food options compared to convenience stores. Hendrickson et al., 2006- Foods within rural and urban food deserts are more limited in type and in number compared to non-food deserts. Morris et al., 1990- Many rural food outlets contained poorly stocked shelves and lacked healthy and nutritious foods. Morris et al., 1992
-Small/medium stores carried a small amount of fresh foods.
Perception
Garasky et al., 2004-Rural clients were more likely than urban or suburban to perceive their food environment as having an inadequate number of supermarkets (50% compared to 22% and 13%, respectively). Suburban clients’ perceived local food as being more affordable compared to urban and rural clients. Transportation concerns were greatest among suburban and rural clients. Hendrickson et al., 2006-
Residents identified lack of affordable healthy food options within their communities and food insecurity as concerns
Quality of Available Foods
Glanz et al., 2007- Grocery stores were found to have greater quality of healthier food options compared to convenience stores. Hendrickson et al., 2006-
Foods within the urban and rural food desert were of fair or poorer quality compared to a non-food desert.
Impact
Hendrickson et al., 2006-The lack of affordable, quality foods diminishes the ability to access healthy foods needed to maintain a healthy diet. Lewis et al., 2005
-The neighborhood food environment in the low-income neighborhoods in the study provides challenges to healthy eating for residents. Restaurants in the less affluent target area promoted unhealthy food options to residents.
Table 2.2 continued

18
2.3 Article Results
Of the 11 measures found in the literature, 3 were represented more frequently: Access to
supermarkets; 2. Racial/ethnic disparities in food deserts; and 3. Income/Socioeconomic status in
food deserts. A fourth measure, differences in chain versus non-chain stores will also be
explored due to the complexity of this measure in incorporating factors of cost, availability, and
store type.
2.3.1 Access to Supermarkets Increasingly, studies are focusing on the availability of healthy and nutritious foods
within communities across the country, and suggest that factors within the built environment
play a critical role in a person’s diet (Kimberly Morland et al., 2002b; Donald Rose & Richards,
2004). A widely cited example of the lack of access to supermarkets is in Philadelphia, PA
(Giang et al., 2008). Results from the University of Connecticut’s Food Marketing Policy Center
study showed that Philadelphia had the second lowest number of supermarkets per capita among
major cities in the U.S. during the 1990s (Cotterill & Franklin, April 1995).
To illustrate this further, consider the number of supermarkets on the national level. It is
believed that the lowest income neighborhoods had nearly 30% less supermarkets than the
highest income neighborhoods (Weinberg, 1995). Compare this to the food environment in
Philadelphia where the highest income neighborhoods had 156% more supermarkets than the
lowest income neighborhoods (Weinberg, 1995). Access-related concerns are even more
compounded by the lack of transportation. Low-income residents may have difficulty affording
transportation costs to the supermarket located outside of their immediate vicinity, thereby
limiting access to food options (Donald Rose & Richards, 2004; Weinberg, 1995).

19
Transportation is not the only barrier to accessing healthy foods. Rose and Richards (2004)
suggest that access to food goes beyond the food environment and incorporates the built
environment and individual characteristics. For example, unsafe neighborhoods for walking, and
the lack of time due to work schedules, being a single parent, or the lack of time required to
prepare meals, can result in difficulty accessing supermarkets (Rose & Richards, 2004).
A related finding in the aforementioned University of Connecticut study was that
residents in many of the neighborhoods that lack access to supermarkets in low-income
neighborhoods of Philadelphia had greater prevalence of health challenges with diet as a risk
factor. These challenges include diabetes, heart disease, and cancer (Cotterill & Franklin, April
1995). Studies suggest that disparities in supermarket access exist with racial/ethnic minority
communities and low-income communities being disproportionately affected (Chung & Myers,
1999; Hendrickson et al., 2006; Powell, Slater, Mirtcheva, Bao, & Chaloupka, 2007; Zenk et al.,
2005). While many of these studies address access-related concerns, they focus on the
racial/ethnic and income disparities that exist within food deserts. Findings from these studies
will be discussed in subsequent sections.
2.3.2 Racial/Ethnic Disparities in Food Deserts
Previous studies found that predominantly Black neighborhoods have fewer supermarkets
compared to predominantly White neighborhoods ("Metro Chicago Information Center," 2008;
Kimberly Morland et al., 2002b). In an examination of the associations between the availability
of food stores in the US and race, ethnicity and socioeconomic status, Powell et al. (2007) found
that the availability of chain supermarkets in Black neighborhoods was only 52% that of their
20
White counterpart (Powell et al., 2007). These differences still existed after controlling for
relevant covariates including neighborhood income.
In a similar study using geographic information system (GIS) to measure spatial
accessibility of chain supermarkets with respect to neighborhood racial composition and poverty
in Detroit, Michigan, Zenk and colleagues (2005) found that the most impoverished
neighborhoods in which African Americans resided were 1.1 miles farther from the closest
supermarket compared to the most impoverished White neighborhoods (Zenk et al., 2005).
Additional findings show that 28% of residents in the most impoverished Black neighborhoods
did not own a car in 2000, that these neighborhoods had 2.7 fewer supermarkets within a three-
mile radius compared to the most impoverished White neighborhoods, and that among the most
impoverished neighborhoods in Detroit, 76% of these areas had a high proportion of African
Americans (Zenk et al., 2005). Understanding the social and racial history has helped frame the
present-day issue of racial segregation and consumer purchasing power. Looking at the history
in Detroit, Michigan, Zenk et al. (2005) surprisingly found that among the least impoverished
neighborhoods studied, all but one of the predominantly Black neighborhoods that had access to
a supermarket equivalent to their White counterparts, was located in the inner city. The
interpretation of this finding is two-fold. First, this suggests that supermarkets will stay invested
in a neighborhood as long as the residents have the purchasing power to make their commitment
to the area profitable. Second, supermarkets that remain in these urban areas are remnants from
when these areas were predominantly White, again implying that it is profitable for these
retailers to remain in the area (Zenk et al., 2005).

21
2.3.3 Socioeconomic Status in Food Deserts
The majority of smaller stores located in urban areas are in low-income areas (Alwitt &
Donley, 1997; Hendrickson et al., 2006). The consequence is that the issue of poverty plays out
in economic barriers in accessing food in low-income areas. Hendrickson and colleagues (2006)
found that food prices are higher and food quality is poorer, often inedible, in areas where
poverty is the highest, compared to more affluent areas. Furthermore, results from the same
study show that there is a smaller quantity and variety offered at stores in impoverished areas.
These findings are consistent with other studies that show that residents living in areas that do
not have a supermarket pay more for their food (Chung & Myers, 1999; Freedman, 1991;
Hendrickson et al., 2006; Philip R. Kaufman et al., 1997; "U.S. House of Representatives Select
Committee on Hunger," 1990). In a similar report by New York’s Consumer Affairs Department
in 1991, results from price surveys in 60 stores and 140 interviews with consumers and retailers
showed that the poor residing in urban areas paid more for groceries, and received poorer quality
foods (Chung & Myers, 1999; Freedman, 1991).
One explanation for the higher costs of food in urban areas has to do with increased crime
in these areas. Theft within stores in urban areas where the cost is already high tends to drive up
the cost of food items even more. The unfortunate result is that a vicious cycle may form where
the high cost of food makes stealing an attractive option thereby forcing store owners to increase
the price of food for consumers that already have a difficult time paying for food (Hendrickson et
al., 2006).
Additionally, the issue of lack of transportation is echoed throughout the literature citing
that many low-income households do not have access to a car and cannot afford the costs
associated with getting to a supermarket outside of their immediate neighborhood. (Alwitt &

22
Donley, 1997; Guy et al., 2004; Hendrickson et al., 2006; Phil R. Kaufman, 1999; "U.S. House
of Representatives Select Committee on Hunger," 1990). As a result of the lack of
transportation, low-income households are less likely to travel the distance to a supermarket
outside of their neighborhood and will purchase food items from the stores that are nearby,
thereby sacrificing cost and quality for convenience.
2.3.4 Differences in Chain Versus non-Chain Stores
A report by the Economic Research Services (ERS) of the United States Department of
Agriculture (USDA) found that urban supermarket prices are higher than suburban ones (Philip
R. Kaufman et al., 1997; Powell et al., 2007). The fewer supermarkets and the prevalence of
smaller grocery stores that are located in urban areas may account for the higher food prices.
The ERS report also explained that smaller grocery stores tend to stock leading brand items and
smaller package sizes which can drive the cost of food prices up. Larger supermarkets are able
to stock both leading brand and generic items, both offered in larger and smaller packages. The
variety in brands and package size that larger supermarkets are able to offer helps offset the
higher priced items, thereby keeping the cost lower (Chung & Myers, 1999; Phil R. Kaufman,
1999).
In an examination of food items in approximately 55 stores within the Minneapolis and
St. Paul metropolitan areas, Chung et al. (1999) found that only 22% (n=256) of chain
supermarkets were located in urban areas. However, nearly one-half of the non-chain stores
were located there. Results also showed that non-chain stores were more likely to be located in
poor areas whereas chain supermarkets were more likely to be located in more affluent areas
(Chung & Myers, 1999). To identify differences between two markets, chain versus non-chain,

23
Chung and Myers (1999) compared market basket prices. These prices reflect the cost of a fixed
list of items and provide information regarding inflation within the larger economy as well as
within a specific market.
The biggest disparity in price between chain and non-chain venues was in the price of dry
goods including flour and oatmeal. Consumers who shop at chain supermarkets paid between
10-40% less for these items (Chung & Myers, 1999). In terms of market basket prices, there was
a $16.62 price gap between non-chains and chains, $1.18 price gap between urban and suburban
retailers, and a $5.15 price gap between poor and non-poor areas (Chung & Myers, 1999). This
means that consumers who shopped at non-chain stores, in urban and poorer areas paid more per
unit of measurement than chain, suburban and non-poor areas.
2.4 DISCUSSION
This review focused on food desert literature in the US. The specific focus on food
deserts opposed to including articles pertaining to areas that have supermarkets, or food oases,
was to highlight the issues surrounding poor access to healthy and nutritious foods characteristic
of food deserts. Furthermore, the focus allowed for better understanding of the challenges in
obtaining healthy and affordable foods faced by residents of these areas. These challenges are
not experienced by residents of food oases who reside in close proximity to a supermarket.
Results of the review of the literature produced 22 empirical studies that focus on food deserts in
the U.S. These studies focused on 11 measures that have been used to categorize food deserts.
The majority of the studies included in this review (n=20) utilized more than one measure to
explore food deserts. It is worthwhile to note that most research in this area has focused on
exploring racial/ethnic and income disparities within food deserts. This can partly be attributed

24
to increased attention focusing on reducing and eliminating health disparities including
racial/ethnic and income disparities. The measures that have received the least attention have
focused on residents’ perceptions of their food environment and the impact of living in a food
desert. One explanation for this finding is that unlike income and race/ethnicity which are easier
to quantify, perceptions are more subjective. However, understanding perceptions can offer
insight into facilitators and barriers to healthy eating. Similarly, it is difficult to assess the direct
impact of residing in a food desert when additional factors such as race/ethnicity or income could
be contributing to the association.
Few studies discuss policy implications for food deserts. The few studies that mention
policy-related concerns discuss reducing the racial/ethnic and related income disparities that
exist in accessing food, and working to attract supermarkets to economically disadvantaged
neighborhoods (Chung & Myers, 1999; Lang & Caraher, 1998; Zenk et al., 2005). This
underscores the need for policymakers and stakeholders to begin determining food-related
policies and practices. These policies can have a major impact in addressing the limited access
to affordable healthy and nutritious foods for low-income residents of urban areas that lack
access to these foods. An example of how cities are addressing the lack of access to
supermarkets are found in Pittsburgh, Boston and New York where many communities have
relied on local leadership and policy development to alleviate these disparities (Pothukuchi,
2000). These cities have developed public/private partnerships, agreements between government
and private sector organizations, to build and maintain infrastructure and necessary community
facilities (Nayga & Weinberg, 1999; Widdus, Chacko, Holmand, & Currat, 2001). Specifically,
partnerships between local government and supermarket leaders have been developed to bring
supermarkets into underserved areas. Ultimately, these partnerships seek to increase

25
supermarket access within neighborhoods that have been overlooked by food retailers. In
addition to addressing the food environment, it is imperative to address transportation-related
issues that have been identified as additional barriers to accessing healthy foods for many low-
income residents.
While many studies focus on the presence or absence of supermarkets, few examine the
dynamic interaction between other food venues (restaurants, corner stores, gas stations, etc.) as
places where residents purchase food. This is important because these venues, in addition to
local grocery stores, comprise the food environment and offer food items for residents, despite
the nutritional value of these foods. The importance of identifying these types of food stores
within a neighborhood is two-fold. First, identifying these stores offers a complete picture of the
entire food environment within a neighborhood. Second, researchers will have a better
understanding of the food options that are available to residents. While it is important to identify
places that offer healthy foods within a neighborhood, it is equally important to identify the
places within a neighborhood that can offset these locations.
There is limited knowledge about the associations between residing in a food desert and
both behavioral and physical health outcomes. More specifically, there is debate about whether
living in a food desert is associated with unhealthy eating and food buying practices, or health
outcomes such as obesity, diabetes, or hypertension, all of which have diet and nutrition as a risk
factor. Similarly, it is unknown whether other factors including personal preferences are better
indicators for healthy eating than the actual presence or absence of a supermarket. Additional
research is needed to better understand these associations and additional factors involved in food
buying practices among residents of food deserts. The salience for this research is to better
understand how a neighborhood characteristic such as access to a supermarket influences healthy

26
eating. It is also worthwhile to explore how household food security status (food secure or food
insecure) influences food buying practices and how these differences vary by food desert status.
This information will be useful in program planning and policy development aimed at addressing
access to healthy and affordable foods.

27
3.0 CHAPTER THREE: METHODS
This dissertation research utilized a participatory research method called concept
mapping to identify factors that influence food buying practices in residents of a food desert and
a food oasis. Additionally, this research sought to explore similarities and differences in
importance of factors that influence food buying practices on hindering healthy eating among
food secure and food insecure participants. This chapter presents the research methods used in
this dissertation research. The chapter begins with a description of how the two areas in the
research were identified. Next, a detailed description of the recruitment and concept mapping
processes. Then, information on the data collection procedures is presented. This chapter
concludes with information on data analyses including examples of the analytic techniques that
were used in this research.
3.1 IDENTIFICATION OF FOCAL AREAS
To identify the two zip codes that were included in this study, the 39 residential zip codes
in Pittsburgh, PA were categorized by food desert status. The online yellow pages located at
www.yellowpages.com, was used to identify distance to the nearest supermarket in each of the
39 residential zip codes in Pittsburgh. Utilizing the yellow pages is an efficient and
comprehensive tool to identify distance based on latitudinal and longitudinal coordinates. The
use of the yellow pages has been cited in the literature as a means of identifying physical activity
resources in a midwestern U.S. city (Estabrooks, Lee, & Gyurcsik, 2003), verifying the existence
of food stores in Baltimore from a purchased list (Franco, Roux, Glass, Caballero, & Brancati,
2008), and identifying industry codes for businesses (Kimberly Morland et al., 2002b). Fifteen
zip codes were identified as food oases. In other words, 38.5% of the zip codes have a

28
supermarket within 0.5 miles of the center of the zip code. Conversely, 24 (61.5%) zip codes
were identified as food deserts, meaning they lack a supermarket within 0.5 miles. After food
desert status was determined, each zip code was evaluated for neighborhood poverty status.
Neighborhood poverty status has been measured using various markers including:
number of households that receive welfare, presence of female-headed households with children,
and the number of male residents unattached to the labor force (Zenk et al., 2005). The most
common measure, and the measure that was used in this study as a proxy for neighborhood
poverty status is percentage of families below the federal poverty line as determined by the US
Census Bureau. The U.S. Census Bureau uses the federal government’s official poverty
definition, originally developed by the Social Security Administration (SSA). Additional
information regarding the calculation of poverty status, including poverty thresholds is available
at http://www.census.gov/hhes/www/poverty/threshld/thresh99.html ("U.S. Census Bureau,"
Undated). The percentage of families below the federal poverty line was obtained for each zip
code by accessing www.census.gov ("U.S. Census Bureau," Undated). The mean percentage of
families below the federal poverty line in Pittsburgh from 2005-2007 was 9.8% ("U.S. Census
Bureau, Current Poverty Data," 2005-2007). Among the zip codes in Pittsburgh, 16 zip codes
have mean percentage of families below the federal poverty line (“U.S. Census Bureau, Current
Poverty Data,” 2005-2007). Eligible zip codes were explored for demographic characteristics.
To be selected for the study, zip codes had to be comparable in terms of total population, age
distribution, racial/ethnic composition, educational attainment and median household income.
Based on these criteria, two zip codes included in the study were identified. The selected food
oasis has the second highest percentage of families below the federal poverty line and the second
lowest median household income among food oasis zip codes. The selected food desert zip code

29
is a zip code that has similar demographic characteristics as the food oasis, has one of the highest
percentages of families below the federal poverty line and one of the lowest median household
incomes in Pittsburgh. These zip codes are 15201 (food oasis) and 15207 (food desert), and
illustrated in Figure 3.1. To further substantiate the use of 0.5 miles as an indicator of a food
desert, the numbers of food outlets (including supermarkets, sit-down and fast-food restaurants,
and convenience stores) per unit area were calculated for each zip code. The list of food outlets
was purchased from www.usadata.com ("USAData," New York, NY ). There are 43 different
food outlets in the food oasis compared to 16 in the food desert. The food density for the food
oasis is 17.55 food outlets/mile2 compared to 2.75 food outlets/mile2 in the food desert. To
illustrate the difference in food outlets even further, consider the density of supermarkets in each
of these areas. There are a total of two supermarkets in the food oasis compared to zero in the
food desert. This calculates to a supermarket density of 0.82 supermarkets/mile2 in the food
oasis compared to zero in the food desert. The total area was obtained from 2000 Census data.
Figure 3.1. Map of Pittsburgh with the selected zip codes highlighted
15201
15207
0 2 4 1 Miles
City of Pittsburgh with Focal Areas Denoted

30
Table 3.1 presents a summary of characteristics from both zip codes selected. The age
distribution was similar for both zip codes with the median age being 40.6 years in the food
desert and 42.0 years in the food oasis. As intended, the total populations for both areas were
comparable, with 13,203 residents in the food desert and 14,326 in the food oasis, according to
the 2000 census. Another noteworthy characteristic is the racial/ethnic make-up of the two zip
codes. Both zip codes are predominantly Caucasian, representing nearly 80% of the residents in
the food desert and 77% of the residents in the food oasis. Of particular importance is the
difference in distance to the supermarket from the centroid of the zip code. For the food desert,
this distance is 1.6 miles compared to 0.35 miles in the food oasis.
Table 3.1. Characteristics of Selected Zip codes Zip code Characteristic Hazelwood
(15207) Lawrenceville
(15201) Distance to supermarket (miles) 1.6 0.35
Total population 13,203 14,326
Age Median age (years) < 5 years (%) 18 years + (%) 65 years + (%)
40.6 5.4 77.9 20.3
42.0 5.1 79.9 22.2
Race & Ethnicity African American Caucasian Other Hispanic/Latino
18.8 79.1 2.1 1.0
19.8 77.1 3.1 0.8
Education High school graduate or higher (%) Bachelor’s degree or higher (%)
76.8 12.6
77.6 18.8
Economic Median household income, 1999 ($) Percent families below poverty line
28,156 14.0
27,031 14.5
Source: U.S. Census Bureau (2000) located at www.census.gov. Note: Food desert =15207; Food oasis = 15201

31
3.2 RECRUITMENT
Recruitment of study participants took place over a four-week period in January 2009 and
continued until 15 participants in each zip code had enrolled and involved a modified snowball
sampling technique (Magnani, Sabin, Saidel, & Heckathorn, 2005). A modified snowball
technique was used to yield a sample based on referrals from people who knew others who met
the inclusion criteria. The referrals were made from staff from social service agencies, such as
neighborhood clinics, senior centers, and food banks, and from participants who had already
been recruited to participate in the study. A study recruitment flyer was developed (see
Appendix A) and included information about the study and a contact number to call if interested.
When a potential participant called the number, they were asked if they: 1. were at least 18 years
of age, 2. lived in either zip code 15201 or 15207, and 3. had lived there for the past 12 months.
If the participant answered “yes” to these three questions, the purpose and the requirements of
the study were described. If the caller was still interested in participating after every question
was answered, the caller was enrolled in the study and mailed a consent form. Instructions were
given to read the consent form thoroughly and to bring to the first group session. Twenty-five
participants from the two zip codes attended three concept mapping sessions. Twelve
participants were residents from the food desert and 13 were residents from the food oasis. The
median age was 46.5 years and the racial/ethnic composition was nearly half Caucasian and half
African American. Additional participant demographics are presented in table 3.2. The concept
mapping sessions are described in more detail in the following Data Collection section of this
chapter. All concept mapping sessions were conducted in private rooms at community agencies
located within each zip code. This study was approved by the University of Pittsburgh
Institutional Review Board.
32
Table 3.2. Sample of Participant Demographics by Food Desert Status Zip code Characteristic Food Desert
(15207) Food Oasis
(15201) Total
Total number of participants
12 (48%) 13 (52%) 25 (100%)
Age Median age (years)
42.8
47.5
46.5
Sex Male Female
2 (16.7%) 10 (83.3%)
1 (7.7%) 12 (92.3%)
3 (12%) 22 (88%)
Race & Ethnicity African American Caucasian Other
6 (50.0%) 6 (50.0%) 0 (0%)
6 (46.2%) 6 (46.2%) 1 (7.7%)
12 (48%) 12 (48%) 1 (4%)
Average number of adults in household
1.50 1.54 2.11
Number of children in household
0.50 0.77 1.33
Car ownership Do not own car & hard to find a ride Do not own car & able to find a ride Own car
5 (41.7%) 4 (33.3%) 3 (25.0%)
4 (30.8%) 4 (30.8%) 5 (38.5%)
9 (36%) 8 (32%) 8 (32%)
3.3 DATA COLLECTION
Increasingly, participatory approaches to collecting, analyzing and interpreting qualitative
data have gained recognition and use within public health research (Minkler, Blackwell,
Thompson, & Tamir, 2003). Community Based Participatory Research (CBPR) is one approach
that is recognized by health scholars and funders to accomplish this task (Minkler et al., 2003).
CBPR has been accepted as an important tool for engaging participants. With this approach,
participants share their experiences in helping identify areas of concern that require additional
research, and utilizing study results to inform program and policy development. Like CBPR,
concept mapping also accomplishes these tasks due to the participatory nature of the
methodology. Concept mapping participants are involved in freely generating a list of items in
response to a focal question to be used in data collection and analysis. Furthermore, participants
are actively engaged in the interpretation of the maps constructed and offer insight into how the

33
findings inform the original focal question. The use of concept mapping in this dissertation
research is described below.
Concept mapping is the methodology that was used in this study to investigate food
buying practices among residents of a food desert and a food oasis. It is an appropriate
methodology for this study because it is a participatory approach that involves the participants in
every step of the process, and allows hypotheses to be generated (Kane & Trochim, 2007).
Concept mapping is a mixed-methods approach that involves participation of the stakeholders to
identify, list, and organize barriers according to their perception, and integrates the results in
such a way that multivariate analyses can be used to make comparisons between groups (W.
Trochim, 1989; W. M. Trochim & Kane, 2005). Concept mapping allows individuals or groups
the ability to express their ideas graphically. It is an ideal tool for when groups of stakeholders
have to work together (Robinson & Trochim, 2007). The concept mapping process facilitates the
generation of ideas about a complex topic. Respondents were able to rate, according to
importance or relevance, features that are the most important pertaining to the topic. The
resulting map is one in which respondents can visualize the organization of their ideas and
identify priority areas for further action. Traditionally, concept mapping has been used to guide
program planning and evaluation (Kane & Trochim, 2007). However, recent research has
successfully applied concept mapping in community settings. For example, Burke et al. (2006)
utilized concept mapping to explore perceptions of neighborhood characteristics related to
intimate partner violence and to mental health (J. Burke, O'Campo, & Peak, 2006; J. Burke,
O'Campo, Salmon, & Walker, 2009; J. G. Burke, O'Campo, Peak, Gielen, McDonnell, &
Trochim, 2005). Another example of the successful use of concept mapping is in identifying and

34
addressing barriers to familial involvement in mental illness care among African American
families (Biegel, Johnsen, & Shafran, 1997).
There are six steps involved in the concept mapping process: 1. preparation, 2.
generation of statements, 3. structuring of statements, 4. representation, 5. interpretation of maps,
and 6. utilization of maps. Participants in each zip code completed steps 2-5 over a period of
three non-consecutive days. The research team included the doctoral student (R. Walker), who
facilitated the concept mapping sessions; the dissertation chair (J. Burke), who is an expert on
the concept mapping process, provided oversight for each session and guidance during the
process; and two Master of Public Health students at the University of Pittsburgh, Graduate
School of Public Health, who used the opportunity to learn about and engage in the concept
mapping process as a community practicum requirement. The students assisted in writing
statements on flip chart paper during the first session, note taking, and collecting and entering
data during the second session. Each of these activities is described in more detail below.
3.3.1 Generation of Statements/Brainstorming
Day 1: At the first session, which lasted 2 hours in duration, the facilitator reviewed the study
aims with the group, answered any questions and obtained consent from each participant. The
goal of the first session was for participants to brainstorm the focus statements. Participants
were asked to generate words and short phrases that they believed were relevant to the focus
statement. Table 3.3. presents the focus statement and relevant definitions that were offered to
participants at the brainstorming session.

35
Table 3.3. Focus statement and Definitions Focus Statement Food Buying Practices
Definitions What things, good or bad, influence your food buying practices?
• Where you buy food • The types of food you buy • When you buy food
Each phrase generated during the brainstorming session was written down on flip chart
paper for the entire group to visualize. After every participant made their final contribution to
the list, the group reviewed the list and agreed that the list was exhaustive and represented all of
their perspectives. With permission from the participants, the group discussions were tape
recorded and reviewed to ensure that the list accurately represented what the group contributed.
Audiotapes did not contain any personal identifiers and were stored in a locked cabinet and
accessible only to personnel involved in the study.
Participants residing in the food desert (15207 zip code) generated a list of 125
statements (Appendix B) pertaining to factors that influence food buying practices. Similarly,
participants of the food oasis (15201 zip code) generated 105 statements (Appendix C). After
the brainstorming session, the data were cleaned in a process where redundancies were removed
and similar concepts grouped. This process is consistent with prior concept mapping work (J. G.
Burke et al., 2005) and is necessary for the subsequent concept mapping steps. This grouping
was based on the intent of the participants during the brainstorming process. In instances where
it was difficult to identify how a participant intended the statement to be grouped, audiotapes
from the session were referenced to ensure the viewpoint of the participant was accurately
represented. The expertise of the dissertation chair in concept mapping was used to facilitate this
process. An example of this consolidation process is creating the unique statement “food
expiration date” based on the statements “expired food” and “not outdated food” generated in the

36
food desert and food oasis respectively. Another example is consolidating the statements “fuel
perks” and “gas discount”, generated by participants of the food desert, into the unique statement
“gas discount perks.” A third example was consolidating the statements “look for bargains”,
“bargains”, “only shop when there is a sale” and “Shop ‘n Save has 2 for 1” generated by
participants of the food oasis into the unique statement “bargains.” After the cleaning process, a
master list was generated with 121 unique statements that included statements generated from
each group (Appendix D). For attending the first session, participants received a $20 gift card to
Giant Eagle supermarket for their time.
3.3.2 Administration of Questionnaires/ Structuring of Statements & Representation
Day 2: The second concept mapping session was held two weeks after the first session and
lasted 4 hours. The second session involved sorting and rating the 121 unique statements that
resulted from the brainstorming session. Also during this session, participants were asked to
complete the brief questionnaire (Appendix E) and the Food Security Scale (Appendix F) that
was used to characterize the sample and to answer the second research question. The
questionnaire was divided into four parts. The first part assessed background information
including the number of adults and children in the household and employment status. The
second part of the questionnaire focused on transportation and included questions regarding car
ownership and bus frequency. The third part of the questionnaire inquired about where
participants shop for food and asked about the time in minutes to the store and best/worst
features of the place where food is usually purchased. The final part of the questionnaire dealt
with health concerns and asked about chronic conditions that participants have been diagnosed
with. The food security scale was completed by participants to assess food security, which is

37
calculated from 18 questions for households with children and 10 questions for households
without children. Questions that comprise the food security scale inquire about conditions,
experiences, and behaviors surrounding food quantity, quality, and variety (Nord, Andrews, &
Carlson, 2006). The FSS has been used in research to measure the adequacy and stability of a
household’s food supply (Frongillo, Rauschenbach, Olson, Kendall, & Colmenares, 1997). It is
used to estimate the number of people in the U.S. that are hungry.
Each participant was given a stack of index cards with each card containing one
statement from the master list (and an arbitrarily assigned statement number) generated during
the brainstorming session. The first step involved participants working independently on sorting
the statements from the master list into piles that made sense to them. Participants were asked
not to have too many or too few piles, both of which could cause difficulty in data analysis.
After the statements were sorted, each participant provided a name or label for each pile. For
example, one participant from the food desert grouped the statements “availability of sale items”,
“sale advertisement delivered late”, “different circulars for different neighborhoods”, “read
labels”, “false advertising” and “knowledge of food prices” into the same pile and named the pile
“advertising.” Another participant from the same group created a pile that included the
statements “false advertising”, “buy 1 get 1 free”, “flyers and newspapers to see sales”,
“television commercials”, “food bank”, “bargains”, “availability of sale items”, “word of mouth
of sales”, “convenience”, “knowledge of food prices”, “share information with others”, “sales”,
“sale advertisement delivered late”, “senior coupons for farmer’s market”, “coupons”, “different
circulars for different neighborhoods”, “car service cost”, “coupon sharing”, “double and triple
Sorting

38
coupons”, “meat available from hunting”, and “quantity of items on coupons.” This pile with the
aforementioned 21 statements was named “advertisement.” Once a name or label was generated,
the piles were ready to be entered into the Concept Systems software for data analysis. The two
Master of Public Health student assistants, under the direction of R.Walker and J. Burke, entered
the data into the concept systems software. This data entry process occurred in real time while
the participants completed the sorting activities.
Concept Systems is a licensed software program used to facilitate the concept mapping
process. Individual participant data were entered into the software and an aggregate group
product was generated. First, a similarity matrix was used to tally the number of times two
statements are sorted together. Next, multidimensional scaling of the similarity matrix was
conducted whereby the distance between two statements was calculated using an x-y coordinate
system (Davison, 1983; Kruskal & Wish, 1978). Statements that were sorted together more
frequently were considered to be more closely related and placed in closer proximity to each
other on the map. Statements that were considered less related were place further away from
each other on the map. Then, hierarchical cluster analysis was applied. At this step, individual
statements represented by points on the map were grouped together to illustrate similar concepts.
Using hierarchical cluster analysis methods, the software utilized an algorithm whereby the
distance between all statements was adjusted so that the number of clusters selected was
increased or decreased based on input from the participants (Everitt, 1980).
The final cluster solutions map was agreed upon by participants as accurately reflecting
their perspective. The key diagnostic statistic in multidimensional scaling is the “stress” index
which represents a “goodness of fit” (Kruskal & Wish, 1978). A low stress value indicates a
better overall fit between sort data entered into the similarity matrix and the representation of the

39
data on a two-dimensional map. A meta-analysis of a variety of concept mapping projects
approximated 95% of concept mapping projects are likely to produce stress values between
0.205 and 0.365 (W. M. K. Trochim, 1993). The stress value for the final 12 cluster solutions
map generated with all of the participants’ data was 0.31. This value is well within the range of
most concept maps generated (Kane & Trochim, 2007; Kruskal & Wish, 1978).
To begin the rating process, each participant received a sheet with all of the statements
listed. The task for the participant was to work independently and rate each statement based on a
rating scale. Participants were asked to rate each statements with respect to its perceived
influence on three rating scales. Table 3.4 shows the rating statements and responses that were
used in the rating process.
Rating
Table 3.4. Rating statements and rating scale Rating Issue Rating Statement Rating Scale
Impacts buying practices For each statement, how strongly does it influence your food buying practices?
1= not at all strong 2= somewhat strong 3= moderately strong 4= strong 5= extremely strong
Facilitates healthy eating For each statement, how strongly does it facilitate healthy eating?
1= not at all strong 2= somewhat strong 3= moderately strong 4= strong 5= extremely strong
Hinders healthy eating For each statement, how strongly does it hinder healthy eating?
1= not at all strong 2= somewhat strong 3= moderately strong 4= strong 5= extremely strong
40
The ratings that each participant submitted were used to generate maps that illustrate the
strength of association between the statements and clusters and the influence on food buying
practices, factors that facilitate health eating, and factors that hinder healthy eating.
An advantage of the Concept Systems software occurs during the representation stage of
the concept mapping process when individual piles of sorted data are simultaneously entered into
the mapping software and immediately analyzed. The software was used to conduct
multidimensional scaling analyses (Davison, 1983), which sorted the data across participants and
developed a point map. In essence, this point map illustrates each statement as a point on the
map. Further analyses, specifically, hierarchical cluster analysis (Everitt, 1980) used the data
from the point map to arrange statements into groups of clusters. After the clusters were
generated, the groups discussed the clusters, identify which statements and clusters most
accurately represented their perceptions and corrected the maps as appropriate. Figure 3.2
presents the point map generated, which illustrates where each of the unique statements are
situated on the map with statements in close proximity being perceived by participants as being
related and grouped together more frequently compared to statements that are further away.
Mapping

41
1
2
3
4 5 6
7
8
9
10
11 12
13
14
15 16
17 18
19
20
21
22
23 24
25 26
27
28 29
30
31
32
33
34
35 36
37
38
39
40 41
42
43
44
45
46
47
48
49
50
51
52
53
54
55
56
57
58
59
60
61 62
63 64
65 66
67
68
69
70
71
72
73
74
75
76
77
78
79
80
81
82
83
84 85
86
87
88
89
90
91 92
93 94
95
96
97
98
99
100
101
102
103
104
105 106
107
108
109
110
111
112
113
114 115
116
117
118
119
120
121
Figure 3.2. Point Map for the 121 Unique Statements Generated in the Brainstorming Session
Each group was initially presented with the nine-cluster solution map, illustrated in Figure 3.3
below. Each cluster was given a label by the participants that represented the statements within
each cluster (Table 3.5).
1
2 3
4
5
6 7
8
9
1
2
3
4 5 6
7
8
9
10
11 12
13
14
15 16
17 18
19
20
21
22
23 24
25 26
27
28 29
30
31
32
33
34
35 36
37
38
39
40 41
42
43
44
45
46
47
48
49
50
51
52
53
54
55
56
57
58
59
60
61 62
63 64
65 66
67
68
69
70
71
72
73
74
75
76
77
78
79
80
81
82
83
84 85
86
87
88
89
90
91 92
93 94
95
96
97
98
99
100
101
102
103
104
105 106
107
108
109
110
111
112
113
114 115
116
117
118
119
120
121
Figure 3.3. Cluster Point map with Nine Clusters

42
Table 3.5. Cluster Labels for a Nine-Cluster Solution Map Cluster Number
Cluster Label
1 High Risk 2 Information I Depend On 3 Lifestyle 4 False Advertising 5 Making Ends Meet 6 Neighborhood Issues – The Day Will Get Better 7 Transportation Affects Access 8 Good Price 9 Concerns About the Store
This cluster map posed some problems for many participants of the food desert since the map did
not represent their ideas accurately. For instance, the cluster Good Price (cluster number 8,
located on the bottom right corner of the map), which includes statements such as “coupon
sharing”, “organic foods”, “quality of food”, and “bargains” was perceived to include too many
concepts that participants felt were able to stand alone. Similar feelings were expressed among
residents of the food oasis for the cluster “false advertising.” After increasing the number of
clusters to 12, the statements participants felt should be separated from the initial cluster were
teased out. For example, the Good Price cluster was split into two clusters named Quality
Healthy Foods and Budgeting. This final cluster solution map with 12 clusters was agreed upon
by participants in both groups and is illustrated in Figure 3.4. A list of the statements that
comprise each cluster is found in Appendix G. For attending the second group session,
participants received a $25 gift card to Giant Eagle supermarket for their time.

43
3.3.3 Interpretation & Utilization of Maps
Day 3: This third session was conducted three weeks after the second session and lasted 2 hours.
At the beginning of this last session, the facilitator began by explaining the purpose of the
activities for the day and answered questions that participants had. The group was presented
with the final cluster solution map and a list of the generated clusters with the statements. Based
on differences in cluster ratings, participants were asked to offer insight into how the statements
are related to each other and how the statements either influence food buying practices or hinder
healthy eating. The discussion offered a unique perspective into food access-related issues in
terms of how participants within a food desert and food oasis perceive accessing food and the
implications for healthy eating. Specifically, each group was divided into 3 smaller groups.
Within the small groups, participants were given a list of statements for a specific cluster, flip
chart paper and markers, and asked to diagram how the statements within the cluster are related.
Table 3.6. displays the clusters that were selected and the instructions for each cluster. These
clusters were selected because the inter-relationship of the statements within each cluster is not
easily understood and has not been explored in the literature and because of the difference in
cluster ratings between the food desert and food oasis participants. Average cluster ratings for
food desert and food oasis participants will be discussed in more detail in chapter four.

44
Table 3.6. Clusters Selected for Interpretation and Instructions for Interpretation Group Cluster Name Instructions
1
Lifestyle How do these statements influence food buying practices? Please diagram your response.
High Risk How do these statements influence food buying practices? Please diagram your response.
Concerns About the Stores How do these statements hinder healthy eating? By hinder, we mean make it difficult for you to eat healthy. Please diagram your response.
2
Neighborhood Issues How do these statements influence food buying practices? Please diagram your response.
Concerns About the Stores How do these statements hinder healthy eating? By hinder, we mean make it difficult for you to eat healthy. Please diagram your response.
3
Areas for Improvement How do these statements influence food buying practices? Please diagram your response.
Concerns About the Stores How do these statements hinder healthy eating? By hinder, we mean make it difficult for you to eat healthy. Please diagram your response.
Upon completion, each group presented their diagrams to the larger group and provided an in-
depth explanation. The group discussions were tape recorded to capture the rich qualitative data
expressed in the thoughts, perceptions and beliefs of the participants. For attending the third
group session, participants received a $30 gift card to Giant Eagle supermarket.

45
3.4 DATA ANALYSIS
During the sorting and rating session, participants’ sort and rate data were immediately
entered into Concept Systems, a licensed software program used to facilitate the concept
mapping process. The software uses multidimensional scaling to identify where statements on
the map will be located based on participant data (Kane & Trochim, 2007). In other words,
statements sorted more frequently by participants will be closer in proximity on the map than
statements sorted together less frequently. The next analysis, hierarchical cluster analysis,
partitions the map into clusters representing unique concepts. Participants were informed that
there was not “right or wrong” number of clusters on the map, rather the map should reflect their
perspectives. Participants were first presented with a nine cluster solutions map. After
discussing the statements that comprised these nine clusters, participants felt the nine cluster
solutions map did not accurately capture their perspective. The Concept Systems software
allowed the number of clusters to be increased until a consensus was reached by the participants
where the map represented their ideas accurately. This resulted in the final 12-cluster solutions
map and is illustrated in Figure 3.4.
High Risk
Information I Depend OnLifestyles
Areas for Improvement: The Day Will Get Better
Making Choices
Making Ends Meet
Neighborhood Issues Transportation
Access Issues
Quality Healthy Foods
Budgeting
Concerns About the Stores
Figure 3.4. Final 12-Cluster Solution Map with Labels

46
Multiple concept mapping analytical tools are available for exploring the data (Kane &
Trochim, 2007). These tools include bridging, anchoring, pattern match, and go-zones. Each of
these techniques is useful for offering a unique analysis of the data. For instance, bridging and
anchoring offers insight into the independent sorting and rating process. It is important to realize
that participants will complete the sorting process uniquely. Oftentimes, there are statements
that participants are uncertain how to sort. Consequently, these statements tend to be sorted
together. Graphically, these “leftover” statements tend to cluster together within the center of the
map. A spanning analysis, a type of analysis which illustrates the location of statements that
were grouped together with a specific statement, was conducted in Figure 3.5. This analysis
illustrates how the statement “making choices between buying food and paying bills”, located
within the central Making Ends Meet cluster, was sorted with statements from every cluster.
This suggests that participants perceived the statement “making choices between buying food
and paying bills” as being related to issues of transportation, access, lifestyle, and statements
within the other clusters.
High Risk
Information I Depend OnLifestyles
Areas for Improvement
Making Choices
Making Ends Meet
Neighborhood Issues Transportation
Access Issues
Quality Healthy Foods
Budgeting
Concerns About the Stores
Figure 3.5. Spanning Analysis of a Statement Within the Cluster Making Ends Meet

47
An additional analysis that illustrates how concrete statements are within a particular
cluster is the bridging value. This value identifies clusters that “bridge” across the map. This is
in contrast to anchors, which are clusters that are “anchored” to clusters in close proximity. In
other words, the higher the average bridging value, the more the cluster is “bridged” to other
clusters across the map. The lower the average bridging value, the more “anchored” the cluster
is to nearby clusters. This value offers information to how statements within the cluster were
sorted with respect to statements within other clusters. For example, if statements within a
cluster were frequently sorted with statements from each of the remaining clusters, the cluster in
question would have a higher average bridging value. Table 3.7 shows the average bridging
value for each of the 12-clusters.
Table 3.7. Average Bridging Values for the 12 Cluster Solution Map Cluster Name Average
Bridging Value
High Risk 0.54 Information I Depend On 0.41 Lifestyles 0.52 Areas for Improvement 0.54 Making Choices 0.55 Making Ends Meet 0.40 Neighborhood Issues 0.50 Transportation 0.27 Access Issues 0.08 Quality Healthy Foods 0.37 Budgeting 0.28 Concerns About the Stores 0.46
It is worthwhile to explore the clusters with the highest and lowest average bridging values. For
example, Figure 3.6 shows a spanning analysis of the statement “Healthy food is where people
have money” which is located within the Making Choices cluster (average bridging rating
=0.55). It is evident that this statement was sorted with statements from all of the remaining

48
clusters. The depth of the line bridging the clusters illustrates the number of participants that
grouped the statement to statements within other clusters. The more participants that made that
exact sort, the thicker the line bridging the statements. In this example, participants thought the
statement “healthy food is where people have money”, a statement within the cluster Making
Choices, was related to each cluster with more participants sorting this statement with statements
within the clusters High Risk, Information I Depend On, Quality Healthy Foods, and
Neighborhood Issues.
1. High Risk
2. Information I Depend On 3. Lifestyles
4. Areas for Improvement
5. Making Choices
6. Making Ends Meet
7. Neighborhood Issues 8. Transportation
9. Access Issues
10. Quality Healthy Foods
11. Budgeting
12. Concerns About the Stores
Figure 3.6. Example of a Highly Bridged Statement in the Cluster Making Choices
Similarly, Figure 3.7 shows a spanning analysis of the statement “bus lines being cut so stores not
accessible” within the cluster Access Issues. This cluster has an average bridging value of 0.08.
This means that this cluster is highly anchored to its location on this map. It is clear that this
statement was sorted with statements predominantly within the clusters Access Issues and
Transportation. Only one participant sorted this statement with a statement in the cluster High
Risk. This indicates that there was a high level of agreement in how the statements in Access
Issues were sorted.

49
High Risk
Information I Depend OnLifestyles
Areas for Improvement
Making Choices
Making Ends Meet
Neighborhood Issues Transportation
Access Issues
Quality Healthy Foods
Budgeting
Concerns About the Stores
Figure 3.7. Example of a Highly Anchored Statement in the Cluster Access Issues
3.4.1 Pattern Match
A pattern match is constructed by first computing statement averages across participants,
and then computing cluster averages. A pattern match display is used to make comparisons of
average cluster ratings between two variables. For this dissertation research, comparisons were
made between average ratings for a food desert and a food oasis, and between food secure and
food insecure households. The “ladder graph” representation is useful for illustrating a
correlation between the two variables. A Pearson product-moment correlation is calculated to
represent the relationship between the variables. A pattern match was generated comparing the
three rating scales to identify the extent to which these scales are correlated. Among residents of
the food desert, there was a high correlation between cluster ratings for the “influences food
buying practices” rating scale and the “hinders healthy eating” rating scale (r =0.80). This
relationship, although not as strong, holds true for residents of the food oasis (r =0.66). An
example of a pattern match is illustrated in Figure 3.8.

50
Figure 3.8. Example of a Pattern Match Comparing Average Cluster Ratings for Food Oasis and Food Desert Participants on the Facilitates Healthy Eating Rating Scale
3.4.2 Go-Zone
A go-zone is a type of plot that illustrates average ratings for items within a specific
cluster. This type of plot shows the data in an X-Y graph whereby each quadrant offers usable
information. For example, in Figure 3.9, the go-zone display is for the cluster Budgeting. The
horizontal line (3.86) describes the mean of the values among residents of a food desert.
Similarly, the vertical line (3.26) describes the mean of the values among residents of a food
oasis. The numbers located in the upper right quadrant represent statements that were rated
above average by residents in both zip codes. This quadrant is often considered a quadrant
where action can occur by addressing the statements located within this zone, hence the name
“go-zone.” In addition to items in the upper right quadrant, other quadrants provide useful
information. For this study, it is important to note the statements located in the upper left
r = .52
Food Oasis Food Desert
3.86
2.41
3.86
2.41
Access Issues
High Risk
Making Choices
Lifestyles
High Risk
Making Choices
Transportation
Areas for Improvement
Lifestyles
Access Issues
Concerns About the Stores
Neighborhood Issues
Making Ends Meet
Making Ends Meet
Neighborhood Issues
Transportation
Areas for Improvement
Quality Healthy Foods
Quality Healthy Foods
Budgeting
Information I Depend On
Concerns About the Stores
Budgeting
Information I Depend On
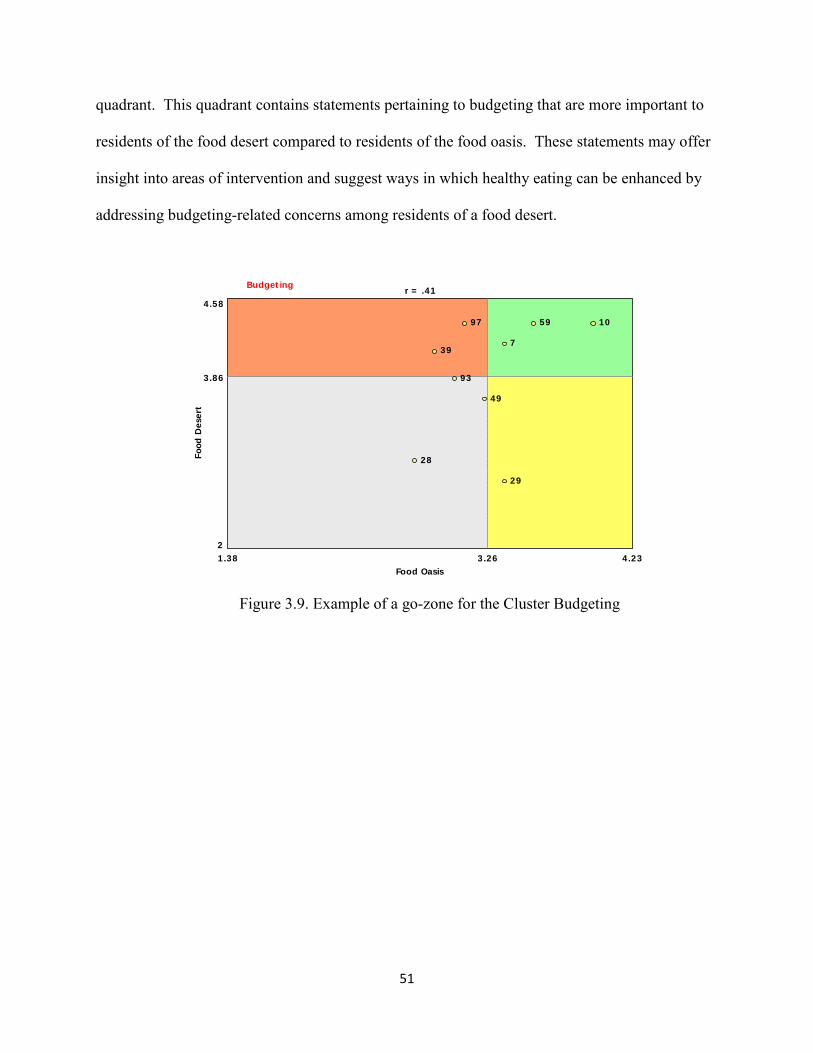
51
quadrant. This quadrant contains statements pertaining to budgeting that are more important to
residents of the food desert compared to residents of the food oasis. These statements may offer
insight into areas of intervention and suggest ways in which healthy eating can be enhanced by
addressing budgeting-related concerns among residents of a food desert.
Budgeting
3.261.38 4.232
4.58
Food Oasis
Food
Des
ert
3.86
7
10
28
29
39
49
59
93
97
r = .41
Figure 3.9. Example of a go-zone for the Cluster Budgeting

52
4.0 CHAPTER FOUR: MANUSCRIPT TWO
FACTORS INFLUENCING FOOD BUYING PRACTICES IN RESIDENTS OF A
FOOD DESERT AND A FOOD OASIS
Renee E. Walker, M.P.H.
University of Pittsburgh
Graduate School of Public Health
Department of Behavioral and Community Health Sciences
Pittsburgh, PA

53
4.1 ABSTRACT
It is widely documented that consuming a diet of fruits and vegetables leads to better
health outcomes. While studies report that proximity to a supermarket influences access to
healthy and nutritious foods, there is little known about additional factors that influence food
buying practices and subsequently healthy eating, specifically within areas with different
supermarket access. The goal of this paper is to identify these factors, explore how they are
related, and how these factors influence healthy eating. Study participants were twenty-five men
and women from two low-income zip codes in Pittsburgh, PA. Twelve participants were
recruited from a zip code designated a food desert due to the lack of a supermarket within 0.5
miles of the center of the zip code. Thirteen participants were recruited from a zip code, a food
oasis, characterized by the presence of a supermarket. Participants engaged in the concept
mapping process, a mixed methods approach that allows participants to identify, list, and
organize ideas according to their perceptions. Participants identified 121 unique statements as
factors that influence food buying practices. Utilizing a sorting process, statements were
grouped by participants into 12 clusters, or concepts that represent their perceptions. Examples
of clusters include Making Ends Meet, Transportation, Access Issues, Budgeting, Neighborhood
Issues, and Quality Healthy Foods. Results of the rating process which allowed participants to
rate each statement, according to importance, showed that overall, the average cluster ratings for
residents of the food desert were higher than residents of the food oasis. The results of this study
highlight perceptions of factors and the relative importance of these factors for influencing food
buying practices among residents with different supermarket access. Awareness of these factors
are important for policy and program development geared at increasing access to and
consumption of healthy and nutritious foods for residents of a food desert and food oasis.

54
4.2 INTRODUCTION
In the U.S. there is a degree of unevenness in supermarket distribution with many urban
areas lacking a supermarket (Giang et al., 2008). These areas of exclusion are commonly
referred to in the literature as food deserts. The phrase “food desert” has been used to describe
neighborhoods with varying characteristics. In some instances, food deserts have been used to
refer to areas without a supermarket (Short, Guthman, & Raskin, 2007). In other instances, food
deserts refer to urban areas that lack affordable and healthy foods (Wrigley, Warm, Margetts, &
Whelan, 2002). In a study by Kaufman et al. (1997), findings show that the costs of food was
higher in urban areas compared to suburban areas due to the higher operating costs in urban
areas. Other studies suggest that the higher prices are a result of the smaller quantities of food
items and the increased amount of processed foods that are available in smaller stores in urban
neighborhoods (Kimberly Morland et al., 2002b). An unfortunate consequence is that compared
to suburban areas, urban areas tend to have a higher percentage of low-income households that
experience financial difficulties in making ends meet (Philip R. Kaufman et al., 1997).
Increasingly, studies focusing on the neighborhood food environment are becoming more
prevalent due to the importance the local food environment has gained for offering healthy food
options for residents (Giang et al., 2008; Lewis et al., 2005; Moore & Roux, 2006; Zenk et al.,
2005). For example, results from a study by Morland et al. (2002) looking at the distribution of
food stores by neighborhood wealth and racial segregation show that African American residents
residing in a census tract with one or more supermarkets were more likely to meet the
requirements for daily fruit and vegetable consumption compared to those residing in a census
tract without a supermarket. Additionally, one of the few pre/post evaluation studies conducted
show that introducing a new supermarket into a food desert was associated with an increase in

55
fruit and vegetable consumption (Wrigley et al., 2002). Similarly, a study comparing food stores
in San Diego, CA found that supermarkets carried twice as many healthy and nutritious foods
compared to smaller neighborhood grocery stores, and four times as many healthy and nutritious
foods as neighborhood convenience stores (Sallis, Nader, & Atkins, 1986).
The breadth of knowledge regarding food deserts have focused primarily on physical
access to healthy and nutritious food (Donald Rose & Richards, 2004; Whelan, Wrigley, Warm,
& Cannings, 2002) and the benefits that result from increasing access to supermarkets (Giang et
al., 2008). Studies suggest that increased access to a supermarket is associated with lower rates
of overweight and obesity (K Morland, Diez Roux, & Wing, 2006; Powell et al., 2007). Other
studies show that increased access to a supermarket increases fruit and vegetable consumption
(Cheadle, Psaty, Curry, Wagner, Diehr, Koepsell et al., 1991; Kimberly Morland, Wing, & Diez
Roux, 2002a; Donald Rose & Richards, 2004). Although useful information can be gleaned
from these findings, physical access issues do not pose the sole constraints to healthy eating.
These analyses offer little insight into additional factors that are involved in food purchasing and
consumption patterns of food desert residents.
Previous studies tend to focus on measures that have been studied extensively in food
desert research: cost, availability, access, etc. Previous studies fail to allow participants to freely
generate, from their perspectives, ideas that are important to them as a result of living in a food
desert. While these past studies have made significant contributions to the literature, they do not
take into consideration the numerous factors that are involved in decisions people make
regarding what foods they buy, where they shop for food and when they purchase food. These
factors, which warrant additional research, are critical to understanding facilitators and barriers

56
to healthy eating and can offer insight into policies and programs geared towards promoting
healthy eating. The research question addressed in this research is:
What are perceptions of factors influencing food buying practices among residents of an
urban food desert and residents of an urban food oasis?
4.3 METHODS
The first step in completing this research study was to identify two zip codes in
Pittsburgh, PA, one categorized as a food desert, the other as a food oasis. First, the residential
zip codes in Pittsburgh were categorized by food desert status. This involved utilizing the online
yellow pages located at www.yellowpages.com to identify distance to the nearest supermarket.
This method has been used in the literature as an accurate means of identifying addresses based
on latitudinal and longitudinal coordinates (Estabrooks et al., 2003). For this study, a food desert
is defined as a geographic area that does not have a large chain supermarket within 0.5 miles
from the zip code centroid, the center of the defined area identified by latitude and longitude
coordinates. A distance of 0.5 miles is consistent with the literature that defines food deserts in
terms of time required to walk a distance to the nearest supermarket. It is suggested that an
approximate one-way walking time in excess of 15 minutes for an adult in an urban area is a
proxy for a food desert (Apparicio et al., 2007). On the other hand, a food oasis will be used to
describe a geographic area that contains a supermarket within 0.5 miles of the center of the zip
code.

57
Then, percentage of families below the federal poverty line, as determined by the US
Census Bureau, was determined and used as a proxy for neighborhood poverty status. The use of
families below the federal poverty line as a proxy for neighborhood poverty status is consistent
with previous studies focusing on neighborhood poverty status (Zenk et al., 2005). Based on
distance to the nearest supermarket from the center of the zip code (food desert status) and
families living below the federal poverty line (neighborhood poverty status), the two zip codes
were identified. The two zip codes included in the studied were 15207 (food desert) and 15201
(food oasis).
4.3.1 Recruitment
Recruitment of study participants took place over a four-week period in January 2009 and
continued until 15 participants in each zip code had enrolled. Recruitment involved a modified
sampling technique that produced a sample based on referrals from people who knew others who
met the inclusion criteria (Magnani et al., 2005). The referrals were made from staff from social
service agencies, such as neighborhood clinics, senior centers, and food banks, and from
participants who had already been recruited to participate in the study. A study recruitment flyer
was developed and included information about the study and a contact number to call if
interested. When a potential participant called the number, they were asked if they: 1. were at
least 18 years of age, 2. lived in either zip code 15201 or 15207, and 3. had lived there for the
past 12 months. If the participant answered “yes” to these three questions, the purpose and the
requirements of the study were described. If the caller was still interested in participating after
every question was answered, the caller was enrolled in the study and mailed a consent form.
Instructions were given to read the consent form thoroughly and to bring to the first group
session.

58
4.3.2 Concept Mapping Methodology
The methodology used in this study was concept mapping. Concept mapping is an integrated
quantitative and qualitative methodology that allows hypotheses to be generated (Trochim,
1998). Trochim (1998) describes concept mapping as a participatory research method that yields
a conceptual framework for how a group views a particular topic or aspect of a topic.
Traditionally, concept mapping has been used in to guide program planning and evaluation. The
process helps individuals think effectively as a larger group without compromising individual
contributions (Kane & Trochim, 2007). In addition to its intended use in program planning and
evaluation (Kane & Trochim, 2007), concept mapping has been applied extensively in
community settings. For example, Burke et al. (2006) utilized concept mapping to explore
perceptions of neighborhood characteristics related to intimate partner violence among rural and
suburban women (J. Burke et al., 2006). Concept mapping relies on participants to generate
statements and short phrases in response to a focus prompt offered by the researcher.
Participants then group the statements into piles by sorting similar statements together.
Traditionally, concept mapping involves six steps: preparation, generation of statements,
structuring of statements, representation, interpretation of maps, and utilization of maps.
1. Preparation – Preparation for the concept mapping sessions involved recruiting
participants, locating places convenient for participants to conduct the group sessions,
and identifying a focus prompt that was to serve as the basis of the brainstorming session.
2. Generation of statements – Participants were asked to brainstorm words and short phrases
in response to the focus prompt “What things, good or bad, influence your food buying
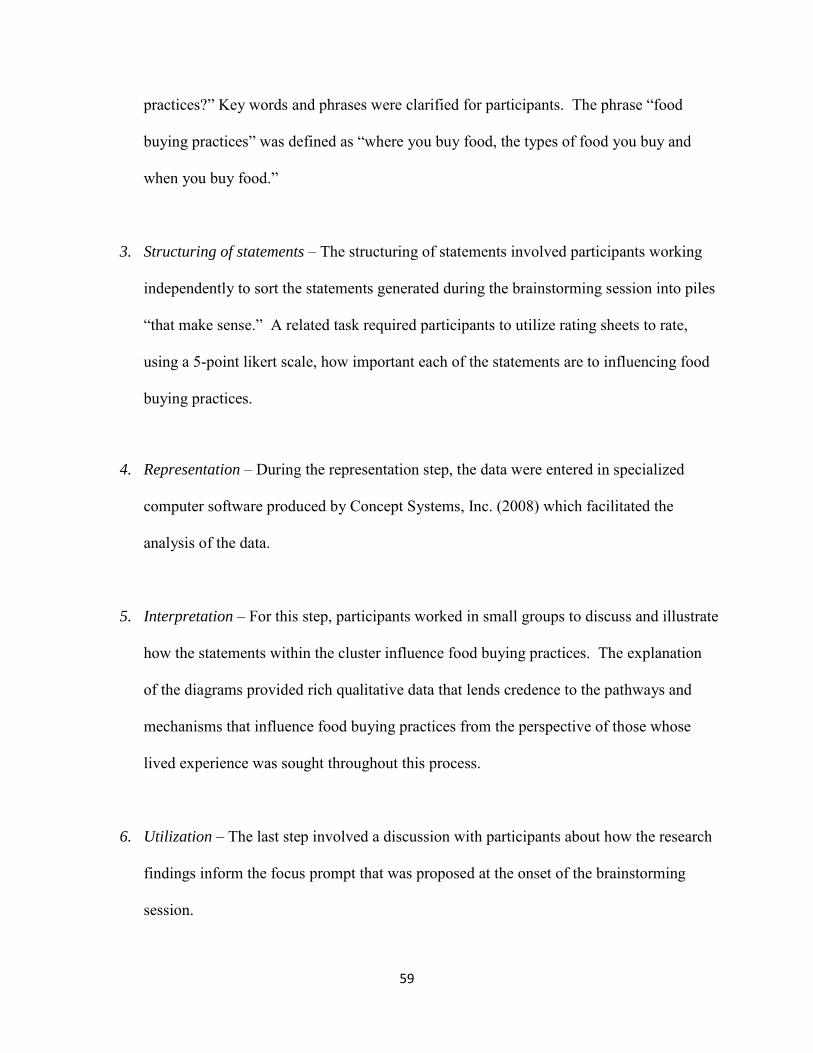
59
practices?” Key words and phrases were clarified for participants. The phrase “food
buying practices” was defined as “where you buy food, the types of food you buy and
when you buy food.”
3. Structuring of statements – The structuring of statements involved participants working
independently to sort the statements generated during the brainstorming session into piles
“that make sense.” A related task required participants to utilize rating sheets to rate,
using a 5-point likert scale, how important each of the statements are to influencing food
buying practices.
4. Representation – During the representation step, the data were entered in specialized
computer software produced by Concept Systems, Inc. (2008) which facilitated the
analysis of the data.
5. Interpretation – For this step, participants worked in small groups to discuss and illustrate
how the statements within the cluster influence food buying practices. The explanation
of the diagrams provided rich qualitative data that lends credence to the pathways and
mechanisms that influence food buying practices from the perspective of those whose
lived experience was sought throughout this process.
6. Utilization – The last step involved a discussion with participants about how the research
findings inform the focus prompt that was proposed at the onset of the brainstorming
session.

60
All concept mapping sessions were conducted in private rooms at community agencies located
within each zip code. This study was approved by the University of Pittsburgh Institutional
Review Board.
4.4 DATA ANALYSIS
A strength of the concept mapping process is in the ability of the group to manage a
complex topic without losing important detail (Kane & Trochim, 2007). One of the key
components of concept mapping is the analytic process and mapping of the data generated during
the structuring of the statements step. Data analysis begins with individual sorting and rating
data and ends with a variety of tools (maps, lists of statements, reports, etc.) to be utilized during
the interpretation step (Kane & Trochim, 2007). Data analysis involves three core steps which
will be described in more detail below: 1. Managing sort and rate data, 2. Multidimensional
scaling, and 3. Hierarchical cluster analysis.
During the representation step, the data from the sorting and rating process were entered
into the Concept Systems, Inc. software ("Concept Systems, Inc.," 2008) for analysis. Utilizing
quantitative techniques, multidimensional scaling was first performed whereby data across
individuals were processed to produce an aggregate group product. The resultant concept map, a
“point map” illustrates points on the map representing the location of each of the statements
generated in the brainstorming session. Points that are in close proximity represent statements
that were sorted together more frequently by participants. Points that are further away were
grouped together less frequently by participants, suggesting that they are not as similar as
statements in closer proximity. The next analysis applied, hierarchical scaling, involved
partitioning the point map into clusters that represent unique concepts. The number of clusters

61
formed was modified so that the final number of clusters selected accurately represented the
concepts that hinder healthy eating among study participants.
The rating sheets that participants were required to complete during the second session
were incorporated into the concept maps to illustrate how important each item and cluster is to
influencing healthy eating. From this rating, a “pattern match”, a display that allows average
cluster ratings to be compared between two variables, was performed. For this analysis, the two
variables were food desert and food oasis. This “ladder-graph” representation of the data
provides information regarding how strongly correlated the two variables in comparison are. A
Pearson product-moment correlation is calculated to represent the relationship between the two
variables.
4.5 RESULTS
4.5.1 Participant Characteristics
Twenty-five participants were recruited to participate in the concept mapping process.
Twelve participants were residents of a zip code that lacks a supermarket within 0.5 miles of the
center of the zip code, or a food desert. Thirteen participants were residents of a zip code that has a
supermarket within 0.5 miles of the centroid of the zip code, or a food oasis. The median age was
46.5 years. Nearly one-third of the sample (32%) reported owning a car. The racial/ethnic
composition of the sample was nearly half Caucasian and half African American. The 48%
Caucasian and 48% African American composition of the group was unintentional and
unexpected. When recruitment began, it was expected that the sample would reflect the
racial/ethnic composition of each zip code. The racial composition of the food desert is 79.1%
Caucasian and 18.8% African American. Similarly, Caucasians make up 77.1% of the

62
population in the food oasis while African Americans make up 19.8%. Compared to participants
in the food oasis, those residing in a food desert reported a greater distance to the bus and a
longer trip to the store. Nearly one-third of the participants from the food oasis were able to
walk to the store. Table 4.1 displays additional participant characteristics.
Table 4.1. Participant Characteristics by Food Desert Status Zip code Characteristic Food Desert
(15207) Food Oasis
(15201) Total
Total number of participants
12 (48%) 13 (52%) 25 (100%)
Age Median age (years)
42.8
47.5
46.5
Sex Male Female
2 (16.7%) 10 (83.3%)
1 (7.7%) 12 (92.3%)
3 (12%) 22 (88%)
Race & Ethnicity African American Caucasian Other
6 (50.0%) 6 (50.0%) 0 (0%)
6 (46.2%) 6 (46.2%) 1 (7.7%)
12 (48%) 12 (48%) 1 (4%)
Car ownership Do not own car & hard to find a ride Do not own car & able to find a ride Own car
5 (41.7%) 4 (33.3%) 3 (25.0%)
4 (30.8%) 4 (30.8%) 5 (38.5%)
9 (36%) 8 (32%) 8 (32%)
Nearest bus stop (blocks) Range Average
2-20 7.42
0-30 3.69
0-30 6.23
Number of different bus routes near home Range Average
1-4 2.60
2-4 2.83
1-4 2.71
Bus frequency < 30 minutes > 30 minutes Unknown
7 (58.3%) 4 (33.3%) 1 (8.3%)
10 (77%) 3 (23.1%) 0 (0%)
17 (68%) 7 (28%) 1 (4%)
Transportation to the store Drive own car Get a ride Take the bus Walk Other
3 (25.0%) 4 (33.3%) 4 (33.3%) 0 (0%) 1 (8.3%)
4 (31%) 2 (15.4%) 2 (15.4%) 4 (31%) 1 (7.7%)
7 (28%) 6 (24%) 6 (24%) 4 (16%) 2 (8%)
Number of minutes to the store Range Average
10-60 29.17
5-30 16.42
5-60 22.79
From the brainstorming session, participants from the food desert generated 125
statements while participants from the food oasis generated 105 statements. Examples of
statements generated by participants from the food desert include “aftertaste of healthy foods is

63
not good”, “depression”, and “cab service won’t come to certain neighborhoods.” Examples of
statements generated by participants from the food oasis include “planning weekly menus”, “day
old sales for fruits and vegetables”, and “making choices between buying food and paying bills.”
Both of these lists were consolidated in a process that removed duplicate statements and grouped
similar statements together. For example, the statements “fuel perks” and “gas discount”,
generated by participants of the food desert, were consolidated into the unique statement “gas
discount perks.” The resultant master list contained 121 unique statements. Examples of the
unique statements include “coupons”, “when you have the money”, “television commercials”,
and “food expiration date.” The 121 statements were partitioned or clustered into a map of 12
clusters that was agreed upon by participants from both groups as accurately expressing their
perceptions of concepts that influence their food buying practices. Each of the 12 clusters
contained statements ranging in number from 6 to 15, depending on how participants sorted the
statements generated during the brainstorming process. After reviewing the statements within
each cluster, participants agreed upon a cluster name that represented the statements within the
cluster. Examples of cluster names include Neighborhood Issues, Lifestyles, and Budgeting.
Examples of statements in the Neighborhood Issues cluster include “store closing”, “need more
neighborhood stores” and “different circulars for different neighborhoods.” Statements sorted in
the Lifestyles cluster include “eat what is in the refrigerator/cupboard”, and “shop when you are
hungry.” The cluster Budgeting includes statements such as “double and triple coupons”, “good
price”, and “quantity of items on coupons.” Figure 4.1 illustrates the point cluster map generated
by the sorting process. Each of the statements is a point on the map (represented by a statement
number) with points in close proximity to each other representing statements participants
considered more closely related. Points that are further away represent statements participants

64
considered less related. The bolded numbers represent the cluster number. Table 4.2 can be
referenced to identify the cluster name. The statement numbers (unbolded numbers represented
as points on the map) presented in Figure 4.1 can be linked to Table 4.3 to identify the exact
statement name.
1
2 3
4
5
6
7 8
9
10
11
12
1
2
3
4 5 6
7
8
9
10
11 12
13
14
15 16
17 18
19
20
21
22
23 24
25 26
27
28 29
30
31
32
33
34
35 36
37
38
39
40 41
42
43
44
45
46
47
48
49
50
51
52
53
54
55
56
57
58
59
60
61 62
63 64
65 66
67
68
69
70
71
72
73
74
75
76
77
78
79
80
81
82
83
84 85
86
87
88
89
90
91 92
93 94
95
96
97
98
99
100
101
102
103
104
105 106
107
108
109
110
111
112
113
114 115
116
117
118
119
120
121
Figure 4.1. Point Cluster Map
Table 4.2. Cluster Labels for a 12-Cluster Solution Map Cluster Number
Cluster Label
1 High Risk 2 Information I Depend On 3 Lifestyle 4 Areas for Improvement 5 Making Choices 6 Making Ends Meet 7 Neighborhood Issues 8 Transportation 9 Access Issues 10 Quality Healthy Foods 11 Budgeting 12 Concerns About the Stores

65
4.5.2 Average Cluster and Statement Ratings
This study set out to explore similarities and differences in food buying practices among
residents of a food desert and food oasis. The rating process was used to further explore how
clusters generated influenced food buying practices, facilitated healthy eating and hindered
healthy eating. Participants were asked to rate on a scale of 1 (not at all strong) to 5 (extremely
strong) how strong each statement within the 12 clusters influenced food buying practices,
facilitated healthy eating and hindered healthy eating. For this analysis, the focus was on the
“influences food buying practices” rating scale.
Table 4.3 outlines the average cluster ratings for residents of the food desert and residents
of the food oasis. The table is separated by cluster with the cluster name bolded. Underneath the
cluster name is the list of statements that were grouped together in this cluster. Next to each
statement is a number in parenthesis. This number refers to the actual statement number and can
link the statements to the location on a point map as in Figure 4.1. The numbers do not have any
substantive meaning. In the two columns next to the cluster name and corresponding statements
are average cluster and statement ratings for food desert and food oasis participants. During the
structuring of statements step, participants were asked to rate each statement in terms of how
strongly the statement influences food buying practices. The rating scale ranged from 1 (not at
all strong) to 5 (extremely strong). The average cluster ratings reflect the average ratings given
by each group. For example, the overall cluster Making Ends Meet received an average rating of
3.49 for food desert participants and 2.95 for food oasis participants. Within this cluster,
statement ratings for food desert participants ranged from 2.50 (for the statement “got a raise and
lost food stamps”) to 4.33 (for the statement “food bank”). For food oasis participants, statement
ratings ranged from 2.23 (for the statement “got a raise and lost food stamps”) to 3.46 (for the

66
statement “food bank”). Overall, the average cluster ratings for residents of the food desert were
higher than residents of the food oasis. This suggests that residents of the food desert perceived
each cluster as having a stronger influence on food buying practices than residents of the food
oasis.

67
Cluster Name and Statements (Statement ID Number)
Influences Food Buying Practices
Cluster Name and Statements (Statement ID Number)
Influences Food Buying Practices Food Desert Food Oasis Food Desert Food Oasis
HIGH RISK Lifestyle (73) Fruits and vegetables are expensive (56) Emotional eating (45) Aftertaste of healthy foods is not good (1) Think about food all the time (109) Eating junk is what I can afford (42) Junk food is cheap (69) Habitual eating (62) Low sodium (79) Cheaper to eat fat foods (17) Eating socially (43) Compulsive shopper (20) Buying junk (14)
3.48
4.17 4.17 3.67 3.25 3.67 3.75 4.00 3.25 2.75 3.42 2.92 3.00 3.25
2.50
3.77 3.15 2.62 2.85 2.38 2.31 1.92 2.33 2.69 2.00 2.38 2.15 1.92
MAKING CHOICES Fixed income (48) When you have the money (117) Healthy food is where people have money (63) Wonder if I’m going to have food (120) Fresh food not available (55) Lactose intolerant (72) False advertising (46) McDonald’s is one-stop shopping (81) Diabetes (34)
3.28
4.42 4.33 4.00 3.42 2.75 2.25 3.00 3.25 2.08
2.73
3.69 3.23 2.62 2.69 2.46 2.77 2.38 2.00 2.69
INFORMATION I DEPEND ON Cost (27) Choosing how to spend money (18) Word of mouth of sales (121) Cooking healthy (23) Food preparation (52) Read labels (94) Don’t buy what you can’t afford (37) Coupons (30) Buying frozen foods which are better than canned (13) Day old sales for fruits and vegetables (32) Love to cook (78) Farmer’s market (47) Generic brands (58)
3.54
4.17 4.25 2.92 3.17 3.58 2.75 4.25 4.08 3.42 3.67 3.08 3.00 3.67
3.49
3.77 3.62 3.15 3.77 3.38 3.23 3.23 3.69 3.46 3.31 3.85 3.85 3.08
MAKING ENDS MEET Making choices between buying food and paying bills (80) Food stamps (53) Customer service (31) Food bank (50) Got a raise and lost food stamps (60) Senior coupons for farmer’s markets (99)
3.49
3.92 3.92 3.50 4.33 2.50 2.75
2.95
3.08 3.15 3.15 3.46 2.23 2.62
LIFESTYLES Cooking in one pot (24) Shop when you are hungry (103) Eat what is in the refrigerator/cupboard (41) Sale advertisement delivered late (96) Eat the same thing (40) Meat available from hunting (82)
3.18
2.67 3.25 3.67 3.00 4.33 2.17
2.69
3.15 2.46 3.08 2.77 2.62 2.08
NEIGHBORHOOD ISSUES Need more neighborhood stores (84) Economy (44) War increases prices (114) Poor neighborhoods (89) Store closing (106) Long lines (77) Different circulars for different neighborhoods (35)
3.82
3.83 4.50 4.25 2.92 4.08 3.50 3.67
2.93
3.46 3.08 3.15 2.77 2.77 2.62 2.69
Note: the 121 statements are presented within their clusters (bolded) and the parenthetical numbers refer to the actual statement number and can be used to link the table information to Figure 4.1. The numbers do not have any substantive meaning. Ratings represent how strongly each statement influences food buying practices. Ratings range from 1 (not at all strong) to 5 (extremely strong).
Table 4.3. Average Cluster and Statement Ratings by Food Desert Status

68
Cluster Name and Statements (Statement ID Number)
Influences Food Buying Practices
Cluster Name and Statements (Statement ID Number)
Influences Food Buying Practices Food Desert Food Oasis Food Desert Food Oasis
AREAS FOR IMPROVEMENT-THE DAY WILL GET BETTER Source of income (105) Need to eat to live (85) Bush administration (9) Help from organizations (64) Bad government policy (6) Bad food packaging (5) Stress (107) Television commercials (108) Bad attitudes from store employees (4) WIC vouchers (119)
3.60
4.50 3.67 3.50 4.25 3.83 4.00 3.83 3.33 3.08 2.00
3.03
3.85 3.69 3.31 3.38 3.38 2.92 2.69 2.23 2.85 2.00
TRANSPORTATION Weather (115) Need a car (83) Distance to shops (36) Location (75) Area (2) Walking (113) Ride bike to store (95)
3.20
3.33 3.25 3.25 4.33 3.50 2.58 2.17
3.16
3.23 3.08 2.92 3.77 3.31 3.31 2.54
ACCESS ISSUES High gas prices (66) Where you live (118) Car service cost (16) Transportation (110) Bus lines being cut so stores not accessible (8) Lack of transportation (71) Depend on the bus lines (33) High bus fare (65) Jitney charges for bags and people (68) Cab service won’t come to certain neighborhoods (15) Free bus for Social Security or Medicare (54) Location of the bus and shuttle (76) Ship of Zion shuttle (101) Only take four bags on the bus (86)
3.24
4.08 4.08 3.50 4.08 2.83 3.25 3.00 2.92 3.00 2.92 2.75 3.25 3.08 2.58
2.79
3.31 3.38 2.31 3.00 2.85 3.08 2.85 3.00 2.77 2.31 2.62 2.69 2.15 2.77
BUDGETING Cost more to buy less (28) Good price (59) Sales (97) Bargains (7) Buy 1 get 1 free (10) Flyers and newspapers to see sales (49) Quantity of items on coupons (93) Coupon sharing (29) Double and triple coupons (39)
3.93
3.58 4.50 4.08 4.17 4.33 3.58 4.08 2.92 4.08
3.32
2.92 3.54 3.31 3.46 4.08 3.15 3.08 3.62 2.77
QUALITY HEALTHY FOODS Knowledge of food prices (70) Quality of food (91) Availability of sale items (3) Quantity (92) Share information with others (100) Shopping frequently for fresh produce (104) Buy what you need (12) Buy in bulk (11) Portions for single people (90) Grocery list (61) Don’t mind paying more for organic/better food (38) Cooking shows (25) Planning weekly menus (88) Organic foods (87) Shop for kids and grandkids (102)
3.23
3.67 3.92 3.58 4.33 2.83 2.67 4.25 3.25 3.00 3.25 2.64 2.58 2.83 2.75 2.83
3.27
3.54 3.85 3.15 3.23 3.31 3.54 4.00 3.38 2.54 3.15 3.38 2.92 3.23 3.31 2.46
CONCERNS ABOUT THE STORES Convenience (22) Gas discount perks (57) Clean and organized store (19) Variety (112) Food expiration date (51) Well-stocked shelves (116) Hours (67) Consolidate trips-go to many stores one day per week (21) Local foods (74) Season (98) Co-op shopping (26) Treatment of store employees (111)
3.42
4.00 3.50 3.58 3.50 3.50 4.00 3.92 2.83 3.67 3.58 2.00 3.00
3.04
3.23 2.38 3.31 3.15 3.08 3.23 2.46 3.31 3.46 3.38 3.00 2.46
Note: the 121 statements are presented within their clusters (bolded) and the parenthetical numbers refer to the actual statement number and can be used to link the table information to Figure 4.1. The numbers do not have any substantive meaning.
Ratings represent how strongly each statement influences food buying practices. Ratings range from 1 (not at all strong) to 5 (extremely strong).
Table 4.3 continued

69
While many statements identified by participants in this study are consistent with existing
studies, there are a wide range of factors that have not been studied and are worthy to note.
Statements identified that have not been studied or poorly explored in depth in existing literature
include “bad government policy”, “television commercials”, “cab service won’t come to certain
neighborhoods”, “jitney charges for bags and people”, and “double and triple coupons.” An
example of bad government policy was given by a food oasis participant who explained that
eligibility for food stamps was denied once employment was obtained. Although employed,
there was not enough money to obtain food. Policies that affect the ability to participate in food
assistance programs were identified as influencing food buying practices. Participants identified
being influenced by television commercials as influencing food buying practices. Specifically, it
was mentioned how enticing television commercials are in promoting the food item being
advertised. Related to transportation concerns is the issue of cab service not entering certain
communities and bus lines being cut. As a result, participants rely on jitneys as an alternative
mode of transportation. However, participants mentioned that jitney drivers take advantage of
the consumer by charging for people and bags. This practice influences the amount of groceries
that are purchased when relying on jitney services. Statements pertaining to the use of coupons
were identified as influencing food buying practices. Participants appreciated stores that allowed
the value of a coupon to be doubled or tripled. Additionally, differences in perceptions of factors
identified were noted between food desert and food oasis participants. These differences are
noted below.

70
Statements unique to participants in the food desert fall into three categories: survival,
mental health, macro-level factors. Unlike participants in the food oasis, participants in the food
desert identified statements that related to food being a means of survival. Examples of
statements that fall into this category include “need to eat to live”, “wonder if I’m going to have
food”, and “eating junk is what I can afford.” The second category, mental health, includes
statements such as “stress”, “emotional eating”, “food is an addiction”, and “depression.” The
third category, macro-level factors, is based on statements that influence food buying from a
policy or corporate standpoint. Examples of statements within this category include “different
circulars for different neighborhoods”, “corporate taking advantage of the consumer [by offering
smaller food quantities for more money], and “war increases prices.”
Food Desert Participants
Statements unique to participants in the food oasis centered around two categories. First,
luxuries or conveniences surrounding the food environment and shopping experiences. Second,
taking advantage of available resources. Statements that were identified as luxuries include
“don’t mind paying more for organic/better food”, “need more neighborhood bakeries”,
“organic food stores have decent prices and good quality”, and “shopping frequently for fresh
produce.” Knowledge of resources available within the food oasis was discussed during the
group sessions. Examples of statements that highlight awareness and utilization of these
resources include, “information provided by Catholic Charity”, “Salvation Army has bread on
Tuesdays”, “senior coupons for farmer’s market”, “SNAPS: support for low-income”, and “WIC
vouchers.”
Food Oasis Participants

71
To illustrate the differences in average cluster ratings, Figure 4.2 presents a pattern
match, which compares average cluster ratings for how strongly each cluster influences food
buying practices for residents of the food desert and food oasis. The pattern match uses a “ladder
graph” representation where a perfect correlation would be a horizontally straight line. The
bolded numbers 3.93 at the top of the display and 2.5 at the bottom represent the maximum and
minimum average cluster ratings given to a cluster. In other words, this value represents how
strongly each cluster is perceived to influence food buying practices for food desert and food
oasis participants. The rating scale ranged from 1 (not at all strong) to 5 (extremely strong). For
example, the cluster Budgeting was the highest rated cluster for food desert participants with an
average cluster rating of 3.93. This suggests that the cluster Budgeting is perceived as the most
important for influencing food buying practices for food desert participants. The cluster with the
lowest average cluster rating was High Risk for food oasis participants, which received a rating
of 2.50. This rating suggests that the cluster High Risk is perceived as the least important for
influencing food buying practices. The r =0.3 value located at the bottom of the display is the
Pearson product-moment correlation, which represents the correlation between average cluster
ratings between food desert and food oasis participants. In this illustration, a correlation of 0.3
represents a small correlation between the food desert and food oasis participants.

72
Figure 4.2. Pattern Match Comparing Factors that Influence Food Buying Practices Between Participants from the Food Desert and Food Oasis For the interpretation step, clusters that could offer the most insight into perceptions of
factors that influence food buying practices among food desert and food oasis participants were
selected. The selection of the most appropriate clusters involved a process of analyzing each
cluster for differences in cluster ratings, rankings, and the potential contribution to the breadth of
knowledge pertaining to understanding these perceptions. From the pattern match in Figure 4.2,
there are 3 clusters where the average ratings for food desert participants and food oasis
participants were similar. These clusters, Information I Depend On, Quality Healthy Foods and
Transportation are easily identified by the nearly horizontal lines formed in the pattern match.
The average cluster ratings for these clusters for food desert and food oasis participants are 3.54
and 3.49, respectively, for the cluster Information I Depend On. For Quality Healthy Foods,
average cluster ratings are 3.23 and 3.27 for food desert and food oasis participants, respectively.
r = .3
Food Desert Food Oasis
3.93
2.5
3.93
2.5 High Risk
Lifestyles
Lifestyles
Transportation
Making Choices
Quality Healthy Foods
Access Issues
Access Issues
Neighborhood Issues
Making Choices
Making Ends Meet
Concerns About the Stores
Areas for Improvement
High Risk
Concerns About the Stores
Making Ends Meet
Transportation
Information I Depend On
Quality Healthy Foods
Areas for Improvement
Budgeting
Neighborhood Issues
Information I Depend On
Budgeting

73
Lastly, the average cluster ratings for the cluster Transportation are 3.20 and 3.17 for food desert
and food oasis participants, respectively. The similar cluster ratings suggest that differences in
perceived strength of association between food desert and food oasis participants related to these
clusters are minimal and do not offer any new insight into differences between the two groups.
In addition to the cluster ratings, the cluster rankings, or relative order is also important to
consider. For example, the cluster Budgeting is ranked first for food desert participants and food
oasis participants. This suggests that both groups perceive issues surrounding budgeting as
important for influencing food buying practices. Similarly, the cluster Lifestyles is ranked last
for food desert participants and second to last for food oasis participants. Again, this suggests
that both food desert and food oasis participants perceive issues of lifestyle as being less
important to influencing food buying practices. Exploring these clusters in-depth would not
offer new insight into differences in perceptions of factors that influence food buying practices
between food desert and food oasis participants. A similar rationale is true for the cluster
Concerns About the Stores. This cluster falls in the middle of all 12 clusters, ranking seventh for
food desert participants with an average cluster rating of 3.42 compared to ranking fifth with an
average cluster rating of 3.04 for food oasis participants. Compared to other clusters, the
difference in cluster ratings between food desert and food oasis participants is modest.
Furthermore, the statements within the cluster Concerns About the Stores highlight perceptions
of factors that have been studied in previous studies, including the statements “variety” and
“hours.” Similarly, the statements within the cluster Access Issues, which ranked ninth for both
food desert and food oasis participants, have been studied extensively in the literature and do not
warrant further exploration in this study. Statements within this cluster include “lack of
transportation”, and “high bus fare.” Results from a spanning analysis (results not shown) show

74
that the cluster Making Ends Meet is the cluster where many participants sorted the “leftover”
statements, statements participants were unsure how to sort. Therefore, this cluster was not
appropriate for further exploration given the “randomness” of the statements that comprise this
cluster. The cluster Making Choices was not selected for an in-depth exploration due to the
apparent relationship of the statements within the cluster. For example, the relationship of how
the statements “fixed income”, “when you have money”, and “wonder if I’m going to have food”
are related and influence food buying practices is more clear compared to other clusters. The
remaining three clusters were selected for an in-depth explanation during the interpretation step
of the concept mapping process.
4.5.3 Cluster Interpretation
Three clusters, Neighborhood Issues, Areas for Improvement, and High Risk were
selected for an in-depth explanation during the interpretation step. This process involved
participants identifying how the statements within each cluster influences food buying practices.
These clusters were selected because: 1. of the differences in cluster ratings and rankings
between participants in the food desert and the food oasis, 2. they were identified by participants
as being relevant to influencing food buying practices, and 3. the inter-relationship of the
statements within each cluster was not easily understood. The cluster ratings for the selected
clusters were: Neighborhood Issues (food desert =3.82, food oasis =2.93), Areas for
Improvement (food desert =3.82, food oasis =2.93), and High Risk (food desert =3.48, food oasis
=2.50). Participants were assigned to small groups where they collectively diagrammed how the
statements within the selected clusters influenced food buying practices. For each of the selected

75
clusters, participants from the food desert and participants from the food oasis identified the
same factor as being the most important for influencing food buying practices.
Neighborhood Issues
Among the statements that comprise the cluster Neighborhood Issues (see table 4.3),
participants in both groups identified the economy as being the most important factor for
influencing food buying practices. This is supported by the statement ratings. The statement
“economy” was the highest rated statement within this cluster for participants in the food desert
and second highest for participants in the food oasis. Participants in the food desert rated
“economy” 4.50 and participants in the food oasis as 3.08. Participants from both groups stated
that the economy is the most important factor because the economy plays a role in neighborhood
store closures which forces residents to shop at smaller convenience stores that do not have the
quality or quantity of healthy foods. As one participant explained:
The bad economy leads to poor neighborhoods and store closings. Poor neighborhoods end up losing the stores and now we need more neighborhood stores. – Food oasis participant in response to how the statements within the Neighborhood Issues cluster influence food buying practices.
Areas for Improvement
Among the statements that comprise the cluster Areas for Improvement (see table 4.3),
participants in both groups identified “source of income” as being the most important factor for
influencing food buying practices. This is consistent with the statement ratings. The statement
“source of income” was the highest rated statement within this cluster for both groups.
Participants in the food desert rated Source of income 4.50 and participants in the food oasis

76
3.85. Participants from both groups stated that source of income is the most important factor
because without sufficient income, they must choose how to spend their limited funds.
Participants spoke of choosing to pay a bill over eating healthy and nutritious foods. An
example is highlighted by a participant in the food desert:
Our main thing was source of income because if you don’t have any money, it affects everything. It affects your bills, whether you can purchase foods. Help from organizations can help to a point to get food, like the food bank. We really need more help, because what happens when you’re not able to get the food stamps and you have no income? I’m worried because I applied for emergency unemployment and I’m still trying to get something. What do you do when you have nothing? I eat a bag of potato chips to pay a bill because it is cheaper to buy a bag of potato chips when the bill has to be paid. And that’s a horrible way to live your life. – food desert participant in response to how the statements within the Areas for Improvement cluster influence food buying practices. High Risk
Among the statements that comprise the cluster High Risk (see table 4.3), participants in
both groups identified “lifestyle” as being the most important factor for influencing food buying
practices. This is consistent with the statement ratings. The statement “lifestyle” was the highest
rated statement within this cluster for both groups. Participants within the food desert rated
“lifestyle” as 4.17 and participants within the food oasis as 3.77. Participants from both groups
stated that lifestyle is the most important factor because food is part of their lifestyle because
they think about food all the time. Examples of how participants explained how the statements
within the High Risk cluster are related to influence food buying practices are:
We [focused on] lifestyle because it’s all based around our life. Buying junk and compulsive shop[ping] is a lifestyle. Emotional and habitual eating because we think about food – it’s a habit. – Food desert participant in response to how the statements within the High Risk cluster influence food buying practices.

77
Lifestyle is the main objective. Lifestyle affects eating because you think about food all the time. –Food oasis participant in response to how the statements within the High Risk cluster influence food buying practices.
As noted above, the racial/ethnic composition of the sample was unexpected. The equal
number of African American and Caucasian (n=12 for each group) participants in the sample
allowed an unplanned subgroup analysis to be conducted to examine racial/ethnic differences in
perceptions of factors that influence food buying practices. Similar cluster ratings were noted
(results not shown), suggesting minimal differences in perceptions of factors that influence food
buying practices between the groups. The correlation coefficient for the “influences food buying
practices” rating scale was r =0.76, suggesting a strong correlation in perceptions of factors that
influence food buying practices between African American and Caucasian participants.
Subgroup Analysis
4.6 DISCUSSION
This research identified perceptions of factors that influence food buying practices for
residents of a food desert and residents of a food oasis. Participants identified a wide range of
factors that have not been studied or poorly explored in depth in existing literature. One
unexpected statement, “cab service won’t come to certain neighborhoods” offers insight into
residents’ perceptions of the role of jitneys in influencing food buying practices. As a result of
cabs not entering certain communities, a demand for transportation services was created. Jitneys,
unlicensed taxis, have been used to meet this demand. In many low-income areas in Pittsburgh,
jitneys aggregate in parking lots of supermarkets offering a cheaper fare than taxis (May, 2004).
Another unexpected statement, “double and triple coupons”, suggest how residents
perceive the important role of coupons in saving money, and subsequently influencing food

78
buying practices. It is understandable the monetary savings that doubling or tripling coupons can
have for the consumer. While it is unknown the type of food items that were purchased with the
coupon, it is worthwhile to explore how healthier food options can be appealing to the consumer
and coupons available for these items, redeemed at double or triple the face value.
Statements unique to participants in the food desert pertained to survival, mental health,
and macro-level factors. To understand the context in which these statements were given, it is
important to understand the history of this area and the feelings of injustice as perceived by the
residents. Participants shared examples of wrongdoings by a grocery store that is no longer
operational in their area. One example is of rancid meat purchased from larger chain
supermarkets, injected with red dye to give the appearance of fresh meat, re-packaged and sold
to residents at regular price. This community, where a supermarket does not exist, has
witnessed other business closures, including banks and schools, and where few social service
agencies exist to address unmet needs. These issues, cited in the environmental justice literature
explores how inequities in planning and zoning in poor, urban communities lead to differential
exposures to neighborhood characteristics that adversely affect health outcomes while
diminishing access to health promoting resources including supermarkets (Wilson, Hutson, &
Mujahid, 2008). These dismal conditions may offer insight into how the food desert participants
perceive their neighborhood.
Statements unique to participants in the food oasis centered around luxuries or
conveniences surrounding the food environment and shopping experiences, and taking advantage
of available resources. Like the food desert, responses may be based on the larger context in
which residents reside. Given that a supermarket is accessible to these participants, it is not
surprising that factors that influence food buying practices go beyond basic food as a means of

79
survival as observed in the food desert. According to a report published in the Pittsburgh Post
Gazette (Grant, November 2, 2007), real estate appreciation in the food oasis is the second
highest in the city of Pittsburgh. This area is part of Pittsburgh’s interior design district that
consists of shops, galleries and studios where products and services for in-home and office décor
are available ("16:62 Design Zone," 2008). With the opening of art galleries and furniture stores,
coffee shops, restaurants, and bars have followed suit. The implication is that businesses are
willing to establish in low-income, urban neighborhoods provided signs of economic
development and growth are apparent.
From the in-depth explanation from the interpretation step, concerns associated with the
economy, sources of income, and lifestyles were perceived by participants from both groups as
the most important factors for influencing food buying practices. Many small, neighborhood
businesses have closed for a variety of reasons, including the lack of business. Additionally,
food prices have increased over the past year ("Food Price Outlook," 2009), and many people
have lost their jobs. Given the current economic situation, arguably a recession by many
standards, it is not surprising that participants would perceive these factors as key factors that
influence food buying practices.
The aforementioned statements present new findings pertaining to factors that influence
food buying practices. In addition to these novel findings, statements were generated during the
brainstorming session that are consistent with the literature as influencing healthy eating among
urban residents of low-income areas. Examples of these statements pertain to concerns
surrounding the lack of transportation (Garasky, Morton, & Greder, 2004; Morton, Bitto,
Oakland, & Sand, 2005), shopping when money is available, for example, at payday or when
food stamps are available (Wooden, 2002), lack of supermarkets within their neighborhoods

80
(Alwitt & Donley, 1997; Chung & Myers, 1999), and quality and quantity of foods available
within the immediate neighborhood (Hendrickson et al., 2006).
Strengths and Limitations
A strength of this study includes the use of concept mapping as the methodology to
answer the research questions. Unlike qualitative methods such as focus groups, concept
mapping offers the participants the unique opportunity to rate items according to individual
importance and note how items are related to each other. Furthermore, this participant-driven
methodology involves the participants in each phase of the concept mapping process. This is
especially salient for exploring and understanding perspectives and viewpoints through the
interpretation and analyses of the constructed maps. Quantitatively, concept mapping uses
multidimensional scaling and hierarchical cluster analysis to examine similarities of ideas among
participants and identify the degree of similarity. These analyses, in conjunction with the rich
qualitative data collected during the early stages of the process, highlights additional strengths of
this methodology.
To the knowledge of the research team, this study is the first to investigate food buying
practices among residents of a food desert in comparison to a food oasis. Many studies
conducted in the US focus on food security as a household measure of hunger. However, food
deserts which have historically been an international phenomenon are increasingly gaining
attention nationally. Despite this increased attention, the topic is not well understood and poorly
research. A strength of this study is that it offers new information about local food
environments with a unique focus on the food environment within low-income areas in
Pittsburgh, PA.

81
Similar to other qualitative studies, this study is limited in its generalizability. This study
represents the views of 12 participants who reside in one low-income food desert in Pittsburgh
and 13 participants who reside in one low-income food oasis. As a result, our findings are not
generalizable to other food deserts and oases, and not generalizable to non low-income zip codes.
However, the purpose of this study was not to make generalizations, but to generate hypotheses.
Furthermore, the goal was to explore perceptions of the participants regarding their food buying
practices.
A second limitation of the study is in the sampling technique. A modified snowball
technique was used to yield a sample based on referrals from people who know others who meet
the inclusion criteria. The referrals were made from staff from social service agencies and
participants who had already been recruited to participate in the study. The drawback to this
method is that participants were primarily those who utilized soup kitchens or food pantries, for
instance, and friends or relatives of participants who were recruited. Referral from friends and
family is likely to account for the differences in racial/ethnic composition of the sample that does
not reflect the racial/ethnic composition of the selected zip codes. If a participant was eligible to
participate, s/he was enrolled in the study. The race/ethnicity of a potential participant or the
relationship to enrolled participants was unknown until the first concept mapping session.
Recommendations
This study represents important first steps in identifying similarities and differences in
factors that influence food buying practices based on access to a supermarket. Additional
research is needed to explore the extent to which residing in a food desert impacts health
outcomes including obesity, diabetes, heart disease and other chronic conditions that have diet as

82
a risk factor. Similarly, larger research studies are warranted that study multiple low-income
food deserts and food oases. For example, a research study that builds upon this study by
exploring perceptions of factors that influence food buying practices among residents within
households in the same food desert (and food oasis) and then between food deserts (and food
oases). These research findings could further contribute to our understanding of factors
influencing food buying practices in low-income areas.
Additionally, the qualitative nature of concept mapping focuses on the perceptions of the
participants. It could be worthwhile to triangulate these data with neighborhood data using
Geographic Information System (GIS) techniques. For example, food stores including
restaurants, convenience stores, produce markets, food pantries, and other places where
participants are able to obtain food within their immediate neighborhoods could be geocoded. A
sample of the geocoded food stores can be identified to obtain an assessment of the quality,
quantity, and brand of food items that are available to the consumer. This research could provide
a comprehensive view of neighborhood food environments that include an actual map of the food
environment, an assessment of the available food items, and the perceptions of those the local
food store is intended to serve. The results from this study highlight areas where policy
development could have the most impact in facilitating healthy eating.
There has been much debate concerning whether the presence of a supermarket increases
fruit and vegetable consumption. It is plausible that, in and of itself, a supermarket increases
access to healthy foods, but not necessarily consumption. Even if access to supermarkets is
increased, additional barriers to healthy eating exist. For instance, participants identified the
aftertaste of healthy foods as a barrier to healthy eating. The question researchers need to ask is
how is this gap bridged? Results of this study highlighted the importance of cost of food,

83
individual income and budgeting as the most salient factors for healthy eating. Addressing
concerns related to socioeconomic status is a daunting task that is beyond the scope of this study.
While poverty may drive the relationship between where one lives and healthy eating (lack of
transportation, not enough money to purchase food, the cost of healthier foods are expensive,
etc.), potential areas for intervention were identified. These areas include:
1. Accessible public transportation
. Increasing bus lines and bus times from food deserts to
supermarkets that would allow residents the opportunity to shop at full-service stores.
2. Coupons for purchasing fresh produce
. The cost of unhealthy foods was identified as
being cheaper than healthy foods. Tipping the balance in the other direction where
healthy foods are affordable, even cheaper than less healthy foods, could prove
beneficial. This recommendation does not negate the notion that the lack of knowledge
regarding fresh food preparation is a real concern and should also be addressed.

84
5.0 CHAPTER FIVE: MANUSCRIPT THREE
HOW DOES FOOD SECURITY IMPACT RESIDENTS
OF A FOOD DESERT AND A FOOD OASIS?
Renee E. Walker, M.P.H.
University of Pittsburgh
Graduate School of Public Health
Department of Behavioral and Community Health Sciences
Pittsburgh, PA

85
5.1 ABSTRACT This study explored how factors that influence food buying practices hinder healthy
eating between food secure and food insecure households in two low-income zip codes in
Pittsburgh, PA. Study participants were 25 men and women. Nine participants identified their
households as being food secure based on the United States Department of Agriculture Food
Security Scale. Sixteen participants identified their households as being food insecure.
Participants engaged in the concept mapping process, a mixed methods approach that allows
participants to identify, list, and organize ideas according to their perceptions. Participants
identified 121 unique statements as factors that influence food buying practices. Statements
were grouped by participants into 12 clusters, or concepts that represent their perceptions.
Results of the rating process showed that average cluster ratings for each cluster were higher
among food insecure participants compared to food secure participants. A secondary aim was to
explore how food security and food desert statuses impact cluster ratings. Findings show that
while both groups ranked clusters similarly, food secure participants in a food desert perceived
clusters as more important to hindering healthy eating than food secure participants in a food
oasis. Among food insecure residents in a food desert and food oasis, both groups rated clusters
similarly as being important to hindering healthy eating. Results from this study contribute to
our understanding of how food desert and food security statuses shape residents’ perceptions of
factors that influence food buying practices. These perceptions have major implications for
healthy eating and can prove beneficial for policy and program development.

86
5.2 INTRODUCTION Rates of poverty, food insecurity and hunger are increasing in the U.S (DeNavas-Walt,
Proctor, & Mills, 2004). Within the last two decades, “food insecurity” has been developed as a
measure of hunger in the United States (Bhattacharya et al., 2004). Food insecurity is defined by
national experts as “limited or uncertain availability of nutritionally adequate and safe foods or
the limited or uncertain ability to acquire acceptable foods in socially acceptable ways” (Stuff,
Casey, Szeto, Gossett, Robbins, Simpson et al., 2004). A common misperception of food
security is that having any type of food constitutes food security. Food security pertains to a
sufficient quantity of a variety of nutritious foods of a good quality that is obtained in ways that
are not intended to be extremely destructive to one’s dignity. A major cause of food insecurity is
the lack of financial resources. Families with low financial resources often go hungry, are
malnourished, experience changes in psychological, physical, or developmental states, or
diminished productivity that result from inadequate food intake due to limited access to food as a
result of store locations or financial constraints (Bhattacharya et al., 2004; Garasky et al., 2004).
The USDA developed an instrument to measure food insecurity, the U.S. Food Security
Scale (FSS) which has been used in research to measure the adequacy and stability of a
household’s food supply (Frongillo et al., 1997). It is used to estimate the number of people in
the U.S. that are hungry. The USDA incorporates the FSS into an annual survey, the Current
Population Survey, which assesses household food insecurity, how much money is spent on
food, and the extent to which government food assistance programs are utilized (Nord &
Andrews, 2002).

87
Food security is calculated from 18 questions for households with children (10 questions
for households without children). These questions ask about conditions, experiences, and
behaviors surrounding food quantity, quality, and variety (Nord et al., 2006). The results of the
2005 survey show that the prevalence of household food insecurity was 11% (12.6 million
households). This means that 11% of US households were food insecure at some point during
the year (Nord et al., 2006). This estimate was down from 11.9% in 2004. However, in 2003,
35% of households with the lowest incomes (below the poverty line) was food insecure (Nord,
Andrews, & Carlson, 2003).
Studies that focus on food security pertain to understanding the prevalence, experience,
and adverse consequences of food insecurity among the nation’s families, adults, and children
(Alaimo, 2005). These studies identify risk factors that can contribute to food insecurity. These
risk factors include financial hardships, educational attainment, race/ethnicity, family
composition, time, employment skills, health insurance status, social support, abuse, and the
availability of affordable and nutritious foods within the local food environment (Blank, 1997;
Campbell & Desjardins, 1989; Danziger, Corcoran, Danziger, & Heflin, 2000; Edin & Lein,
1997; S Mayer, 1998; S. Mayer & Jencks, 1988; Olson, Anderson, Kiss, Lawrence, & Seiling,
2004; D. Rose, 1999). These studies help conceptualize food insecurity in the U.S. and offer
information about the prevalence and burden of food insecurity, and programs available to
counter the consequences of a poor diet. However, they fail to explore food insecurity in the
greater context in which people live, specifically the food environment in which people are
required to obtain food from. Beyond financial constraints, there exist a myriad of factors that
play a role in healthy eating for both food secure and food insecure households. While these
factors have been speculated in the literature, additional research is needed to explore these

88
factors in-depth to understand how they affect healthy eating for food secure and food insecure
households. It has been shown that given the financial obligations that low-income families have
with a limited source of income, food is oftentimes the first necessity to be compromised (Edin
& Lein, 1997; S. Mayer & Jencks, 1988). Understanding the factors that are involved in the
decision-making processes involved in purchasing food and healthy eating could offer insight
into the best programs and policies needed to provide affordable, healthy and nutritious foods to
food insecure households. The research question addressed in this manuscript is:
How do residents’ perceptions of factors influencing food buying practices differ by food
security status? A secondary aim of this research is to explore how perceptions of factors
influencing food buying practices differ by both food security and food desert statuses.
5.3 METHODS
The first step in completing this research study was to identify two zip codes in
Pittsburgh, PA, one categorized as a food desert, the other as a food oasis. Residential zip codes
in Pittsburgh were categorized by food desert status. This involved utilizing the online yellow
pages located at www.yellowpages.com to identify distance to the nearest supermarket. This
method has been used in the literature as an accurate means of identifying addresses based on
latitudinal and longitudinal coordinates (Estabrooks et al., 2003). For this study, a food desert is
defined as a geographic area that does not have a large chain supermarket within 0.5 miles from
the zip code centroid, the center of the defined area identified by latitude and longitude
coordinates. A distance of 0.5 miles is consistent with the literature that defines food deserts in
terms of time required to walk a distance to the nearest supermarket. It is suggested that an
approximate one-way walking time in excess of 15 minutes for an adult in an urban area is a

89
proxy for a food desert (Apparicio et al., 2007). On the other hand, a food oasis will be used to
describe a geographic area that contains a supermarket within 0.5 miles of the center of the zip
code.
Then, percentage of families below the federal poverty line, as determined by the US
Census Bureau, was determined and used as a proxy for neighborhood poverty status. The use of
families below the federal poverty line as a proxy for neighborhood poverty status is consistent
with previous studies focusing on neighborhood poverty status (Zenk et al., 2005). Based on
distance to the nearest supermarket from the center of the zip code (food desert status) and
families living below the federal poverty line (neighborhood poverty status), the two zip codes
were identified. The two zip codes included in the studied are 15207 (food desert) and 15201
(food oasis).
5.3.1 Recruitment
Recruitment of study participants took place over a four-week period in January 2009 and
continued until 15 participants in each zip code had enrolled. Recruitment involved a modified
sampling technique that produced a sample based on referrals from people who knew others who
met the inclusion criteria (Magnani et al., 2005). The referrals were made from staff from social
service agencies, such as neighborhood clinics, senior centers, and food banks, and from
participants who had already been recruited to participate in the study. A study recruitment flyer
was developed and included information about the study and a contact number to call if
interested. When a potential participant called the number, they were asked if they: 1. were at
least 18 years of age, 2. lived in either zip code 15201 or 15207, and 3. had lived there for the
past 12 months. If the participant answered “yes” to these three questions, the purpose and the

90
requirements of the study were described. If the caller was still interested in participating after
every question was answered, the caller was enrolled in the study and mailed a consent form.
Instructions were given to read the consent form thoroughly and to bring to the first group
session.
5.3.2 Concept Mapping Methodology
Concept mapping is a systematic process that incorporates group processes including
brainstorming, sorting and rating of generated ideas, and the use of multivariate statistical
methods (e.g. multidimensional scaling and hierarchical cluster analysis) to graphically represent
the results of the stakeholders (Kane & Trochim, 2007). The generated maps depict relationships
of ideas in the form of clusters, or unique concepts. The intended use of concept mapping was in
program planning and evaluation. However, more recently, researchers have utilized concept
mapping innovatively to explore health-related topics. Examples include utilizing concept
mapping to assess students’ knowledge obtained from a diet therapy (Roberts, 1995), and
identifying and addressing barriers to familial involvement in mental illness care among African
American families (Biegel et al., 1997). For this study, the concept mapping process was
conducted over a period of three non-consecutive days and lasted approximately 8 hours in
duration. Each session was conducted in a private room at a community agency located within
each zip code. This study was approved by the University of Pittsburgh Institutional Review
Board.
Day 1: Generation of statements: During this 2 hour session, participants were asked to generate
words and short phrases in response to the focus prompt: “What things, good or bad, influence
your food buying practices?” The phrase “food buying practices” was defined as “where you buy

91
food, the types of food you buy and when you buy food.” The items generated during this
session were written on flip-chart paper and displayed for the group to see. When necessary,
participants were probed for clarity to ensure that their perspective was recorded accurately.
Day 2: Structuring of statements & Representation: During this 4 hour session, participants were
required to complete 3 tasks. First, participants received a stack of note cards with each of the
unique items generated during the first session written on each card. Participants were asked
independently sort the cards into piles with similar items being sorted together. Second,
participants were asked to rate, on a scale of 1 (not at all) to 5 (extremely) how strongly each of
the generated statements hinders healthy eating. Third, participants were asked to complete the
Food Security Scale, a measure of household hunger within the past 12 months, which is
assessed by the United States Department of Agriculture annually.
Table 5.1 outlines the items that incorporate the Food Security Scale. Households
without children under the age of 18 years complete the first 10 items of the assessment tool
while households with children under the age of 18 years complete all 18 items of the assessment
tool. Households that answer “yes” to two items or fewer are considered food secure, meaning
they did not experience hunger in the past 12 months. This is in contrast to households with 3 or
more affirmative responses. These households are classified as food insecure, or experienced
hunger within the past 12 months.

92
Table 5.1. USDA Food Security Scale Topic Item
Number Item
Household Items
1 I/We worried food would run out before (I/we) got money to buy more
2 The food that I/we bought didn’t last and (I/we) didn’t have money to get 3 I/We couldn’t afford to eat balanced meals
Adult Items 4 I or other adult(s) cut size of meals or skipped meals 5 I ate less than I felt I should 6 I or other adult(s) cut size of meals or skipped meals in 3 or more months 7 I was hungry but didn’t eat because I couldn’t afford enough food
8 I lost weight 9 I or other adult(s) did not eat for whole day 10 I or other adult(s) did not eat for whole day in 3 or more months Child Items 11 I/We relied on few kinds of low-cost food to feed child(ren) 12 I/We couldn’t feed child(ren) balanced meals 13 The child(ren) were not eating enough 14 I/We cut size of child(ren)’s meals because there wasn’t enough money for food
15 The child(ren) were hungry, but I couldn’t afford more food 16 The child(ren) skipped meals 17 The child(ren) skipped meals in 3 or more months 18 The child(ren) did not eat for whole day because there wasn’t enough money for food
Once the sorting and rating steps were completed, data were entered into the Concept
Systems, Inc. software ("Concept Systems, Inc.," 2008) for immediate representation of the
participants’ ideas.
Day 3: Interpretation of the map: The last session, which lasted 2 hours in duration, involved the
participants interpreting the concept map that was generated based on the sorting and rating
process that took place during the second session. Participants were asked to elaborate on the
role specific items have on hindering healthy eating. Furthermore, participants had the
opportunity to explain the relationship between items that were sorted together.

93
5.4 DATA ANALYSIS A strength of the concept mapping process is in the ability of the group to manage a
complex topic without losing important detail (Kane & Trochim, 2007). At the heart of concept
mapping is the analytic process and mapping of the data generated during the structuring of the
statements and representation step. Data analysis begins with individual sort and rate data and
ends with a variety of tools (maps, lists of statements, reports, etc.) to be utilized during the
interpretation step (Kane & Trochim, 2007). Data analysis involves three core steps which will
be described in more detail below: 1. Managing sort and rate data, 2. Multidimensional scaling,
and 3. Hierarchical cluster analysis. For these analyses, the sample will be stratified by food
security status in order to answer Research Question 1. The sample will be stratified by both
food security and food desert status to answer the secondary aim of this research.
During the second group session, data from the sorting and rating step were entered into a
specialized concept mapping software for analysis ("Concept Systems, Inc.," 2008). The
analysis involved using quantitative techniques that yields a group product based on individual
data. From this process one type of concept map, a “point map” was generated to illustrate how
the group as a whole sorted statements generated during the brainstorming session. For instance,
points that are in close proximity represent statements that were sorted together more frequently
by participants. This is in contrast to points that are further away on the map which represent
points that were sorted together less frequently by participants. From the point map, distinct
clusters or ideas were formed that represented unique concepts that pertain to the original focus
prompt.
Data from individual rating sheets were entered into the software to illustrate how
important each statement and overall cluster was to hindering healthy eating. Rating data is also
crucial when performing sub-group analyses to illustrate how important the clusters are to

94
different groups. From average group ratings, data was analyzed using a “pattern match”, a
display that allows average cluster ratings to be compared between two variables. For this
analysis, the two variables were food secure and food insecure households. This “ladder-graph”
representation of the data provided information regarding how strongly correlated the two
variables in comparison are. A Pearson product-moment correlation was calculated to represent
the relationship between the two variables.
5.5 RESULTS 5.5.1 Participant Characteristics Twenty-five participants were included in this analysis. Based on results of the Food
Security Scale, 9 participants were classified as being food secure while 16 participants were
classified as food insecure. The median age of the sample was 44.8 years. In terms of
racial/ethnic make up, nearly half (48%) of the sample was African American while another 48%
was Caucasian. Among African American participants, 55.6% were food secure. Among
Caucasian participants, 44.4% were food secure. Access to transportation was comparable with
nearly one-third of participants falling into one of three categories: own a car, able to find a ride,
or find it difficult to get a ride. Additional demographic characteristics for the sample are
displayed in table 5.2.

95
Table 5.2. Participant Characteristics by Food Security Status Zip code Characteristic Food
Secure Food
Insecure Total
Total number of participants
9 (36%) 16 (64%) 25 (100%)
Age Median age (years)
45.3
44
44.8
Sex Male Female
1 (11.1%) 8 (88.9%)
2 (12.5%) 14 (87.5%)
3 (12.0%) 22 (88.0%)
Race & Ethnicity African American Caucasian Other
5 (55.6%) 4 (44.4%) 0 (0%)
7 (43.8%) 8 (50.0%) 1 (6.2%)
12 (48.0%) 12 (48.0%) 1 (4.0%)
Employment status Disabled Employed part-time Unemployed
1 (11.1%) 4 (44.4%) 4 (44.4%)
2 (12.5%) 9 (56.2%) 5 (31.2%)
3 (12.0%) 13 (52.0%) 9 (36.0%)
Car ownership Do not own car & hard to find a ride Do not own car & able to find a ride Own car
2 (22.2%) 4 (44.4%) 3 (33.3%)
6 (37.5%) 5 (31.2%) 5 (31.2%)
8 (32.0%) 9 (36.0%) 8 (32.0%)
5.5.2 Cluster Ratings
A list of 121 unique statements was brainstormed by participants. Examples of
statements include “fixed income”, “convenience”, “help from organizations”, and “season.”
Quantitative techniques were used to partition the map into a 12-cluster map that was identified
by participants as the appropriate number of clusters for best depicting their perception of factors
that influence food buying practices (see Manuscript 2). Each of the 12 clusters contained
statements ranging in number from 6 to 15, depending on how participants sorted the statements
generated during the brainstorming process. After reviewing the statements within each cluster,
participants agreed upon a cluster name that represented the statements within the cluster.
Examples of cluster names include Information I Depend On, Making Choices, and Quality
Healthy Foods. Examples of statements in the Information I Depend On cluster are “generic
brands”, “day old sales for fruits and vegetables”, “don’t buy what you can’t afford”, and “read
labels.” Statements sorted in the cluster Making Choices include “fixed income”, “false

96
advertising”, “diabetes”, and “fresh food not available.” The cluster Quality Healthy Foods
include statements such as “availability of sale items”, “portions for single people”, “planning
weekly menus”, and “shop for kids and grandkids.” The rating process was used to further
explore how perceptions of clusters generated hinder healthy eating. Participants were asked to
rate on a scale of 1 (not at all strong) to 5 (extremely strong) how strongly each statement within
the 12 clusters hinder healthy eating. Table 5.3 lists the cluster name and the average cluster
ratings for each of the 12 clusters for food secure and food insecure participants.
Table 5.3. Average Cluster Ratings by Food Security Status Cluster Name Cluster Ratings
Food Secure Food Insecure High Risk 2.74 3.26 Information I Depend On 2.94 3.53 Lifestyles 2.65 3.05 Areas for Improvement 2.88 3.48 Making Choices 2.59 3.58 Making Ends Meet 2.63 3.42 Neighborhood Issues 3.06 3.54 Transportation 2.44 3.41 Access Issues 2.53 3.40 Quality Healthy Foods 2.61 3.31 Budgeting 2.75 3.73 Concerns About the Stores 2.84 3.54
For each cluster, food insecure participants rated clusters higher than food secure
participants. For example, the cluster Areas for Improvement, which include statements such as
“bad attitudes from store employees”, “need to eat to live”, and “stress” received an average
cluster rating of 2.88 from food secure participants. Among food insecure participants, this same
cluster was given an average rating of 3.48. This suggests that food insecure participants
perceive each cluster is more important in its role in hindering healthy eating than food secure
participants.

97
To illustrate the differences in average cluster ratings, Figure 5.1 presents a pattern
match, which compares average cluster ratings for how strongly each cluster is perceived to
hinder healthy eating for food secure and food insecure participants. The pattern match uses a
“ladder graph” representation where a perfect correlation would be a horizontally straight line.
The bolded numbers 3.73 at the top of the display and 2.44 at the bottom represent the maximum
and minimum average cluster ratings given to a cluster. In other words, this value represents
how strongly each cluster is perceived to hinder healthy eating for food secure and food insecure
participants. The rating scale ranged from 1 (not at all strong) to 5 (extremely strong). For
example, the cluster Neighborhood Issues, which includes statements such as “store closing”,
“war increases prices”, and “need more neighborhood stores”, was the highest rated cluster for
food secure participants with an average cluster rating of 3.06. This same cluster was ranked
third highest for food insecure participants with an average cluster rating of 3.54. This suggests
that the cluster Neighborhood Issues is perceived as the most important factor for hindering
healthy eating for food secure participants, but not for food insecure participants. The cluster
with the lowest average cluster rating for food insecure participants was Lifestyles, which
includes statements such as “shop when you are hungry”, “eat the same thing” and “eat what is
in the refrigerator/cupboard”. This cluster received a rating of 3.05 from food insecure
participants. This rating suggests that the cluster Lifestyles is perceived as the least important for
hindering healthy eating among this group. The r =0.36 value located at the bottom of the
display is the Pearson product-moment correlation, which represents the correlation between
average cluster ratings between food secure and food insecure participants. In this illustration, a
correlation of 0.36 represents a small correlation between the food secure and food insecure
participants.

98
Figure 5.1. Pattern Match Comparing Factors that Hinder Healthy Eating for Food Secure and Food Insecure Participants It is worthwhile to note that while 5 of the 6 highest rating clusters are the same for both
groups (Neighborhood Issues, Information I Depend On, Areas for Improvement, Concerns
About the Stores and Budgeting), the average ratings are quite different. For example, the cluster
Neighborhood Issues was the highest rated cluster for food secure participants with a rating of
3.06. This same cluster received a rating of 3.54 for food insecure participants. Among food
secure participants, Budgeting received a rating of 2.94. This same cluster was the highest rated
cluster among food insecure participants and received a rating of 3.73. This ranking suggests
that overall, the same clusters are important for hindering healthy eating among food secure and
food insecure participants. However, the degree to which the cluster is perceived to hinder
r = .36
Food Secure Food Insecure
3.73
2.44
3.73
2.44
Lifestyles
Transportation
High Risk
Access Issues
Quality Healthy Foods
Making Choices
Access Issues
Quality Healthy Foods
Transportation
Making Ends Meet
Making Ends Meet
Lifestyles
Areas for Improvement
High Risk
Information I Depend On
Budgeting
Concerns About the Stores
Concerns About the Stores
Neighborhood Issues
Areas for Improvement
Making Choices
Information I Depend On
Budgeting
Neighborhood Issues

99
healthy eating is greater among food insecure participants. The following section further
explores differences in cluster ratings.
5.5.3 Differences in Cluster Ratings
One of the differences between food secure and food insecure participants was in the
ratings for the cluster Concerns About the Stores. While this cluster was ranked fourth by both
food secure and food insecure participants in terms of perceived importance for hindering
healthy eating, there were considerable differences between the average cluster ratings. Food
secure participants rated this cluster 2.84 and food insecure participants rated this cluster 3.54.
Table 5.4 outlines the statements and statement ratings for the cluster Concerns About the Stores.
The ratings in this table present how strongly each statement within the cluster is perceived to
hinder healthy eating. The ratings range from 1 (not at all strong) to 5 (extremely strong). As
shown in the table, the statement with the highest rating among food secure participants was
“[store] hours” with an average rating of 3.44. Food insecure participants perceived this
statement as slightly less important in hindering healthy eating with a rating of 3.31. The highest
rated statement for food insecure participants was “convenience” with a rating of 4.06. This was
the third highest rated statement for food secure participants with a rating of 3.25.

100
Table 5.4. Average Statement Ratings for the Cluster Concerns About the Stores
Statement
Food Secure
Food Insecure
Hours 3.44 3.31 Clean & organized store 3.33 3.69 Convenience 3.25 4.06 Food expiration date 3.22 3.50 Variety 3.00 3.75 Gas discount perks 3.00 3.94 Season 2.89 3.31 Well-stocked shelves 2.89 3.69 Consolidate trips 2.75 3.53 Treatment of store employees 2.22 2.63 Co-op shopping 2.11 3.25 Local foods 2.00 3.88
Note: Ratings reflect how strongly each statement is perceived to hinder healthy eating. Ratings range from 1 (not at all strong) to 5 (extremely strong.)
These differences were explored in-depth during the interpretation step. The results of the
interpretation step are presented in the next section.
5.5.4 Cluster Interpretation
During the interpretation step of the concept mapping process, participants were assigned
to small groups where they collectively diagrammed how the statements within the cluster
Concerns About the Stores hinder healthy eating. Based on each group’s interpretation of this
cluster, differences were noted between food secure and food insecure participants in terms of
how each group perceived the relationship of the statements within the cluster and the role in
hindering healthy eating. Additionally, discrepancies were observed between how participants
rated the statements and what was mentioned during the interpretation step of the concept
mapping process.

101
During the interpretation step, food secure participants identified “convenience” and
“treatment of store employees” as being the most important factors for hindering healthy eating
among the statements that comprise the cluster Concerns About the Stores. This is not supported
by the average statement ratings (see Table 5.4). For food secure participants, “hours” was the
highest rated statement with a rating of 3.44; “convenience” ranked third (out of 12 statements
within the cluster) with a statement rating of 3.25; and “treatment of store employees” ranked
tenth with a statement rating of 2.22. Among food insecure participants, “convenience”,
“variety”, “cost” and “customer service” were identified during the interpretation step as being
the most important factors for hindering healthy eating. Based on average statement ratings for
food insecure participants (see Table 5.4), “convenience” ranked first with the highest statement
rating of 4.06, while “variety” ranked fourth with a statement rating of 3.75. Interestingly, “cost”
and “customer service” were not statements within the cluster Concerns about the Stores. The
statement “customer service” was mentioned by food insecure participants in the context of store
employees being in a position to ensure that the shelves are well stocked, that expired foods are
removed from the shelves, and that the store is clean and organized. Among food insecure
participants, “well-stocked shelves” and “clean and organized store” both ranked fifth for
hindering healthy eating with a rating of 3.69 and “food expiration date” ranked seventh with a
rating of 3.50. Examples of how participants explained how the statements within the High Risk
cluster are related to influence food buying practices are:
Employee treatment is the most important thing. Employees are not treated right and they are gonna quit and the store is going to go out of business. –food secure participant in response to how statements within the Concerns About the Stores cluster hinder healthy eating. There is no convenience here. It hinders [healthy eating] because the stores that are in Hazelwood, the prices are so high you can’t afford to buy things there. – food insecure participant in response to how statements within the Concerns About the Stores cluster hinder healthy eating.

102
5.5.5 Secondary Aim: Exploring the Discordant Pairs
A secondary aim of this study was to stratify the sample by food desert status to explore
how perceptions of factors that hinder healthy eating for food secure households compare and
contrast within a food desert and food oasis. The same analysis was performed for food insecure
households within a food desert and food oasis. The goal of this analysis was to explore how
perceptions of factors that hinder healthy eating are influenced by an individual-level measure of
hunger within the larger neighborhood context.
No differences in factors that hinder healthy eating were found when comparing food
secure participants in a food desert (n=5) and food secure participants in a food oasis (n=4).
Figure 5.2 presents a pattern match comparing average cluster ratings for food secure
participants in a food desert to food secure participants in a food oasis. The pattern match uses a
“ladder graph” representation where a perfect correlation would be a horizontally straight line.
The bolded numbers 3.45 at the top of the display and 1.71 at the bottom represent the maximum
and minimum average cluster ratings given to a cluster. In other words, this value represents
how strongly each cluster is perceived to hinder healthy eating for food secure participants in a
food desert and food secure participants in a food oasis participants. The rating scale ranged
from 1 (not at all strong) to 5 (extremely strong). The r =0.15 value located at the bottom of the
display is the Pearson product-moment correlation, which represents the correlation between
average cluster ratings between food desert and food oasis participants. In this illustration, a
correlation of 0.15 represents a small correlation between food secure participants in a food
desert and food secure participants in the food oasis.
From this illustration, it is clear that the overall rankings were similar for both groups of
participants with the clusters Areas for Improvement, Information I Depend On, and

103
Neighborhood Issues being some of the most important clusters for hindering healthy eating. It
is worthwhile to note that although the overall rankings were similar, participants in the food
desert rated all of the clusters higher than participants in the food oasis. For example, both
groups ranked the cluster Information I Depend On second most important cluster for hindering
healthy eating. Food secure participants in the food desert rated this cluster 3.43 compared to
food secure participants in the food oasis who rated this cluster 2.33. Average cluster ratings for
food secure participants residing in a food desert and food secure participants residing in a food
oasis are listed in table 5.6.
Figure 5.2. Pattern Match for Factors that Hinder Healthy Eating Comparing Food Secure Participants in a Food Desert to a Food Oasis
r = .15
Food Desert Food Oasis
3.45
1.71
3.45
1.71 Lifestyles
Transportation
Making Choices
Access Issues
Making Ends Meet
Quality Healthy Foods
High Risk
Making Ends Meet
Concerns About the Stores
Making Choices
Access Issues
Budgeting
Budgeting
High Risk
Transportation
Neighborhood Issues
Quality Healthy Foods
Lifestyles
Areas for Improvement
Areas for Improvement
Information I Depend On
Information I Depend On
Neighborhood Issues
Concerns About the Stores

104
When exploring perceptions of factors that hinder healthy eating among food insecure
participants in the food desert (n=7) and the food oasis (n=9), the results were not as clear.
Figure 5.3 presents a pattern match, which compares average cluster ratings for how strongly
each cluster is perceived to hinder healthy eating for food insecure participants residing in a food
desert and food insecure participants residing in a food oasis. The pattern match uses a “ladder
graph” representation where a perfect correlation would be a horizontally straight line. The
bolded numbers 4.1 at the top of the display and 2.97 at the bottom represent the maximum and
minimum average cluster ratings given to a cluster. In other words, this value represents how
strongly each cluster is perceived to hinder healthy eating for food insecure participants from the
food desert and food insecure participants from the food oasis. The rating scale ranged from 1
(not at all strong) to 5 (extremely strong). The r =0.12 value located at the bottom of the display
is the Pearson product-moment correlation, which represents the correlation between average
cluster ratings between food desert and food oasis participants. In this illustration, a correlation
of 0.12 represents a small correlation between food insecure participants residing in the food
desert compared to food insecure participants residing in the food oasis.
At first glance, it would appear that there were major differences between food insecure
participants in a food desert compared to food insecure participants in a food oasis. For instance,
the overall rankings of the clusters were quite different with the cluster Transportation being
ranked nearly last for the food desert but ranked first for the food oasis.

105
Figure 5.3. Pattern Match for Factors that Hinder Healthy Eating Comparing Food Insecure Participants in a Food Desert to a Food Oasis
Upon closer inspection, it became clear that although the rankings were different, the
average cluster ratings were similar, suggesting that the importance of each cluster in hindering
healthy eating was similar for food insecure participants regardless of neighborhood-level access
to a supermarket. For example, consider the cluster Making Choices. This cluster ranked second
among food insecure participants residing in a food desert and eighth among food insecure
participants residing in a food oasis. While these rankings are different, the average cluster
ratings were 3.87 for food insecure participants from the food desert and 3. 35 for food insecure
participants in a food oasis. Overall, the average cluster ratings were slightly higher for
participants in the food desert compared to the food oasis. The exceptions are in the clusters
Transportation, Making Ends Meet, and Access Issues. Examples of statements that comprise
the cluster Transportation are “need a car”, “distance to shops”, and “weather.” Examples of
r = .12
Food Desert Food Oasis
4.1
2.97
4.1
2.97 Lifestyles
Lifestyles
High Risk
Transportation Quality Healthy Foods Access Issues Neighborhood Issues
Making Ends Meet Making Choices Quality Healthy Foods
Areas for Improvement
Concerns About the Stores
Budgeting
Information I Depend On
Access Issues
Areas for Improvement
Making Ends Meet
High Risk
Information I Depend On
Neighborhood Issues
Concerns About the Stores
Making Choices
Transportation
Budgeting

106
statements that make up the cluster Making Ends Meet are “food stamps”, making choices
between buying food and paying bills” and “got a raise and lost food stamps.” Examples of
statements that make up the cluster Access Issues include “high gas prices”, “lack of
transportation”, “high bus fare”, and “depend on the bus lines.”
To illustrate the results of the secondary aim of this study with a particular focus on
relative order (cluster rankings) and perceived importance (cluster ratings), refer to Table 5.5.
This table presents the results of the secondary aim and depicts how the rankings and ratings are
related. Shaded cells represent variables that are similar within each food security status. For
example, the shaded cells for relative order under “Food Secure” show that the relative order of
the clusters are similar for food secure participants in a food desert and food secure participants
in a food oasis. The perceived importance, on the other hand, is higher for food secure
participants in a food desert compared to food secure participants in a food oasis. The shaded
cells for perceived importance under “Food Insecure” show that perceptions of how important
each cluster is to hindering healthy eating is similar for food insecure participants in a food
desert and food insecure participants in a food oasis. Among food insecure participants in a food
desert and food insecure participants in a food oasis, no distinct pattern is observable in terms of
the relative order. Therefore, the relative order of these clusters are said to vary.
Table 5.5. Relationship of cluster rankings and ratings for results of secondary aim Food Secure Food Insecure Food Desert Food Oasis Food Desert Food Oasis Perceived Importance (Cluster Ratings) Higher Lower
Relative Order (Cluster Rankings)
Varies Varies
Note: Shaded cells represent variables that are similar within each food security status group

107
Table 5.6 presents the average cluster ratings comparing food secure participants in a
food desert to a food oasis and food insecure participants in a food desert to a food oasis. The
table summarizes average cluster ratings for each of the 12 clusters for the sample stratified by
both food security and food desert statuses. To qualify the degree to which each cluster hinders
healthy eating, cluster ratings were divided into tertiles and designated low, moderate (mod) and
high. These designations are listed in the table besides the average cluster ratings. A low value
indicates a rating value between 1.71-2.50, whereas a moderate (mod) value indicates a rating
value between 2.51-3.30. High indicates a rating value between 3.31-4.10. For example,
average cluster ratings for the cluster Information I Depend On was 3.43 for food secure
participants in a food desert, 2.33 for food secure participants in a food oasis, 3.59 for food
insecure residents in a food desert, and 3.49 for food insecure residents in a food oasis. Based on
the rating cutoff values designated, the cluster Information I Depend On is perceived by food
secure participants in a food desert and all food insecure participants as rating high in terms of
importance for hindering healthy eating. Food secure participants in a food oasis was the
exception in this example and perceived Information I Depend On as being of low importance
for hindering healthy eating.

108
Table 5.6. Average Cluster Ratings and Importance for Hindering Healthy Eating
NOTE: Low indicates a rating value between 1.71-2.50. Moderate (mod) indicates a rating value between 2.51-3.30. High indicates a rating value between 3.31-4.10.
5.6 DISCUSSION This study represents one of the first studies seeking to explore the relationship between
an individual-level measure of hunger and a neighborhood-level measure of supermarket access
on hindering healthy eating in an urban area. While caution must be taken when interpreting the
results and comparing findings to existing studies due to the small sample size, these findings
provide novel insight into an area of research that is poorly explored. Before discussing the
prevalence of food insecurity in this study, background rates for comparison purposes are
warranted. The prevalence of food insecurity in the sample was comparable to rates in the state
of Pennsylvania. In a 2005 USDA report, 66% of low-income residents in the state were food
Food Secure Food Insecure Cluster
Food
Desert Food Oasis
Food Desert
Food Oasis
Budgeting 3.27 (mod) 2.11 (low) 4.10 (high) 3.44 (high)
Making Choices 3.16 (mod) 1.89 (low) 3.87 (high) 3.35 (high)
Neighborhood Issues 3.40 (high) 2.64 (mod) 3.84 (high) 3.32 (high)
High Risk 3.32 (high) 2.00 (low) 3.62 (high) 2.98 (mod)
Areas for Improvement 3.42 (high) 2.20 (low) 3.60 (high) 3.39 (high)
Information I Depend On 3.43 (high) 2.33 (low) 3.59 (high) 3.49 (high)
Concerns About the Stores 3.45 (high) 2.06 (low) 3.57 (high) 3.52 (high)
Quality Healthy Foods 2.99 (mod) 2.13 (low) 3.38 (high) 3.25 (mod)
Making Ends Meet 3.13 (mod) 2.00 (low) 3.33 (high) 3.48 (high)
Access Issues 2.89 (mod) 2.09 (low) 3.30 (mod) 3.48 (high)
Transportation 2.71 (mod) 2.11 (low) 3.22 (mod) 3.56 (high)
Lifestyles 3.40 (high) 1.71 (low) 3.14 (mod) 2.97 (mod)

109
insecure (Nord, Andrews, & Carlson, 2008). In this sample 64% of the participants were food
insecure. In the same report, it was noted that 53% of food secure residents of the state had
access to a working car. In this sample, 62% had access to a car either through ownership or
from a friend or relative.
Key findings from this study show that factors that hinder healthy eating are the same for
food secure and food insecure participants. The difference is in the degree of importance, or the
cluster ratings. Compared to food secure participants, food insecure participants viewed each
cluster as being more important to hindering healthy eating. This is not surprising given that
food insecurity pertains to the inability to obtain affordable, safe and nutritious foods (Morris,
Neuhauser, & Cambell, 1992). Each cluster, comprised of statements related to concerns
regarding access, affordability, neighborhood characteristics and individual factors, are all
impacted by income.
The in-depth explanation of the cluster Concerns About the Stores highlighted
convenience as a concern for both food secure and food insecure participants. It was noted in the
results section that the statement convenience was rated third (after “hours” and “clean and
organized store” in terms of perceived importance in hindering healthy eating among food secure
participants. It is reasonable and appropriate for participants to perceive convenience as the most
important factor for hindering healthy eating when the other statements included in this cluster
are closely related to convenience. For instance, one participant was concerned about the impact
of store employees being treated unfairly. The concern was that employees will quit and stores
will close, thereby making food shopping inconvenient. Additionally, store hours, variety of
foods offered, and well-stocked shelves all play a role in convenience. If the store hours are not
conducive to the consumer, if there is a lack of variety and poorly stocked shelves, it is likely

110
that residents would have to shop at another store, potentially in another neighborhood. This can
be an inconvenience to a low-income individual who has to rely on public transportation to
obtain food.
When comparing food secure residents within a food desert to a food oasis, the data
suggest that living in a food desert heightens the degree to which residents perceive the range of
factors as hindering healthy eating. This has major public health significance because it
highlights the need for additional research to explore the impact of living in a food desert.
Findings from this study suggest that perceptions of factors that hinder healthy eating do not vary
by location (food desert or food oasis), but the mere fact that living in a food desert and not
having access to a supermarket is a key component in hindering healthy eating despite the
household’s ability to afford healthy and nutritious foods.
Food insecure participants from the food desert and the food oasis had similar ratings for
each of the clusters. Each of the clusters was rated high or moderate in terms of hindering
healthy eating. This suggests that for food insecure households, location (food desert or food
oasis) does not play a major role in determining factors that hinder healthy eating. Rather, this
relationship is associated with being food insecure. In other words, among households that are
food insecure, the degree of importance for each cluster in hindering healthy eating is heightened
regardless of neighborhood food desert status. This has major health and community
development implications. An improvement in diet comprised of healthy and nutritious foods
cannot be achieved alone by increasing access to a supermarket. Underlying issues of poverty
and related food insecurity must also be addressed.
Two of the clusters that were rated higher among food insecure participants in a food
oasis compared to food insecure participants in a food desert were Access Issues and

111
Transportation. One explanation for this finding is nearly half (44.4%) of food insecure
participants residing in a food oasis own their cars and almost half (44.4%) find it difficult to
obtain transportation (results not shown). This is in comparison to food insecure participants
residing in a food desert where 14.3% own a car and 28.6% find it difficult to obtain
transportation (results not shown). Food insecure participants in the food oasis may view these
clusters as more important for hindering healthy eating because a greater percentage, compared
to food insecure participants in the food desert, has to maintain the upkeep of their personal cars
including paying for high gas prices. Similarly, a greater percentage of food insecure
participants in the food oasis find it difficult to obtain transportation. As a result, these
participants may have rated statements pertaining to the public transportation system as more
important since they tend to rely mostly on this mode of transportation.
Strengths and Limitations
A strength of this study focused on household food security status and food desert status.
This allowed for associations between these two measures to be studied. These analyses offer
new insight into the intersection of food security and food desert statuses and can prove
beneficial in offering recommendations to improve diet and nutrition among low-income food
secure and food insecure residents with different levels of supermarket access.
Another strength of this study includes the use of concept mapping as the methodology to
answer the research questions. Unlike qualitative methods such as focus groups, concept
mapping offers the participants the unique opportunity to rate items according to individual
importance and note how items are related to each other. Furthermore, this participant-driven
methodology involves the participants in each phase of the concept mapping process. This is

112
especially salient for exploring and understanding perspectives and viewpoints through the
interpretation and analyses of the constructed maps. Quantitatively, concept mapping uses
multidimensional scaling and hierarchical cluster analysis to examine similarities of ideas among
participants and identify the degree of similarity. These analyses, in conjunction with the rich
qualitative data collected during the early stages of the process, highlights additional strengths of
this methodology.
Similar to other qualitative studies, this study is limited in its generalizability. This study
represents the views of 9 food secure and 16 food insecure. For the secondary aim, the sample
size was even smaller. As a result, our findings are not generalizable to other food secure and
food insecure households, and not generalizable to non low-income zip codes. However, the
purpose of this study was not to make generalizations, but to generate hypotheses. Furthermore,
the goal was to explore perceptions of the participants regarding factors that hinder healthy
eating. This study can serve as pilot data for a supplemental study with a larger sample size. It
would be beneficial to replicate this study to verify the results and contribute new findings.
Recommendations
Addressing concerns related to both the built environment and socioeconomic status is a
daunting task that will require an ecological approach involving a variety of key players
including community developers, policy makers and public health professionals. Findings from
this study uncovered potential areas for future research and intervention. These areas include:

113
1. Increasing food assistance programs
. Increasing access to food assistance programs for
low-income urban residents. These programs have proven beneficial in reducing food
insecurity (Edward & Evers, 2001).
2. Research on food assistance programs and food security
. Additional research is needed to
explore the impact of existing food assistance programs (i.e., soup kitchens, food banks,
community gardens, etc.) on reducing food insecurity.
3. Exploring pathways between food security status and barriers to healthy eating
. Further
research is required to better understand the mechanism whereby food security status
intensifies the relative importance of factors involved in hindering healthy eating.

114
6.0 CHAPTER SIX: DISCUSSION
This chapter presents a discussion of the research findings from the three manuscripts as
they relate to the original research questions. A discussion of the limitations will follow with
particular emphasis on methodological limitations of the research. Lastly, policy implications
and areas for future research will be discussed.
6.1 Manuscript One
Manuscript One focused on food desert literature in the U.S. Twenty two articles
pertaining to food desert research were identified. These articles focus on at least one of 11
measures with the most frequently studied measures being access to stores, income/SES
disparities in food deserts, and racial/ethnic differences in food deserts. The measures that have
received the least attention have focused on residents’ perceptions of their food environment and
the impact of living in a food desert. One explanation for this finding is that unlike income and
race/ethnicity which are easier to quantify, perceptions are more subjective. However,
understanding perceptions can offer insight into facilitators and barriers to healthy eating.
Similarly, it is difficult to assess the direct impact of residing in a food desert when additional
factors such as race/ethnicity or income could be contributing to the association.
Few studies discuss policy implications for food deserts. The few studies that mention
policy-related concerns discuss reducing the racial/ethnic and related income disparities that
exist in accessing food, and working to attract supermarkets to economically disadvantaged
neighborhoods (Chung & Myers, 1999; Lang & Caraher, 1998; Zenk et al., 2005). This
underscores the need for policymakers and stakeholders to begin determining food-related

115
policies and practices. These policies can have a major impact in addressing the limited access
to affordable healthy and nutritious foods for low-income residents of urban areas that lack
access to these foods. An example of how cities are addressing the lack of access to
supermarkets are found in Pittsburgh, Boston in New York where many communities have relied
on local leadership and policy development to alleviate these disparities (Pothukuchi, 2000).
These cities have developed public/private partnerships, agreements between government and
private sector organizations, to build and maintain infrastructure and necessary community
facilities (Nayga & Weinberg, 1999; Widdus et al., 2001). Specifically, partnerships between
local government and supermarket leaders have been developed to bring supermarkets into
underserved areas. Ultimately, these partnerships seek to increase supermarket access within
neighborhoods that have been overlooked by food retailers. In addition to addressing the food
environment, it is imperative to address transportation-related issues that have been identified as
additional barriers to accessing healthy foods for many low-income residents.
While many studies focus on the presence or absence of supermarkets, few examine the
dynamic interaction between other food venues (restaurants, corner stores, gas stations, etc.) as
places where residents purchase food. This is important because these venues, in addition to
local grocery stores, comprise the food environment and offer food items for residents, despite
the nutritional value of these foods. The importance of identifying these types of food stores
within a neighborhood is two-fold. First, identifying these stores offers a complete picture of the
entire food environment within a neighborhood. Second, researchers will have a better
understanding of the food options that are available to residents. While it is important to identify
places that offer healthy foods within a neighborhood, it is equally important to identify the
places within a neighborhood that can offset these locations.

116
There is limited knowledge about the associations between residing in a food desert and
both behavioral and physical health outcomes. More specifically, there is debate about whether
living in a food desert is associated with unhealthy eating and food buying practices, or health
outcomes such as obesity, diabetes, or hypertension, all of which have diet and nutrition as a risk
factor. Similarly, it is unknown whether other factors including personal preferences are better
indicators for healthy eating than the actual presence or absence of a supermarket. Additional
research is needed to better understand these associations and additional factors involved in food
buying practices among residents of food deserts. The salience for this research is to better
understand how a neighborhood characteristic such as access to a supermarket influences healthy
eating. It is also worthwhile to explore how household food security status (food secure or food
insecure) influences food buying practices and how these differences vary by food desert status.
This information will be useful in program planning and policy development aimed at addressing
access to healthy and affordable foods.
6.2 Manuscript Two
Results from the analyses conducted in manuscript two showed that 121 unique
statements are involved in influencing food buying practices among residents of a food desert
and food oasis. The 121 statements represent 12 clusters that were agreed upon by participants
from both groups as accurately expressing their perceptions of concepts that influence their food
buying practices. The 12 clusters identified as influencing food buying practices are: Budgeting,
Making Choices, Neighborhood Issues, High Risk, Areas for Improvement, Concerns About the
Research Question 1. What are perceptions of factors influencing food buying practices among
residents of an urban food desert and residents of an urban food oasis?

117
Stores, Quality Healthy Foods, Making Ends Meet, Access Issues, Transportation, and Lifestyles.
Concept mapping allowed participants to sort and rate statements generated in each cluster
independently before producing an aggregate group product for both groups. Overall, the
average cluster ratings for residents of the food desert were higher than residents of the food
oasis. This suggests that residents of the food desert perceived each cluster as being more
important in influencing food buying practices than residents of the food oasis. The similarity in
cluster rankings suggest that cluster importance is similar between participants in the food desert
and food oasis, however; the degree of importance is heightened among residents in the food
desert.
This research identified perceptions of factors that influence food buying practices for
residents of a food desert and residents of a food oasis. Participants identified a wide range of
factors that have not been studied or poorly explored in depth in existing literature. One
unexpected statement, “cab service won’t come to certain neighborhoods” offers insight into
residents’ perceptions of the role of jitneys in influencing food buying practices. As a result of
cabs not entering certain communities, a demand for transportation services was created. Jitneys,
unlicensed taxis, have been used to meet this demand. In many low-income areas in Pittsburgh,
jitneys aggregate in parking lots of supermarkets offering a cheaper fare than taxis (May, 2004).
Another unexpected statement, “double and triple coupons”, suggest how residents
perceive the important role of coupons in saving money, and subsequently influencing food
buying practices. It is understandable the monetary savings that doubling or tripling coupons can
have for the consumer. While it is unknown the type of food items that were purchased with the
coupon, it is worthwhile to explore how healthier food options can be appealing to the consumer
and coupons available for these items, redeemed at double or triple the face value.

118
Statements unique to participants in the food desert pertained to survival, mental health,
and macro-level factors. To understand the context in which these statements were given, it is
important to understand the history of this area and the feelings of injustice as perceived by the
residents. Participants shared examples of wrongdoings by a grocery store that is no longer
operational in their area. One example is of rancid meat purchased from larger chain
supermarkets, injected with red dye to give the appearance of fresh meat, re-packaged and sold
to residents at regular price. This community, where a supermarket does not exist, has
witnessed other business closures, including banks and schools, and where few social service
agencies exist to address unmet needs. This issues, cited in environmental justice literature
explores how inequities in planning and zoning in poor, urban communities lead to differential
exposures to neighborhood characteristics that adversely affect health outcomes while
diminishing access to health promoting resources including supermarkets (Wilson et al., 2008).
These dismal conditions may offer insight into how the food desert participants perceive their
neighborhood.
Statements unique to participants in the food oasis centered around luxuries or
conveniences surrounding the food environment and shopping experiences, and taking advantage
of available resources. Like the food desert, responses may be based on the larger context in
which residents reside. Given that a supermarket is accessible to these participants, it is not
surprising that factors that influence food buying practices go beyond basic food as a means of
survival as observed in the food desert. According to a report published in the Pittsburgh Post
Gazette (Grant, November 2, 2007), real estate appreciation in the food oasis is the second
highest in the city of Pittsburgh. This area is part of Pittsburgh’s interior design district that
consists of shops, galleries and studios where products and services for in-home and office décor

119
are available ("16:62 Design Zone," 2008). With the opening of art galleries and furniture stores,
coffee shops, restaurants, and bars have followed suit. The implication is that businesses are
willing to establish in low-income, urban neighborhoods provided signs of economic
development and growth are apparent.
From the in-depth explanation from the interpretation step, concerns associated with the
economy, sources of income, and lifestyles were perceived by participants from both groups as
the most important factors for influencing food buying practices. Many small, neighborhood
businesses have closed for a variety of reasons, including the lack of business. Additionally,
food prices have increased over the past year ("Food Price Outlook," 2009), and many people
have lost their jobs. Given the current economic situation, arguably a recession by many
standards, it is not surprising that participants would perceive these factors as key factors that
influence food buying practices.
The aforementioned statements present new findings pertaining to factors that influence
food buying practices. In addition to these novel findings, statements were generated during the
brainstorming sessions that are consistent with the literature as influencing healthy eating among
low-income urban residents. Examples of these statements pertain to concerns surrounding the
lack of transportation (Garasky et al., 2004; Morton et al., 2005), shopping when money is
available, for example, at payday or when food stamps are available (Wooden, 2002), lack of
supermarkets within their neighborhoods (Alwitt & Donley, 1997; Chung & Myers, 1999), and
quality and quantity of foods available within the immediate neighborhood (Hendrickson et al.,
2006).

120
6.3 Manuscript Three
The results of analyses presented in manuscript two showed that for each cluster, food
insecure participants rated clusters higher than food secure participants. This suggests that for food
insecure participants, each cluster is more important in its role in hindering healthy eating than it is
for food secure participants. Five of the 6 highest rating clusters (Neighborhood Issues, Information
I Depend On, Areas for Improvement, Concerns About the Stores, and Budgeting) were the same for
both groups, although the average cluster ratings were quite different. The rankings suggest that
overall, the same clusters were important for hindering healthy eating among food secure and food
insecure participants. However, the degree to which the cluster hinders healthy eating was greater
among food insecure participants. This is not surprising given that food insecurity pertains to the
inability to obtain affordable, safe and nutritious foods (Morris et al., 1992). Each cluster,
comprised of statements related to concerns regarding access, affordability, neighborhood
characteristics and individual factors, are all impacted by income.
Research Question 2. How do residents’ perceptions of factors influencing food buying practices
differ by food security status?
The in-depth explanation of the cluster Concerns About the Stores highlighted
convenience as a concern for both food secure and food insecure participants. It was noted in the
results section that the statement convenience was rated third (after “hours” and “clean and
organized store” in terms of perceived importance in hindering healthy eating among food secure
participants. It is reasonable and appropriate for participants to perceive convenience as the most
important factor for hindering healthy eating when the other statements included in this cluster
are closely related to convenience. For instance, one participant was concerned about the impact
of store employees being treated unfairly. The concern was that employees will quit and stores
will close, thereby making food shopping inconvenient. Additionally, store hours, variety of

121
foods offered, and well-stocked shelves all play a role in convenience. If the store hours are not
conducive to the consumer, if there is a lack of variety and poorly stocked shelves, it is likely
that residents would have to shop at another store, potentially in another neighborhood. This can
be an inconvenience to a low-income individual who has to rely on public transportation to
obtain food.
A secondary aim was to explore the importance of factors that influence food buying
practices on hindering healthy eating based on both food security and food desert statuses. Results
from these analyses showed that there were no differences in factors that hinder healthy eating
comparing food secure participants in a food desert (n=5) and food secure participants in a food
oasis (n=4). The overall rankings were similar for both groups of participants with the clusters
Areas for Improvement, Information I Depend On, and Neighborhood Issues being the some of
the most important clusters for hindering healthy eating. While the overall rankings were
similar, participants in the food desert rated all of the clusters higher than participants in the food
oasis. This suggests that living in a food desert heightens the degree to which residents perceive
the range of factors as hindering healthy eating. This has major public health significance
because it highlights the need for additional research to explore the impact of living in a food
desert. Findings from this study suggest that perceptions of factors that hinder healthy eating do
not vary by location (food desert or food oasis), but the mere fact that living in a food desert and
not having access to a supermarket is a key component in hindering healthy eating despite the
household’s ability to afford healthy and nutritious foods.
Results of the analysis exploring perceptions of factors that hinder healthy eating among
food insecure participants in the food desert (n=7) and the food oasis (n=9) showed that while
cluster rankings were different, the average cluster ratings were similar, suggesting that the
importance of each cluster in hindering healthy eating was similar for food insecure participants

122
regardless of neighborhood-level access to a supermarket (food desert or food oasis). This
suggests that for food insecure households, location (food desert or food oasis) does not play a
major role in determining factors that hinder healthy eating. Rather, this relationship is
associated with being food insecure. In other words, among households that are food insecure,
the degree of importance for each cluster in hindering healthy eating is heightened regardless of
neighborhood food desert status. This has major health and community development
implications. An improvement in diet comprised of healthy and nutritious foods cannot be
achieved alone by increasing access to a supermarket. Underlying issues of poverty and related
food insecurity must also be addressed.
Food insecure participants from the food desert and the food oasis had similar ratings for
each of the clusters. Each of the clusters was rated high or moderate in terms of hindering
healthy eating. Two of the clusters that were rated higher among food insecure participants in a
food oasis compared to food insecure participants in a food desert were Access Issues and
Transportation. One explanation for this finding is nearly half (44.4%) of food insecure
participants residing in a food oasis own their cars and almost half (44.4%) find it difficult to
obtain transportation. This is in comparison to food insecure participants residing in a food
desert where 14.3% own a car and 28.6% find it difficult to obtain transportation. Food insecure
participants in the food oasis may view these clusters as more important for hindering healthy
eating because a greater percentage, compared to food insecure participants in the food desert,
has to maintain the upkeep of their personal cars including paying for high gas prices. Similarly,
a greater percentage of food insecure participants in the food oasis find it difficult to obtain
transportation. As a result, these participants may have rated statements pertaining to the public

123
transportation system as more important since they tend to rely mostly on this mode of
transportation.
6.4 Methodological Limitations
6.4.1
Similar to other qualitative studies, this study is limited in its generalizability. Research
question 1 represents the views of 12 participants who reside in one low-income food desert in
Pittsburgh and 13 participants who reside in one low-income food oasis. Research question 2
represents the views of 9 food secure and 16 food insecure. As a result, our findings are not
generalizable to other food deserts and oases, and not generalizable to non low-income zip codes.
However, the purpose of this study was not to make generalizations, but to generate hypotheses.
Furthermore, the goal was to explore perceptions of the participants regarding their food buying
practices.
Sample size
6.4.2
Another limitation of the study is in the sampling technique. A modified snowball
technique was used to yield a sample based on referrals from people who know others who meet
the inclusion criteria. The referrals were made from staff from social service agencies and
participants who had already been recruited to participate in the study. The drawback to this
method is that participants were primarily those who utilized soup kitchens or food pantries, for
instance, and friends or relatives of participants who were recruited.
Sampling technique

124
6.4.3
The definition of a food desert has been a source of debate in existing literature. The
majority of studies examining food deserts have defined these areas as geographic locations that
do not have a supermarket within 0.5 miles from the center of the location. This study builds
upon existing definitions of food deserts by maintaining the current designation of a food desert
as a geographic area that is devoid of a supermarket within 0.5 miles from the center of the zip
code. Although this designation is the convention, there are some challenges with this definition.
For example, a zip code can be classified as a food desert; however, a residence within a food
desert can be located within walking distance to a supermarket located within a food oasis.
While this may be a challenge in the definition of a food desert, it does not minimize the
importance of the research aims of exploring the perspectives and viewpoints of participants
regarding the factors that influence food buying practices.
Definition of a food desert
6.4.4
Concept Mapping process
A certain degree of literacy is required to complete and comprehend the concept mapping
process. Some participants in the food desert experienced challenges with the concept mapping
process that are worthy to discuss. First, during the structuring of statements and representation
steps of the concept mapping process, participants expressed concern with their individual data
being grouped with the rest of the participants. One participant expressed a feeling of losing his
individuality by aggregating the data. Similarly, a second participant expressed frustration that
his data were lost, that the group product did not represent how he sorted and rated the data. It
was explained that the final cluster solutions map was a group product that was generated based
on the input of each participant. At the last session, efforts were made to further explain the

125
concept mapping process and how individual data are pertinent to the final maps. Handouts of
point and cluster maps were distributed to help illustrate these points.
Another limitation in this study was creating one exhaustive brainstorming list from two
brainstorming sessions with residents from each zip code, and the subsequent generation of one
cluster ratings map that represented ideas from all of the participants from both zip codes. While
it may be ideal to generate two brainstorming lists that represent ideas generated from each
group and to illustrate these ideas graphically with two cluster ratings maps, this is not feasible
when comparisons between the two groups are to be made. Utilizing one overall map which
incorporates the ideas of two groups is common practice within concept mapping. The
similarities and differences that exist between the two groups will be captured during the
interpretation of the maps session of the concept mapping process.
When studying a sensitive topic such as access to food, response biases may occur. A
potential bias of this study is social desirability bias that may result from respondents replying in
a manner to avoid feelings of embarrassment or shame. The Food Security Scale, which assesses
household hunger, asks questions pertaining to economic barriers to accessing food.
Respondents may be ashamed to admit that their household ran out of food, and that there was
not enough money to buy more food. For example, a respondent may answer “No” to items
which asks whether children in the household had enough food to eat. Difficulty in admitting
that children in the household had to skip meals because of insufficient foods to sustain the
family could cause respondents to answer this item in a way that is “socially acceptable.” As a
result, the number of food secure households identified in the study may be inflated.

126
6.5 Concept Mapping and Theory Development
Models for understanding how a wide range of factors influence food buying practices
and promote healthy eating are unknown. One of the strengths of concept mapping is that results
contribute to theory development. The concept mapping process allows participants to freely
brainstorm a focal question. The sorting and rating of these statements and the interpretation of
how these statements are inter-related can be used to develop theories to how a wide range of
factors influence food buying practices.
In this research, participants worked in small groups and translated a complex topic into a
visual representation that developed into a theory. For example, participants were asked to
diagram and explain how statements within the cluster Access Issues are inter-related to
influence food buying practices. The statements were “high gas prices”, “where you live”, “car
service cost”, “transportation”, “bus lines being cut so stores not accessible”, “lack of
transportation”, “depend on the bus lines”, “high bus fare”, “jitney charges for bags and people”,
“cab service won’t come to certain neighborhoods”, “free bus for Social Security or Medicare”,
“location of the bus and shuttle”, “ship of Zion shuttle”, and “only take four bags on the bus.”
Participants were told that all statements did not have to be used, and that statements that were
not generated during the brainstorming process could be added to clarify their diagram in an
effort to make the description more complete. Participants within one small group organized the
statements in a way that illustrated that transportation was the most important statement within
the cluster for influencing food buying practices.
A pathway was diagrammed to theorize how the cluster influences food buying practices.
Participants stated that access to a supermarket is dependent on the abilitiy to obtain
transportation by paying for high gas prices, bus fare or jitney services. Participants explained

127
that without transportation, residents are limited to shopping within walking distance.
Participants identified convenience stores and fast food restaurants as the food stores that are
within walking distance, which leads them to purchase unhealthy foods that are readily available
at these stores. As illustrated from this example, concept mapping facilitates participants’ active
involvement in creating knowledge that can be used to guide future research and in program and
policy development.
6.6 Policy Implications The findings from manuscripts two and three have neighborhood and individual-level
policy implications. This study highlights factors that influence food buying practices and
underscores the need for increased access to affordable, healthy and nutritious foods for low-
income communities. Furthermore, this study presents areas where interventions could be the
most feasible, cost-effective, or beneficial.
Given that diet is a risk factor for many chronic conditions and is being studied as rates of
overweight and obesity continue to drastically increase, exploring the context in which people
live, such as the neighborhood food environment, can offer invaluable insight. Findings from
this research study, which are consistent with existing literature suggest that there are various
factors involved in food buying practices and subsequently healthy eating practices. Income
plays a role in these practices in the ability to acquire affordable foods. Access plays a role in
the ability of residents to obtain food. There is then the issue of poverty which can be an added
stressor due to the availability of limited funds needed to make ends meet. This in turn can lead
to emotional eating or the consumption of cheaper, fat-filled foods. This scene plays out in many
low-income communities across the country.

128
There has been discussion as to how to resolve this issue. As discussed in the literature,
the presence of a supermarket does not necessarily lead to an increase in fruit and vegetable
consumption (Hendrickson et al., 2006). However, studies show that the presence of a chain
supermarket does increase access to foods at affordable prices. A local supermarket also has the
potential to address many of the factors that were identified as influencing food buying practices
from manuscript two. For instance, a local supermarket can minimize distance to the store which
decreases travel time for car owners (and subsequently the amount of gasoline used), as well as
those who rely on public transportation. Furthermore, chain supermarkets tend to have sales
papers, honor coupons, have a high turnover of food which ensures that foods are not expired,
and have well-stocked shelves with a variety of generic and name brand food items, and
quantities. These benefits, which come with having access to a supermarket, were identified by
participants as being important to influencing food buying practices.
It can be argued that the presence of a supermarket in an area devoid of one is a sign of
revitalization. Other businesses may see this as an opportunity to establish in this area and
follow suit. With the opening of new businesses, the potential exists for neighborhood
perceptions to change. These perceptions may influence how residents view their neighborhood
food environment whereby the differential in importance ratings for influencing food buying
practices between food desert and food oasis participants will become more balanced. Results
from exploring food security within a food desert and food oasis have similar policy
implications, therefore, programs and interventions targeting neighborhood-level concerns are
warranted.

129
Manuscript two, which explored factors that influence food buying practices based on
household food security sheds light on the salience of addressing individual ability to obtain
affordable foods. Increased financial support and resources for programs that provide
emergency food assistance and food vouchers are needed to increase food security among low-
income households. A study by Garasky et al. (2004) reported that compared to non-users, food
pantry users were less likely to report challenges to acquiring food. It is suspected that their
utilization in this emergency food program helped supplement their food supply thereby reducing
the likelihood of being food insecure. These policy implications are relevant for addressing
food insecurity whether in a food desert or food oasis.
6.7 Future Research Additional research is needed to explore the extent to which residing in a food desert
impacts health outcomes including obesity, diabetes, heart disease and other chronic conditions
that have diet as a risk factor. Similarly, larger research studies are warranted that study multiple
low-income food deserts and food oases. These research findings, in comparison with the
findings from this research study could further contribute to our understanding of factors
influencing food buying practices in low-income areas.
Additionally, the qualitative nature of concept mapping focuses on the perceptions of the
participants. It could be worthwhile to triangulate these data with neighborhood data using
Geographic Information System (GIS) techniques. For example, food stores including
restaurants, convenience stores, produce markets, food pantries, and other places where
participants are able to obtain food within their immediate neighborhoods could be geocoded. A
sample of the geocoded food stores can be identified to obtain an assessment of the quality,

130
quantity, and brand of food items that are available to the consumer. This research could provide
a comprehensive view of neighborhood food environments that include an actual map of the food
environment, an assessment of the available food items, and the perceptions of those the local
food store is intended to serve.
One of the methodologically sophisticated ways to study the impact of living in a food
desert is a pre/post evaluation study. Discussions are underway to establish a chain supermarket
in a food desert in Pittsburgh. There is the opportunity to study the residents in this area before
and after the intervention (opening of the supermarket) to identify changes in food buying
practices, eating practices, and perceptions of the food environment. Similarly, it would be
interesting to replicate this study in this area to observe how ratings and rankings of factors that
influence food buying practices may alter pre and post intervention. This would offer great
insight into questions that have not been addressed presently in the literature.
6.8 Conclusions
Ample research supports the importance of consuming fruits and vegetables and their
benefits in reducing risks associated with many chronic diseases. Other research focus on the
similarities and differences in food environments based on race/ethnicity, income, chain store
versus non-chain store, and location (urban, rural, or suburban). The findings from this
dissertation research contribute to the identification and relationship of factors that influence
food buying practices among residents with different supermarket access. These factors identify
areas where programs and interventions can be targeted to improve healthy eating. Furthermore,
the findings from this research identifies factors that hinder healthy eating among food secure
and food insecure households, thereby suggesting areas for improving access to food. To fully

131
address access to affordable healthy and nutritious foods, an ecological approach is required.
Future research is needed to further explore the impact of the neighborhood food environment on
healthy and health outcomes.

132
Appendix A: Recruitment Flyer
Title: Healthy Neighborhoods, Healthy Eating Study
If you answered “Yes” to both of these questions,
researchers at the University of Pittsburgh Graduate School of Public Health want to hear
from you!
We invite you to share your thoughts and ideas about your food buying practices in a friendly
community setting! You will meet other people who live in your zip code and earn up to $75 in gift cards!
If you are interested, please call 412-417-4826 for more details!

133
Appendix B: Zip code 15207 statement list
Advantage Card
Aftertaste of healthy foods is not good
Area
Availability of sale items
Bad government policy
Bad packaging
Bad weather
Baked, boiled, fried-same food
Bill money to restaurant
Bush lied
Buy in bulk
Buying junk
Cab service won't come to certain neighborhoods
Car service cost
Cheaper for companies
Cheaper to eat fat foods
Clean and organized store
Climate
Commercials
Compulsive shopper
Convenience
Cooking healthy
Cooking shows
Co-op shopping
Corporate taking advantage of the consumer
Cost
Cost more to buy less
Coupon sharing
Coupons
Customer service
Depression
Different circulars for different neighborhoods
Distance to shops
Eat anything that is in the cupboard
Eat constantly
Eat deer meat
Eat the same thing
Eating healthy is more expensive
Eating junk is what I can afford
Economy affects everything
Economy is down
Emotional eating
Everything is for families
Expired food
False advertising
Food is an addiction
Food preparation
Food stamps
Food stamps once per month
Food to prepare
Free bus for Social Security or Medicare
Fresh food not available
Fruits and vegetables are expensive
Fruits and vegetables at food bank
Fuel perks
Gas discount
Generic
Good information from commercials
Good Prices
Grocery list
Habitual eating
Have to go a distance to find healthy food
Healthy food is where people have money
Healthy foods are not good
High gas prices
Hours
Hunting
Information on specials
Jitney charge for bags and people
Junk food cheap
Lack of information
Lack of transportation
Lactose intolerant
Late advertisement
Less quantity for more cost
Lifestyle
Like variety
Live to eat
Location
Location of the bus and shuttle
Love to cook
Low prices

134
Appendix B: Zip code 15207 statement list (continued from previous page)
Low sodium
McDonald's one-stop
Money stays the same, food prices go up
Money=food
Monthly shopping
Need to eat to live
Not all at one time
Not enough help
Nothing exotic
Only take 4 bags on the bus
Paid by job
Poor neighborhoods
Poor people's concern is food
Portions for single people
Price information
Quantity of items on coupons
Read labels
Reasonable price
Sav A Lot
Savings
Season
Share with relatives
Ship of Zion shuttle
Shop when you are hungry
Socializing
Source of income
Spices cost a fortune
Store closing
Stress
Television
The way we treat others-bonding
Think about food all the time
Transportation
Transportation for elderly
Trim expenses
Used to eat socially
War increase prices
When you have money
Where you live
Wholesale
Wonder if I'm going to have food
Word of mouth about sales
Work

135
Appendix C: Zip code 15201 statement list Able to buy fruits and vegetables
Aldi has good prices
Aldi has long lines
Bad attitudes from employees
Bargains
Bus lines being cut so stores not accessible
Buy 1 Get 1 Free
Buy in bulk and freeze
Buy what you need
Buying frozen foods which are better than canned
Buying more getting less
Buying the necessities
Buying the quantity that you need
Changing lifestyle
Choosing how to spend money
Cleanliness
Consolidate trips-go to many stores one day per week
Cooking in one pot
Cost of food
Day old sales for fruits and vegetables
Depend on the bus
Diabetes
Don't buy what you can't afford
Don't buy what you don't need
Don't mind paying more for organic/better food
Don't shop at Walmart anymore
Double and triple coupons
East Liberty provides twice as much for your money
Eat what is in the refrigerator/house
Eating healthy cost a lot
Eating leftovers
Economy
Elderly not able to shop when Giant Eagle closed
Expiration date
Families living together to help out with the bills
Farmer's market
Fixed income
Flyers/newspapers
Food bank
Fresh produce at farmer's market
Fruits and vegetables are not cheap
Giant Eagle closed
Giant Eagle mistreats employees
Good deals
Got a raise and lost food stamps
Grocery stores are too far out Have to open doors to family to pull together and pay bills
Have to take the bus
Having to make hard choices
Help from organizations
High bus fare
High gas prices
If you don't want 2 items, just buy 1
Information about coupons
Information provided by Catholic Charity
Keep track of flyers to see sales
Knowledge food prices
Local foods
Long lines
Look for bargains
Making choices between buying food and paying bills
Need a car
Need more neighborhood bakeries
Need more neighborhood stores
Not outdated foods
Only shop where there is a sale
Organic food stores have decent prices and good quality
Organic foods
People losing their jobs and homes
Planning weekly menus
Price
Price is right
Quality of food
Quantity
Rely on family and friends
Ride my bike
Sales
Salvation Army has bread on Tuesdays
Senior coupons for farmer's market
Share information with family and friends
Sharing information with others

136
Appendix C: Zip code 15201 statement list (continued from previous page)
Shop for kids and grandkids
Shop 'n Save has 2 for the price of 1 or 5 for $20
Shopping frequently for fresh produce
Shopping in the Strip District
SNAPS: support for low-income Spend money to get to store, have to save money when get there
Stars' discount
Stores closing and becoming employee parking lot
Substitutions for sale items not available
Sugar-free tastycakes
Summer versus winter
The way people are treated
The word "sale" can be a trick
The working class needs the financial bailout
Thinking about if you really need the item
Transportation
Variety
Walked when gas prices high
Walmart prices are too high
Watch where you shop
Well-stocked shelves
Why pay more when you can pay less
WIC vouchers
Word of mouth

137
Appendix D: Master list with statement numbers
Aftertaste of healthy foods is not good (1)
Area (2)
Availability of sale items (3)
Bad attitudes from store employees (4)
Bad food packaging (5)
Bad government policy (6)
Bargains (7)
Bus lines being cut so stores not accessible (8)
Bush administration (9)
Buy 1 get one free (10)
Buy in bulk (11)
Buy what you need (12)
Buying frozen foods which are better than canned (13)
Buying junk (14)
Cab service won't come to certain neighborhoods (15)
Car service cost (16)
Cheaper to eat fat foods (17)
Choosing how to spend money (18)
Clean and organized store (19)
Compulsive shopper (20)
Consolidate trips-go to many stores one day per week (21)
Convenience (22)
Cooking healthy (23)
Cooking in one pot (24)
Cooking shows (25)
Co-op shopping (26)
Cost (27)
Cost more to buy less (28)
Coupon sharing (29)
Coupons (30)
Customer service (31)
Day old sales for fruits and vegetables (32)
Depend on the bus lines (33)
Diabetes (34) Different circulars for different neighborhoods (35)
Distance to shops (36) Don't buy what you can't afford (37) Don't mind paying more for organic/better food (38)
Double and triple coupons (39)
Eat the same thing (40)
Eat what is in the refrigerator/cupboard (41)
Eating junk is what I can afford (42)
Eating socially (43)
Economy (44)
Emotional eating (45)
False advertising (46)
Farmer's market (47)
Fixed income (48)
Flyers and newspapers to see sales (49)
Food Bank (50)
Food expiration date (51)
Food preparation (52)
Food stamps (53)
Free bus for Social Security or Medicare (54)
Fresh food not available (55)
Fruits and vegetables are expensive (56)
Gas discount perks (57)
Generic brands (58)
Good price (59)
Got a raise and lost food stamps (60)
Grocery list (61)
Habitual eating (62)
Healthy food is where people have money (63)
Help from organizations (64)
High bus fare (65)
High gas prices (66)
Hours (67)
Jitney charges for bags and people (68)
Junk food is cheap (69)
Knowledge of food prices (70)
Lack of transportation (71)
Lactose intolerant (72)
Lifestyle (73)
Local foods (74)
Location (75)
Location of the bus and shuttle (76)
Long lines (77)

138
Appendix D: Master list with statement numbers (continued from previous page)
Love to cook (78)
Low sodium (79)
Making choices between buying food and paying bills (80)
McDonald's is one-stop shopping (81)
Meat available from hunting (82)
Need a car (83)
Need more neighborhood stores (84)
Need to eat to live (85)
Only take four bags on the bus (86)
Organic foods (87)
Planning weekly menus (88)
Poor neighborhoods (89)
Portions for single people (90)
Quality of food (91)
Quantity (92)
Quantity of items on coupons (93)
Read labels (94)
Ride bike to store (95)
Sale advertisement delivered late (96)
Sales (97)
Season (98)
Senior coupons for farmer's markets (99)
Share information with others (100)
Ship of Zion shuttle (101)
Shop for kids and grandkids (102)
Shop when you are hungry (103)
Shopping frequently for fresh produce (104)
Source of income (105)
Store closing (106)
Stress (107)
Television commercials (108)
Think about food all the time (109)
Transportation (110)
Treatment of store employees (111)
Variety (112)
Walking (113)
War increases prices (114)
Weather (115)
Well-stocked shelves (116)
When you have the money (117)
Where you live (118)
WIC vouchers (119)
Wonder if I'm going to have food (120)
Word of mouth of sales (121)

139
Appendix E: Participant Questions This brief survey is designed to help us better understand how you get the foods you buy. Please take a few moments to answer each item. Your responses are anonymous and will not be linked to you. Please be sure to place a label that you received in the upper right hand corner of this survey. Part I. Background Information – In this section we want to learn more about you.
1. What is your zip code (please check one)?
_____15201 _____15207
2. What is your age? __________
3. What is your sex (Please check one)?
_____Male/Man _____Female/Woman
4. What is your race/ethnicity? _______________________________
5. How many adults live with you? ___________
6. How many children under the age of 18 years live with you? __________
7. What is your employment status (please check one)?
_____Employed full-time _____Employed part-time _____Retired _____Disabled _____Unemployed
Part II. Transportation – In this section, we want to learn about the types of transportation that you may use.
8. Which statement best describes you?
_____I own my car _____I do not own a car, but usually, I can get a ride with somebody _____I do not own a car and I find it hard to get a ride with somebody

140
9. About how many blocks away from your home is the nearest bus stop? _________ blocks
10. About how many different bus routes operate near your home? _____________
11. About how often do the buses that operate near your home come?
_____ Less than every 15 minutes _____Every 15-30 minutes _____Every 30-45 minutes
_____ More than every 45 minutes Part III. Where You Shop – In this section, we want to learn more about the place where you usually buy food.
12. What is the name of the store where you shop for food the most?
_______________________________________________________________________
13. Usually, how do you get to the store where you shop for food the most? _____________ _______________________________________________________________________
14. In minutes, how long does it take you to get to the store where you shop for food the most? _______________ minutes
15. What do you like best about the place where you usually buy your food? ________________________________________________________________________ ________________________________________________________________________ ________________________________________________________________________
16. What do you like least about the place where you usually buy your food? ________________________________________________________________________ ________________________________________________________________________ ________________________________________________________________________

141
Part IV. Health Matters – In this last section, we want to know a little about your health.
17. Has a health care provider ever told you that you have or had diabetes/sugar, high blood pressure, cancer, stroke, or other conditions (Please check one)?
_____Yes _____No
_____I do not wish to answer
18. If you answered “Yes” to question 17, what condition(s) were you told you have?
________________________________________________________________________ ________________________________________________________________________
Thank you for taking time to complete this survey. Your responses are valuable to us and will help us better understand how people access food for their households.

142
Appendix F: United States Department of Agriculture (USDA) Food Security Scale The following are several statements that people have made about their food situation. These statements are meant to get an idea of how people cope when there is not enough food at home. Please check “yes” if the statement is true for you within the last 12 months or “no” if the statement is not true for you within the last 12 months. Topic Item
Number Item Yes No
The first 3 items have to do with concerns members of your household have in getting food. In the last 12 months: Household Items 1 I/We worried food would run out before (I/we) got money to buy more 2 The food that I/we bought didn’t last and (I/we) didn’t have money to
get more
3 I/We couldn’t afford to eat balanced meals
The next 7 items have to do with changes you and other adults in your household made in your eating habits. In the last 12 months:
Adult Items 4 I or other adult(s) cut size of meals or skipped meals
5 I ate less than I felt I should
6 I or other adult(s) cut size of meals or skipped meals in 3 or more months
7 I was hungry but didn’t eat because I couldn’t afford enough food
8 I lost weight
9 I or other adult(s) did not eat for whole day
10 I or other adult(s) did not eat for whole day in 3 or more months
The last 8 items have to do with the eating patterns of the children in your household. Only answer the following questions if you have at least one child under the age of 17 years living with you. In the last 12 months:
Child Items 11 I/We relied on few kinds of low-cost food to feed child(ren)
12 I/We couldn’t feed child(ren) balanced meals
13 The child(ren) were not eating enough
14 I/We cut size of child(ren)’s meals because there wasn’t enough money for food
15 The child(ren) were hungry, but I couldn’t afford more food
16 The child(ren) skipped meals
17 The child(ren) skipped meals in 3 or more months
18 The child(ren) did not eat for whole day because there wasn’t enough money for food

143
Appendix G: Statements Grouped by Cluster HIGH RISK NEIGHBORHOOD ISSUES Lifestyle Fruits and vegetables are expensive Emotional eating Aftertaste of healthy foods is not good Think about food all the time Eating junk is what I can afford Junk food is cheap Habitual eating Low sodium Cheaper to eat fat foods Eating socially Compulsive shopper Buying junk
Need more neighborhood stores Economy War increases prices Poor neighborhoods Store closing Long lines Different circulars for different neighborhoods
INFORMATION I DEPEND ON TRANSPORTATION Cost Choosing how to spend money Word of mouth of sales Cooking healthy Food preparation Read labels Don’t buy what you can’t afford Coupons Buying frozen foods which are better than canned Day old sales for fruits and vegetables Love to cook Farmer’s market Generic brands
Weather Need a car Distance to shops Location Area Walking Ride bike to store
LIFESTYLES ACCESS ISSUES Cooking in one pot Shop when you are hungry Eat what is in the refrigerator/cupboard Sale advertisement delivered late Eat the same thing Meat available from hunting
High gas prices Where you live Car service cost Transportation Bus lines being cut so stores not accessible Lack of transportation Depend on the bus line High bus fare Jitney charges for bags and people Cab service won’t come to certain neighborhoods Free bus for Social Security or Medicare Location of the bus and shuttle Ship of Zion shuttle Only take four bags on the bus

144
AREAS OF IMPROVEMENT- THE DAY WILL GET BETTER
QUALITY HEALTHY FOODS
Source of income Need to eat to live Bush administration Help from organizations Bad government policy Bad food packaging Stress Television commercials Bad attitudes from store employees WIC vouchers
Knowledge of food prices Quality of food Availability of sale items Quantity Share information with others Shopping frequently for fresh produce Buy what you need Buy in bulk Portions for single people Grocery list Don’t mind paying more for organic/better food Cooking shows Planning weekly menus Organic foods Shop for kids and grandkids
MAKING CHOICES BUDGETING Fixed income When you have the money Healthy food is where people have money Wonder if I’m going to have food Fresh food not available Lactose intolerant False advertising McDonald’s is one-stop shopping Diabetes
Cost more to buy less Good price Sales Bargains Buy 1 get 1 free Flyers and newspapers to see sales Quantity of items on coupons Coupon sharing Double and triple coupons
MAKING ENDS MEET CONCERNS ABOUT THE STORES
Making choices between buying food and Paying bills Food stamps Customer service Food bank Got a raise and lost food stamps Senior coupons for farmer’s markets
Convenience Gas discount perks Clean and organized store Variety Food expiration date Well-stocked shelves Hours Consolidate trips-go to many stores one day per week Local foods Season Co-op shopping Treatment of store employees

145
Appendix H: Participant Demographics Zip code Characteristic Food Desert
(15207) Food Oasis
(15201) Total
Total number of participants 12 (48%) 13 (52%) 25 (100%) Age Median age (years)
42.8
47.5
46.5
Sex Male Female
2 (16.7%) 10 (83.3%)
1 (7.7%) 12 (92.3%)
3 (12%) 22 (88%)
Race & Ethnicity African American Caucasian Other
6 (50.0%) 6 (50.0%) 0 (0%)
6 (46.2%) 6 (46.2%) 1 (7.7%)
12 (48%) 12 (48%) 1 (4%)
Average number of adults in household
1.50 1.54 2.11
Number of children in household
0.50 0.77 1.33
Employment status Disabled Employed part-time Unemployed
4 (33.3%) 2 (16.7%) 6 (50.0%)
9 (69.2%) 1 (7.7%) 3 (23.1%)
13 (52%) 3 (12%) 9 (36%)
Car ownership Do not own car & hard to find a ride Do not own car & able to find a ride Own car
5 (41.7%) 4 (33.3%) 3 (25.0%)
4 (30.8%) 4 (30.8%) 5 (38.5%)
9 (36%) 8 (32%) 8 (32%)
Nearest bus stop (blocks) Range Average
2-20 7.42
0-30 3.69
0-30 6.23
Number of different bus routes near home Range Average
1-4 2.60
2-4 2.83
1-4 2.71
Bus frequency < 30 minutes > 30 minutes Unknown
7 (58.3%) 4 (33.3%) 1 (8.3%)
10 (77%) 3 (23.1%) 0 (0%)
17 (68%) 7 (28%) 1 (4%)
Store where shopping done the most Giant Eagle Other
6 (50%) 6 (50%)
4 (30.8%) 9 (69.2%)
10 (40%) 15 (60%)
Transportation to the store Drive own car Get a ride Take the bus Walk Other
3 (25.0%) 4 (33.3%) 4 (33.3%) 0 (0%) 1 (8.3%)
4 (31%) 2 (15.4%) 2 (15.4%) 4 (31%) 1 (7.7%)
7 (28%) 6 (24%) 6 (24%) 4 (16%) 2 (8%)
Number of minutes to the store Range Average
10-60 29.17
5-30 16.42
5-60 22.79
Best features of primary store for shopping Prices Quality of goods & services Other
6 (50%) 0 (0%) 6 (50%)
2 (15.4%) 5 (38.5%) 6 (46.2%)
8 (32%) 5 (20%) 12 (48%)
Least desirable feature of primary store for shopping Nothing Prices Other
2 (16.7%) 1 (8.3%) 9 (75%)
4 (30.8%) 2 (15.4%) 7 (53.8%)
6 (24%) 3 (12%) 16 (64%)
Diagnosed with chronic condition Yes No Unanswered
4 (33.3%) 7 (58.3%) 1 (8.3%)
6 (46.2%) 6 (46.2%) 1 (7.7%)
10 (40%) 13 (52%) 2 (8%)
Chronic condition diagnosis Diabetes High blood pressure Other
0 (0%) 1 (25%) 3 (75%)
3 (50.0%) 2 (33.3%) 1 (16.7%)
3 (30%) 3 (30%) 4 (40%)
Food Secure No Yes
7 (58.3%) 5 (41.7%)
9 (69.2%) 4 (30.8%)
16 (64%) 9 (36%)

146
BIBLIOGRAPHY
16:62 Design Zone. (2008). Available at: http:\\www.1662designzone.com: Accessed May 3, 2009. Alaimo, K. (2005). Food Insecurity in the United States. Topics in Clinical Nutrition, 20(4), 281-
298. Alwitt, L. F., & Donley, T. D. (1997). Retail Stores in Poor Urban Neighborhoods. The Journal
of Consumer Affairs, 31(1), 139-164. Apparicio, P., Cloutier, M.-S., & Shearmur, R. (2007). The Case of Montreal's Missing Food
Deserts: Evaluation of Accessibility to Food Supermarkets. International Journal of Health Geographics, 6(4).
Bhattacharya, J., Currie, J., & Haider, S. (2004). Poverty, food insecurity, and nutritional
outcomes in children and adults. Journal of Health Economics, 23(4), 839-862. Bianchi, S. M., Farley, R., & Spain, D. (1982). Racial Inequalities in Housing: An Examination
of Recent Trends. Demography, 19(1), 37-51. Biegel, D. E., Johnsen, J. A., & Shafran, R. (1997). Overcoming Barriers Faced by African
American Families with a Family Memeber with Mental Illness. Family Relations, 46(2), 163-178.
Birch, L. L., & Davison, K. K. (2001). Family environmental factors influencing the developing
behavioral controls of food intake and childhood overweight. Pediatric Clinics of North America, 48(4), 893-907.
Blank, R. (1997). It Takes a Nation: A New Agenda for Fighting Poverty. Princeton, NJ:
Princeton University Press. Block, J. P., Scribner, R. A., & DeSalvo, K. B. (2004). Fast Food, Race/Ethnicity, and Income.
American Journal of Preventive Medicine, 27(3), 211-217. Burke, J., O'Campo, P., & Peak, G. (2006). Neighborhood Influences on Intimate Partner
Violence: Does Geographic Setting Matter:. Journal of Urban Health, 83(2), 182-194. Burke, J., O'Campo, P., Salmon, C., & Walker, R. (2009). Pathways connecting neighborhood
influences and mental well-being: Socioeconomic position and gender differences. Social Science & Medicine, 68, 1294-1304.
Burke, J. G., O'Campo, P., Peak, G. L., Gielen, A. C., McDonnell, K. A., & Trochim, W. M. K.
(2005). An Introduction to Concept Mapping as a Participatory Public Health Research Method. Qualitative Health Research, 15(10), 1392-1410.

147
Campbell, C., & Desjardins, E. (1989). A model and research approach for studying the management of limited food resources by low income families. Journal of Nutrition Education, 21, 162-171.
Campfield, L. A., & Smith, F. J. (1999). The pathogenesis of obesity. Bailliere's Best Practice
and Research. Clinical Endocrinology and Metabolism, 13(1), 13-30. Chambers, R. L. (2007). An Exploratory Study of Local Affordability and Factors Related to
Household Food Security and Food Purchasing Decisions. The Internet Journal of Health, 5(2), 1-14.
Cheadle, A., Psaty, B., Curry, S., Wagner, E., Diehr, P., Koepsell, T., et al. (1991). Community-
level comparisons between the grocery store environment and individual dietary practices. Preventive Medicine, 20(2), 250-261.
Chung, C., & Myers, S. L. (1999). Do the Poor Pay More for Food? An Analysis of Grocery
Store Availability and Food Price Disparities. The Journal of Consumer Affairs, 33(2), 276-296.
Concept Systems, Inc. (2008). Ithaca, NY. Cotterill, R., & Franklin, A. (April 1995). The Urban Grocery Store Gap. Food Marketing
Policy Issue Paper No. 8. Food Marketing Policy Center: University of Connecticut. Cummins, S., & Macintyre, S. (2002). Food deserts - Evidence and assumption in health policy
making. BMJ, 325, 436-438. Cummins, S. C. J. (2003). The Local Food Environment and Health: Some Reflections from the
United Kingdom. American Journal of Public Health, 93(4), 521. Curtis, K., & McClellan, S. (1995). Falling Through the Safety Net: Poverty, Food Assistance
and Shopping Constraints in an American City. Urban Anthropology, 24, 93-135. Danziger, S. K., Corcoran, M., Danziger, S., & Heflin, C. (2000). Work, income, and material
hardship after welfare reform. Journal of Consumer Affairs, 34(1), 6-30. Davison, M. L. (1983). Multidimensional scaling. New York: John Wiley & Sons. DeNavas-Walt, C., Proctor, B., & Mills, R. (2004). Income, poverty, and health insurance
coverage in the United States: 2003. Current Population Reports, P60-226. Washington, DC:: U.S. Department of Commerce, U.S. Census Bureau.
Diesenhouse, S. (1993). As Suburbs Slow, Supermarkets Return to the Cities. The New York
Times June 27: F5.

148
Dietary Guidelines for Americans, 2005. United States Department of Agriculture and the Department of Health and Human Services. Available at: http://www.healthierus.gov/- dietaryguidelines: Accessed February 6, 2008.
Edin, K., & Lein, L. (1997). Making Ends Meet: How Single Mothers Survive Welfare and Low-
wage Work. New York: Russell Sage Foundation. Estabrooks, P. A., Lee, R. E., & Gyurcsik, N. C. (2003). Resources for Physical Activity
Participation: Does Availability and Accessibility Differ by Neighborhood Socioeconomic Status? Annals of Behavioral Medicine, 25(2), 100-104.
Everitt, B. (1980). Cluster analysis (2nd ed.). New York: Halsted Press. Flegal, K., Carrol, M., Kuczmarski, R., & Johnson, C. (1998). Overweight and obesity in the
United States: Prevalence and trends, 1960-1990. International Journal of Obesity, 22, 39-47.
Food Price Outlook. (2009). United States Department of Agriculture, Economic Research
Service. Available at: http://www.ers.usda.gov/Briefing/cpifoodandexpenditures/-consumerpriceindex.htm: Accessed May 3, 2009.
Franco, M., Roux, A. V. D., Glass, T. A., Caballero, B., & Brancati, F. L. (2008). Neighborhood
Characteristics and Availability of Healthy Foods in Baltimore. American Journal of Preventive Medicine, 35(6), 561-567.
Freedman, A. M. (1991). The Poor Pay More for Food in New York, Survey Finds. The Wall
Street Journal pp. B1, B5). Frongillo, E. A., Rauschenbach, B. S., Olson, C. M., Kendall, A., & Colmenares, A. G. (1997).
Questionnaire-Based Measures Are Valid for the Identification of Rural Households with Hunger and Food Insecurity. The Journal of Nutrition, 127(5), 699-705.
Furey, S., Strugnell, C., & McIlveen, H. (2001). An Investigation of the Potential Existence of
"Food Deserts" in Rural and Urban Areas of Northern Ireland. Agriculture and Human Values, 18, 447-457.
Gallo, A. E. (1999). Food Advertising in the United States. America's Eating Habits: Changes
and Consequences. U.S. Department of Agriculture, Economic Research Service, Food and Rural Economics Division. Agriculture Information Bulletin, No. 750 pp. 173-180).
Garasky, S., Morton, L. W., & Greder, K. (2004). The Food Environment and Food Insecurity:
Perceptions of Rural, Suburban, and Urban Food Pantry Clients in Iowa. Family Economics and Nutrition Review, 16(2), 41-48.

149
Giang, T., Karpyn, A., Laurison, H. B., Hillier, A., & Perry, R. D. (2008). Closing the grocery gap in underserved communities: The creation of the Pennsylvania Fresh Food Financing Initiative. Journal of Public Health Management and Practice, 14(3), 272-279.
Gittell, R., & Thompson, J. P. (1999). Inner-City Business Development and Entrepreneurship:
New Frontiers for Policy and Research. In R. F. Ferguson & W. T. Dickens (Eds.), Urban Problems and Community Development pp. 473-520). Washington, DC: Brookings Institution Press.
Grant, T. (November 2, 2007). Real Estate Prices Higher in Some Places. Pittsburgh Post
Gazette. Pittsburgh. Guy, C., Clarke, G., & Eyre, H. (2004). Food Retail Change and the Growth of Food Deserts: A
Case Study of Cardiff. International Journal of Retail and Distribution Management, 32(2), 72-88.
Hendrickson, D., Smith, C., & Eikenberry, N. (2006). Fruit and Vegetable Access in Four Low-
Income Food Deserts Communities in Minnesota. Agriculture and Human Values, 23, 371-383.
Inagami, S., Cohen, D. A., Finch, B. K., & Asch, S. M. (2006). You Are Where You Shop.
American Journal of Preventive Medicine, 31(1), 10-17. Jebb, S. A. (1997). Aetiology of obesity. British Medical Bulletin, 53(2), 264-285. Kane, M., & Trochim, W. M. K. (2007). Concept Mapping for Planning and Evaluation.
Thousand Oaks: Sage Publications. Kaufman, P. R. (1999). Rural Poor Have Less Access to Supermarkets, Large Grocery Stores.
Rural Development Perspectives, 13(3), 19-25. Kaufman, P. R., MacDonald, J., Lutz, S., & Smallwood, D. (1997). Do the Poor Pay More for
Food? Item Selection and Price Differences Affect Low-Income Household Food Costs. AER-759, USDA-ERS.
Kruskal, J. B., & Wish, M. (1978). Multidimensional scaling. Beverly Hills, CA: Sage. Lang, T., & Caraher, M. (1998). Access to healthy foods: part II. Food poverty and shopping
deserts: what are the implications for health promotion policy and practice? Health Education Journal, 57, 202-211.
Lewis, L. B., Sloane, D. C., Nascimento, L. M., Diamant, A. L., Guinyard, J. J., Yancey, A. K.,
et al. (2005). African Americans' Access to Healthy Food Options in South Los Angeles Restaurants. Research and Practice, 95(4), 668-673.

150
Magnani, R., Sabin, K., Saidel, T., & Heckathorn, D. (2005). Review of sampling hard-to-reach and hidden populations for HIV surveillance. AIDS, 19(suppl 2), S67-S72.
Mari Gallagher Research & Consulting Group. 2006. Examining the Impact of Food Deserts on
Public Health in Chicago. Commissioned by the LaSalle Bank, Chicago, IL. May, G. (2004). Jitneys remain in driver's seat. Pittsburgh Tribune-Review. Pittsburgh: June 20,
2004. Mayer, S. (1998). The consequences of inequality: The state of current research. In: Poverty Res
News, 11(3), 18-19. Mayer, S., & Jencks, C. (1988). Poverty and the distribution of material hardship. Journal of
Human Resources, 24(1), 88-111. Metro Chicago Information Center. (2008). Race and Place Matter for Major Chicago Area
Grocers. Chicago, IL: Available at: http://info.mcfol.org: Accessed December 22, 2008. Miller, C. (1994). Rediscovering the Inner City. Marketing News, 28(2, January 17), 1. Minkler, M., Blackwell, A. G., Thompson, M., & Tamir, H. (2003). Community-Based
Participatory Research: Implications for Public Health Funding. American Journal of Public Health, 93(8), 1210-11213.
Moore, L. V., & Roux, A. V. D. (2006). Associations of Neighborhood Characteristics With the
Location and Type of Food Stores. American Journal of Public Health, 96(2), 325-331. Morland, K., Diez Roux, A. V., & Wing, S. (2006). Supermarkets, other food stores, and obesity.
American Journal of Preventive Medicine, 30, 333-339. Morland, K., Wing, S., & Diez Roux, A. V. (2002a). The Contextual Effect of the Local Food
Environment on Residents' Diets: The Atherosclerosis Risk in Communities Study. American Journal of Public Health, 92(11), 1761-1767.
Morland, K., Wing, S., Roux, A. D., & Poole, C. (2002b). Neighborhood Characteristics
Associated with the Location of Food Stores and Food Service Places. American Journal of Preventive Medicine, 22(1), 23-29.
Morris, P. M., Neuhauser, L., & Cambell, C. (1992). Food Security in Rural America: A Study
of the Availability and Costs of Food. Journal of Nutrition Education, 24(1), 52S-58S. Morton, L. W., Bitto, E. A., Oakland, M. J., & Sand, M. (2005). Solving the Problems of Iowa
Food Deserts: Food Insecurity and Civic Structure. Rural Sociology, 70(1), 94-112.

151
National Center for Health Statistics, 2003-2004. Prevalence of Overweight and Obesity Among Adults: United States, 2003-2004. Available at: http://www.cdc.gov/nchs/products/-pubs/pubd/hestats/overweight/overwght_adult_03.htm: Accessed April 21, 2009.
Nayga, R. M., & Weinberg, Z. (1999). Supermarket access in the inner cities. Journal of
Retailing and Consumer Services, 6, 141-145. Nord, M., & Andrews, M. (2002). Reducing Food Insecurity in the United States: Assessing
Progress Toward a National Objective. United States Department of Agriculture/Economic Research Service. Food Assistance and Nutrition Research Report: No. 26-2.
Nord, M., Andrews, M., & Carlson, S. (2003). Household food security in the United States,
2003. Food Assistance and Nutrition Research Report FANRR42. Alexandria, Va: Food and Rural Economics Division, Economic Research Service, US Department of Agriculture.
Nord, M., Andrews, M., & Carlson, S. (2006). Household Food Security in the United States,
2005. Economic Research Report, No. (ERR-29), 1-68. Nord, M., Andrews, M., & Carlson, S. (2008). Measuring Food Security in the United States.
Household Food Security in the United States, 2007. United States Department of Agriculture Economic Research Service: Economic Research Report No. 66.
Nyden, P., Lukehart, J., Maly, M. T., & Peterman, W. (1998). Chapter 1: Neighborhood Racial
and Ethnic Diversity in U.S. Cities. Cityscape: A Journal of Policy Development and Research, 4(2), U.S. Department of Housing and Urban Development.
Olson, C., Anderson, K., Kiss, E., Lawrence, F., & Seiling, S. (2004). Factors protecting against
and contributing to food insecurity among rural families. Family Economics and Nutrition Review, 16(1), 12-20.
Pollard, J., Kirk, S. F. L., & Cade, J. E. (2002). Factors affecting food choice in relation to fruit
and vegetable intake: a review. Nutrition Research Reviews, 15, 373-387. Pothukuchi, K. (2000). Attracting Grocery Retail Investment to Inner-City Neighborhoods:
Planning Outside the Box. Detroit, Mich:: Wayne State University. Powell, L. M., Slater, S., Mirtcheva, D., Bao, Y., & Chaloupka, F. J. (2007). Food store
availability and neighborhood characteristics in the United States. Preventive Medicine, 44, 189-195.
Raja, S., Ma, C., & Yadav, P. (2008). Beyond Food Deserts: Measuring and Mapping Racial
Disparities in Neighborhood Food Environments. Journal of Planning Education and Research, 27, 469-482.

152
Reisig, V., & Hobbiss, A. (2000). Food deserts and how to tackle them: a study of one city's approach. Health Education Journal, 59, 137-149.
Roberts, C. (1995). Concept Mapping: An Effective Instructional Strategy for Diet Therapy.
Journal of the American Dietetic Association, 95(8), 908-911. Robinson, J., & Trochim, W. (2007). An Examination of Community Members', Researchers'
and Health Professionals' Perceptions of Barriers to Minority Participation in Medical Research: An Application of Concept Mapping. Ethnicity and Health, 12(5), 521-539.
Rose, D. (1999). Economic determinants and dietary consequences of food insecurity in the
United States. Journal of Nutrition, 129(2), 517-520. Rose, D., & Richards, R. (2004). Food Store Access and Household Fruit and Vegetable Use
Among Participants in the US Food Stamp Program. Public Health Nutrition, 7(8), 1081-1088.
Sallis, J. F., Nader, R., & Atkins, J. (1986). San Diego surveyed for heart healthy foods and
exercise facilities. Public Health Rep, 101, 216-218. Shaw, H. J. (2006). Food Deserts: Towards the Development of a Classification. Geogr Ann Ser
B-Human Geogr, 88B(2), 231-247. Short, A., Guthman, J., & Raskin, S. (2007). Food deserts, oases, or mirages? Journal of
Planning Education and Research, 26(3), 352-364. Stokols, D. (1992). Establishing and Maintaining Healthy Environments: Toward a Social
Ecology of Health Promotion. American Psychologist, 47(1), 6-22. Stuff, J., Casey, P., Szeto, K., Gossett, J., Robbins, J., Simpson, P., et al. (2004). Household
Food Insecurity is Associated with Adult Health Status. The Journal of Nutrition, 134(9), 2330-2336.
Swinburn, B., Caterson, I., Seidell, J., & James, W. (2004). Diet, Nutrition and the Prevention of
Excess Weight Gain and Obesity. Public Health Nutrition, 7(1A), 123-146. Trochim, W. (1989). An Introduction to Concept Mapping for Program Planning and Evaluation.
Evaluation and Program Planning, 12, 1-16. Trochim, W. M., & Kane, M. (2005). Concept Mapping: An Introduction to Structural
Conceptualization in Health Care. International Journal for Quality in Health Care, 17(3), 187-191.
Trochim, W. M. K. (1993). The reliability of concept mapping. Annual Conference of the
American Evaluation Association. Dallas, TX.

153
U.S. Census Bureau. (Undated). Poverty Status in the Past 12 Months of Families, 2005-2007 American Community Survey. Available at: http://factfinder.census.gov/servlet/-STTable?_bm=y&-geo_id=01000US&qr_name=ACS_2007_3YR_G00_S1702&-ds_name=ACS_2007_3YR_G00_&redoLog=false: Accessed April 2009.
U.S. Census Bureau, Current Poverty Data. (2005-2007). Available at: http://www.census.-
gov/hhes/www/poverty/poverty.html: Accessed July 9, 2008. U.S. Department of Health and Human Services, Centers for Disease Control and Prevention,
National Center for Chronic Disease Prevention and Health Promotion. (2008). Preventing Obesity and Chronic Diseases Through Good Nutrition and Physical Activity. Atlanta, GA: Available at: http://www.cdc.gov/nccdphp/publications/factsheets/-Prevention/obesity.htm:: Accessed July 30, 2008.
U.S. House of Representatives Select Committee on Hunger. (1990). Obtaining food: Shopping
Constraints of the Poor pp. 6-16). The Black Scholar. USAData. (New York, NY ). Available at: http://www.usadata.com. Weinberg, Z. (1995). No Place to Shop: The Lack of Supermarkets in Low-Income
Neighborhoods. Public Voice for Food and Health Policy. Washington, DC: 3. Whelan, A., Wrigley, N., Warm, D., & Cannings, E. (2002). Life in a 'Food Desert'. Urban
Studies, 39(11), 2083-2100. Widdus, R., Chacko, S., Holmand, K., & Currat, L. (2001). Towards Better Defining
Public/Private Partnerships for Health. Geneva Global Forum for Health Research. Wienk, R. E., Reid, C. E., Simmons, J. C., & Eggers, F. J. (1979). Measuring Racial
Discrimination in American Housing Markets: the Housing Market Practices Survey. Washington, DC, U.S. Department of Housing and Urban Development.
Wilson, S., Hutson, M., & Mujahid, M. (2008). How Planning and Zoning Contribute to
Inequitable Development, Neighborhood Health, and Environmental Injustice. Environmental Justice, 1(4), 211-216.
Winkler, E., Turrell, G., & Patterson, C. (2006). Does Living in a Disadvantaged Area Mean
Fewer Opportunities to Purchase Fresh Fruit and Vegetables in the Area? Findings from the Brisbane Food Study. Health & Place, 12(306-319).
Wooden, J. (2002). Food Label Use Among Older Americans and Food Assistance Program Use
and Other Factors Affecting Dietary Quality of Older Americans: Barriers and Mediators of Food Sufficiency. MS Thesis, Department of Food Science and Human Nutrition. Ames, Iowa: Iowa State University.

154
Wrigley, N., Warm, D., Margetts, B., & Whelan, A. (2002). Assessing the impact of improved retail access on diet in a "food desert": a preliminary report. Urban Stud, 39, 2061-2082.
Yoo, S., Weed, N. E., Lempa, M. L., Mbondo, M., Shada, R. E., & Goodman, R. M. (2004).
Collaborative Community Empowerment: An Illustration of a Six-Step Process. Health Promotion Practice, 5(3), 256-265.
Zenk, S. N., Schulz, A. J., Israel, B. A., James, S. A., Bao, S., & Wilson, M. L. (2005).
Neighborhood Racial Composition, Neighborhood Poverty, and the Spatial Accessibility of Supermarkets in Metropolitan Detroit. American Journal of Public Health, 95(4), 660-667.