Food and Beverage Industry Update March 2014 · PDF fileFood and Beverage Industry Update...
16
www.harriswilliams.com Member FINRA/SIPC Food and Beverage Industry Update March 2014
Transcript of Food and Beverage Industry Update March 2014 · PDF fileFood and Beverage Industry Update...

www.harriswilliams.com
Member FINRA/SIPC
Food and Beverage Industry Update
March 2014

2 of 16
What We’re Seeing
CONTENTS
INDUSTRY VITAL SIGNS
EQUITY MARKET OVERVIEW
M&A MARKET OVERVIEW
DEBT MARKET OVERVIEW
NOTABLE M&A ACTIVITY
PUBLIC COMPARABLES
EARNINGS CALENDAR
GROUP OVERVIEW
Harris Williams & Co. is a leading
advisor to the food and beverage
market. Our significant experience
covers a broad range of end
markets, industries, and business
models. This particular report
focuses on trends and metrics in the
following areas:
• Agribusiness
• Baked and Prepared Goods
• Beverages
• Branded and Private Label
• Dairy
• Distribution
• Ingredients
• Meat and Protein
• Natural and Organic
• Processing
• Produce
• Restaurant and Retail
• Snacks
CONTACTS
Glenn Gurtcheff | Managing Director
+1 (612) 359-2702
Tim Alexander | Managing Director
+1 (612) 359-2716
Ryan Budlong | Director
+1 (612) 359-2722
Brant Cash | Vice President
+1 (612) 359-2709
www.harriswilliams.com
On February 12th, Grupo Bimbo announced the acquisition of Canada Bread from Maple Leaf Foods.
Group Bimbo will pay an 8% premium to Canada Bread's closing price on the day prior to the
announcement. Access to the full article here.
Grupo Bimbo to Acquire Canada Bread
What We’re Reading
Unilver has hired Morgan Stanley to sell the Ragu pasta segment and expects to sell the brand for
between $1.5 billion and $2 billion. H.J. Heinz Co., Kraft Foods Group, and Pinnacle Foods were among
the companies contacted. Access to the full article here.
Unilever is Seeking Bidders for its Ragu Pasta Sauce
TGI Fridays is currently in advanced talks to sell itself to Tri-Artisan Capital Partners. Tri-Artisan, which
has partnered with Sentinel Capital Partners, has emerged as the lead bidder in the auction for the casual
dining restaurant chain, which could be valued in the $800 million to $900 million range. Access to the
full article here.
TGI Fridays in Advanced Talks with Tri-Artisan Capital Partners
M&A activity in the food and beverage sector continued its strong momentum with robust M&A activity
in February and the beginning of March. We recently attended the Expo West show and spoke with many
entrepreneurs, large corporations, and private equity owners about their strategic plans for the upcoming
year. We enjoyed seeing many of you at our cocktail event on Thursday night. Topics at the convention
included how to play in the natural and organic space, which is populated by many small, venture-like
investment opportunities. We continue to see more business owners that have achieved scale evaluate a
potential sale due to strong capital markets and M&A activity. Furthermore, large corporations expect to
see further M&A activity in 2014 and will be active acquirers themselves this year. The interest from
strategic buyers in addition to strong financing markets and private equity interest in the space will drive
elevated M&A activity in the food and beverage sector this year.
Market Update
Food and Beverage Industry Update
March 2014
What We’ve Been Doing
Closed HW&Co. Transactions
On March 6th, Cerberus Capital, parent company to Albertsons, announced the acquisition of Safeway, in
a deal valued at approximately $9.4 billion. The offer price of $40 per share represents a premium of 3%
to Safeway’s closing stock price on the day prior to the announcement. The combination of Albertsons
and Safeway will create the second largest grocery chain with a network of more than 2,400 stores and
250,000 employees. Access to the full article here.
Safeway and Albertsons Announce a Merger
a portfolio company of
has been acquired by
a portfolio company of
a portfolio company of
has been acquired by
a portfolio company of
has been acquired by
a portfolio company of
has been acquired by
a portfolio company of
has been acquired by
has been acquired byhas been acquired by
and
a portfolio company of
has been acquired by
a portfolio company of
has been acquired by
a portfolio company ofhas divested
selected assets to
and
has been acquired by
has acquired
has been acquired by
has been acquired by
a portfolio company of
has been acquired by
a portfolio company ofhas divested
selected assets to
and
has been acquired by
has acquired
a portfolio company ofa portfolio company of
has been acquired by
a portfolio company of
has been acquired by
a portfolio company of
has been acquired by
a portfolio company of
has been acquired by
has been acquired by
and
a portfolio company of
has been acquired by
a portfolio company of

3 of 16
Food and Beverage Industry Vital Signs
Consumer Food
Price Index
Inflation2
Commodity
Price Indices1
50
100
150
200
250
Jan-10 Jul-10 Jan-11 Jul-11 Jan-12 Jul-12 Jan-13 Jul-13 Jan-14
Co
mm
od
ity
Pri
ce I
nd
ex
Corn Wheat Soybeans Crude Oil
Protein Price
Indices2,3
Restaurant and
Grocery Store
Sales Indices4
80
100
120
140
160
Dec-09 Jun-10 Dec-10 Jun-11 Dec-11 Jun-12 Dec-12 Jun-13 Dec-13
Sa
les
Ind
ex
Restaurant Grocery
90
100
110
120
130
140
Jan-10 Jul-10 Jan-11 Jul-11 Jan-12 Jul-12 Jan-13 Jul-13 Jan-14
Pro
tein
Pri
ce I
nd
ex
Beef Pork Poultry
-0.5
1.0
2.5
4.0
5.5
Jan-10 Jul-10 Jan-11 Jul-11 Jan-12 Jul-12 Jan-13 Jul-13 Jan-14
Infl
ati
on
(%
)
Restaurant:
27.2%
Grocery:
11.3%
Beef:
27.5%
Pork:
20.6%
Poultry:
16.2%
Crude Oil:
36.6%
Wheat:
33.6%
Soybeans:
25.5%
Corn:
20.7%

Net Debt /
Industry and Segment 3 Month 1 Year 3 Month 1 Year Fwd PE LTM PE EV/EBITDA EBITDA
Protein Processing 5.9% 42.1% (5.8%) 26.2% 14.2x 15.9x 8.1x 2.4x
Fruit and Vegetable 1.6% 7.2% 9.1% 30.9% 14.0x 22.4x 10.6x 3.3x
Ingredients / Flavors 12.8% 29.7% 8.6% 15.2% 19.7x 24.2x 13.7x 1.1x
Agribusiness (0.1%) 24.3% 5.3% 23.6% 14.2x 20.1x 10.3x 0.8x
Branded Processed Foods 3.3% 9.4% 3.3% (5.5%) 20.2x 22.2x 13.0x 2.1x
Private Label Foods 0.4% 11.8% (4.0%) (10.2%) 19.9x 24.8x 12.6x 2.6x
Natural / Organic Foods 6.1% 44.3% (2.5%) (28.3%) 27.7x 32.9x 15.8x 2.2x
Baked Goods / Snack Foods 2.0% 30.7% 5.8% 21.3% 22.0x 24.9x 12.2x 2.2x
Dairy (1.1%) 3.4% 2.7% (11.3%) 18.8x 21.3x 12.2x 1.6x
Non-Alcoholic Beverages 6.4% 28.1% 1.5% 18.0% 19.6x 22.9x 13.5x 1.5x
Alcoholic Beverages 0.7% 3.0% 3.5% 3.2% 19.2x 17.0x 12.7x 2.8x
Food Retail (1.9%) 24.1% (0.9%) 15.1% 16.8x 17.7x 6.7x 3.9x
Grocery Distribution 7.2% 41.5% 16.3% 32.2% 22.8x 21.6x 11.0x 1.8x
Foodservice (9.8%) 10.6% (5.7%) 0.2% 21.4x 25.6x 9.9x 2.9x
Quick Service Restaurant 6.3% 58.8% 4.1% 31.0% 24.0x 29.9x 12.1x 2.1x
Casual Dining Restaurant 1.1% 33.4% (1.2%) 22.4% 20.3x 22.8x 10.6x 2.4x
Fast Casual 2.7% 46.0% 0.1% 30.4% 42.7x 22.9x 23.9x 0.9x
Pizza 15.6% 59.6% 15.7% 25.1% 29.0x 31.9x 16.7x 2.8x
Beverage / Snack Retail (4.6%) 27.6% (5.1%) 14.0% 28.4x 29.5x 17.8x 1.2x
Family Restaurant (8.9%) 16.2% (0.2%) 15.9% 18.1x 20.1x 9.3x 1.6x
O verall Median 2.0% 24.2% 1.6% 14.6% 20.1x 22.8x 11.7x 2.1x
Stock Price % ChangeEV/EBITDA % Change Current Valuation Stats
Fo
od
an
d B
ev
era
ge
Inp
uts
Co
nsu
mer a
nd
Reta
il
Key Trading
Statistics5
4 of 16
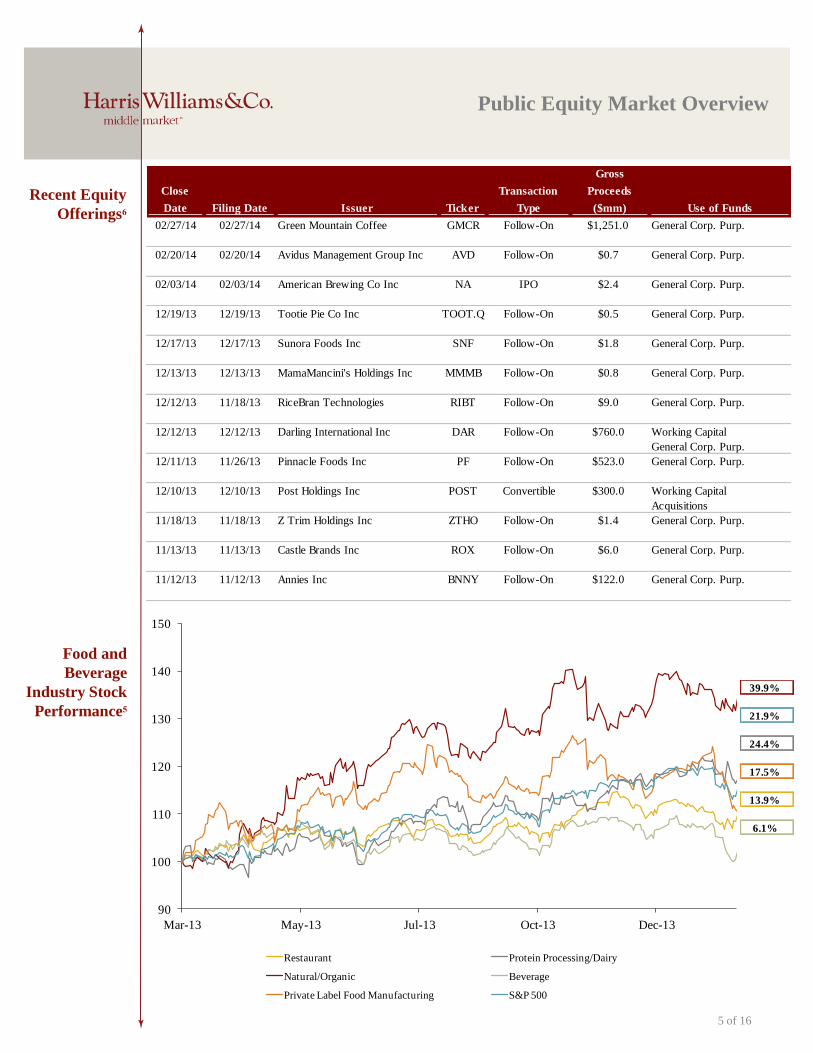
Public Equity Market Overview
Public
Company
Sector
Performance5
(One year change
in stock price)
Alcoholic Beverages
Dairy
Fruit and Vegetable
Branded Processed Foods
Foodservice
Private Label Foods
Family Restaurant
S&P
Food Retail
Agribusiness
Beverage / Snack Retail
Non-Alcoholic Beverages
Ingredients / Flavors
Baked Goods / Snack Foods
Casual Dining Restaurant
Protein Processing
Grocery Distribution
Natural / Organic Foods
Fast Casual
Quick Service Restaurant
Pizza
0.0% 10.0% 20.0% 30.0% 40.0% 50.0% 60.0% 70.0%
Inputs Food and Beverage Consumer and Retail
90
100
110
120
130
140
150
Mar-13 May-13 Jul-13 Oct-13 Dec-13
Restaurant Protein Processing/Dairy
Natural/Organic Beverage
Private Label Food Manufacturing S&P 500
Close
Date Filing Date Issuer Ticker
Transaction
Type
Gross
Proceeds
($mm) Use of Funds
02/27/14 02/27/14 Green Mountain Coffee GMCR Follow-On $1,251.0 General Corp. Purp.
02/20/14 02/20/14 Avidus Management Group Inc AVD Follow-On $0.7 General Corp. Purp.
02/03/14 02/03/14 American Brewing Co Inc NA IPO $2.4 General Corp. Purp.
12/19/13 12/19/13 Tootie Pie Co Inc TOOT.Q Follow-On $0.5 General Corp. Purp.
12/17/13 12/17/13 Sunora Foods Inc SNF Follow-On $1.8 General Corp. Purp.
12/13/13 12/13/13 MamaMancini's Holdings Inc MMMB Follow-On $0.8 General Corp. Purp.
12/12/13 11/18/13 RiceBran Technologies RIBT Follow-On $9.0 General Corp. Purp.
12/12/13 12/12/13 Darling International Inc DAR Follow-On $760.0 Working Capital
General Corp. Purp.
12/11/13 11/26/13 Pinnacle Foods Inc PF Follow-On $523.0 General Corp. Purp.
12/10/13 12/10/13 Post Holdings Inc POST Convertible $300.0 Working Capital
Acquisitions
11/18/13 11/18/13 Z Trim Holdings Inc ZTHO Follow-On $1.4 General Corp. Purp.
11/13/13 11/13/13 Castle Brands Inc ROX Follow-On $6.0 General Corp. Purp.
11/12/13 11/12/13 Annies Inc BNNY Follow-On $122.0 General Corp. Purp.
Recent Equity
Offerings6
5 of 16
Public Equity Market Overview
Food and
Beverage
Industry Stock
Performance5
39.9%
21.9%
24.4%
17.5%
13.9%
6.1%
Last 10 Deals Announced Private Equity Investments and Exits
Median Food and Bev. Transaction Multiples Announced Food and Bev. Transactions North American
Food and
Beverage M&A
Trends5
6 of 16
M&A Market Overview
Latest Deals
and Announced
Private Equity
Activity5
Highlighted
Food and
Beverage M&A
Transactions
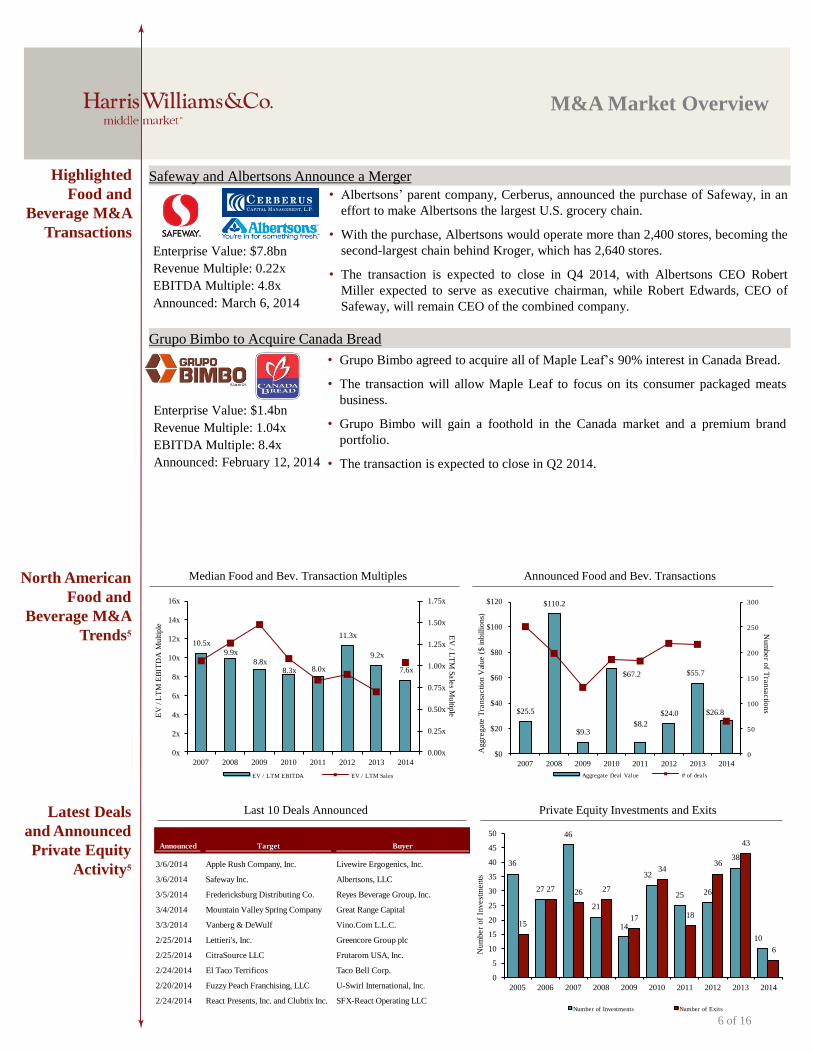
36
27
46
21
14
32
25 26
38
10
15
27 26 27
17
34
18
36
43
6
0
5
10
15
20
25
30
35
40
45
50
2005 2006 2007 2008 2009 2010 2011 2012 2013 2014
Num
be
r of
Inv
est
me
nts
Number of Investments Number of Exits
10.5x
9.9x
8.8x 8.3x 8.0x
11.3x
9.2x
7.6x
0.00x
0.25x
0.50x
0.75x
1.00x
1.25x
1.50x
1.75x
0x
2x
4x
6x
8x
10x
12x
14x
16x
2007 2008 2009 2010 2011 2012 2013 2014
EV
/ LT
M S
ale
s Mu
ltiple
EV
/ L
TM
EB
ITD
A M
ultip
le
EV / LTM EBITDA EV / LTM Sales
$25.5
$110.2
$9.3
$67.2
$8.2
$24.0
$55.7
$26.8
0
50
100
150
200
250
300
$0
$20
$40
$60
$80
$100
$120
2007 2008 2009 2010 2011 2012 2013 2014
Nu
mb
er o
f Tra
nsa
ctio
ns
Ag
gre
ga
te T
ran
sac
tio
n V
alu
e (
$ i
nb
illi
on
s)
Aggregate Deal Value # of deals
Announced Target Buyer1/0/1900 0 JAB Holdings B.V.
3/6/2014 Apple Rush Company, Inc. Livewire Ergogenics, Inc.
3/6/2014 Safeway Inc. Albertsons, LLC
3/5/2014 Fredericksburg Distributing Co. Reyes Beverage Group, Inc.
3/4/2014 Mountain Valley Spring Company Great Range Capital
3/3/2014 Vanberg & DeWulf Vino.Com L.L.C.
2/25/2014 Lettieri's, Inc. Greencore Group plc
2/25/2014 CitraSource LLC Frutarom USA, Inc.
2/24/2014 El Taco Terrificos Taco Bell Corp.
2/20/2014 Fuzzy Peach Franchising, LLC U-Swirl International, Inc.
2/24/2014 React Presents, Inc. and Clubtix Inc. SFX-React Operating LLC
Grupo Bimbo to Acquire Canada Bread
• Grupo Bimbo agreed to acquire all of Maple Leaf’s 90% interest in Canada Bread.
• The transaction will allow Maple Leaf to focus on its consumer packaged meats
business.
• Grupo Bimbo will gain a foothold in the Canada market and a premium brand
portfolio.
• The transaction is expected to close in Q2 2014.
Enterprise Value: $7.8bn
Revenue Multiple: 0.22x
EBITDA Multiple: 4.8x
Announced: March 6, 2014
Safeway and Albertsons Announce a Merger
• Albertsons’ parent company, Cerberus, announced the purchase of Safeway, in an
effort to make Albertsons the largest U.S. grocery chain.
• With the purchase, Albertsons would operate more than 2,400 stores, becoming the
second-largest chain behind Kroger, which has 2,640 stores.
• The transaction is expected to close in Q4 2014, with Albertsons CEO Robert
Miller expected to serve as executive chairman, while Robert Edwards, CEO of
Safeway, will remain CEO of the combined company.
Enterprise Value: $1.4bn
Revenue Multiple: 1.04x
EBITDA Multiple: 8.4x
Announced: February 12, 2014
Credit Statistics Average Secondary Spreads
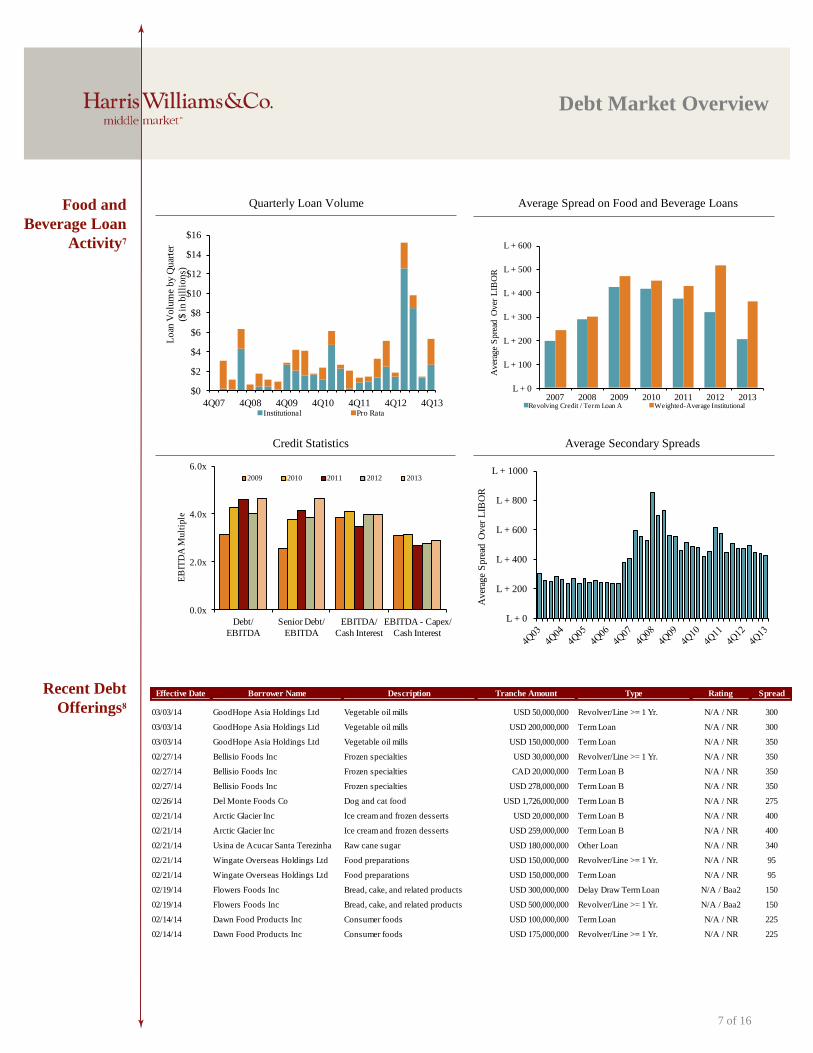
Quarterly Loan Volume Average Spread on Food and Beverage Loans Food and
Beverage Loan
Activity7
Recent Debt
Offerings8 Effective Date Borrower Name Description Tranche Amount Type Rating Spread
03/03/14 GoodHope Asia Holdings Ltd Vegetable oil mills USD 50,000,000 Revolver/Line >= 1 Yr. N/A / NR 300
03/03/14 GoodHope Asia Holdings Ltd Vegetable oil mills USD 200,000,000 Term Loan N/A / NR 300
03/03/14 GoodHope Asia Holdings Ltd Vegetable oil mills USD 150,000,000 Term Loan N/A / NR 350
02/27/14 Bellisio Foods Inc Frozen specialties USD 30,000,000 Revolver/Line >= 1 Yr. N/A / NR 350
02/27/14 Bellisio Foods Inc Frozen specialties CAD 20,000,000 Term Loan B N/A / NR 350
02/27/14 Bellisio Foods Inc Frozen specialties USD 278,000,000 Term Loan B N/A / NR 350
02/26/14 Del Monte Foods Co Dog and cat food USD 1,726,000,000 Term Loan B N/A / NR 275
02/21/14 Arctic Glacier Inc Ice cream and frozen desserts USD 20,000,000 Term Loan B N/A / NR 400
02/21/14 Arctic Glacier Inc Ice cream and frozen desserts USD 259,000,000 Term Loan B N/A / NR 400
02/21/14 Usina de Acucar Santa Terezinha Raw cane sugar USD 180,000,000 Other Loan N/A / NR 340
02/21/14 Wingate Overseas Holdings Ltd Food preparations USD 150,000,000 Revolver/Line >= 1 Yr. N/A / NR 95
02/21/14 Wingate Overseas Holdings Ltd Food preparations USD 150,000,000 Term Loan N/A / NR 95
02/19/14 Flowers Foods Inc Bread, cake, and related products USD 300,000,000 Delay Draw Term Loan N/A / Baa2 150
02/19/14 Flowers Foods Inc Bread, cake, and related products USD 500,000,000 Revolver/Line >= 1 Yr. N/A / Baa2 150
02/14/14 Dawn Food Products Inc Consumer foods USD 100,000,000 Term Loan N/A / NR 225
02/14/14 Dawn Food Products Inc Consumer foods USD 175,000,000 Revolver/Line >= 1 Yr. N/A / NR 225
7 of 16
Debt Market Overview
0.0x
2.0x
4.0x
6.0x
Debt/
EBITDA
Senior Debt/
EBITDA
EBITDA/
Cash Interest
EBITDA - Capex/
Cash Interest
EB
ITD
A M
ult
iple
2009 2010 2011 2012 2013
L + 0
L + 200
L + 400
L + 600
L + 800
L + 1000A
ver
age
Sp
read
Ov
er L
IBO
R
L + 0
L + 100
L + 200
L + 300
L + 400
L + 500
L + 600
2007 2008 2009 2010 2011 2012 2013
Av
erag
e S
pre
ad O
ver
LIB
OR
Revolving Credit / Term Loan A Weighted-Average Institutional
$0
$2
$4
$6
$8
$10
$12
$14
$16
4Q07 4Q08 4Q09 4Q10 4Q11 4Q12 4Q13
Loan
Volu
me
by
Quar
ter
($ i
n b
illi
on
s)
Institutional Pro Rata
8 of 16
Recent North
American Food
and Beverage
M&A5
Recent North American Food
and Beverage M&A Activity
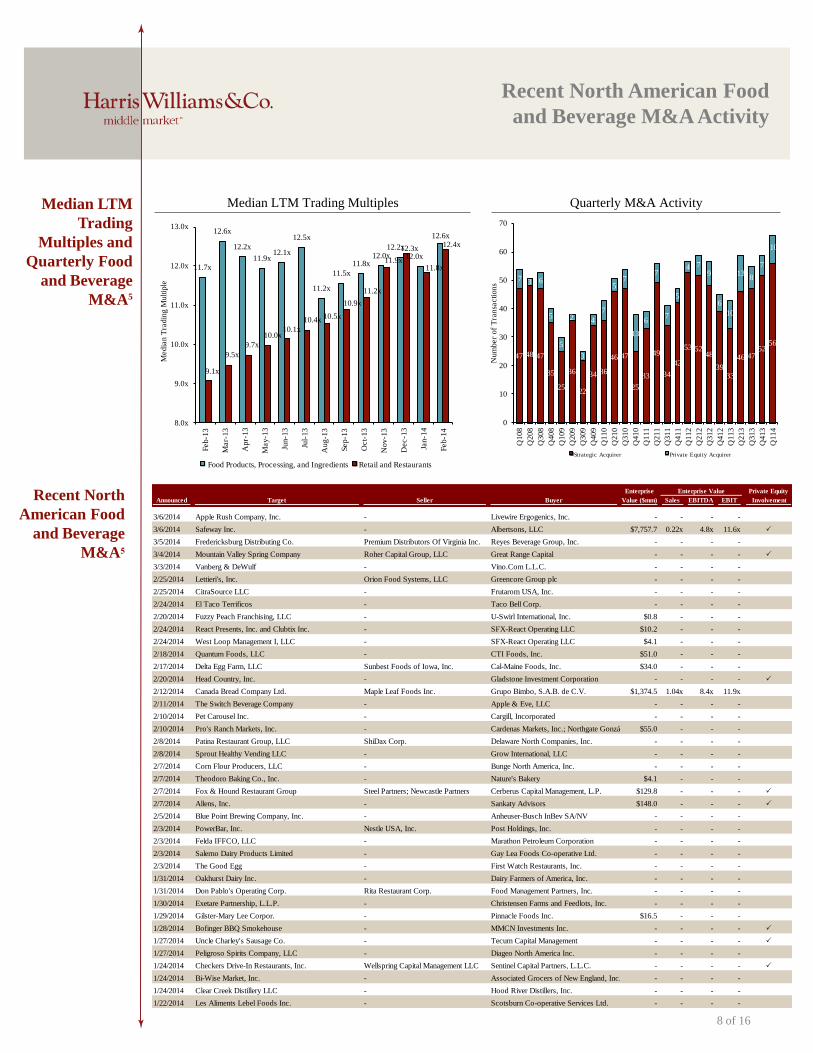
Quarterly M&A Activity Median LTM
Trading
Multiples and
Quarterly Food
and Beverage
M&A5
Median LTM Trading Multiples
47 48 47
35
25
36
22
34 36
46 47
25
33
49
34
42
53 5248
3933
46 4752
56
7 3 6
5
5
2
3
4
7
57
13
6
7
7
5
4 79
6
10
138
7
10
0
10
20
30
40
50
60
70
Q10
8
Q20
8
Q30
8
Q4
08
Q10
9
Q20
9
Q30
9
Q40
9
Q1
10
Q21
0
Q31
0
Q41
0
Q1
11
Q21
1
Q31
1
Q41
1
Q11
2
Q2
12
Q31
2
Q41
2
Q11
3
Q2
13
Q31
3
Q41
3
Q11
4
Num
be
r of
Tra
nsa
ction
s
Strategic Acquirer Private Equity Acquirer
Enterprise Enterprise Value Private Equity
Announced Target Seller Buyer Value ($mm) Sales EBITDA EBIT Involvement
3/6/2014 Apple Rush Company, Inc. - Livewire Ergogenics, Inc. - - - -
3/6/2014 Safeway Inc. - Albertsons, LLC $7,757.7 0.22x 4.8x 11.6x P
3/5/2014 Fredericksburg Distributing Co. Premium Distributors Of Virginia Inc. Reyes Beverage Group, Inc. - - - -
3/4/2014 Mountain Valley Spring Company Roher Capital Group, LLC Great Range Capital - - - - P
3/3/2014 Vanberg & DeWulf - Vino.Com L.L.C. - - - -
2/25/2014 Lettieri's, Inc. Orion Food Systems, LLC Greencore Group plc - - - -
2/25/2014 CitraSource LLC - Frutarom USA, Inc. - - - -
2/24/2014 El Taco Terrificos - Taco Bell Corp. - - - -
2/20/2014 Fuzzy Peach Franchising, LLC - U-Swirl International, Inc. $0.8 - - -
2/24/2014 React Presents, Inc. and Clubtix Inc. - SFX-React Operating LLC $10.2 - - -
2/24/2014 West Loop Management I, LLC - SFX-React Operating LLC $4.1 - - -
2/18/2014 Quantum Foods, LLC - CTI Foods, Inc. $51.0 - - -
2/17/2014 Delta Egg Farm, LLC Sunbest Foods of Iowa, Inc. Cal-Maine Foods, Inc. $34.0 - - -
2/20/2014 Head Country, Inc. - Gladstone Investment Corporation - - - - P
2/12/2014 Canada Bread Company Ltd. Maple Leaf Foods Inc. Grupo Bimbo, S.A.B. de C.V. $1,374.5 1.04x 8.4x 11.9x
2/11/2014 The Switch Beverage Company - Apple & Eve, LLC - - - -
2/10/2014 Pet Carousel Inc. - Cargill, Incorporated - - - -
2/10/2014 Pro's Ranch Markets, Inc. - Cardenas Markets, Inc.; Northgate González Markets, Inc.$55.0 - - -
2/8/2014 Patina Restaurant Group, LLC ShiDax Corp. Delaware North Companies, Inc. - - - -
2/8/2014 Sprout Healthy Vending LLC - Grow International, LLC - - - -
2/7/2014 Corn Flour Producers, LLC - Bunge North America, Inc. - - - -
2/7/2014 Theodoro Baking Co., Inc. - Nature's Bakery $4.1 - - -
2/7/2014 Fox & Hound Restaurant Group Steel Partners; Newcastle Partners Cerberus Capital Management, L.P. $129.8 - - - P
2/7/2014 Allens, Inc. - Sankaty Advisors $148.0 - - - P
2/5/2014 Blue Point Brewing Company, Inc. - Anheuser-Busch InBev SA/NV - - - -
2/3/2014 PowerBar, Inc. Nestle USA, Inc. Post Holdings, Inc. - - - -
2/3/2014 Felda IFFCO, LLC - Marathon Petroleum Corporation - - - -
2/3/2014 Salerno Dairy Products Limited - Gay Lea Foods Co-operative Ltd. - - - -
2/3/2014 The Good Egg - First Watch Restaurants, Inc. - - - -
1/31/2014 Oakhurst Dairy Inc. - Dairy Farmers of America, Inc. - - - -
1/31/2014 Don Pablo's Operating Corp. Rita Restaurant Corp. Food Management Partners, Inc. - - - -
1/30/2014 Exetare Partnership, L.L.P. - Christensen Farms and Feedlots, Inc. - - - -
1/29/2014 Gilster-Mary Lee Corpor. - Pinnacle Foods Inc. $16.5 - - -
1/28/2014 Bofinger BBQ Smokehouse - MMCN Investments Inc. - - - - P
1/27/2014 Uncle Charley's Sausage Co. - Tecum Capital Management - - - - P
1/27/2014 Peligroso Spirits Company, LLC - Diageo North America Inc. - - - -
1/24/2014 Checkers Drive-In Restaurants, Inc. Wellspring Capital Management LLC Sentinel Capital Partners, L.L.C. - - - - P
1/24/2014 Bi-Wise Market, Inc. - Associated Grocers of New England, Inc. - - - -
1/24/2014 Clear Creek Distillery LLC - Hood River Distillers, Inc. - - - -
1/22/2014 Les Aliments Lebel Foods Inc. - Scotsburn Co-operative Services Ltd. - - - -
11.7x
12.6x
12.2x
11.9x12.1x
12.5x
11.2x
11.5x
11.8x12.0x
12.2x
12.0x
12.6x
9.1x
9.5x
9.7x
10.0x10.1x
10.4x10.5x
10.9x
11.2x
11.9x
12.3x
11.8x
12.4x
8.0x
9.0x
10.0x
11.0x
12.0x
13.0x
Feb
-13
Mar-
13
Ap
r-1
3
May-1
3
Jun-1
3
Jul-
13
Au
g-1
3
Sep
-13
Oct-
13
No
v-1
3
Dec
-13
Jan
-14
Feb
-14
Med
ian
Tra
din
g M
ultip
le
Food Products, Processing, and Ingredients Retail and Restaurants

Recent North
American Food
and Beverage
M&A5
(continued)
9 of 16
Recent North American Food
and Beverage M&A Activity
Enterprise Enterprise Value Private Equity
Announced Target Seller Buyer Value ($mm) Sales EBITDA EBIT Involvement
1/24/2014 Clear Creek Distillery LLC - Hood River Distillers, Inc. - - - -
1/22/2014 Les Aliments Lebel Foods Inc. - Scotsburn Co-operative Services Ltd. - - - -
1/22/2014 SunWise Foods, LLC - J.S.B. Industries, Inc. - - - -
1/21/2014 Shangri La Tea Company Inc. - LaRue Distributing, Inc. - - - -
1/20/2014 Paradise on Wings Franchise Group, LLC - American Restaurant Concepts, Inc. $1.6 - - -
1/18/2014 Artinian, Inc. - Tyson Foods, Inc. - - - -
1/17/2014 Yogli Mogli, LLC - U-Swirl, Inc. $2.4 - - -
1/17/2014 CherryBerry Enterprises, LLC - U-Swirl, Inc. $7.1 - - -
1/17/2014 Scotsburn Co-Operative Services - Saputo, Inc. $55.7 0.38x 7.6x -
1/17/2014 David's Supermarkets, Inc. - Brookshire Brothers, Ltd. - - - -
1/16/2014 Fernbrook Springs Bottled Water Company - Ice River Springs Water Co. Inc. - - - -
1/15/2014 CEC Entertainment Inc. (NYSE:CEC) - Apollo Global Management, LLC $1,295.4 1.58x 7.6x 14.1x
1/15/2014 Brand Vitamin Discounters LLC - The Professional Supplement Center - - - -
1/15/2014 Performance Pet Nutrition, LLC Encore Consumer Capital Nestle Purina PetCare Company - - - - P
1/15/2014 Advanced Ag, LLC - Wilbur-Ellis Company - - - -
1/14/2014 CLIC International Inc. Desjardins Business Capital Alliance Grain Traders Inc. - - - -
1/13/2014 Williams & Bennett - BBX Sweet Holdings - - - -
1/13/2014 Enlightened Hospitality Group Inc. - Hakkasan Ltd. - - - -
1/13/2014 New Carbon Company, LLC PNC Riverarch Capital Roch Capital - - - - P
1/12/2014 Beam, Inc. Fidelity Management Suntory Holdings Limited $15,816.6 6.27x 20.4x 24.1x P
1/10/2014 Fronteras Mexican Grill & Cantina - American Restaurant Holdings, Inc. - - - -
1/10/2014 Picnic Pros, Inc. - M Culinary Concepts, LLC - - - -
1/10/2014 Dixie Donuts - Daylight Donut Flour Company, LLC - - - -
1/9/2014 PJ United, Inc. The Halifax Group TPG Growth - - - - P
1/8/2014 HeartHealth4Me - Patient Home Monitoring Corp. $0.2 - - -
1/2/2014 Natural American Foods, Inc. - Peak Rock Capital - - - - P
12/30/2013 New England Tea & Coffee Co., Inc. - Reily Foods Company, Inc. - - - -
12/27/2013 DeMet's Candy Company Brynwood Partners Yildiz Holding A.S. $221.0 - - - P
12/23/2013 Phil's Fresh Foods, LLC Revelry Brands GFA Brands, Inc. $48.0 - - - P
12/20/2013 Arden Group Inc. - TPG Capital, L.P. $364.0 0.80x 9.9x 11.4x P
12/18/2013 Premium Wine Group Southport Lane Premium Beverage Group, Inc. - - - -
12/18/2013 Austaco, LTD. - Tacala LLC - - - -
12/17/2013 Dulcinea Farms, LLC Syngenta AG Pacific Trellis Fruit LLC - - - -
12/16/2013 The Bailey Company, L.L.L.P. - United States Beef Corporation - - - -
12/13/2013 Merica Corp., Inc. - Applied Vaccines Therapeutics, LLC - - - -
12/13/2013 Splash Water Inc. - DS Waters of America, Inc. - - - -
12/12/2013 Bruce's Yams Bruce Foods Corporation Mccall Farms, Inc. - - - -
12/11/2013 Hagelin & Company Inc. - Frutarom USA, Inc. $52.4 2.17x - -
12/11/2013 Allen Brothers, Inc. - The Chefs' Warehouse, Inc. $29.9 - 7.0x -
12/10/2013 Synergy Strips Worldwide Inc. - Homie Recipes, Inc. - - - -
12/10/2013 Hoffmans Chocolate, LLC - BBX Capital Corporation - - - -
12/9/2013 LATITUDE 1 - Specialty Commodities Incorporated - - - -
12/8/2013 Natural Selection Foods, LLC GarMark Advisors; Stockwell Capital The WhiteWave Foods Company $600.0 1.30x 8.0x - P
12/8/2013 US Foods, Inc. Clayton, Dubilier & Rice; KKR Sysco Corporation $8,256.5 0.37x 10.5x 20.3x P
12/7/2013 Golden Boy Foods Ltd. Tricor Pacific Capital, Inc. Post Holdings, Inc. $300.6 1.95x 9.1x - P
12/6/2013 Driftwood Dairy Holding Corporation - Vietnam Dairy Products $10.0 0.10x - -
12/6/2013 Northern Beef Packers, LP - White Oak Global Advisors LLC $44.3 - - - P
12/5/2013 Vasari, Llc - Eagle Merchant Partners - - - - P
12/4/2013 BikeCaffe Franchising, Inc. - Jammin Java Corp. $0.1 - - -
12/1/2013 Cook Street Coffee LLC - Jumpin' Jacks Beans LLC - - - -
11/27/2013 Koffee Korner Inc. - Cardax Pharmaceuticals, Inc. - - - -
11/25/2013 Celis Beers Craftbev International Vino.Com L.L.C. - - - -
11/25/2013 Golden West Baking Co Inc. - C.H. Guenther & Son, Inc. - - - -
11/22/2013 GNP Company - The Maschhoffs, LLC - - - - P
11/22/2013 Damafro Inc. Fonds régional de solidarité Agropur Cooperative - - - -
11/19/2013 CKE Inc. Apollo Global Management Roark Capital Group - - - - P
11/18/2013 Keg Restaurants, Ltd. - Fairfax Financial Holdings Limited - - - - P
11/14/2013 Girkin Development, LLC - TravelCenters of America LLC $67.0 - - -
11/14/2013 Tops Holding Corp. Morgan Stanley Private Equity Management - - - - P
11/12/2013 New Leaf Community Markets, Inc. - New Seasons Market, Inc. - - - -
11/9/2013 City Ice Company - Reddy Ice Corporation - - - -
11/6/2013 PetAg, Inc. - PBI/Gordon Corporation - - - -

10 of 16
Member FINRA/SIPC
Trading Statistics Detail5
Price at As a % of Market Cash & Enterprise P/E
($ in millions, except per share data) Ticker 3/6/14 52-wk High Cap Debt Equiv. Value (EV) Revenue EBITDA 1 Year 3 Years Gross EBITDA Multiple Revenue EBITDA Revenue EBITDA
Food and Beverage
Branded Processed Foods
Associated British Foods plc ABF $50.05 98.7% $39,520 $1,850 $576 $40,795 $21,130 $2,564 6.1% 10.0% 24.2% 12.1% 40.0x 1.93x 15.9x 1.78x 14.8x
Campbell Soup Company CPB 43.83 89.8% 13,791 4,205 293 17,703 8,131 1,426 9.3% 2.2% 36.3% 17.5% 19.8x 2.18x 12.4x 2.08x 10.7x
ConAgra Foods, Inc. CAG 29.18 78.3% 12,183 9,636 197 21,622 17,373 2,152 25.3% 13.2% 21.3% 12.4% 18.0x 1.24x 10.0x 1.26x 9.0x
General Mills, Inc. GIS 50.79 95.7% 31,627 8,645 774 39,497 18,090 3,476 5.7% 7.1% 35.6% 19.2% 18.8x 2.18x 11.4x 2.14x 10.7x
Hormel Foods Corporation HRL 47.40 98.9% 12,619 250 640 12,229 8,878 964 6.9% 6.2% 16.5% 10.9% 23.5x 1.38x 12.7x 1.34x 11.5x
Kellogg Company K 61.43 90.4% 22,011 7,358 273 29,096 14,792 3,676 4.2% 6.1% 42.7% 24.9% 12.4x 1.97x 7.9x 1.92x 10.5x
McCormick & Company, Incorporated MKC 66.93 88.9% 8,765 1,233 75 9,923 4,123 701 2.7% 7.3% 40.4% 17.0% 23.0x 2.41x 14.2x 2.30x 13.4x
Mondelez International, Inc. MDLZ 34.80 96.5% 58,395 17,159 2,937 72,617 35,299 5,589 0.8% 3.9% 37.1% 15.8% 26.6x 2.06x 13.0x 2.01x 12.4x
Nestlé S.A. NESN 75.92 95.6% 242,170 24,713 8,031 258,851 103,732 19,437 5.6% 5.5% 47.9% 18.7% 21.4x 2.50x 13.3x 2.43x 12.6x
The Hain Celestial Group, Inc. HAIN 93.93 95.0% 4,578 628 68 5,138 1,932 256 25.3% 24.8% 26.7% 13.3% 32.9x 2.66x 20.0x 2.20x 15.0x
The Hershey Company HSY 106.22 97.7% 23,869 1,962 1,119 24,712 7,146 1,564 7.6% 8.0% 45.9% 21.9% 29.5x 3.46x 15.8x 3.23x 14.3x
The J. M. Smucker Company SJM 97.87 85.3% 10,206 2,029 182 12,053 5,716 1,226 (3.3%) 6.7% 36.4% 21.5% 18.0x 2.11x 9.8x 2.11x 9.8x
The WhiteWave Foods Company WWAV 29.83 97.9% 5,208 708 101 5,814 2,542 274 11.0% NA 35.7% 10.8% NM 2.29x 21.2x 1.76x 14.7x
Mean 8.2% 8.4% 34.4% 16.6% 23.7x 2.18x 13.7x 2.04x 12.3x
Median 6.1% 6.9% 36.3% 17.0% 22.2x 2.18x 13.0x 2.08x 12.4x
Private Label Foods
Flowers Foods, Inc. FLO $20.57 80.1% $4,301 940 9 $5,233 $3,751 $417 23.1% 13.4% 47.4% 11.1% 18.9x 1.40x 12.6x 1.29x 10.9x
Snyder's-Lance, Inc. LNCE 27.77 85.5% 1,943 498 14 2,427 1,761 187 8.8% 21.6% 34.0% 10.6% 24.8x 1.38x 13.0x 1.33x 11.2x
Treehouse Foods, Inc. THS 70.65 93.1% 2,573 940 55 3,459 2,294 297 5.1% 8.1% 21.5% 13.0% 30.2x 1.51x 11.6x 1.38x 9.7x
Mean 12.3% 14.3% 34.3% 11.6% 24.7x 1.43x 12.4x 1.33x 10.6x
Median 8.8% 13.4% 34.0% 11.1% 24.8x 1.40x 12.6x 1.33x 10.9x
Natural / Organic Foods
Amira Nature Foods Ltd. ANFI $16.04 64.2% $605 $160 $35 $731 $501 $65 25.0% 106.0% 22.9% 13.0% 20.8x 1.46x 11.2x 1.30x 9.3x
Annie's, Inc. BNNY 39.02 74.5% 669 0 3 666 197 26 22.7% 27.0% 38.0% 13.3% 46.8x 3.39x 25.5x 2.96x 20.7x
SunOpta Inc. TSX:SOY 9.52 88.1% 643 192 9 826 1,182 60 8.3% 12.4% 11.1% 5.1% NM 0.70x 13.8x 0.65x 10.3x
The Hain Celestial Group, Inc. HAIN 93.93 95.0% 4,578 628 68 5,138 1,932 256 25.3% 24.8% 26.7% 13.3% 32.9x 2.66x 20.0x 2.20x 15.0x
United Natural Foods, Inc. UNFI 74.95 97.5% 3,695 263 9 3,949 6,256 240 15.2% 16.8% 16.9% 3.8% 32.2x 0.63x 16.4x 0.57x 14.3x
Whole Foods Market, Inc. WFM 53.92 82.2% 20,146 32 1,042 19,136 13,300 1,264 9.3% 12.4% 35.8% 9.5% 36.1x 1.44x 15.1x 1.28x 13.6x
Mean 17.6% 33.2% 25.2% 9.7% 33.8x 1.71x 17.0x 1.50x 13.9x
Median 19.0% 20.8% 24.8% 11.2% 32.9x 1.45x 15.8x 1.29x 14.0x
Baked Goods / Snack Foods
ARYZTA AG SWX:ARYN $84.37 98.5% $7,435 $2,002 $832 $8,605 $5,977 $752 15.4% 15.0% 27.2% 12.6% 48.8x 1.44x 11.4x 1.32x 10.1x
Diamond Foods, Inc. DMND 30.68 98.7% 821 606 10 1,417 840 40 (11.8%) 3.7% 24.4% 4.8% NM 1.69x 35.1x 1.65x 12.4x
Flowers Foods, Inc. FLO 20.57 80.1% 4,301 940 9 5,233 3,751 417 23.1% 13.4% 47.4% 11.1% 18.9x 1.40x 12.6x 1.29x 10.9x
George Weston Limited WN 73.71 89.9% 9,304 10,391 3,940 15,755 32,400 2,344 (3.1%) 0.9% 24.5% 7.2% 22.9x 0.49x 6.7x 0.41x 5.3x
Golden Enterprises Inc. GLDC 4.10 94.0% 49 7 1 55 138 6 0.3% 2.8% 48.5% 4.0% NM 0.40x 9.8x NA NA
Grupo Bimbo, S.A.B. de C.V. BIMBO A 2.74 75.8% 12,656 3,147 191 15,611 13,451 1,431 0.9% 12.3% 52.3% 10.6% 38.4x 1.16x 10.9x 1.10x 10.1x
Inventure Foods, Inc. SNAK 12.99 92.8% 257 72 1 327 216 16 16.4% 17.2% 18.0% 7.6% 40.0x 1.52x 20.0x 1.11x 12.1x
J&J Snack Foods Corp. JJSF 95.85 98.0% 1,769 1 106 1,664 880 134 3.6% 7.8% 30.6% 15.3% 26.8x 1.89x 12.4x 1.81x 11.3x
John B Sanfilippo & Son Inc. JBSS 23.13 88.0% 256 69 10 315 743 54 4.1% 5.9% 16.0% 7.3% 11.8x 0.42x 5.8x NA NA
Lancaster Colony Corporation LANC 95.20 99.8% 2,563 0 176 2,387 1,170 186 0.7% 2.7% 23.0% 15.9% 23.1x 2.04x 12.8x 2.23x 12.2x
Penford Corporation PENX 13.64 85.4% 173 74 0 246 458 20 3.5% 20.9% 9.3% 4.4% NM 0.54x 12.2x 0.51x 7.8x
Mean 4.8% 9.3% 29.2% 9.2% 28.8x 1.18x 13.6x 1.27x 10.3x
Median 3.5% 7.8% 24.5% 7.6% 24.9x 1.40x 12.2x 1.29x 10.9x
Last Twelve Months (LTM) EV / LTM EV / 2013ERevenue Growth LTM Margins

Member FINRA/SIPC
11 of 16
Trading Statistics Detail (continued)5
Price at As a % of Market Cash & Enterprise P/E
($ in millions, except per share data) Ticker 3/6/14 52-wk High Cap Debt Equiv. Value (EV) Revenue EBITDA 1 Year 3 Years Gross EBITDA Multiple Revenue EBITDA Revenue EBITDA
Dairy
Danone BN $70.22 83.9% $41,156 $0 $0 $41,156 $29,330 $4,791 6.6% 8.7% 100.0% 16.3% 21.0x 1.40x 8.6x 1.38x 8.4x
Dean Foods Company DF 14.90 35.4% 1,404 897 17 2,285 9,016 374 (2.8%) (5.9%) 20.6% 4.1% 4.3x 0.25x 6.1x 0.25x 6.6x
Glanbia plc GL9 15.34 96.3% 4,517 673 95 5,095 3,055 265 26.6% 6.5% 36.4% 8.7% 24.8x 1.67x 19.2x 1.49x 16.4x
Lifeway Foods Inc. LWAY 14.40 72.0% 235 10 4 241 92 13 19.0% 19.4% 34.0% 13.6% 35.9x 2.62x 19.2x 2.22x 17.0x
Saputo Inc. TSX:SAP 50.73 100.0% 9,712 1,568 80 11,201 8,284 915 18.8% 11.7% 11.0% 11.0% 21.3x 1.35x 12.2x 1.25x 11.2x
Mean 13.6% 8.1% 40.4% 10.8% 21.4x 1.46x 13.1x 1.32x 11.9x
Median 18.8% 8.7% 34.0% 11.0% 21.3x 1.40x 12.2x 1.38x 11.2x
Non-Alcoholic Beverages
A.G.Barr p.l.c. LSE:BAG $10.22 96.8% $1,180 $46 $22 $1,204 $376 $66 8.4% 3.5% 45.9% 17.7% 29.5x 3.20x 18.1x 2.85x 15.6x
Cott Corporation BCB 8.13 77.9% 768 458 47 1,179 2,094 194 (7.0%) 5.1% 12.0% 9.3% 46.9x 0.56x 6.1x 0.58x 6.3x
Dr Pepper Snapple Group, Inc. DPS 52.01 98.8% 10,280 2,608 170 12,718 5,997 1,319 0.0% 2.1% 58.3% 22.0% 17.1x 2.12x 9.6x 2.11x 9.4x
Green Mountain Coffee Roasters, Inc. GMCR 107.23 86.2% 18,303 265 349 18,219 4,406 1,042 9.1% 40.6% 37.8% 23.7% 32.8x 4.14x 17.5x 3.77x 15.6x
Lassonde Industries Inc. LAS.A 102.33 94.8% 720 276 14 982 1,003 113 (2.6%) 24.3% 27.9% 11.2% 17.4x 0.98x 8.7x NA NA
Monster Beverage Corporation MNST 73.05 96.6% 12,255 0 614 11,642 2,246 606 9.0% 19.9% 52.2% 27.0% 37.7x 5.18x 19.2x 4.55x 16.0x
National Beverage Corp. FIZZ 20.99 94.3% 988 35 27 996 645 78 (2.3%) 2.6% 34.2% 12.0% 22.9x 1.55x 12.8x 1.50x NA
Pepsico, Inc. PEP 81.30 93.4% 123,487 29,639 9,678 143,448 66,415 12,344 1.4% 4.7% 53.0% 18.6% 18.8x 2.16x 11.6x 2.14x 11.1x
Starbucks Corporation SBUX 72.87 88.3% 53,896 2,048 1,703 54,241 15,339 3,052 12.3% 11.9% 57.3% 19.9% NM 3.54x 17.8x 3.18x 14.0x
The Coca-Cola Company KO 38.53 88.7% 168,966 37,082 20,268 185,780 46,854 13,104 (2.4%) 10.1% 60.7% 28.0% 20.2x 3.97x 14.2x 3.97x 13.9x
Mean 2.6% 12.5% 43.9% 18.9% 27.0x 2.74x 13.6x 2.74x 12.7x
Median 0.7% 7.6% 49.1% 19.2% 22.9x 2.68x 13.5x 2.85x 14.0x
Alcoholic Beverages
Anheuser-Busch InBev SA/NV ENXTBR:ABI $104.19 94.5% $167,355 $49,126 $9,962 $206,519 $43,195 $16,601 8.6% 6.0% 59.3% 38.4% 11.9x 4.78x 12.4x 4.36x 10.9x
Brown-Forman Corporation BF.B 87.93 99.6% 18,499 1,006 287 19,218 2,962 1,013 6.1% 5.3% 69.0% 34.2% 29.2x 6.49x 19.0x 4.85x 17.7x
Constellation Brands Inc. STZ 83.66 100.0% 15,720 7,176 70 22,826 4,272 1,119 56.6% 8.7% 40.3% 26.2% 8.4x 5.34x 20.4x 3.87x 13.6x
Diageo plc DGE 31.09 86.3% 78,077 16,107 1,476 92,708 18,869 6,552 7.7% 8.8% 61.6% 34.7% 17.6x 4.91x 14.2x 4.82x 13.9x
Heineken NV ENXTAM:HEIA 67.62 81.1% 38,880 16,930 1,792 54,018 26,591 5,413 9.7% 6.0% 38.0% 20.4% 20.6x 2.03x 10.0x 2.01x 8.8x
Kirin Holdings Company, Limited TSE:2503 13.42 74.0% 12,474 7,678 1,082 19,070 21,882 2,833 1.2% 7.1% 42.9% 12.9% 15.2x 0.87x 6.7x 0.87x 6.7x
Pernod-Ricard SA RI 116.57 83.2% 30,687 13,030 947 42,770 11,345 3,375 5.6% 4.5% 62.7% 29.7% NA 3.77x 12.7x 3.68x 12.8x
SABMiller plc LSE:SAB 49.08 79.6% 78,424 17,699 1,286 94,837 17,191 5,504 (13.8%) 5.7% 70.4% 32.0% 22.5x 5.52x 17.2x 4.76x 13.8x
Sapporo Holdings Ltd. TSE:2501 3.86 84.1% 1,507 2,499 112 3,894 4,948 431 (13.1%) 9.4% 35.4% 8.7% 16.4x 0.79x 9.0x 0.76x 9.7x
Mean 7.6% 6.8% 53.3% 26.4% 17.7x 3.83x 13.5x 3.33x 12.0x
Median 6.1% 6.0% 59.3% 29.7% 17.0x 4.78x 12.7x 3.87x 12.8x
Inputs
Protein Processing
Cal-Maine Foods, Inc. CALM $58.30 95.1% $1,393 $59 $162 $1,290 $1,360 $139 15.2% 14.0% 17.5% 10.2% 22.7x 0.95x 9.3x 0.97x 7.4x
JBS S.A. BOVESPA:JBSS3 3.35 85.1% 9,230 13,594 3,521 19,303 39,345 2,377 12.9% 11.3% 12.1% 6.0% 25.2x 0.49x 8.1x 0.40x 6.2x
Sanderson Farms, Inc. SAFM 75.87 96.6% 1,759 40 59 1,740 2,672 322 8.4% 11.4% 13.6% 12.1% 10.5x 0.65x 5.4x 0.67x 6.0x
Seaboard Corp. SEB 2,570.06 87.2% 3,113 164 391 2,885 6,670 298 7.8% 15.0% 7.0% 4.5% 15.2x 0.43x 9.7x 0.42x NA
Tyson Foods, Inc. TSN 40.27 98.7% 13,754 1,942 826 14,870 34,769 1,996 5.1% 5.7% 7.2% 5.7% 15.9x 0.43x 7.5x 0.41x 6.8x
Mean 9.9% 11.5% 11.5% 7.7% 17.9x 0.59x 8.0x 0.58x 6.6x
Median 8.4% 11.4% 12.1% 6.0% 15.9x 0.49x 8.1x 0.42x 6.5x
Last Twelve Months (LTM) EV / LTMRevenue Growth LTM Margins EV / 2013E

Member FINRA/SIPC
12 of 16
Trading Statistics Detail (continued)5
Price at As a % of Market Cash & Enterprise P/E
($ in millions, except per share data) Ticker 3/6/14 52-wk High Cap Debt Equiv. Value (EV) Revenue EBITDA 1 Year 3 Years Gross EBITDA Multiple Revenue EBITDA Revenue EBITDA
Fruit and Vegetable
Calavo Growers Inc. CVGW $31.88 93.1% $515 $65 $6 $574 $720 $35 25.6% 19.5% 8.5% 4.8% 26.6x 0.80x 16.5x 0.73x 12.5x
Chiquita Brands International Inc. CQB 10.88 79.6% 507 631 54 1,084 3,057 115 (0.7%) (1.8%) 11.4% 3.8% NM 0.35x 9.4x 0.35x 6.1x
Fresh Del Monte Produce Inc. FDP 27.10 87.9% 1,519 251 43 1,728 3,684 185 7.7% 1.2% 7.9% 5.0% NM 0.47x 9.4x 0.46x 8.9x
Seneca Foods Corp. SENE.A 30.57 84.1% 327 273 18 582 1,321 50 3.9% 2.7% 7.5% 3.8% 18.2x 0.44x 11.7x NA NA
Mean 9.1% 5.4% 8.8% 4.3% 22.4x 0.52x 11.7x 0.51x 9.2x
Median 5.8% 1.9% 8.2% 4.3% 22.4x 0.45x 10.6x 0.46x 8.9x
Ingredients / Flavors
Givaudan SA SWX:GIVN $1,575.12 99.0% $14,475 $1,492 $678 $15,290 $4,906 $972 5.5% 2.6% 44.7% 19.8% 26.3x 3.12x 15.7x 3.02x 13.3x
International Flavors & Fragrances Inc. IFF 95.24 97.3% 7,744 933 406 8,270 2,953 604 4.7% 4.0% 43.8% 20.5% 22.2x 2.80x 13.7x 2.68x 12.1x
Kerry Group plc ISE:KRZ 78.93 99.6% 13,870 1,826 338 15,357 8,038 992 4.2% 6.5% 100.0% 12.3% NM 1.91x 15.5x 1.85x 14.4x
Sensient Technologies Corporation SXT 55.17 99.5% 2,763 355 20 3,098 1,468 256 0.6% 3.4% 32.6% 17.5% 24.2x 2.11x 12.1x 2.07x 11.2x
Symrise AG XTRA:SY1 50.32 96.4% 5,946 802 162 6,586 2,459 481 12.8% 5.7% 41.6% 19.6% 25.6x 2.68x 13.7x 2.54x 12.1x
Tate & Lyle plc TATE 10.70 71.9% 4,958 1,329 727 5,560 5,443 720 6.2% 12.4% 38.5% 13.2% 23.3x 1.02x 7.7x 1.04x 7.3x
Mean 5.7% 5.8% 50.2% 17.1% 24.3x 2.27x 13.1x 2.20x 11.7x
Median 5.1% 4.9% 42.7% 18.5% 24.2x 2.39x 13.7x 2.31x 12.1x
Agribusiness
Archer Daniels Midland Company ADM $41.05 93.3% $26,776 $6,879 $3,554 $30,101 $89,804 $3,039 NA 6.9% 4.3% 3.4% 20.1x 0.34x 9.9x 0.34x 7.5x
Bunge Limited BG 80.32 95.4% 11,562 9,114 5,374 15,302 61,347 1,801 0.6% 11.8% 4.5% 2.9% NM 0.25x 8.5x 0.25x 7.0x
CF Industries Holdings, Inc. CF 264.62 100.0% 14,575 3,098 1,711 15,963 5,475 2,756 (10.3%) 11.4% 46.0% 50.3% 10.6x 2.92x 5.8x 3.28x 7.2x
Darling International Inc. DAR 20.49 85.6% 3,345 887 871 3,361 1,724 292 1.3% 33.5% 26.8% 16.9% 22.4x 1.95x 11.5x 0.86x 5.4x
Monsanto Company MON 113.90 96.9% 59,267 3,319 4,714 57,872 15,065 4,253 7.6% 12.4% 51.9% 28.2% 24.3x 3.84x 13.6x 3.59x 12.1x
Omega Protein Corporation OME 11.50 75.3% 237 25 35 228 241 62 (4.1%) 12.9% 28.0% 25.6% 12.0x 0.94x 3.7x 0.98x 3.9x
The Andersons, Inc. ANDE 57.63 92.5% 1,609 429 309 1,729 5,605 145 6.3% 18.2% 6.5% 2.6% 17.9x 0.31x 11.9x 0.31x 7.5x
The Mosaic Company MOS 50.04 77.4% 19,883 3,032 5,293 17,622 8,170 1,660 (18.7%) (1.1%) 17.4% 20.3% 36.4x 2.16x 10.6x 2.00x 7.9x
Mean (2.5%) 13.2% 23.2% 18.8% 20.5x 1.59x 9.4x 1.45x 7.3x
Median 0.6% 12.1% 22.1% 18.6% 20.1x 1.45x 10.3x 0.92x 7.3x
Consumer and Retail
Food Retail
Costco Wholesale Corporation COST 113.39 89.9% 51,214 4,985 6,482 49,717 107,893 4,046 4.6% 9.6% 12.6% 3.8% 26.2x 0.46x 12.3x 0.43x 10.9x
Establishments Delhaize Freres DELB 72.74 98.4% 7,363 3,856 1,505 9,714 30,928 1,865 13.1% 3.6% 24.4% 6.0% NM 0.31x 5.2x 0.33x 5.1x
Fairway Group Holdings Corp. FWM 8.01 27.7% 348 256 54 550 754 2 19.2% NA 32.7% 0.3% NM 0.73x 232.1x 0.67x 10.7x
Ingles Markets, Incorporated IMKT.A 24.19 82.5% 553 925 5 1,473 3,749 209 0.4% 3.1% 22.0% 5.6% 30.5x 0.39x 7.0x 0.38x 6.9x
J. Sainsbury plc LSE:SBRY 5.76 80.4% 10,931 4,703 973 14,661 38,440 2,328 4.8% 5.7% 5.6% 6.1% 10.3x 0.38x 6.3x 0.35x 6.1x
Koninklijke Ahold N.V. ENXTAM:AH 19.44 99.0% 18,535 4,161 5,532 17,165 44,927 2,810 3.5% 4.3% 26.6% 6.3% 18.2x 0.38x 6.1x 0.38x 5.6x
Natural Grocers by Vitamin Cottage NGVC 42.25 98.6% 947 20 7 960 455 35 27.4% NA 29.3% 7.7% NM 2.11x 27.5x 1.70x 21.2x
Roundy's, Inc. RNDY 6.07 55.4% 289 742 82 950 3,950 168 1.5% 0.7% 26.6% 4.3% 7.9x 0.24x 5.6x 0.21x 5.7x
Safeway Inc. SWY 39.63 99.3% 9,004 4,193 4,728 8,469 36,139 1,594 0.2% (4.2%) 27.3% 4.4% NA 0.23x 5.3x 0.23x 5.1x
Sprouts Farmers Market, Inc. SFM 39.19 79.3% 5,797 431 78 6,150 2,438 190 35.8% NA 29.7% 7.8% NM 2.52x 32.4x 2.13x 26.0x
SUPERVALU Inc. SVU 6.77 77.2% 1,781 3,016 72 4,725 17,059 730 530.2% (23.5%) 14.9% 4.3% NM 0.28x 6.5x 0.28x 6.1x
The Kroger Co. KR 43.75 99.8% 22,562 11,309 401 33,470 98,375 4,428 1.7% 6.2% 20.6% 4.5% 15.1x 0.34x 7.6x 0.32x 7.0x
The Pantry, Inc. PTRY 14.98 85.0% 353 942 33 1,263 6,911 199 (6.1%) 2.4% 11.7% 2.9% NM 0.18x 6.3x 0.17x 5.8x
Village Super Market Inc. VLGE.A 28.33 71.3% 388 44 87 344 1,485 52 1.9% 5.1% 26.8% 3.5% NM 0.23x 6.6x 0.22x NA
Weis Markets, Inc. WMK 49.52 91.5% 1,342 0 102 1,240 2,693 181 (0.3%) 0.9% 4.6% 6.7% 17.2x 0.46x 6.8x 0.45x NA
Whole Foods Market, Inc. WFM 53.92 82.2% 20,146 32 1,042 19,136 13,300 1,264 9.3% 12.4% 35.8% 9.5% 36.1x 1.44x 15.1x 1.28x 13.6x
Mean 40.5% 2.0% 22.0% 5.2% 20.2x 0.67x 24.3x 0.60x 9.7x
Median 4.1% 3.6% 25.5% 5.0% 17.7x 0.38x 6.7x 0.37x 6.5x
LTM Margins EV / 2013ELast Twelve Months (LTM) Revenue Growth EV / LTM
Member FINRA/SIPC
13 of 16
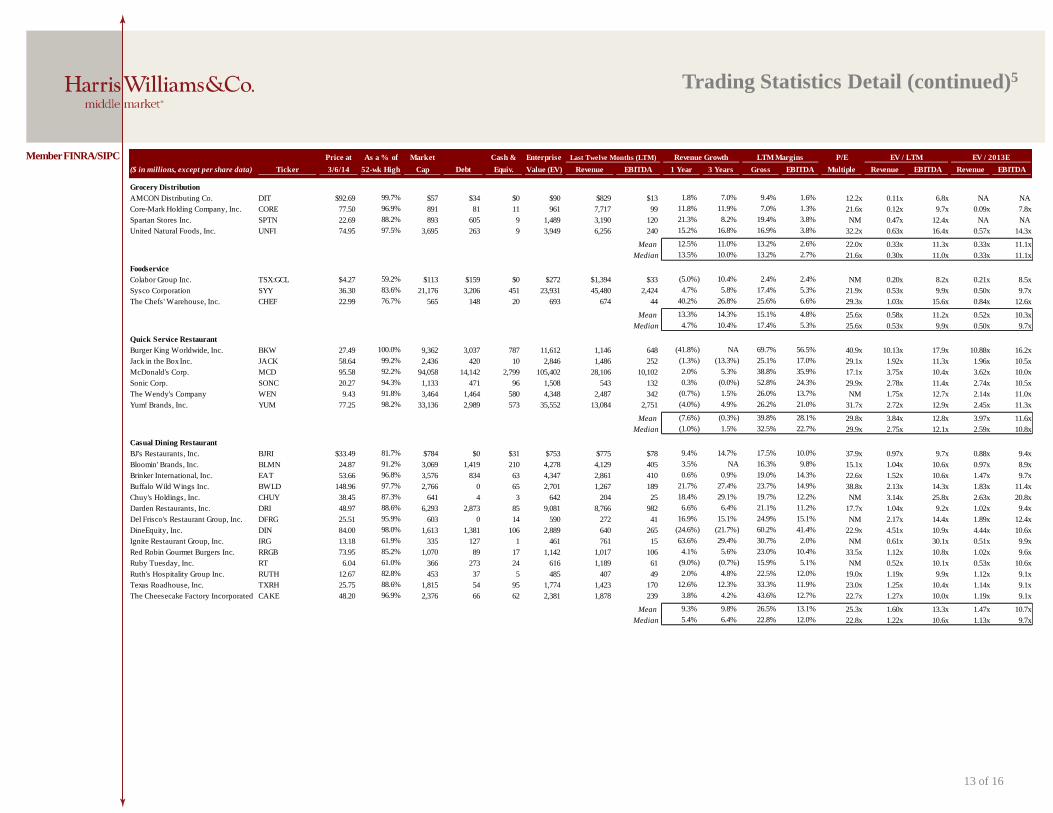
Trading Statistics Detail (continued)5
Price at As a % of Market Cash & Enterprise P/E
($ in millions, except per share data) Ticker 3/6/14 52-wk High Cap Debt Equiv. Value (EV) Revenue EBITDA 1 Year 3 Years Gross EBITDA Multiple Revenue EBITDA Revenue EBITDA
Grocery Distribution
AMCON Distributing Co. DIT $92.69 99.7% $57 $34 $0 $90 $829 $13 1.8% 7.0% 9.4% 1.6% 12.2x 0.11x 6.8x NA NA
Core-Mark Holding Company, Inc. CORE 77.50 96.9% 891 81 11 961 7,717 99 11.8% 11.9% 7.0% 1.3% 21.6x 0.12x 9.7x 0.09x 7.8x
Spartan Stores Inc. SPTN 22.69 88.2% 893 605 9 1,489 3,190 120 21.3% 8.2% 19.4% 3.8% NM 0.47x 12.4x NA NA
United Natural Foods, Inc. UNFI 74.95 97.5% 3,695 263 9 3,949 6,256 240 15.2% 16.8% 16.9% 3.8% 32.2x 0.63x 16.4x 0.57x 14.3x
Mean 12.5% 11.0% 13.2% 2.6% 22.0x 0.33x 11.3x 0.33x 11.1x
Median 13.5% 10.0% 13.2% 2.7% 21.6x 0.30x 11.0x 0.33x 11.1x
Foodservice
Colabor Group Inc. TSX:GCL $4.27 59.2% $113 $159 $0 $272 $1,394 $33 (5.0%) 10.4% 2.4% 2.4% NM 0.20x 8.2x 0.21x 8.5x
Sysco Corporation SYY 36.30 83.6% 21,176 3,206 451 23,931 45,480 2,424 4.7% 5.8% 17.4% 5.3% 21.9x 0.53x 9.9x 0.50x 9.7x
The Chefs' Warehouse, Inc. CHEF 22.99 76.7% 565 148 20 693 674 44 40.2% 26.8% 25.6% 6.6% 29.3x 1.03x 15.6x 0.84x 12.6x
Mean 13.3% 14.3% 15.1% 4.8% 25.6x 0.58x 11.2x 0.52x 10.3x
Median 4.7% 10.4% 17.4% 5.3% 25.6x 0.53x 9.9x 0.50x 9.7x
Quick Service Restaurant
Burger King Worldwide, Inc. BKW 27.49 100.0% 9,362 3,037 787 11,612 1,146 648 (41.8%) NA 69.7% 56.5% 40.9x 10.13x 17.9x 10.88x 16.2x
Jack in the Box Inc. JACK 58.64 99.2% 2,436 420 10 2,846 1,486 252 (1.3%) (13.3%) 25.1% 17.0% 29.1x 1.92x 11.3x 1.96x 10.5x
McDonald's Corp. MCD 95.58 92.2% 94,058 14,142 2,799 105,402 28,106 10,102 2.0% 5.3% 38.8% 35.9% 17.1x 3.75x 10.4x 3.62x 10.0x
Sonic Corp. SONC 20.27 94.3% 1,133 471 96 1,508 543 132 0.3% (0.0%) 52.8% 24.3% 29.9x 2.78x 11.4x 2.74x 10.5x
The Wendy's Company WEN 9.43 91.8% 3,464 1,464 580 4,348 2,487 342 (0.7%) 1.5% 26.0% 13.7% NM 1.75x 12.7x 2.14x 11.0x
Yum! Brands, Inc. YUM 77.25 98.2% 33,136 2,989 573 35,552 13,084 2,751 (4.0%) 4.9% 26.2% 21.0% 31.7x 2.72x 12.9x 2.45x 11.3x
Mean (7.6%) (0.3%) 39.8% 28.1% 29.8x 3.84x 12.8x 3.97x 11.6x
Median (1.0%) 1.5% 32.5% 22.7% 29.9x 2.75x 12.1x 2.59x 10.8x
Casual Dining Restaurant
BJ's Restaurants, Inc. BJRI $33.49 81.7% $784 $0 $31 $753 $775 $78 9.4% 14.7% 17.5% 10.0% 37.9x 0.97x 9.7x 0.88x 9.4x
Bloomin' Brands, Inc. BLMN 24.87 91.2% 3,069 1,419 210 4,278 4,129 405 3.5% NA 16.3% 9.8% 15.1x 1.04x 10.6x 0.97x 8.9x
Brinker International, Inc. EAT 53.66 96.8% 3,576 834 63 4,347 2,861 410 0.6% 0.9% 19.0% 14.3% 22.6x 1.52x 10.6x 1.47x 9.7x
Buffalo Wild Wings Inc. BWLD 148.96 97.7% 2,766 0 65 2,701 1,267 189 21.7% 27.4% 23.7% 14.9% 38.8x 2.13x 14.3x 1.83x 11.4x
Chuy's Holdings, Inc. CHUY 38.45 87.3% 641 4 3 642 204 25 18.4% 29.1% 19.7% 12.2% NM 3.14x 25.8x 2.63x 20.8x
Darden Restaurants, Inc. DRI 48.97 88.6% 6,293 2,873 85 9,081 8,766 982 6.6% 6.4% 21.1% 11.2% 17.7x 1.04x 9.2x 1.02x 9.4x
Del Frisco's Restaurant Group, Inc. DFRG 25.51 95.9% 603 0 14 590 272 41 16.9% 15.1% 24.9% 15.1% NM 2.17x 14.4x 1.89x 12.4x
DineEquity, Inc. DIN 84.00 98.0% 1,613 1,381 106 2,889 640 265 (24.6%) (21.7%) 60.2% 41.4% 22.9x 4.51x 10.9x 4.44x 10.6x
Ignite Restaurant Group, Inc. IRG 13.18 61.9% 335 127 1 461 761 15 63.6% 29.4% 30.7% 2.0% NM 0.61x 30.1x 0.51x 9.9x
Red Robin Gourmet Burgers Inc. RRGB 73.95 85.2% 1,070 89 17 1,142 1,017 106 4.1% 5.6% 23.0% 10.4% 33.5x 1.12x 10.8x 1.02x 9.6x
Ruby Tuesday, Inc. RT 6.04 61.0% 366 273 24 616 1,189 61 (9.0%) (0.7%) 15.9% 5.1% NM 0.52x 10.1x 0.53x 10.6x
Ruth's Hospitality Group Inc. RUTH 12.67 82.8% 453 37 5 485 407 49 2.0% 4.8% 22.5% 12.0% 19.0x 1.19x 9.9x 1.12x 9.1x
Texas Roadhouse, Inc. TXRH 25.75 88.6% 1,815 54 95 1,774 1,423 170 12.6% 12.3% 33.3% 11.9% 23.0x 1.25x 10.4x 1.14x 9.1x
The Cheesecake Factory Incorporated CAKE 48.20 96.9% 2,376 66 62 2,381 1,878 239 3.8% 4.2% 43.6% 12.7% 22.7x 1.27x 10.0x 1.19x 9.1x
Mean 9.3% 9.8% 26.5% 13.1% 25.3x 1.60x 13.3x 1.47x 10.7x
Median 5.4% 6.4% 22.8% 12.0% 22.8x 1.22x 10.6x 1.13x 9.7x
Last Twelve Months (LTM) Revenue Growth LTM Margins EV / LTM EV / 2013E
14 of 16
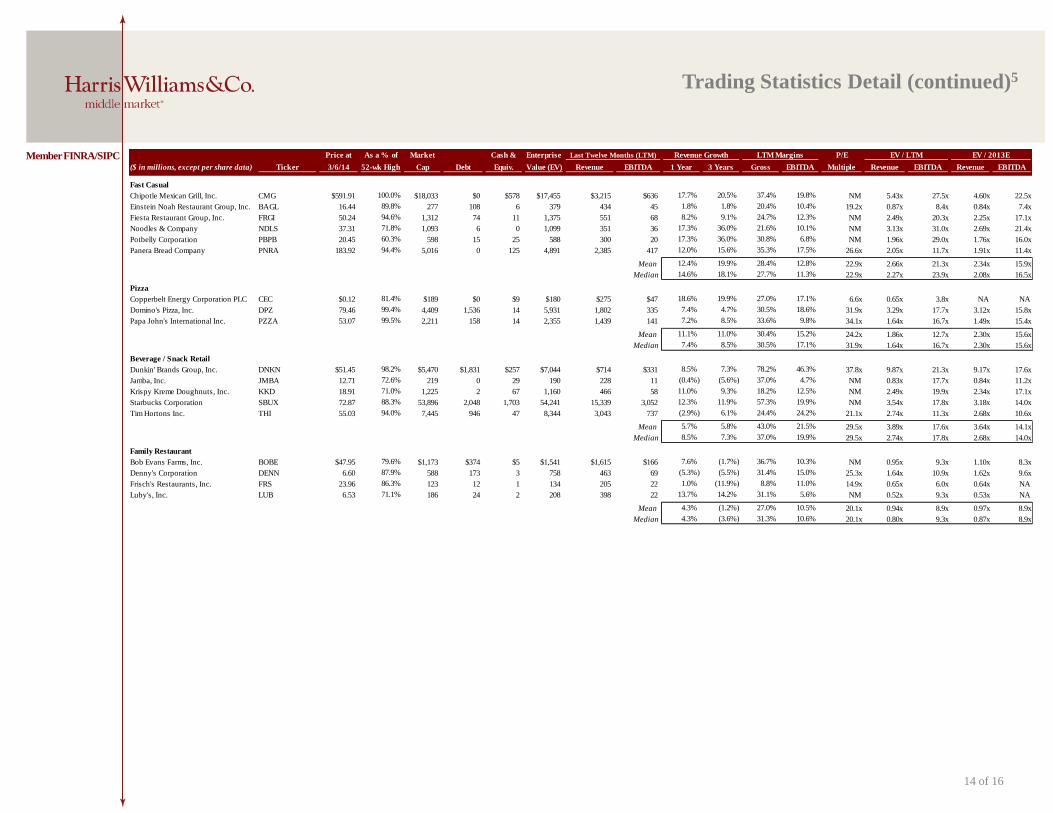
Trading Statistics Detail (continued)5
Member FINRA/SIPC
Price at As a % of Market Cash & Enterprise P/E
($ in millions, except per share data) Ticker 3/6/14 52-wk High Cap Debt Equiv. Value (EV) Revenue EBITDA 1 Year 3 Years Gross EBITDA Multiple Revenue EBITDA Revenue EBITDA
Fast Casual
Chipotle Mexican Grill, Inc. CMG $591.91 100.0% $18,033 $0 $578 $17,455 $3,215 $636 17.7% 20.5% 37.4% 19.8% NM 5.43x 27.5x 4.60x 22.5x
Einstein Noah Restaurant Group, Inc. BAGL 16.44 89.8% 277 108 6 379 434 45 1.8% 1.8% 20.4% 10.4% 19.2x 0.87x 8.4x 0.84x 7.4x
Fiesta Restaurant Group, Inc. FRGI 50.24 94.6% 1,312 74 11 1,375 551 68 8.2% 9.1% 24.7% 12.3% NM 2.49x 20.3x 2.25x 17.1x
Noodles & Company NDLS 37.31 71.8% 1,093 6 0 1,099 351 36 17.3% 36.0% 21.6% 10.1% NM 3.13x 31.0x 2.69x 21.4x
Potbelly Corporation PBPB 20.45 60.3% 598 15 25 588 300 20 17.3% 36.0% 30.8% 6.8% NM 1.96x 29.0x 1.76x 16.0x
Panera Bread Company PNRA 183.92 94.4% 5,016 0 125 4,891 2,385 417 12.0% 15.6% 35.3% 17.5% 26.6x 2.05x 11.7x 1.91x 11.4x
Mean 12.4% 19.9% 28.4% 12.8% 22.9x 2.66x 21.3x 2.34x 15.9x
Median 14.6% 18.1% 27.7% 11.3% 22.9x 2.27x 23.9x 2.08x 16.5x
Pizza
Copperbelt Energy Corporation PLC CEC $0.12 81.4% $189 $0 $9 $180 $275 $47 18.6% 19.9% 27.0% 17.1% 6.6x 0.65x 3.8x NA NA
Domino's Pizza, Inc. DPZ 79.46 99.4% 4,409 1,536 14 5,931 1,802 335 7.4% 4.7% 30.5% 18.6% 31.9x 3.29x 17.7x 3.12x 15.8x
Papa John's International Inc. PZZA 53.07 99.5% 2,211 158 14 2,355 1,439 141 7.2% 8.5% 33.6% 9.8% 34.1x 1.64x 16.7x 1.49x 15.4x
Mean 11.1% 11.0% 30.4% 15.2% 24.2x 1.86x 12.7x 2.30x 15.6x
Median 7.4% 8.5% 30.5% 17.1% 31.9x 1.64x 16.7x 2.30x 15.6x
Beverage / Snack Retail
Dunkin' Brands Group, Inc. DNKN $51.45 98.2% $5,470 $1,831 $257 $7,044 $714 $331 8.5% 7.3% 78.2% 46.3% 37.8x 9.87x 21.3x 9.17x 17.6x
Jamba, Inc. JMBA 12.71 72.6% 219 0 29 190 228 11 (0.4%) (5.6%) 37.0% 4.7% NM 0.83x 17.7x 0.84x 11.2x
Krispy Kreme Doughnuts, Inc. KKD 18.91 71.0% 1,225 2 67 1,160 466 58 11.0% 9.3% 18.2% 12.5% NM 2.49x 19.9x 2.34x 17.1x
Starbucks Corporation SBUX 72.87 88.3% 53,896 2,048 1,703 54,241 15,339 3,052 12.3% 11.9% 57.3% 19.9% NM 3.54x 17.8x 3.18x 14.0x
Tim Hortons Inc. THI 55.03 94.0% 7,445 946 47 8,344 3,043 737 (2.9%) 6.1% 24.4% 24.2% 21.1x 2.74x 11.3x 2.68x 10.6x
Mean 5.7% 5.8% 43.0% 21.5% 29.5x 3.89x 17.6x 3.64x 14.1x
Median 8.5% 7.3% 37.0% 19.9% 29.5x 2.74x 17.8x 2.68x 14.0x
Family Restaurant
Bob Evans Farms, Inc. BOBE $47.95 79.6% $1,173 $374 $5 $1,541 $1,615 $166 7.6% (1.7%) 36.7% 10.3% NM 0.95x 9.3x 1.10x 8.3x
Denny's Corporation DENN 6.60 87.9% 588 173 3 758 463 69 (5.3%) (5.5%) 31.4% 15.0% 25.3x 1.64x 10.9x 1.62x 9.6x
Frisch's Restaurants, Inc. FRS 23.96 86.3% 123 12 1 134 205 22 1.0% (11.9%) 8.8% 11.0% 14.9x 0.65x 6.0x 0.64x NA
Luby's, Inc. LUB 6.53 71.1% 186 24 2 208 398 22 13.7% 14.2% 31.1% 5.6% NM 0.52x 9.3x 0.53x NA
Mean 4.3% (1.2%) 27.0% 10.5% 20.1x 0.94x 8.9x 0.97x 8.9x
Median 4.3% (3.6%) 31.3% 10.6% 20.1x 0.80x 9.3x 0.87x 8.9x
Last Twelve Months (LTM) Revenue Growth LTM Margins EV / LTM EV / 2013E
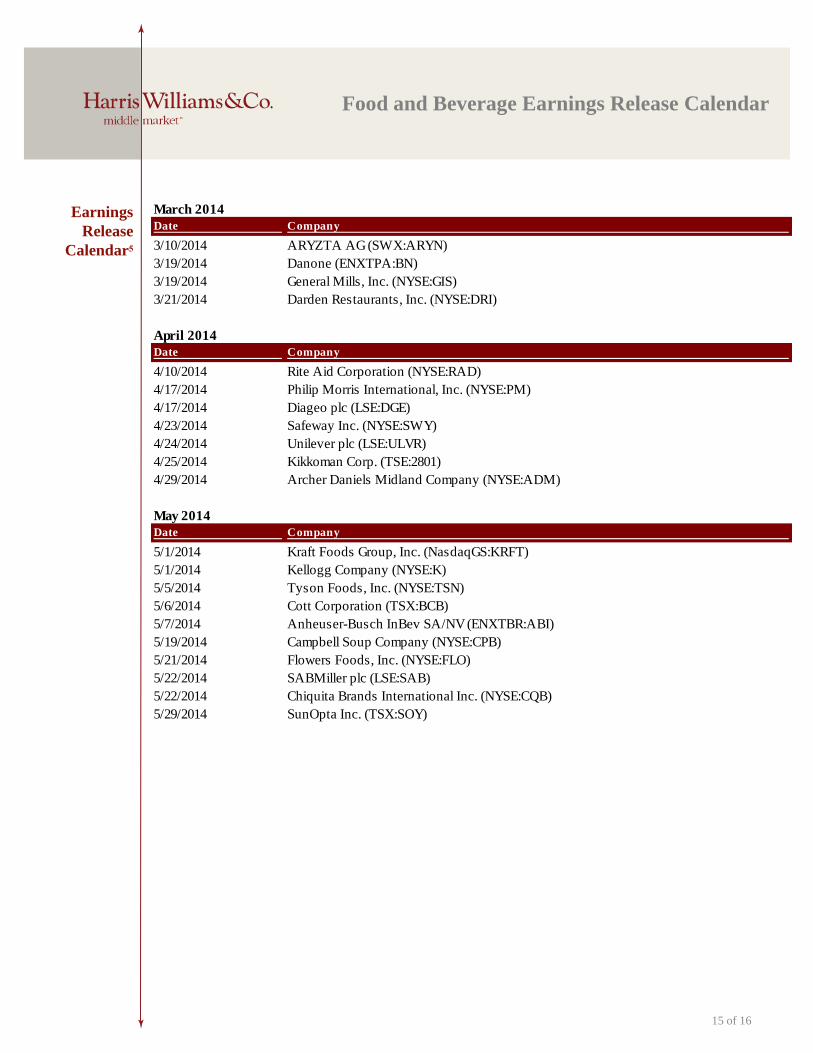
Earnings
Release
Calendar5
15 of 16
Food and Beverage Earnings Release Calendar
March 2014
Date Company
3/10/2014 ARYZTA AG (SWX:ARYN)
3/19/2014 Danone (ENXTPA:BN)
3/19/2014 General Mills, Inc. (NYSE:GIS)
3/21/2014 Darden Restaurants, Inc. (NYSE:DRI)
April 2014
Date Company
4/10/2014 Rite Aid Corporation (NYSE:RAD)
4/17/2014 Philip Morris International, Inc. (NYSE:PM)
4/17/2014 Diageo plc (LSE:DGE)
4/23/2014 Safeway Inc. (NYSE:SWY)
4/24/2014 Unilever plc (LSE:ULVR)
4/25/2014 Kikkoman Corp. (TSE:2801)
4/29/2014 Archer Daniels Midland Company (NYSE:ADM)
May 2014
Date Company
5/1/2014 Kraft Foods Group, Inc. (NasdaqGS:KRFT)
5/1/2014 Kellogg Company (NYSE:K)
5/5/2014 Tyson Foods, Inc. (NYSE:TSN)
5/6/2014 Cott Corporation (TSX:BCB)
5/7/2014 Anheuser-Busch InBev SA/NV (ENXTBR:ABI)
5/19/2014 Campbell Soup Company (NYSE:CPB)
5/21/2014 Flowers Foods, Inc. (NYSE:FLO)
5/22/2014 SABMiller plc (LSE:SAB)
5/22/2014 Chiquita Brands International Inc. (NYSE:CQB)
5/29/2014 SunOpta Inc. (TSX:SOY)
Sources:
1. IMF
2. U.S. Bureau of Labor Statistics
3. Unweighted Average
4. U.S. Census Bureau
5. Capital IQ
6. Thomson Financial
7. S&P
8. Reuters
Harris Williams & Co. (www.harriswilliams.com) is a preeminent middle market investment bank focused on the advisory
needs of clients worldwide. The firm has deep industry knowledge, global transaction expertise, and an unwavering
commitment to excellence. Harris Williams & Co. provides sell-side and acquisition advisory, restructuring advisory,
board advisory, private placements, and capital markets advisory services.
Investment banking services are provided by Harris Williams LLC, a registered broker-dealer and member of FINRA and
SIPC, and Harris Williams & Co. Ltd, which is authorised and regulated by the Financial Conduct Authority. Harris
Williams & Co. is a trade name under which Harris Williams LLC and Harris Williams & Co. Ltd conduct business.
THIS REPORT MAY CONTAIN REFERENCES TO REGISTERED TRADEMARKS, SERVICE MARKS AND
COPYRIGHTS OWNED BY THIRD-PARTY INFORMATION PROVIDERS. NONE OF THE THIRD-PARTY
INFORMATION PROVIDERS IS ENDORSING THE OFFERING OF, AND SHALL NOT IN ANY WAY BE
DEEMED AN ISSUER OR UNDERWRITER OF, THE SECURITIES, FINANCIAL INSTRUMENTS OR
OTHER INVESTMENTS DISCUSSED IN THIS REPORT, AND SHALL NOT HAVE ANY LIABILITY OR
RESPONSIBILITY FOR ANY STATEMENTS MADE IN THE REPORT OR FOR ANY FINANCIAL
STATEMENTS, FINANCIAL PROJECTIONS OR OTHER FINANCIAL INFORMATION CONTAINED OR
ATTACHED AS AN EXHIBIT TO THE REPORT. FOR MORE INFORMATION ABOUT THE MATERIALS
PROVIDED BY SUCH THIRD PARTIES, PLEASE CONTACT US AT +1 (804) 648-0072.
The information and views contained in this report were prepared by Harris Williams & Co. (“Harris Williams”). It is not
a research report, as such term is defined by applicable law and regulations, and is provided for informational purposes
only. It is not to be construed as an offer to buy or sell or a solicitation of an offer to buy or sell any financial instruments
or to participate in any particular trading strategy. The information contained herein is believed by Harris Williams to be
reliable, but Harris Williams makes no representation as to the accuracy or completeness of such information. Harris
Williams and/or its affiliates may be market makers or specialists in, act as advisers or lenders to, have positions in and
effect transactions in securities of companies mentioned herein and also may provide, may have provided, or may seek to
provide investment banking services for those companies. In addition, Harris Williams and/or its affiliates or their
respective officers, directors and employees may hold long or short positions in the securities, options thereon or other
related financial products of companies discussed herein. Opinions, estimates and projections in this report constitute
Harris Williams’ judgment and are subject to change without notice. The financial instruments discussed in this report
may not be suitable for all investors, and investors must make their own investment decisions using their own independent
advisors as they believe necessary and based upon their specific financial situations and investment objectives. Also, past
performance is not necessarily indicative of future results. No part of this material may be copied or duplicated in any
form or by any means, or redistributed, without Harris Williams’ prior written consent.
Copyright© 2014 Harris Williams & Co., all rights reserved.
16 of 16
Contacts Boston Phone: +1 (617) 482-7501
Cleveland
Phone: +1 (216) 689-2400
Minneapolis Phone: +1 (612) 359-2700
Philadelphia
Phone: +1 (267) 675-5900
Richmond
Phone: +1 (804) 648-0072
San Francisco
Phone: +1 (415) 288-4260
London Phone: +44 (0)20 7518 8900
Frankfurt Phone: +49 069 3650638 00