Fomc 20071031 Blue Book 20071025
46
Content last modified 02/07/2013. Prefatory Note The attached document represents the most complete and accurate version available based on original files from the FOMC Secretariat at the Board of Governors of the Federal Reserve System. Please note that some material may have been redacted from this document if that material was received on a confidential basis. Redacted material is indicated by occasional gaps in the text or by gray boxes around non-text content. All redacted passages are exempt from disclosure under applicable provisions of the Freedom of Information Act.
-
Upload
fraser-federal-reserve-archive -
Category
Documents
-
view
218 -
download
1
Transcript of Fomc 20071031 Blue Book 20071025

Content last modified 02/07/2013.
Prefatory Note The attached document represents the most complete and accurate version available based on original files from the FOMC Secretariat at the Board of Governors of the Federal Reserve System. Please note that some material may have been redacted from this document if that material was received on a confidential basis. Redacted material is indicated by occasional gaps in the text or by gray boxes around non-text content. All redacted passages are exempt from disclosure under applicable provisions of the Freedom of Information Act.
CLASS I FOMC - RESTRICTED CONTROLLED (FR)
OCTOBER 25, 2007
MONETARY POLICY ALTERNATIVES
PREPARED FOR THE FEDERAL OPEN MARKET COMMITTEE BY THE STAFF OF THE BOARD OF GOVERNORS OF THE FEDERAL RESERVE SYSTEM

Class I FOMC - Restricted Controlled (FR) October 25, 2007
MONETARY POLICY ALTERNATIVES
Recent Developments
Summary
(1) Financial market functioning improved somewhat over the intermeeting
period, but conditions in a number of markets remained strained. Market interest
rates declined and the expected path of the federal funds rate shifted down following
the FOMC’s decision at its September meeting to lower the target federal funds rate
by 50 basis points. Amid mixed economic data releases and some worsening of credit
concerns, yields moved down a bit further, on balance, over the remainder of the
period. In longer-term corporate markets, investment- and speculative-grade bond
spreads narrowed somewhat over the period as a whole. Bond issuance by
investment-grade firms continued to be strong, a few LBO-related bonds were issued
for the first time since early summer, and underwriters were able to syndicate a
portion of a few large LBO-related loans to nonbank lenders. In housing finance, the
spread between offer rates on prime jumbo fixed-rate mortgages and conforming
loans declined a bit, but remained elevated. Issuance of securities backed by subprime
mortgages stayed low, while issuance of those backed by prime jumbo mortgages
appears to have increased only modestly. Respondents to the October Senior Loan
Officer Opinion Survey reported having tightened standards and terms on many types
of loans over the past three months. The exchange value of the dollar moved lower
over the intermeeting period, and broad stock price indexes increased, on net, despite
some recent sharp sell-offs.
1 of 44

Monetary Policy Expectations and Treasury Yields
(2) The FOMC’s decision at its September 18 meeting to lower the target
federal funds rate by 50 basis points to 4¾ percent prompted a decline in market
interest rates, as investors apparently had attached substantial odds to a smaller policy
move.1 The subsequent publication of the minutes of the September meeting left
little imprint in financial markets. The anticipated path of monetary policy moved
down somewhat further, on net, over the remainder of the period in response to
mixed economic data releases and some worsening of credit concerns (Chart 1).
Market quotes indicate that investors currently assign about 60 percent probability to
a 25 basis point easing at the October meeting and nearly 30 percent probability to a
larger easing move. Investors appear to expect about a 100 basis point cumulative
reduction in the target federal funds rate by the end of 2008—about 35 basis points
more than just before the September meeting. With regard to the statement language,
respondents to the Desk’s survey of primary dealers, conducted between October 18
and October 22, were about equally divided between those expecting the Committee
to judge that downside risks to growth are now the predominant policy concern;
those anticipating a balanced risk assessment; and those expecting the Committee, as
in September, to offer no explicit assessment of risk. Measures of uncertainty around
the future funds rate path derived from option prices were little changed, on net, over
1 The effective federal funds rate averaged 4.75 percent over the intermeeting period. During the period, the federal funds rate was more volatile than usual. The intraday standard deviation averaged 22 basis points, considerably higher than the 7 basis point average for the year through the end of July. The funds rate continued to show a tendency to soften over the course of the day, reportedly reflecting in part strong demand for funds from European banks during morning trading. The root mean squared deviation of the daily effective federal funds rate from the target also was higher than its average between the start of the year and the end of July. Over the period, the Desk did not purchase any securities outright. The volume of long-term RPs remained at $12 billion.
Class I FOMC - Restricted Controlled (FR) 2 of 44

Chart 1Interest Rate Developments
Note. Vertical lines indicate September 17, 2007. Last daily observations are for October 25, 2007.
20083.5
4.0
4.5
5.0
5.5
6.0Percent
October 25, 2007September 17, 2007
2007
Expected Federal Funds Rates*
*Estimates from federal funds and Eurodollar futures, with an allowance for term premiums and other adjustments.
Implied Distribution of Federal Funds Rate Six Months Ahead*
1.00 1.50 2.00 2.50 3.00 3.50 4.00 4.50 5.00 5.50 6.00
Recent: 10/25/2007 Last FOMC: 09/17/2007
0
5
10
15
20Percent
*Derived from options on Eurodollar futures contracts, with term premium and other adjustments to estimate expectations for the federal funds rate.
3
5
7
9
11
2002 2003 2004 2005 2006 2007 40
80
120
160
200
240
280
320Percent Basis points
Ten-Year Treasury (left scale)Six-Month Eurodollar (right scale)*
Implied Volatilities
Daily
*Width of a 90 percent confidence interval estimated from the termstructures for the expected federal funds rate and implied volatility.
Sept.FOMC
2004 2005 2006 20070
1
2
3
4
5
6
7Percent
Ten-YearTwo-Year
Nominal Treasury Yields*
Daily
*Par yields from a smoothed nominal off-the-run Treasury yield curve.
Sept.FOMC
-40
-30
-20
-10
0
10
20Basis points
1 2 3 Years ahead
5 7 10
Change in Implied One-Year Forward Treasury Ratessince Last FOMC Meeting*
*Forward rates are the one-year rates maturing at the end of the year shownon the horizontal axis that are implied by the smoothed Treasury yield curve.
1.5
2.0
2.5
3.0
3.5
4.0
2004 2005 2006 2007 30
40
50
60
70
80
90
100Percent $/barrel
Next Five Years (left scale)Five-to-Ten Year Forward (left scale)Spot WTI (right scale)
Inflation Compensation and Oil Prices*
Daily
*Estimates based on smoothed nominal and inflation-indexedTreasury yield curves and adjusted for the indexation-lag (carry) effect.
Sept.FOMC
Class I FOMC - Restricted Controlled (FR) 3 of 44

the intermeeting period, and the distribution of federal funds rates at six- and twelve-
month horizons remained skewed to the downside.
(3) Consistent with the revision in policy expectations, two-year nominal
Treasury yields fell 35 basis points, on net, over the intermeeting period, while ten-
year nominal yields declined 10 basis points. Despite a marked rise in spot oil prices,
TIPS-based inflation compensation was about unchanged. Measures of short- and
long-term inflation expectations from the Reuters-Michigan survey ticked down in
October.
Money Markets
(4) Conditions in money markets appear to have improved a bit during the
intermeeting period, with much of the improvement coming on the heels of the
September policy easing. In the United States, spreads on asset-backed commercial
paper (ABCP) and on lower-rated unsecured commercial paper declined, on balance,
but remained above their July levels. Outstanding ABCP has continued to contract,
albeit at a slower pace than in August, whereas unsecured paper has expanded so far
in October (Chart 2). A proposal by a consortium of large banks to create a Master
Liquidity Enhanced Conduit that would purchase sound assets of some SIV conduits
as a means of avoiding asset “fire sales” met with mixed reviews from other market
participants. The volume of ABCP issued in Europe appeared to stabilize in early
October, but declined again late in the intermeeting period. In Canada, the deadline
for final agreement on restructuring outstanding ABCP was extended two more
months to mid-December. Conditions in term bank funding markets eased a little
over the intermeeting period, although some signs of year-end pressures emerged.
(See box “Early Indications of Year-end Pressures.”) Spreads of term libor and
federal funds rates over comparable overnight index swap rates stepped down after
the September FOMC meeting, but they remained wide by historical standards.
Class I FOMC - Restricted Controlled (FR) 4 of 44

Chart 2Asset Market Developments
Note. Vertical lines indicate September 17, 2007. Last daily observations are for October 25, 2007.
Jan. Mar. May July Sept.2007
800
900
1000
1100
1200
1300
1400Billions of dollars
ABCPUnsecured
Weekly (Wed., s.a.)
Commercial Paper Outstanding
Sept. FOMC
Last weekly observation is for October 24, 2007.
June July Aug. Sept. Oct.2007
0
20
40
60
80
100Basis pointsOne-month Libor minus OIS rate
Daily Sept.FOMC
An overnight index swap (OIS) is a fixed/floating interest rate swap, withthe floating leg tied to an index of daily overnight rates.
50
100
150
200
250
300
350
400
2001 2002 2003 2004 2005 2006 2007 0
250
500
750
1000
1250
Basis points Basis points
Ten-Year BBB (left scale)Ten-Year High-Yield (right scale)
Sept.FOMC
Corporate Bond Spreads*
Daily
*Measured relative to an estimated off-the-run Treasury yield curve.
May June July Aug. Sept. Oct.2007
100
150
200
250
300
350
400Basis points
Series 8 IndexSeries 9 Index
Sept. FOMCDaily
LCDX Spreads
Note. LCDX Series 8 Index started trading May 22, 2007. LCDX Series 9Index started trading October 3, 2007. The Series 9 Index includes asomewhat riskier set of loans.Source. Markit.
2001 2002 2003 2004 2005 2006 2007 50
70
90
110
130
150
170Index(12/31/00=100)
WilshireDow Jones Financial
Sept.FOMC
Equity Prices
Daily
2001 2002 2003 2004 2005 2006 2007 0
10
20
30
40
50
60Percent
S&P 500 (VIX)
Implied Volatility
Daily Sept.FOMC
Class I FOMC - Restricted Controlled (FR) 5 of 44

Funding reportedly was available at somewhat longer maturities than in August and
early September. In European interbank money markets, spreads narrowed
substantially at the shortest maturities and more modestly at longer maturities. The
functioning of the foreign exchange swap market improved somewhat over the
period, but has not yet returned to pre-crisis conditions.
Early Indications of Year-end Pressures
In recent years, year-end pressures in money markets have been muted. This year, the extent of year-end pressures is difficult to gauge because diminished liquidity in term funding markets complicates the interpretation of forward rates. Nonetheless, there are some signs of year-end pressures in interbank funding markets. The spread of the one-month forward libor rate ending three months hence over the corresponding one-month forward Overnight Indexed Swap (OIS) rate—a measure that encompasses the year-end—is currently over 90 basis points. In contrast, the adjacent one-month forward spreads covering intervals ending two and four months hence―and thus excluding the year-end―are both around 55 basis points. Moreover, the gap between the one-month forward libor-OIS spreads ending two and three months hence widened around the time that the maturity date on a three-month deposit crossed into the new year. This development could reflect an increased premium that borrowers in the libor market are willing to pay in order to secure funding over year-end. Moreover, the expectation that the Desk will supply generous reserves to avoid a spike in the effective federal funds rate on the last day of the year acts to keep the OIS rate from drifting higher. Market participants in the commercial paper market have expressed some concerns about year-end pressures. However, direct evidence on such pressures in the CP market is scarce because very little lower-grade commercial paper has been issued that matures beyond the end of December.
Class I FOMC - Restricted Controlled (FR) 6 of 44

(5) Flows to prime money market mutual funds, which invest heavily in
commercial paper, were robust over the intermeeting period, while government-only
funds registered only small net inflows. Functioning in the Treasury bill market has
improved some since the September FOMC meeting, but continues to show signs of
pressure; bill lending from the SOMA portfolio was heavy at times. Bid-asked
spreads in the interdealer market for Treasury bills reportedly remain somewhat
elevated, though less so than in August. The thinness of the market has been
exacerbated by paydowns of Treasury bills in recent weeks following the receipt of
September tax payments. Day-to-day movements in bill yields have been outsized at
times, and yields on three-month bills declined about 20 basis points, on net, over the
period.
Capital Markets
(6) Conditions in corporate bond markets improved somewhat over the
intermeeting period. Spreads on longer-term investment- and speculative-grade
bonds narrowed as much as 20 and 60 basis points, respectively, over the first part of
the intermeeting period, but they widened more recently to end the period down
about 15 basis points, on net. Investment-grade corporate bond issuance was strong
in September and early October, and speculative-grade issuance has picked up notably
this month. For the first time since early summer, a few LBO-related bonds were
issued. Conditions also appear to have improved a bit in the leveraged loan market.
An index of credit default swap spreads on leveraged syndicated loans (the LCDX)
fell 20 basis points, on balance, and secondary market credit spreads on the most
liquid loans reportedly narrowed some. The pipeline of underwritten leveraged loans
that have not yet been syndicated, which includes some large LBO deals, remained
substantial. However, underwriters were able to sell portions of a few of these loans
to institutional investors, including traditional loan investors such as mutual funds,
Class I FOMC - Restricted Controlled (FR) 7 of 44

pension funds, and collateralized loan obligations (CLOs), but also hedge funds and
bank proprietary desks. The syndications of these deals were reportedly followed very
closely by market participants, partly because they could serve as a template for sales
of other large deals that are still in the pipeline. However, new issuance of CLOs,
which provided much of the demand for leveraged loans in recent years, remained
well below the pace observed during the first two quarters of the year. On net, broad
stock price indexes rose 2 to 4 percent despite some sharp sell-offs in the latter part of
the intermeeting period. Outside the financial sector, earnings generally exceeded
expectations. For financial firms, however, earnings in the third quarter came in
below analysts’ expectations, reflecting in part substantial write-downs of mortgage-
related assets and collateralized debt obligations (CDOs). Options-implied volatility
on the S&P 500 declined, on net, over the period.
(7) Markets for nonconforming home mortgages showed little improvement
over the intermeeting period: The spread between offer rates on prime jumbo fixed-
rate mortgages and comparable conforming loans stayed elevated, and securitization
activity for jumbo mortgages appears to have increased modestly. A significant net
fraction of respondents to the October Senior Loan Officer Opinion Survey reported
that their originations of prime jumbo mortgages declined over the past three months
compared with the previous three-month period. Spreads on indexes of credit default
swaps on subprime mortgages widened notably, and delinquency rates on variable-rate
subprime mortgages posted a further increase in August. Issuance of subprime-
mortgage-backed securities remained weak through mid-October. Considerable
fractions of respondents to the October Senior Loan Officer Opinion Survey
indicated that they had tightened lending standards on prime as well as nontraditional
and subprime residential mortgage loans over the past three months. In contrast,
available information suggests that the origination of conforming mortgages has been
little affected by recent developments.
Class I FOMC - Restricted Controlled (FR) 8 of 44

Foreign Developments
(8) As in the United States, conditions in financial markets abroad improved
noticeably following the FOMC’s decision to cut the target federal funds rate, but a
number of foreign markets remain unsettled. The European Central Bank continued
to provide substantial amounts of liquidity during the intermeeting period. The Bank
of England also added liquidity and allowed banks greater flexibility in meeting their
target balances. Equity prices in major industrial countries gained 2 to 5 percent over
the period, and their implied volatilities declined (Chart 3). Yields on long-term
government securities recorded small net changes. Stock prices in emerging market
economies, which generally had been less affected by the recent financial crisis,
performed even better in most cases, and EMBI+ spreads for many key emerging
market economies narrowed.
(9) The foreign exchange value of the dollar recorded a decline of more than
3½ percent over the intermeeting period against a trade-weighted index of major
foreign currencies, with a wide range of moves against individual currencies.2 The
dollar dropped almost 5½ percent versus the Canadian dollar in response to
indications of continued robust Canadian economic performance and higher prices
for oil and other commodities. The U.S. dollar fell below parity with the Canadian
currency for the first time in more than thirty years. The dollar declined 3 percent on
balance against the euro and reached a record low during the period. The dollar
moved down somewhat less versus the yen, which appeared to be weakened by the
re-establishment of yen-funded carry trade positions. Both the Australian dollar and
New Zealand dollar, currencies that are often on the other side of carry trades,
appreciated substantially over the period. The dollar also declined about 1¾ percent
against an index of currencies of our other important trading partners.
2
.
Class I FOMC - Restricted Controlled (FR) 9 of 44

Chart 3International Financial Indicators
Note: Vertical lines indicate September 18, 2007. Last daily observations are for October 25, 2007.
2004 2005 2006 2007 90
100
110
120
130
140
150
160
170
180
190
UK (FTSE-350)Euro Area (DJ Euro)Japan (Topix)
Stock Price IndexesIndustrial Countries
Daily
Index(12/31/03=100)
September FOMC
3.0
3.5
4.0
4.5
5.0
5.5
6.0
2004 2005 2006 20070.0
0.5
1.0
1.5
2.0
2.5
3.0
UK (left scale)Germany (left scale)Japan (right scale)
Ten-Year Government Bond Yields (Nominal)
Daily
Percent
September FOMC
2004 2005 2006 2007 86
88
90
92
94
96
98
100
102
104
106
108
110
112
BroadMajor CurrenciesOther Important Trading Partners
Nominal Trade-Weighted Dollar Indexes
Daily
Index(12/31/03=100)
September FOMC
2004 2005 2006 2007 70
100
130
160
190
220
250
280
310
340
370
400
Brazil (Bovespa)Korea (KOSPI)Mexico (Bolsa)
Stock Price IndexesEmerging Market Economies
Daily
Index(12/31/03=100)
September FOMC
Class I FOMC - Restricted Controlled (FR) 10 of 44
Debt and Money
(10) Domestic nonfinancial sector debt is estimated to have increased at an
annual rate of 7½ percent in the third quarter, a bit faster than in the second quarter,
as slower borrowing by households and nonfinancial businesses was more than offset
by faster expansion of federal government debt (Chart 4). Notable net fractions of
banks reported in the October Senior Loan Officer Opinion Survey that they had
tightened lending terms on C&I loans over the previous three months. (See box
“Recent Developments at Commercial Banks.”) Even so, business debt growth
remained strong, reflecting robust issuance of investment-grade bonds and the
continued surge in C&I lending. The growth of C&I loans was partly the result of
LBO-related financings that underwriters could not syndicate to institutional investors
ending up on banks’ books. Household mortgage borrowing is estimated to have
decelerated again in the third quarter, reflecting further declines in home price
appreciation and home sales and tighter credit conditions for nonconforming
mortgages. In contrast, consumer credit continued to expand at a moderate pace
through August.
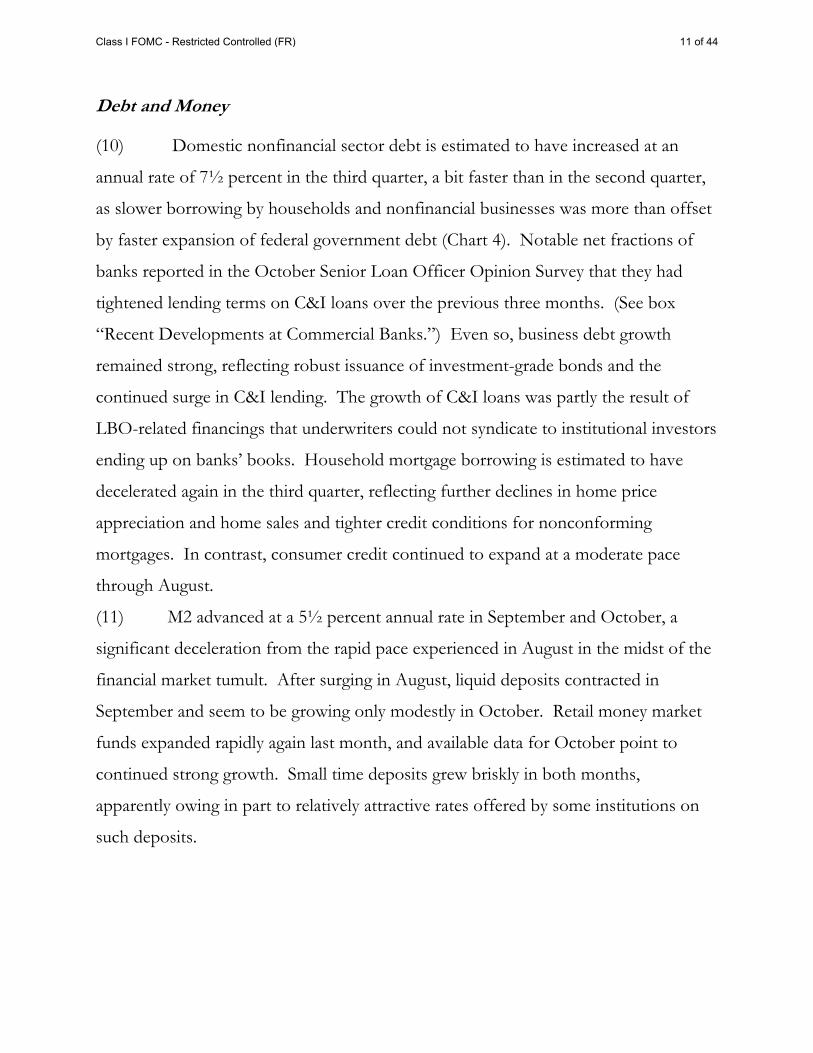
(11) M2 advanced at a 5½ percent annual rate in September and October, a
significant deceleration from the rapid pace experienced in August in the midst of the
financial market tumult. After surging in August, liquid deposits contracted in
September and seem to be growing only modestly in October. Retail money market
funds expanded rapidly again last month, and available data for October point to
continued strong growth. Small time deposits grew briskly in both months,
apparently owing in part to relatively attractive rates offered by some institutions on
such deposits.
Class I FOMC - Restricted Controlled (FR) 11 of 44

Chart 4Debt and Money
Growth of Debt of Nonfinancial Sectors
Percent, s.a.a.r.
2006
2007
Q1Q2Q3Q4
Q1Q2Q3p
Total_____
8.7
9.98.07.28.4
7.97.17.4
Business__________
9.6
10.38.56.9
11.4
8.910.69.2
Household__________
10.0
11.010.68.88.0
7.07.15.2
p Projected. 1991 1993 1995 1997 1999 2001 2003 2005 2007
-3
0
3
6
9
12
15
18
21
Growth of Debt of Household SectorPercent
Quarterly, s.a.a.r.
p Projected.
Q3pQ3p
ConsumerCredit
HomeMortgage
1995 1997 1999 2001 2003 2005 2007 0
2
4
6
8
10
12
Growth of House PricesPercent
Quarterly, s.a.a.r.
Q2
OFHEO Purchase-Only Index
-10
0
10
20
30
40
50
60
70
80
C&I LoansCommercial PaperBonds
Sum
Changes in Selected Components of Debt ofNonfinancial Business*
$Billions
2005 H1 H2 Q1 Q2 Q3
2006 2007
Monthly rate
*Commercial paper and C&I loans are seasonally adjusted, bonds are not.
p
p Preliminary.
-4
-2
0
2
4
6
8
10
12
Growth of M2
s.a.a.r.Percent
2005 H1 H2 Q1 Q2 Q32006 2007
0.25
0.50
1.00
2.00
4.00
8.00
1993 1995 1997 1999 2001 2003 2005 2007
1.8
1.9
2.0
2.1
2.2
2.3
M2 Velocity and Opportunity CostVelocityPercent
Quarterly
Opportunity Cost*(left axis)
Velocity(right axis)
*Two-quarter moving average.
Q3p
Q3p
Class I FOMC - Restricted Controlled (FR) 12 of 44

Recent Developments in Commercial Banking Commercial bank credit has grown at a 13 percent annual rate since the end of July. Most of the advance has been accounted for by a surge in C&I loans (left hand chart) and loans to nonbank financial institutions extended by large domestic commercial banks and U.S. branches and agencies of foreign banks. The increase in these banks’ C&I loans has been caused partly by the retention of underwritten LBO-related loans that these institutions have not been able to syndicate. The jump in loans to financial institutions occurred in August and early September and was consistent with reports that some banks provided short-term financing to commercial paper conduits and to other nonbank financial institutions. In addition, steady expansion of C&I loans at smaller banks suggests appreciable underlying growth in the demand for bank-intermediated business credit that is unrelated to the dislocations in financial markets. Banks have funded the expansion of their balance sheets largely with managed liabilities, such large time deposits and nondeposit sources, which include Federal Home Loan Bank advances. Perhaps in an effort to conserve balance sheet capacity, large banks shed U.S. housing finance agencies’ mortgage pass-through securities. The October Senior Loan Officer Opinion Survey indicated that, on net, banks have tightened standards and terms for most categories of loans to businesses and households over the past three months, probably reflecting in part a desire to manage their balance sheet capacity as well as their credit risk. Profits declined at many large banking companies last quarter, and results often came in below analysts’ estimates. Many of the firms attributed their disappointing earnings largely to deteriorating credit quality, particularly in the home mortgage sector, while several of the largest firms also reported significant write-downs on leveraged syndicated loans and structured financial products. Partly as a result, CDS spreads for large banking organizations remained elevated over the intermeeting period (right hand chart).
Class I FOMC - Restricted Controlled (FR) 13 of 44

Medium-Term Strategies
(12) To shed additional light on the economic outlook and possible monetary
policy strategies over the medium term, the staff has extended the Greenbook
forecast beyond 2009 using the FRB/US model with adjustments to ensure
consistency with the staff’s assessment of longer-run trends.3 This extended forecast
embeds several key assumptions for the period beyond 2009: Trend multifactor
productivity grows 1 percent per year; energy prices are approximately flat in real
terms; the real value of the dollar depreciates 1¼ percent per year; and the unified
federal budget deficit edges up to 2½ percent of GDP by 2012. In the extension, the
unemployment rate beyond 2009 stays close to the staff’s assumed long-run NAIRU
of 4¾ percent while core PCE inflation remains fairly stable at about 2 percent—a
rate roughly consistent with recent survey measures of long-run inflation expectations.
The real funds rate path consistent with these outcomes declines from slightly above
2¾ percent in 2009 to about 2¼ percent on average in 2011 and 2012.
(13) As shown in Chart 5, the Greenbook-consistent measure of short-run r*—
the value that would close the output gap over the next twelve quarters—has shifted
up 10 basis points and now stands at 2.9 percent, about the same as the actual real
federal funds rate. The three model-based estimates of short-run r* range from
1.6 to 2.6 percent; on average, these estimates are a bit lower than in the previous
Bluebook.4 The model-based and TIPS-based estimates of medium-run r* range from
1.9 to 2.4 percent and are little changed from the previous Bluebook.
(14) Chart 6 depicts optimal control simulations of the FRB/US model using
the staff’s extension of the Greenbook forecast beyond 2009. In these simulations,
3 The characteristics of the extension are described in the memo to the Committee by Michael McCracken, “The Extended Greenbook Forecast,” October 25, 2007. 4 In contrast with past practice, starting with this Bluebook all model-based estimates of r* take as given the staff’s estimates of real activity and other economic variables in the current quarter.
Class I FOMC - Restricted Controlled (FR) 14 of 44

Chart 5Equilibrium Real Federal Funds Rate
1990 1991 1992 1993 1994 1995 1996 1997 1998 1999 2000 2001 2002 2003 2004 2005 2006 2007
-2
-1
0
1
2
3
4
5
6
7
8Percent
Note: Appendix A provides background information regarding the construction of these measures and confidence intervals.
Short-Run Estimates with Confidence Intervals
Short-Run and Medium-Run Measures
Actual real federal funds rateRange of model-based estimates70 percent confidence interval90 percent confidence intervalGreenbook-consistent measure
Current Estimate Previous Bluebook
Short-Run Measures Single-equation model 2.6 2.5 Small structural model 1.6 1.8 Large model (FRB/US) 2.3 2.6 Confidence intervals for three model-based estimates 70 percent confidence interval (0.7 - 3.7( 90 percent confidence interval -0.2 - 4.6(
Greenbook-consistent measure 2.9 2.8
Medium-Run Measures Single-equation model 2.4 2.3 Small structural model 1.9 1.9 Confidence intervals for two model-based estimates 70 percent confidence interval (1.2 - 3.1( 90 percent confidence interval (0.7 - 3.9(
TIPS-based factor model 2.1 2.1
Memo Actual real federal funds rate 2.9 3.4
Class I FOMC - Restricted Controlled (FR) 15 of 44

policymakers place equal weights on keeping core PCE inflation close to a specified
goal, on keeping unemployment close to the long-run NAIRU, and on avoiding
changes in the nominal federal funds rate.5 For an inflation goal of 1½ percent (the
left-hand set of charts), the optimal control simulation prescribes a nominal federal
funds rate path that rises slightly from about 5¼ percent in the third quarter to
roughly 5½ percent by the end of 2008 and then declines gradually to a little under
4 percent by the end of 2012. With an inflation goal of 2 percent (the right-hand set
of charts), the optimal funds rate gradually falls to a bit under 4½ percent by the end
of 2012. The prescription for the trajectory of the funds rate with a 1½ percent
inflation goal is a little higher than that shown in the September Bluebook, reflecting
the somewhat stronger assessment by the staff of the outlook for aggregate demand.
Under either inflation goal, the paths of the unemployment rate and the inflation rate
over the next few years are a bit lower than those shown in the previous Bluebook,
consistent with the revisions to the Greenbook forecast.
(15) As shown in Chart 7, the outcome-based monetary policy rule (the left
panel) prescribes a funds rate path that declines to around 4½ percent by the middle
of next year and then rises to about 5 percent near the end of the decade before
falling back. This path is about ¼ percentage point on average higher than in the
September Bluebook, reflecting the upward revision to the projection for real growth,
and is somewhat above the funds rate path anticipated by financial market participants
(the right panel). Stochastic simulations of the FRB/US model indicate a 70 percent
probability that the prescriptions of the outcome-based rule will fall in a range of
5 In conducting these simulations, policymakers and participants in financial markets are assumed to understand fully the forces shaping the economic outlook (as summarized by the extended Greenbook projection), whereas households and firms form their expectations using more limited information. In this Bluebook, the current quarter is the first period of the simulation for which a value for the nominal funds rate different from that embedded in the extended Greenbook projection is permitted.
Class I FOMC - Restricted Controlled (FR) 16 of 44
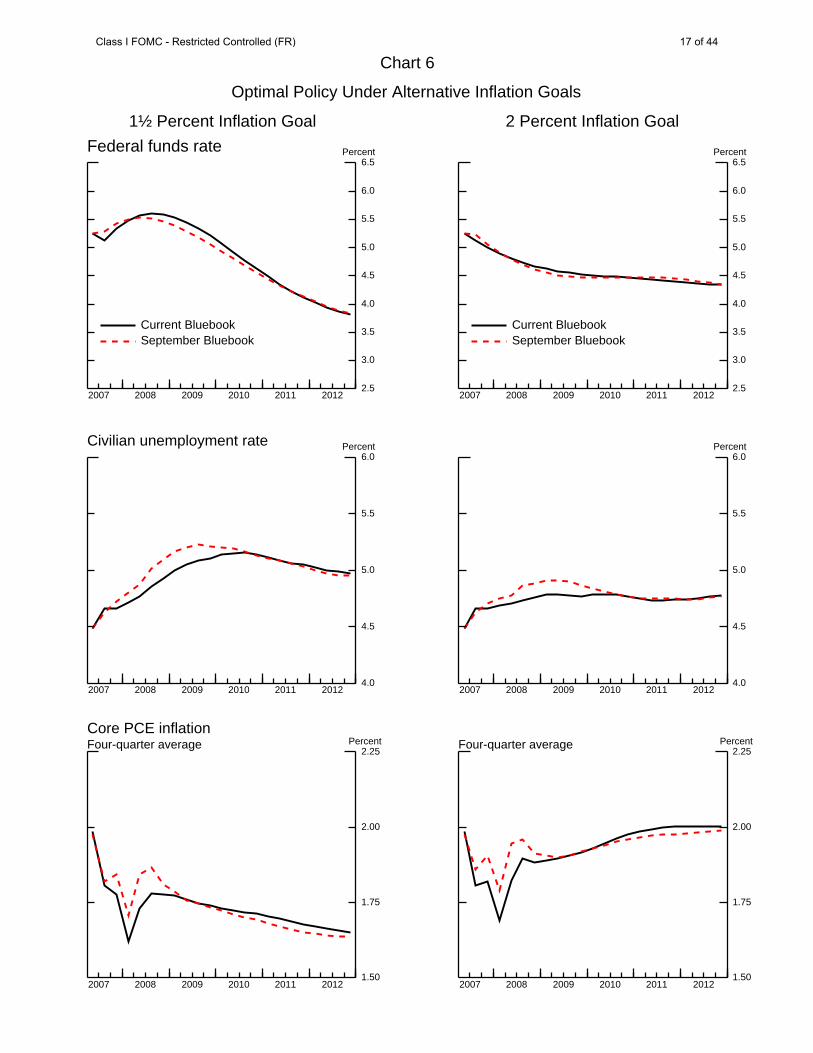
Chart 6
Optimal Policy Under Alternative Inflation Goals
2007 2008 2009 2010 2011 2012
2.5
3.0
3.5
4.0
4.5
5.0
5.5
6.0
6.5Percent
1½ Percent Inflation Goal
Federal funds rate
Current BluebookSeptember Bluebook
2007 2008 2009 2010 2011 2012
4.0
4.5
5.0
5.5
6.0Percent
Civilian unemployment rate
2007 2008 2009 2010 2011 2012
1.50
1.75
2.00
2.25Percent
Core PCE inflationFour-quarter average
2007 2008 2009 2010 2011 20122.5
3.0
3.5
4.0
4.5
5.0
5.5
6.0
6.5Percent
2 Percent Inflation Goal
Current BluebookSeptember Bluebook
2007 2008 2009 2010 2011 2012
4.0
4.5
5.0
5.5
6.0Percent
2007 2008 2009 2010 2011 20121.50
1.75
2.00
2.25Percent
Four-quarter average
Class I FOMC - Restricted Controlled (FR) 17 of 44

Chart 7
The Policy Outlook in an Uncertain Environment
2007 2008 2009 2010 2011 2012
0
1
2
3
4
5
6
7
8
9
10
11Percent
Note: Appendix B provides background information regarding the specification of each rule and the methodology used inconstructing confidence intervals and near-term prescriptions.
FRB/US Model Simulations ofEstimated Outcome-Based Rule
Current Bluebook Previous Bluebook70 Percent confidence interval90 Percent confidence intervalGreenbook assumption
2007 2008 2009 2010 2011 20120
1
2
3
4
5
6
7
8
9
10
11Percent
Information from Financial Markets
Expectations from forward contracts Previous Bluebook70 Percent confidence interval Previous Bluebook90 Percent confidence interval Previous Bluebook
Near-Term Prescriptions of Simple Policy Rules
2007Q4 2008Q1 2007Q4 2008Q1
2007Q4 2008Q1
1½ PercentInflation Objective
2 PercentInflation Objective
Memo
Taylor (1993) rule 4.3 4.0 4.0 3.7 Previous Bluebook 4.2 4.0 4.0 3.7
Taylor (1999) rule 4.5 4.1 4.3 3.9 Previous Bluebook 4.3 3.9 4.1 3.7
Taylor (1999) rule with higher r* 5.3 4.9 5.0 4.6 Previous Bluebook 5.1 4.7 4.8 4.4
First-difference rule 5.0 5.0 4.7 4.5 Previous Bluebook 5.1 5.0 4.6 4.3
Estimated outcome-based rule 4.8 4.5 Estimated forecast-based rule 4.8 4.5 Greenbook assumption 4.8 4.8 Market expectations 4.5 4.1
Class I FOMC - Restricted Controlled (FR) 18 of 44

3½ to 5¾ percent at the end of next year.6 Interest rate caps suggest a broadly similar
degree of uncertainty in financial markets regarding the prospective path of policy
over the next several years, with a 70 percent confidence interval of about 2½ to 4¾
percent at the end of 2008.
(16) For an inflation goal of either 1½ percent or 2 percent, the near-term
prescriptions of simple policy rules generally point to additional policy easing,
although the Taylor (1999) rule with a higher r* and the first difference rule with an
inflation goal of 1½ percent both suggest a slightly tighter policy stance. The
prescriptions of the Taylor (1993) rule are virtually unchanged from those of the
previous Bluebook, reflecting the offsetting influences of a slightly higher output gap
and slightly lower core inflation. Because the Taylor (1999) rule responds more
aggressively to output gaps, the prescriptions from this rule—and the variant with
a higher intercept—have been revised up more noticeably, about 15 basis points.
The first-difference rule responds to three-quarter-ahead projections of four-quarter
core inflation and GDP growth relative to potential; the prescriptions from this
rule are little changed for an inflation goal of 1½ percent and are up a notch for
an inflation goal of 2 percent.
6 The width of these confidence intervals is determined by the past two decades of estimated model residuals.
Class I FOMC - Restricted Controlled (FR) 19 of 44

Economic Outlook through 2009
(17) Reflecting incoming economic data that were, on balance, stronger than
expected, as well as higher stock prices, lower corporate bond rates, and a weaker
foreign exchange value of the dollar, the staff outlook for growth in aggregate demand
has been marked up a bit over the near term but is little changed farther ahead. The
staff has retained its assumption that the target federal funds rate will be held constant
at 4¾ percent during 2008 and 2009. As investors instead anticipate some policy
easing at this and subsequent meetings, longer-term Treasury yields are expected to
firm going forward. As usual, stock prices are assumed to rise at the 6½ percent
annual rate required to equate the risk-adjusted return on equities to that on Treasury
securities. The real foreign exchange value of the dollar is projected to depreciate
about 1¼ percent per year. Consistent with futures market quotes, spot oil prices are
projected to decline gradually but from a substantially higher level than in the
September forecast. Against this backdrop, the pace of economic expansion is
projected to slow from 3¼ percent in the third quarter to about 1½ percent in the
current quarter and the first quarter of 2008, as the housing correction deepens and
the recent strength in consumer and business spending moderates. Beyond the first
quarter of 2008, the staff’s forecast is little changed from the September Greenbook:
Output is projected to expand somewhat more slowly than potential over the
remainder of 2008, and at about the same rate as potential in 2009, when residential
investment is anticipated to begin growing modestly. The unemployment rate
remains essentially equal to the staff’s 4¾ percent estimate of the NAIRU through the
end of the forecast period. Spurred by the recent surge in oil prices, total PCE
inflation climbs to nearly 2¾ percent in the fourth quarter; it then drops to 2¼
percent in the first quarter of next year and to about 1¾ percent for the rest of the
forecast period as oil prices trend down. Core PCE inflation rises from 1½ percent
Class I FOMC - Restricted Controlled (FR) 20 of 44

over the past two quarters to 2 percent in the current quarter and subsequently
remains just under that rate through 2009.
Short-Run Policy Alternatives
(18) This Bluebook presents three policy alternatives for the Committee’s
consideration, summarized in Table 1. Alternative A lowers the target federal funds
rate 25 basis points to 4½ percent, while Alternatives B and C leave the target rate
unchanged at 4¾ percent. In the rationale paragraph, all three alternatives recognize
that economic growth was solid in the third quarter. (The advance report for third-
quarter GDP growth will be published on October 31, the second day of the FOMC
meeting. The staff and most private sector forecasters expect that output grew
significantly faster than potential last quarter. If third-quarter growth turns out to be
considerably above or below expectations, “strong” or “moderate” perhaps could be
substituted for “solid.”) All three alternatives also acknowledge that strains in
financial markets have eased somewhat on balance and suggest that the Committee
expects some slowing of the pace of economic expansion in the near term.
Alternative A alludes to the possibility that the tightening of credit conditions since
earlier this year could restrain economic growth, and Alternative B makes that point
more directly. Because recent inflation readings have continued to be relatively
benign but have not shown signs of further moderation, Alternatives A and B
maintain the language regarding inflation used in the September statement. In
contrast, Alternative C states that the high level of resource utilization and recent
increases in energy prices may put renewed upward pressures on both overall and
core inflation. While considerable uncertainty about the economic outlook remains,
the three alternatives assume that the Committee is prepared to resume the practice of
assessing the balance of risks to growth and inflation. Alternatives A and C
characterize the downside risks to growth as roughly balancing the upside risks to
Class I FOMC - Restricted Controlled (FR) 21 of 44

Table 1: Alternative Language for the October 2007 FOMC Announcement
September FOMC Alternative A Alternative B Alternative C
Policy Decision
1. The Federal Open Market Committee decided today to lower its target for the federal funds rate 50 basis points to 4-3/4 percent.
The Federal Open Market Committee decided today to lower its target for the federal funds rate 25 basis points to 4-1/2 percent.
The Federal Open Market Committee decided today to keep its target for the federal funds rate at 4-3/4 percent.
The Federal Open Market Committee decided today to keep its target for the federal funds rate at 4-3/4 percent.
2. Economic growth was moderate during the first half of the year, but the tightening of credit conditions has the potential to intensify the housing correction and to restrain economic growth more generally. Today’s action is intended to help forestall some of the adverse effects on the broader economy that might otherwise arise from the disruptions in financial markets and to promote moderate growth over time.
Economic growth was solid in the third quarter, and strains in financial markets have eased somewhat on balance. However, the pace of economic expansion will likely slow somewhat in the near term, partly reflecting the intensification of the housing correction. Today’s action, combined with the policy action taken in September, should help forestall some of the adverse effects on the broader economy that might otherwise arise from the disruptions in financial markets and promote moderate growth over time.
Economic growth was solid in the third quarter, and strains in financial markets have eased somewhat on balance. The pace of economic expansion will likely slow somewhat in the near term, partly reflecting the intensification of the housing correction. But, to date, other sectors of the economy have proven resilient and the global economy remains strong. The Committee anticipates that the economic expansion will return to a moderate pace over time, but sees continuing risks to growth, notably the potential impact of the tightening of credit conditions for some households and businesses.
Economic growth was solid in the third quarter despite an intensification of the housing correction. Strains in financial markets have eased somewhat on balance, reducing the downside risks to growth. Though incoming indicators point to some near-term slowing in the pace of economic expansion, the recent easing of monetary policy should help promote moderate growth over time.
Rationale
3. Readings on core inflation have improved modestly this year. However, the Committee judges that some inflation risks remain, and it will continue to monitor inflation developments carefully.
Readings on core inflation have improved modestly this year. However, the Committee judges that some inflation risks remain, and it will continue to monitor inflation developments carefully.
Readings on core inflation have improved modestly this year. However, the Committee judges that some inflation risks remain, and it will continue to monitor inflation developments carefully.
Readings on core inflation have improved modestly this year, but the high level of resource utilization and recent increases in energy prices may put renewed upward pressures on overall and core inflation.
Assessment of Risk
4. Developments in financial markets since the Committee’s last regular meeting have increased the uncertainty surrounding the economic outlook. The Committee will continue to assess the effects of these and other developments on economic prospects and will act as needed to foster price stability and sustainable economic growth.
The Committee judges that the upside risks to inflation roughly balance the downside risks to growth. The Committee will continue to assess the effects of financial and other developments on economic prospects and will act as needed to foster price stability and sustainable economic growth.
On balance, the Committee views downside risks to growth as the greater policy concern. The Committee will continue to assess the effects of financial and other developments on economic prospects and will act as needed to foster price stability and sustainable economic growth.
The Committee judges that the upside risks to inflation roughly balance the downside risks to growth. Future policy adjustments will depend on the outlook for both inflation and economic growth, as implied by incoming information.
Class I FOMC - Restricted Controlled (FR) 22 of 44

inflation, while Alternative B identifies the downside risks to growth as the greatest
policy concern. As usual, the Committee could combine language from different
alternatives.
(19) If the Committee judges that the current stance of policy is likely to be
consistent with sustainable growth and an acceptable trajectory for inflation over time
but sees appreciable downside risks to growth, it may wish to choose Alternative B.
The economy seems to have expanded at a brisk pace in the third quarter, boosted
primarily by personal consumption and business expenditures, suggesting
considerable underlying strength of spending prior to the recent financial turbulence.
In addition, strains in financial markets have eased somewhat on balance, partly
allaying concerns about a severe credit crunch. The strong performance of the global
economy could also support U.S. economic growth. And while the housing data
received during the intermeeting period were not encouraging, they also were not
greatly surprising, at least from the perspective of the September Greenbook forecast.
The real federal funds rate is now equal to its Greenbook-consistent equilibrium value
and just a bit above the range of model-based estimates (Chart 5), suggesting that the
current policy stance is likely to keep output in the vicinity of its potential. In
addition, the present target for the federal funds rate remains close to near-term policy
prescriptions derived from optimal policy simulations with a 2 percent inflation target
(Chart 6) and is consistent with a number of policy rules, even assuming a 1½ percent
inflation objective (Chart 7). However, the functioning of some financial markets is
still quite far from normal, credit conditions have tightened considerably for some
households and businesses since early in the year, and there is some possibility that
recent improvements in market functioning could be reversed. The Committee may
be sufficiently concerned about a possible further deterioration in financial conditions
or about potential spillovers from the housing sector to believe that the risks to its
growth outlook are significantly skewed to the downside. Moreover, it may see the
Class I FOMC - Restricted Controlled (FR) 23 of 44

possibility that a weakening of the economy could have a negative impact on financial
markets, leading to further tightening of credit conditions. At the same time, the
Committee may believe that the inflation outlook is acceptable, although with some
upside risks. Inflation data have been fairly benign in recent months, suggesting that
the underlying rate of inflation is relatively moderate, and the Committee may be
optimistic that recognition of its commitment to price stability will help gradually
reduce inflation over time. But the high level of resource utilization, the recent
increases in energy and other commodity prices, and the decline in the foreign
exchange value of the dollar may be viewed as presenting upside risks to inflation.
Nonetheless, the Committee may believe that the downside risks to growth are the
greater policy concern.
(20) Given that the economy likely expanded at a pace noticeably above that of
potential in the third quarter, the draft statement for Alternative B describes recent
growth as “solid.” It also takes note of the fact that strains in financial markets have
eased somewhat on balance. While recognizing that the ongoing housing
deterioration will likely weigh substantially on economic performance over the next
few quarters, the statement points out that other sectors of the economy have proven
resilient so far and that the global economy remains strong. The assessment of risk
paragraph would note that downside risks to growth are a greater policy concern to
the Committee than inflation risks and then repeats the second sentence of the risk
assessment from the September statement.
(21) Market participants have priced in more than 25 basis points of easing at
this meeting. Thus, a decision to leave the federal funds rate unchanged is likely to
produce a considerable backup in shorter-term interest rates. However, with the
statement pointing to downside risks to growth and thus suggesting that further policy
easing could be forthcoming, short-term rates are not likely to move up by the full
amount of the policy surprise. The anticipation of future policy easing will likely
Class I FOMC - Restricted Controlled (FR) 24 of 44

restrain the increase in longer-term interest rates even more. With relative yields
probably adjusting in favor of dollar assets, the recent tendency for the foreign
exchange value of the dollar to depreciate could be reduced. Equity prices would
likely decline, given the policy surprise and the assessment that risks to growth are
tilted to the downside.
(22) If the Committee has a modal outlook similar to the Greenbook projection
that growth will return to potential in a few quarters and sees the risks around that
forecast as relatively balanced, it might be inclined to choose Alternative C. Under
this alternative, there would be no change in the target federal funds rate, and the
statement would indicate that downside risks to growth are balanced by upside risks
to inflation. Members might view the partial easing of the strains in financial markets
since mid-summer as substantially reducing the likelihood that instability in the
financial system will undermine economic performance, especially since there do not
appear to have been significant spillovers to consumer and business spending as yet.
Indeed, the Committee may see the improved financial market conditions and the
outlook for growth near potential in 2008 and 2009 as close to the situation it
envisioned after the September policy easing. Even if the Committee believes that
ongoing financial strains pose downside risks to growth, it may also believe that those
risks are partly offset by other factors. For example, Committee members might be
more optimistic than the staff regarding the persistence of the recent robust growth in
business fixed investment and household consumption, along the lines of the
“Greater Momentum in Aggregate Demand” alternative scenario in the Greenbook.
On the inflation side, the Committee may have become more worried about the
potential for renewed price pressures. While inflation readings have remained
relatively benign, the Committee might view the increase in energy prices over the
past few weeks as likely to push up overall inflation in the near term, with potential
adverse effects on inflation expectations. Indeed, the Committee may be concerned
Class I FOMC - Restricted Controlled (FR) 25 of 44

by the increase since earlier this year of around 25 basis points in forward inflation
compensation implied by TIPS securities. The weakening of the dollar may also be
seen as posing a greater inflationary threat than foreseen by the staff. Some members
may also be worried that current levels of resource utilization are not sustainable and
pose an upside risk to inflation. Others may see particularly high costs to an increase
in inflation from its recent readings and, partly for that reason, may have little
expectation that a near-term easing of policy would be warranted. Under these
circumstances, the Committee might judge that the current stance of policy is
appropriate and believe that the downside risks to growth are balanced by upside risks
to inflation.
(23) The proposed statement for Alternative C indicates that economic growth
was solid in the third quarter despite the ongoing housing correction. It then notes
the easing in financial market strains and associates that development with a reduction
in the downside risks to growth. The statement proceeds to affirm the expectation
that the pace of economic expansion will slow in the near term but also that the
substantial easing of monetary policy in September should help promote moderate
growth over time. The statement makes no explicit mention of potential risks
induced by tighter credit conditions. The wording on inflation begins by noting the
improvement in inflation readings this year, as in the September FOMC statement,
but then cites the risk that the high level of resource utilization and recent increases in
energy prices may put renewed upward pressures on overall and core inflation. The
Committee would indicate that the downside risks to growth are balanced by the
upside risks to inflation and would reintroduce the indication that future policy
adjustments will depend on the outlook for both inflation and economic growth.
Market participants would be quite surprised by the combination of no policy action
at this meeting and the statement proposed for Alternative C. They would likely
conclude that the Committee has no inclination to lower rates in the near term.
Class I FOMC - Restricted Controlled (FR) 26 of 44

Given that high odds are placed on policy easing at this and coming meetings, both
short- and long-term interest rates would likely increase considerably following the
announcement. In response to the jump in interest rates, the foreign exchange value
of the dollar might appreciate somewhat. Although investors’ views about economic
prospects might be buoyed to some extent by an inference that the Federal Reserve
anticipated sustainable growth at the current level of the federal funds rate, it seems
more likely that market participants would mark down their expectations for
economic growth. Consequently, concerns about credit risk could increase, and
equity prices could decline significantly.
(24) While strains in financial markets have eased in recent weeks, functioning in
some markets remains impaired. Moreover, banks appear to have responded to the
problems in funding markets, concerns about balance sheet capacity, and worries
about the economic outlook by tightening terms and standards across a broad range
of credit products. The Committee might see these developments as reducing its
modal outlook for aggregate demand relative to its expectations after its September
action. Alternatively, members might see the failure of credit market conditions to
improve more significantly and incoming evidence of a steepening contraction in the
housing sector as indicating that the downside risks to overall economic performance
remain unacceptably large; the potential implications of such factors are illustrated in
the “Greater Fallout from Financial Stress” alternative scenario in the Greenbook.
Either view might incline the Committee to choose Alternative A, which lowers the
target federal funds rate 25 basis points. The Committee might see easing policy
another notch as an appropriate risk-management tactic, given the potential for
particularly adverse outcomes, especially since a 25 basis point cut in the target federal
funds rate would still be consistent with several policy rules (Chart 7). Given that
inflation data have continued to be favorable, the Committee may also believe that a
policy easing would be consistent with its price stability objectives, especially if
Class I FOMC - Restricted Controlled (FR) 27 of 44

members believe that, if necessary, they could act quickly in the future to reverse
some or all of the easing implemented since September.
(25) The draft statement for Alternative A, like those for Alternatives B and C,
begins by noting the solid economic performance in the third quarter and the easing
of strains in financial markets. As the other alternatives, it also recognizes that the
pace of economic expansion will likely slow in the near term but, by prefacing that
consideration with the word “however,” gives it more prominence. The statement
then asserts that the cut in the target rate, combined with the policy easing at the
September meeting, should help forestall some of the adverse effects on the broader
economy that might otherwise arise from the disruptions in financial markets,
replicating the words in the September statement. The paragraph regarding inflation
is unchanged from September, as in Alternative B. If the Committee believes that,
after this move, the risks to growth would still be tilted somewhat to the downside
while some upside inflation risks would remain, it could characterize the risks as
balanced and continue by stating its intent to assess the effects of financial and other
developments on economic prospects as in Alternative B.
(26) Investors currently see a 25 basis point policy easing at this meeting as the
most likely outcome. Thus, very short-term interest rates would likely change little in
response to an announcement along the lines of that proposed under Alternative A.
However, because market participants expect more than 25 basis points of easing over
the next few quarters, the balanced risk assessment, which would likely be seen as
suggesting that further policy easing may not be forthcoming, could prompt a modest
increase in intermediate- and longer-term interest rates. If participants interpreted the
statement as suggesting reasonably good odds of sustainable growth given the easier
stance of policy, the equity market might rally modestly and the foreign exchange
value of the dollar could firm a bit.
Class I FOMC - Restricted Controlled (FR) 28 of 44

Money and Debt Forecasts
(27) Under the Greenbook projection, M2 is forecast to grow at about a 5½
percent rate on average in the current quarter and the first quarter of 2008—about 1
percentage point higher than in the previous forecast, which assumed a more gradual
policy easing than the Committee implemented at the September meeting. After the
first quarter of next year, M2 growth is projected to slow to just under a 4½ percent
pace for the remainder of the projection period, about in line with the rate forecast in
the September Bluebook.
(28) After having expanded at an annual rate of 7½ percent in the first half of
the year, domestic nonfinancial debt is expected to increase at about a 6½ percent
pace in the second half of 2007 and a 4¾ percent rate in 2008 and 2009. The
deceleration in total nonfinancial sector debt reflects a projected slowdown in
borrowing across all major sectors except the federal government. With house prices
expected to decline, home sales seen as falling further before posting a modest
recovery in 2009, and tighter standards and terms on mortgage loans projected to
persist for at least some borrowers, the staff expects household debt growth to slow
to 4¾ percent at an annual rate in the second half of this year and to 3½ percent in
2008 and 2009, which would be the slowest annual rate of growth in real terms since
1991. Nonfinancial business debt, which expanded robustly in the third quarter, is
projected to decelerate somewhat over the forecast period, as the demand for funds
to finance LBOs and share repurchases abates.
Class I FOMC - Restricted Controlled (FR) 29 of 44

25 bp EasingNo Change/
Greenbook Forecast*
Monthly Growth Rates
Apr-07 9.0 9.0
May-07 3.2 3.2
Jun-07 2.0 2.0
Jul-07 4.1 4.1
Aug-07 10.6 10.6
Sep-07 5.2 5.2
Oct-07 5.6 5.6
Nov-07 5.3 4.9
Dec-07 5.2 4.4
Jan-08 6.2 5.4
Feb-08 5.1 4.4
Mar-08 5.1 4.6
Quarterly Growth Rates
2007 Q2 6.5 6.5
2007 Q3 5.1 5.1
2007 Q4 6.0 5.8
2008 Q1 5.5 4.8
Annual Growth Rates
2006 4.9 4.9
2007 6.4 6.3
2008 4.8 4.4
2009 4.3 4.3
Growth From To
Oct-07 Mar-08 5.4 4.8
* This forecast is consistent with nominal GDP and interest rates in the Greenbook forecast.
Table 2
Alternative Growth Rates for M2
(percent, annual rate)
Class I FOMC - Restricted Controlled (FR) 30 of 44

Directive
Draft language for the directive is provided below.7
The Federal Open Market Committee seeks monetary and financial
conditions that will foster price stability and promote sustainable growth
in output. To further its long-run objectives, the Committee in the
immediate future seeks conditions in reserve markets consistent with
MAINTAINING/INCREASING/reducing the federal funds rate
AT/to an average of around ________ 4¾ percent.
7 The Committee plans to vote on the entire statement beginning with the October meeting. Draft statements associated with the various alternatives are presented in Table 1.
Class I FOMC - Restricted Controlled (FR) 31 of 44

Appendix A: Measures of the Equilibrium Real Rate
The equilibrium real rate is the real federal funds rate that, if maintained, would be projected to return output to its potential level over time. The short-run equilibrium rate is defined as the rate that would close the output gap in twelve quarters given the corresponding model’s projection of the economy. The medium-run concept is the value of the real federal funds rate projected to keep output at potential in seven years, under the assumption that monetary policy acts to bring actual and potential output into line in the short run and then keeps them equal thereafter. The TIPS-based factor model measure provides an estimate of market expectations for the real federal funds rate seven years ahead. The actual real federal funds rate is constructed as the difference between the nominal rate and realized inflation, where the nominal rate is measured as the quarterly average of the observed federal funds rate, and realized inflation is given by the log difference between the core PCE price index and its lagged value four quarters earlier. For the current quarter, the nominal rate is specified as the target federal funds rate on the Bluebook publication date. For the current quarter and the previous quarter, the inflation rate is computed using the staff’s estimate of the core PCE price index. Confidence intervals reflect uncertainties about model specification, coefficients, and the level of potential output. The final column of the table indicates the values published in the previous Bluebook.
Measure Description
Single-equation Model
The measure of the equilibrium real rate in the single-equation model is based on an estimated aggregate-demand relationship between the current value of the output gap and its lagged values as well as the lagged values of the real federal funds rate.
Small Structural Model
The small-scale model of the economy consists of equations for five variables: the output gap, the equity premium, the federal budget surplus, the trend growth rate of output, and the real bond yield.
Large Model (FRB/US)
Estimates of the equilibrium real rate using FRB/US—the staff’s large-scale econometric model of the U.S. economy—depend on a very broad array of economic factors, some of which take the form of projected values of the model’s exogenous variables.
Greenbook-consistent
The FRB/US model is used in conjunction with an extended version of the Greenbook forecast to derive a Greenbook-consistent measure. FRB/US is first add-factored so that its simulation matches the extended Greenbook forecast, and then a second simulation is run off this baseline to determine the value of the real federal funds rate that closes the output gap.
TIPS-based Factor Model
Yields on TIPS (Treasury Inflation-Protected Securities) reflect investors’ expectations of the future path of real interest rates, but also include term and liquidity premiums. The TIPS-based measure of the equilibrium real rate is constructed using the seven-year-ahead instantaneous real forward rate derived from TIPS yields as of the Bluebook publication date. This forward rate is adjusted to remove estimates of the term and liquidity premiums based on a three-factor arbitrage-free term-structure model applied to TIPS yields, nominal yields, and inflation. Because TIPS indexation is based on the total CPI, this measure is also adjusted for the medium-term difference—projected at 40 basis points—between total CPI inflation and core PCE inflation.
Class I FOMC - Restricted Controlled (FR) 32 of 44

Appendix B: Analysis of Policy Paths and Confidence Intervals
Rule Specifications: For the following rules, it denotes the federal funds rate for quarter t, while the explanatory variables include the staff’s projection of trailing four-quarter core PCE inflation (πt), inflation two and three quarters ahead (πt+2|t and πt+3|t), the output gap in the current period and one quarter ahead ( *
t ty y− and *1| 1|t t t ty y+ +− ), and the three-quarter-ahead forecast of annual average GDP
growth relative to potential ( 4 4 *3| 3|t t t ty y+ +Δ − Δ ), and *π denotes an assumed value of policymakers’
long-run inflation objective. The outcome-based and forecast-based rules were estimated using real-time data over the sample 1988:1-2006:4; each specification was chosen using the Bayesian information criterion. Each rule incorporates a 75 basis point shift in the intercept, specified as a sequence of 25 basis point increments during the first three quarters of 1998. The first two simple rules were proposed by Taylor (1993, 1999), while the third is a variant of the Taylor (1999) rule—introduced in the August Bluebook—with a higher value of r*. The prescriptions of the first-difference rule do not depend on assumptions regarding r* or the level of the output gap; see Orphanides (2003).
Outcome-based rule it = 1.20it-1–0.39it-2+0.19[1.17 + 1.73 πt + 3.66( *t ty y− ) – 2.72( *
1 1t ty y− −− )]
Forecast-based rule it = 1.18it-1–0.38it-2+0.20[0.98 +1.72 πt+2|t+2.29( *1| 1|t t t ty y+ +− )–1.37( *
1 1t ty y− −− )]
Taylor (1993) rule it = 2 + πt + 0.5(πt – *π ) + 0.5( *t ty y− )
Taylor (1999) rule it = 2 + πt + 0.5(πt – *π ) + ( *t ty y− )
Taylor (1999) rule with higher r*
it = 2.75 + πt + 0.5(πt – *π ) + ( *t ty y− )
First-difference rule it = it-1 + 0.5(πt+3|t – *π ) + 0.5( 4 4 *3| 3|t t t ty y+ +Δ − Δ )
FRB/US Model Simulations: Prescriptions from the two empirical rules are computed using dynamic simulations of the FRB/US model, implemented as though the rule were followed starting at this FOMC meeting. The dotted line labeled “Previous Bluebook” is based on the current specification of the policy rule, applied to the previous Greenbook projection. Confidence intervals are based on stochastic simulations of the FRB/US model with shocks drawn from the estimated residuals over 1986-2005. Information from Financial Markets: The expected funds rate path is based on forward rate agreements, and the confidence intervals for this path are constructed using prices of interest rate caps. Near-Term Prescriptions of Simple Policy Rules: These prescriptions are calculated using Greenbook projections for inflation and the output gap. Because the first-difference rule involves the lagged funds rate, the value labeled “Previous Bluebook” for the current quarter is computed using the actual value of the lagged funds rate, and the one-quarter-ahead prescriptions are based on this rule’s prescription for the current quarter.
References: Taylor, John B. (1993). “Discretion versus policy rules in practice,” Carnegie-Rochester Conference Series on Public Policy, vol. 39 (December), pp. 195-214. ————— (1999). “A Historical Analysis of Monetary Policy Rules,” in John B. Taylor, ed., Monetary Policy Rules. The University of Chicago Press, pp. 319-341. Orphanides, Athanasios (2003). “Historical Monetary Policy Analysis and the Taylor Rule,” Journal of Monetary Economics, vol. 50 (July), pp. 983-1022.
Class I FOMC - Restricted Controlled (FR) 33 of 44

Short-term Long-term
Federalfunds
Treasury billssecondary market
CDssecondary
market
Comm.paper Off-the-run Treasury yields Indexed yields Moody’s
Baa
MunicipalBondBuyer
Conventional homemortgages
primary market
4-week 3-month 6-month 3-month 1-month 2-year 5-year 10-year 20-year 5-year 10-year Fixed-rate ARM
1 2 3 4 5 6 7 8 9 10 11 12 13 14 15 16
5.34 5.27 5.13 5.33 5.50 5.32 5.32 5.20 5.32 5.45 2.63 2.68 6.94 5.31 6.80 5.834.22 3.91 4.17 4.37 4.50 4.22 4.34 4.28 4.42 4.59 1.82 1.94 6.08 4.52 6.10 5.15
5.41 5.27 5.19 5.19 5.77 5.30 5.12 5.16 5.33 5.44 2.77 2.81 6.86 4.77 6.74 5.844.52 2.39 3.16 4.00 4.85 4.69 3.77 3.96 4.45 4.70 1.84 2.07 6.09 4.33 6.14 5.40
5.25 4.97 5.05 5.12 5.33 5.20 4.81 4.66 4.80 4.95 2.49 2.43 6.42 4.78 6.36 5.555.25 5.22 5.07 5.15 5.32 5.21 4.74 4.54 4.66 4.79 2.39 2.30 6.20 4.59 6.24 5.515.24 4.86 4.98 5.07 5.32 5.23 4.68 4.50 4.63 4.79 2.27 2.27 6.22 4.54 6.14 5.45
5.25 4.92 5.11 5.15 5.32 5.22 4.88 4.72 4.83 4.96 2.45 2.45 6.34 4.55 6.22 5.475.26 5.18 5.16 5.16 5.31 5.22 4.85 4.68 4.80 4.94 2.33 2.38 6.28 4.53 6.29 5.515.26 5.22 5.08 5.10 5.30 5.23 4.62 4.46 4.65 4.83 2.04 2.20 6.27 4.41 6.16 5.445.25 4.99 5.01 5.07 5.31 5.23 4.71 4.57 4.77 4.96 2.11 2.28 6.39 4.47 6.18 5.455.25 4.81 4.87 4.98 5.31 5.22 4.79 4.64 4.82 4.99 2.25 2.39 6.39 4.49 6.26 5.525.25 4.51 4.74 4.95 5.33 5.24 5.01 5.00 5.17 5.30 2.66 2.69 6.70 4.73 6.66 5.685.26 4.80 4.96 5.04 5.32 5.23 4.84 4.86 5.08 5.20 2.62 2.66 6.65 4.69 6.70 5.715.02 4.19 4.32 4.55 5.49 5.24 4.36 4.44 4.80 5.02 2.43 2.48 6.65 4.58 6.57 5.674.94 3.77 4.00 4.20 5.46 4.94 4.06 4.18 4.63 4.86 2.18 2.29 6.59 4.45 6.38 5.66
4.93 3.33 3.71 4.17 5.49 5.23 4.20 4.35 4.75 5.03 2.39 2.45 6.68 4.75 6.52 5.605.11 4.22 4.17 4.38 5.59 5.22 4.20 4.27 4.67 4.92 2.35 2.40 6.60 4.64 6.45 5.845.02 4.32 4.30 4.39 5.73 5.19 4.09 4.15 4.61 4.84 2.23 2.34 6.55 4.51 6.46 5.745.05 3.99 4.04 4.23 5.67 5.02 4.03 4.09 4.53 4.75 2.12 2.22 6.54 4.40 6.31 5.665.00 3.58 3.92 4.15 5.30 4.84 4.09 4.23 4.67 4.90 2.17 2.27 6.65 4.45 6.34 5.654.78 3.31 3.79 4.08 5.20 4.77 4.02 4.24 4.71 4.94 2.20 2.34 6.63 4.42 6.42 5.604.72 3.58 3.96 4.16 5.23 4.72 4.04 4.21 4.67 4.88 2.16 2.29 6.55 4.36 6.37 5.584.75 3.89 4.11 4.28 5.21 4.72 4.19 4.34 4.77 4.96 2.24 2.36 6.57 4.36 6.40 5.734.74 3.74 4.04 4.21 5.12 4.76 4.04 4.20 4.68 4.90 2.07 2.27 6.49 4.33 6.40 5.76 -- 3.85 3.94 4.07 4.97 4.74 3.81 4.00 4.50 4.73 1.92 2.13 -- -- 6.33 5.66
4.91 3.66 4.07 4.28 5.22 4.76 4.16 4.33 4.77 4.95 2.24 2.36 6.57 -- -- --4.52 3.80 4.06 4.27 5.22 4.71 4.18 4.33 4.76 4.94 2.24 2.35 6.56 -- -- --4.75 3.98 4.12 4.27 5.21 4.71 4.16 4.32 4.77 4.96 2.23 2.36 6.56 -- -- --4.75 4.12 4.20 4.31 5.19 4.71 4.25 4.38 4.80 4.99 2.26 2.38 6.57 -- -- --4.81 4.24 4.31 4.39 5.16 4.78 4.24 4.36 4.79 4.99 2.22 2.37 6.57 -- -- --4.68 4.14 4.25 4.33 5.17 4.72 4.15 4.31 4.77 4.98 2.17 2.35 6.58 -- -- --4.70 3.73 4.01 4.17 5.10 4.80 4.02 4.19 4.67 4.89 2.06 2.26 6.48 -- -- --4.69 3.18 3.76 4.09 5.09 4.79 3.96 4.14 4.63 4.86 2.01 2.23 6.46 -- -- --4.77 3.41 3.85 4.07 5.06 4.72 3.83 4.01 4.52 4.75 1.91 2.14 6.38 -- -- --4.71 3.65 4.00 4.15 5.03 4.76 3.86 4.04 4.52 4.75 1.94 2.14 6.38 -- -- --4.67 3.98 3.98 4.12 5.02 4.72 3.84 4.03 4.52 4.76 1.95 2.15 6.39 -- -- --4.74 3.83 3.85 4.00 4.97 4.74 3.77 3.96 4.47 4.71 1.85 2.08 6.34 -- -- --4.78 3.92 3.94 4.02 4.85 -- 3.77 3.97 4.48 4.72 1.84 2.07 -- -- -- --
Appendix C Table 1
Selected Interest Rates(Percent)
NOTE: Weekly data for columns 1 through 13 are week-ending averages. Columns 2 through 4 are on a coupon equivalent basis. Data in column 6 are interpolated from data on certain commercial paper trades settled by theDepository Trust Company. Column 14 is the Bond Buyer revenue index, which is a 1-day quote for Thursday. Column 15 is the average contract rate on new commitments for fixed-rate mortgages (FRMs) with 80 percentloan-to-value ratios at major institutional lenders. Column 16 is the average initial contract rate on new commitments for 1-year, adjustable-rate mortgages (ARMs) at major institutional lenders offering both FRMs andARMs with the same number of discount points.
p - preliminary data
Oct Nov Dec Jan Feb Mar Apr May Jun Jul Aug Sep
Aug Aug Sep Sep Sep Sep Oct Oct Oct Oct
Oct Oct Oct Oct Oct Oct Oct Oct Oct Oct Oct Oct Oct
060606
070707070707070707
2431
7142128
5121926
9101112151617181922232425
07070707070707070707
07070707070707070707070707
06 -- High-- Low
07 -- High-- Low
Monthly
Weekly
Daily
p
MFMA
Class I FOMC - Restricted Controlled (FR) 34 of 44

Appendix C Table 2Money Aggregates
Seasonally Adjusted
NontransactionsComponents in M2
M1 M2
1 2 3
Period
Annual growth rates (%):
Annually (Q4 to Q4)2004 5.4 5.4 5.32005 0.3 4.2 5.32006 -0.4 4.9 6.3
Quarterly (average)2006-Q4 -0.2 6.3 7.92007-Q1 -0.4 7.3 9.1
Q2 2.3 6.5 7.5Q3 -1.6 5.1 6.7
Monthly2006-Oct. 4.6 8.5 9.5
Nov. 1.3 6.0 7.2Dec. -4.3 6.9 9.6
2007-Jan. 5.2 9.4 10.4Feb. -9.8 3.8 7.1Mar. 8.0 9.5 9.8Apr. 8.4 9.0 9.2May 0.0 3.2 4.0June -10.8 2.0 5.0July 2.5 4.1 4.4Aug. 0.4 10.6 13.0Sep. -0.6 5.2 6.6Oct. e 5.9 5.6 5.6
Levels ($billions):
Monthly2007-May 1379.3 7237.9 5858.6
June 1366.9 7249.9 5883.1July 1369.8 7274.5 5904.7Aug. 1370.2 7338.8 5968.7Sep. 1369.5 7370.8 6001.3
Weekly2007-Sep. 3 1425.0 7370.1 5945.1
10 1380.6 7357.2 5976.617 1363.6 7376.7 6013.124 1350.0 7381.7 6031.7
Oct. 1 1356.4 7383.7 6027.38p 1374.5 7385.1 6010.6
15p 1374.6 7372.6 5998.0
p preliminar ye estimated
Class I FOMC - Restricted Controlled (FR) 35 of 44
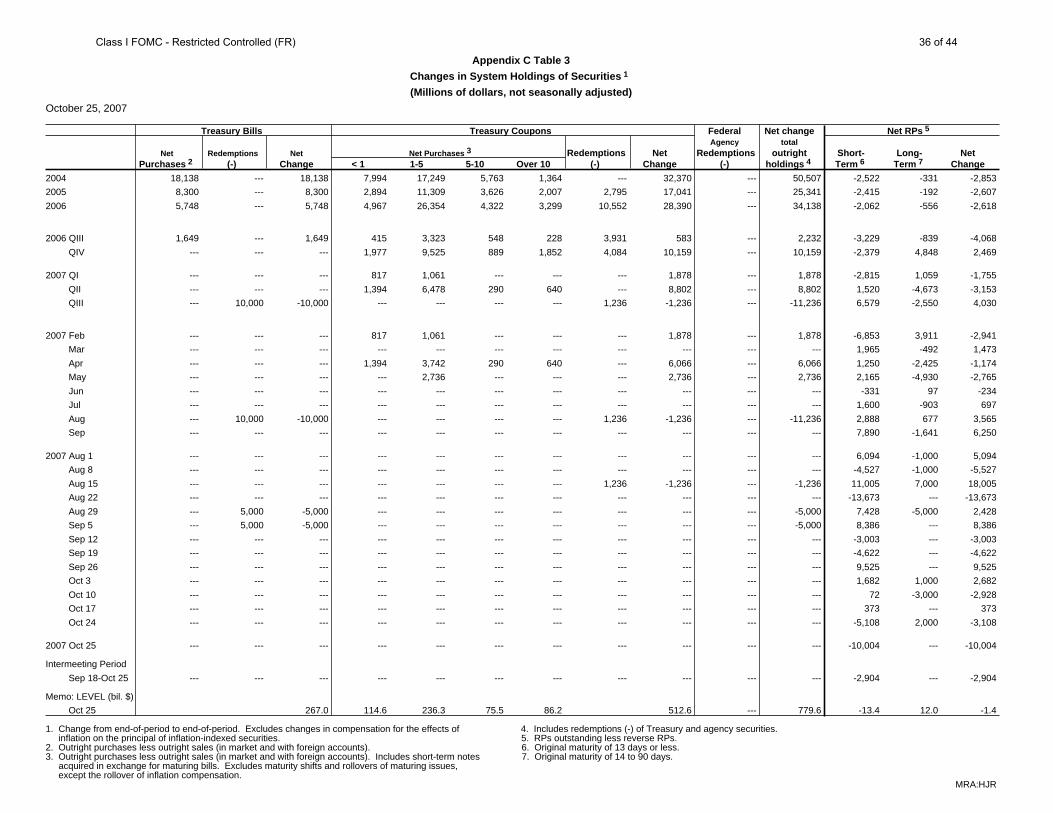
Appendix C Table 3
Changes in System Holdings of Securities 1
(Millions of dollars, not seasonally adjusted)
October 25, 2007
Treasury Bills Treasury Coupons Federal Net change Net RPs 5
Agency totalNet Redemptions Net Net Purchases 3 Redemptions Net Redemptions outright Short- Long- Net
Purchases 2 (-) Change < 1 1-5 5-10 Over 10 (-) Change (-) holdings 4 Term 6 Term 7 Change
2004 18,138 --- 18,138 7,994 17,249 5,763 1,364 --- 32,370 --- 50,507 -2,522 -331 -2,853
2005 8,300 --- 8,300 2,894 11,309 3,626 2,007 2,795 17,041 --- 25,341 -2,415 -192 -2,607
2006 5,748 --- 5,748 4,967 26,354 4,322 3,299 10,552 28,390 --- 34,138 -2,062 -556 -2,618
2006 QIII 1,649 --- 1,649 415 3,323 548 228 3,931 583 --- 2,232 -3,229 -839 -4,068
QIV --- --- --- 1,977 9,525 889 1,852 4,084 10,159 --- 10,159 -2,379 4,848 2,469
2007 QI --- --- --- 817 1,061 --- --- --- 1,878 --- 1,878 -2,815 1,059 -1,755
QII --- --- --- 1,394 6,478 290 640 --- 8,802 --- 8,802 1,520 -4,673 -3,153
QIII --- 10,000 -10,000 --- --- --- --- 1,236 -1,236 --- -11,236 6,579 -2,550 4,030
2007 Feb --- --- --- 817 1,061 --- --- --- 1,878 --- 1,878 -6,853 3,911 -2,941
Mar --- --- --- --- --- --- --- --- --- --- --- 1,965 -492 1,473
Apr --- --- --- 1,394 3,742 290 640 --- 6,066 --- 6,066 1,250 -2,425 -1,174
May --- --- --- --- 2,736 --- --- --- 2,736 --- 2,736 2,165 -4,930 -2,765
Jun --- --- --- --- --- --- --- --- --- --- --- -331 97 -234
Jul --- --- --- --- --- --- --- --- --- --- --- 1,600 -903 697
Aug --- 10,000 -10,000 --- --- --- --- 1,236 -1,236 --- -11,236 2,888 677 3,565
Sep --- --- --- --- --- --- --- --- --- --- --- 7,890 -1,641 6,250
2007 Aug 1 --- --- --- --- --- --- --- --- --- --- --- 6,094 -1,000 5,094
Aug 8 --- --- --- --- --- --- --- --- --- --- --- -4,527 -1,000 -5,527
Aug 15 --- --- --- --- --- --- --- 1,236 -1,236 --- -1,236 11,005 7,000 18,005
Aug 22 --- --- --- --- --- --- --- --- --- --- --- -13,673 --- -13,673
Aug 29 --- 5,000 -5,000 --- --- --- --- --- --- --- -5,000 7,428 -5,000 2,428
Sep 5 --- 5,000 -5,000 --- --- --- --- --- --- --- -5,000 8,386 --- 8,386
Sep 12 --- --- --- --- --- --- --- --- --- --- --- -3,003 --- -3,003
Sep 19 --- --- --- --- --- --- --- --- --- --- --- -4,622 --- -4,622
Sep 26 --- --- --- --- --- --- --- --- --- --- --- 9,525 --- 9,525
Oct 3 --- --- --- --- --- --- --- --- --- --- --- 1,682 1,000 2,682
Oct 10 --- --- --- --- --- --- --- --- --- --- --- 72 -3,000 -2,928
Oct 17 --- --- --- --- --- --- --- --- --- --- --- 373 --- 373
Oct 24 --- --- --- --- --- --- --- --- --- --- --- -5,108 2,000 -3,108
2007 Oct 25 --- --- --- --- --- --- --- --- --- --- --- -10,004 --- -10,004
Intermeeting Period
Sep 18-Oct 25 --- --- --- --- --- --- --- --- --- --- --- -2,904 --- -2,904
Memo: LEVEL (bil. $)
Oct 25 267.0 114.6 236.3 75.5 86.2 512.6 --- 779.6 -13.4 12.0 -1.4
1. Change from end-of-period to end-of-period. Excludes changes in compensation for the effects of 4. Includes redemptions (-) of Treasury and agency securities. inflation on the principal of inflation-indexed securities. 5. RPs outstanding less reverse RPs.2. Outright purchases less outright sales (in market and with foreign accounts). 6. Original maturity of 13 days or less.3. Outright purchases less outright sales (in market and with foreign accounts). Includes short-term notes 7. Original maturity of 14 to 90 days. acquired in exchange for maturing bills. Excludes maturity shifts and rollovers of maturing issues, except the rollover of inflation compensation.
MRA:HJR
Class I FOMC - Restricted Controlled (FR) 36 of 44

Appendix C Chart 1
Treasury Yield Curve
1960 1964 1968 1972 1976 1980 1984 1988 1992 1996 2000 2004
−4
−2
0
2
4Percentage points
+ Denotes most recent weekly value.Note. Blue shaded regions denote NBER−dated recessions.
+
Spread Between Ten−Year Treasury Yield and Federal Funds Rate
Quarterly
1 3 5 7 10 20
3.5
4.0
4.5
5.0
5.5
6.0Percent
October 25, 2007 September 17, 2007
Treasury Yield Curve*
Maturity in Years*Smoothed yield curve estimated from off−the−run Treasury coupon securities. Yields shown are those on notional par Treasury securities with semi−annual coupons.
Class I FOMC - Restricted Controlled (FR) 37 of 44

Appendix C Chart 2
Dollar Exchange Rate Indexes
1973 1976 1979 1982 1985 1988 1991 1994 1997 2000 2003 2006 60
80
100
120
140
160
Ratio scaleMarch 1973=100
+ Denotes most recent weekly value.
+
Nominal
Major Currencies
Monthly
1973 1976 1979 1982 1985 1988 1991 1994 1997 2000 2003 2006
80
90
100
110
120
130
140
Ratio scaleMarch 1973=100
Real
MajorCurrencies
Broad
Other Important
Monthly
Note. The major currencies index is the trade−weighted average of currencies of the euro area, Canada, Japan, the U.K., Switzerland, Australia, and Sweden. The other important trading partners index is the trade−weighted average of currencies of 19 other important trading partners. The Broad index is the trade−weighted average of currencies of all important trading partners. Real indexes have been adjusted for relative changes in U.S. and foreign consumer prices. Blue shaded regions denote NBER−dated recessions. The most recent monthly observations are based on staff forecasts of CPI inflation for those countries where actual data are not yet available.
Class I FOMC - Restricted Controlled (FR) 38 of 44

Appendix C Chart 3
Stock Indexes
0
5
10
15
20
25
30
35
40
45
50Ratio
+
1960 1964 1968 1972 1976 1980 1984 1988 1992 1996 2000 2004
125
250
500
1000
1500
2000
Ratio scale1941−43=10
* Based on trailing four−quarter earnings.+ Denotes most recent weekly value.
+
Nominal
Monthly
P/E Ratio*
S&P 500
1960 1964 1968 1972 1976 1980 1984 1988 1992 1996 2000 2004
20
40
60
80
100
120
140160
Ratio scale1941−43=10
* Deflated by the CPI.+ Denotes most recent weekly value.Note. Blue shaded regions denote NBER−dated recessions.
+
Real
Monthly
S&P 500*
Class I FOMC - Restricted Controlled (FR) 39 of 44

Appendix C Chart 4
One−Year Real Interest Rates
1985 1987 1989 1991 1993 1995 1997 1999 2001 2003 2005 2007−4
0
4
8Percent
* Mean value of respondents.
+
Monthly
One−Year Treasury Constant Maturity Yield Less One−Year Inflation Expectations (Michigan Survey)*
1985 1987 1989 1991 1993 1995 1997 1999 2001 2003 2005 2007−4
0
4
8Percent
* ASA/NBER quarterly survey until 1990:Q1; Philadelphia Federal Reserve Bank Survey of Professional Forecastersthereafter. Median value of respondents.
++
GDP Deflator
CPI
Monthly
One−Year Treasury Constant Maturity Yield Less One−Year Inflation Expectations (Philadelphia Fed)*
1985 1987 1989 1991 1993 1995 1997 1999 2001 2003 2005 2007−4
0
4
8Percent
+ Denotes most recent weekly Treasury constant maturity yield less most recent inflation expectation.Note. Blue shaded regions denote NBER−dated recessions.
+
Monthly
One−Year Treasury Constant Maturity Yield Less Change in the Core CPI from Three Months Prior
Class I FOMC - Restricted Controlled (FR) 40 of 44

Appendix C Chart 5
Long−Term Real Interest Rates*
1985 1987 1989 1991 1993 1995 1997 1999 2001 2003 2005 2007 0
2
4
6
8
10Percent
+++
Monthly
Real Ten−Year Treasury Yields
Real rate usingPhiladelphia Fed Survey
Real rate usingMichigan Survey
Ten−year TIPS yield
1985 1987 1989 1991 1993 1995 1997 1999 2001 2003 2005 2007
2
4
6
8
10
12
14Percent
+
++
Nominal and Real Corporate Bond Rates
Monthly
Nominal rate on Moody’sA−rated corporate bonds
Real rate usingPhiladelphia Fed Survey
Real rate usingMichigan Survey
* For real rates, measures using the Philadelphia Fed Survey employ the ten−year inflation expectations from the Blue Chip Survey until April 1991 and the Philadelphia Federal Reserve Bank Survey of Professional Forecasters thereafter (median value of respondents). Measures using the Michigan Survey employ the five− to ten−year inflation expectations from that survey (mean value of respondents).
+ For TIPS and nominal corporate rate, denotes the most recent weekly value. For other real rate series, denotes the most recent weekly nominal yield less the most recent inflation expectation. Note. Blue shaded regions denote NBER−dated recessions.
Class I FOMC - Restricted Controlled (FR) 41 of 44

Appendix C Chart 6
Commodity Price Measures
1985 1987 1989 1991 1993 1995 1997 1999 2001 2003 2005 2007
100
150
200
250Ratio scale, index (1980=100)
Journal of Commerce Index
Weekly
TotalMetals
1985 1987 1989 1991 1993 1995 1997 1999 2001 2003 2005 2007
250
300
350
400
450
500
550Ratio scale, index (1967=100)
CRB Spot Industrials
Weekly
1985 1987 1989 1991 1993 1995 1997 1999 2001 2003 2005 2007
200
250
300
350
400
450
500Ratio scale, index (1967=100)
Note. Blue shaded regions denote NBER−dated recessions.
CRB Futures
Weekly
Class I FOMC - Restricted Controlled (FR) 42 of 44

Appendix C Chart 7
Growth of M2
1960 1964 1968 1972 1976 1980 1984 1988 1992 1996 2000 2004 2008 0
2
4
6
8
10
12
14Percent
1960 1964 1968 1972 1976 1980 1984 1988 1992 1996 2000 2004 2008 0
2
4
6
8
10
12
14Percent
Nominal M2
Quarterly
1960 1964 1968 1972 1976 1980 1984 1988 1992 1996 2000 2004 2008
−5
0
5
10Percent
1960 1964 1968 1972 1976 1980 1984 1988 1992 1996 2000 2004 2008
−5
0
5
10Percent
Real M2
Quarterly
Note. Four−quarter moving average. Blue shaded regions denote NBER−dated recessions. Gray areas denote projection period. Real M2 is deflated by CPI.
Class I FOMC - Restricted Controlled (FR) 43 of 44

Appendix C Chart 8
Inflation Indicator Based on M2
Note: P* is defined to equal M2 times V* divided by potential GDP. V*, or long-run velocity, is estimatedusing average velocity over the 1959:Q1-to-1989:Q4 period and then, after a break, over the interval from1993:Q1 to the present. For the forecast period, P* is based on the staff M2 forecast and P is simulated using ashort-run dynamic model relating P to P*. Blue areas indicate periods in which P* is notably less than P.Gray areas denote the projection period.
1965 1968 1971 1974 1977 1980 1983 1986 1989 1992 1995 1998 2001 2004 2007
40
60
80
100
120
140
160Ratio scalePrice Level
Quarterly
Implicit GDPprice deflator (P) Long-run equilibrium
price level (P*)
1965 1968 1971 1974 1977 1980 1983 1986 1989 1992 1995 1998 2001 2004 2007
40
60
80
100
120
140
160Ratio scale
1965 1968 1971 1974 1977 1980 1983 1986 1989 1992 1995 1998 2001 2004 2007
2
4
6
8
10
12PercentInflation 1
Quarterly
1965 1968 1971 1974 1977 1980 1983 1986 1989 1992 1995 1998 2001 2004 2007
2
4
6
8
10
12Percent
1. Change in the implicit GDP price deflator over the previous four quarters.
Class I FOMC - Restricted Controlled (FR) 44 of 44