Fomc 19921222 g Bpt 219921216
111
Prefatory Note The attached document represents the most complete and accurate version available based on original copies culled from the files of the FOMC Secretariat at the Board of Governors of the Federal Reserve System. This electronic document was created through a comprehensive digitization process which included identifying the best- preserved paper copies, scanning those copies, 1 and then making the scanned versions text-searchable. 2 Though a stringent quality assurance process was employed, some imperfections may remain. Please note that this document may contain occasional gaps in the text. These gaps are the result of a redaction process that removed information obtained on a confidential basis. All redacted passages are exempt from disclosure under applicable provisions of the Freedom of Information Act. 1 In some cases, original copies needed to be photocopied before being scanned into electronic format. All scanned images were deskewed (to remove the effects of printer- and scanner-introduced tilting) and lightly cleaned (to remove dark spots caused by staple holes, hole punches, and other blemishes caused after initial printing). 2 A two-step process was used. An advanced optimal character recognition computer program (OCR) first created electronic text from the document image. Where the OCR results were inconclusive, staff checked and corrected the text as necessary. Please note that the numbers and text in charts and tables were not reliably recognized by the OCR process and were not checked or corrected by staff.
-
Upload
fraser-federal-reserve-archive -
Category
Documents
-
view
217 -
download
1
Transcript of Fomc 19921222 g Bpt 219921216

Prefatory Note
The attached document represents the most complete and accurate version available based on original copies culled from the files of the FOMC Secretariat at the Board of Governors of the Federal Reserve System. This electronic document was created through a comprehensive digitization process which included identifying the best-preserved paper copies, scanning those copies,1 and then making the scanned versions text-searchable.2 Though a stringent quality assurance process was employed, some imperfections may remain.
Please note that this document may contain occasional gaps in the text. These gaps are the result of a redaction process that removed information obtained on a confidential basis. All redacted passages are exempt from disclosure under applicable provisions of the Freedom of Information Act.
1 In some cases, original copies needed to be photocopied before being scanned into electronic format. All scanned images were deskewed (to remove the effects of printer- and scanner-introduced tilting) and lightly cleaned (to remove dark spots caused by staple holes, hole punches, and other blemishes caused after initial printing). 2 A two-step process was used. An advanced optimal character recognition computer program (OCR) first created electronic text from the document image. Where the OCR results were inconclusive, staff checked and corrected the text as necessary. Please note that the numbers and text in charts and tables were not reliably recognized by the OCR process and were not checked or corrected by staff.

Confidential (FR) Class III FOMC
December 16, 1992
RECENT DEVELOPMENTS
Prepared for the Federal Open Market Committee
By the staff of the Board of Governors of the Federal Reserve System

CONTENTS
II DOMESTIC NONFINANCIAL DEVELOPMENTSGross domestic product . ........................ ..... ... ... ........Labor markets .................... .......... ....... ........ ..... 3Industrial production and capacity utilization.................... 9Personal consumption and income ...... .... ........................... 11Business fixed investment .......................... . .. ..... 17Housing markets .................................. .... . 25Business inventories ..................... .. ..... ............ ... 29Federal sector.................. ... ....... ............. ............. 31State and local government sector................ ......... . ....... .. 33Prices .... ...... . ................................................ 35
TablesReal gross domestic product and related items ..................... 2Changes in employment.......... ........ ...... ......... ... ..... .... 4Unemployment and labor force participation rates .................... 4Average hourly earnings ....... ................................... 8Growth in selected components of industrial production............ 10Capacity utilization .............................................. 10Production of domestic autos and trucks........... .................. 11Retail sales.......................................... ... ........... 12Sales of automobiles and light trucks ................ ............. 14Personal income .............................. ....... ...................... 16Real personal consumption expenditures .. .......................... 16Business capital spending indicators............................... 18Private housing activity........................................... 24Prices of commercial buildings..................................... 25Changes in manufacturing and trade inventories.................... 28Inventories relative to sales.. ......................... ............ 28Federal government outlays and receipts............................ 32Recent changes in producer prices ....... ........................ . 36Recent changes in consumer prices .......... ............. ........... 36Inflation rates excluding food and energy ........................ 38Expected change in prices during the next twelve months........... 39Price indexes for commodities and materials ...... ............... 40Monthly average prices--West Texas intermediate ................. 44
ChartsLabor market indicators .......................................... 5Indicators from the survey of households............................ 6Average hourly earnings .................................. ........ . 8Consumer sentiment ............................ ..................... 15Recent data on orders and shipments ............................... 20Nonresidential construction and selected indicators .............. 22Private housing starts ............. . ........ ................... 24Market for new homes .................... ...... .... ............ 26Ratio of inventories to sales ..................................... 30Inflation expectations ................................... ........ 39Index weights................. ..................................... 40Commodity price measures .... .................. ................... 42Daily spot and posted prices of West Texas intermediate........... 44
III DOMESTIC FINANCIAL DEVELOPMENTSMonetary aggregates and bank credit................................. 3Corporate securities markets . .................................... 8Treasury and sponsored agency financing........................... 11Municipal securities.... .. ....... .................................. 13Mortgage markets ................................... ..... ........... 15Consumer credit . ......... .................... .................... 17Appendix: Growth of money and credit in 1992 .................... A-1

TablesMonetary aggregates .............. ....... ... ...... ...... .... 2Commercial bank credit and short- and intermediate-term
business credit............................. .. .. .. .......... 4Distribution of bank loans by capital status of the bank.......... 7Median change in growth rates at large commercial banks............Gross offerings of securities by U.S. corporations............... 9Treasury and agency financing...................... .. ... ........ 12Gross offerings of municipal securities.. . ........... .............. 14Mortgage-backed security issuance......... ........... ............ 16Consumer credit......... ................... ............. .. ...... 19Consumer interest rates......... ......... ... ... ........ . . ..... 20
ChartsDelinquency and charge-off rates at large banks ................... 6ARM share vs. ARM-FRM initial rate spread.......................... 16Total consumer installment credit outstanding ................... 18
IV INTERNATIONAL DEVELOPMENTSMerchandise trade...... ................. ............... .. ...... ..1Oil imports .......................... . ............. ....... . . .. . 4Prices of non-oil imports and exports............................... 4U.S. current account ............................................... 6U.S. international financial transactions......................... 7Foreign exchange markets...................... ................... 11Developments in foreign industrial countries..................... 15Economic situation in other countries ............................ . 28
TablesU.S. merchandise trade: Monthly data........... .................... 1Major trade categories....... ..................................... 2Oil imports.................. ....................................... 4Import and export price measures................................... 5U .S . current account ............................................. 6Summary of U.S. international transactions.......................... 8International banking data............ ................... ........ 10Major industrial countries
Real GDP and industrial production............................... 16Consumer and wholesale prices.................................... 17Trade and current account balances .............................. 18
Japanese economic indicators ..................................... 19Western German economic indicators ............................... 21
ChartsWeighted average exchange value of the dollar..................... 12Selected dollar exchange rates......................................... 12

DOMESTIC NONFINANCIALDEVELOPMENTS
DOMESTIC NONFINANCIAL DEVELOPMENTS
Economic activity appears to be maintaining a relatively brisk
rate of expansion in the current quarter. Private payroll
employment has been rising since September, albeit slowly, and
industrial production posted healthy increases in October and
November. On the demand side, consumer spending evidently is
growing at a rapid clip, buttressed by an apparent upturn in wage
income and sharply improved confidence. Further gains also have
been posted in single-family home sales and starts. Indicators of
business investment have been mixed of late, with the possibility
that spending on equipment is being temporarily damped by tax
uncertainties and anticipations of new product introductions. The
recent news on prices and wages has been a bit less favorable, on
balance, than the reports of a few months ago, but, given the slack
remaining in the economy, it seems unlikely that the underlying
disinflationary trend has run its course.
Gross Domestic Product
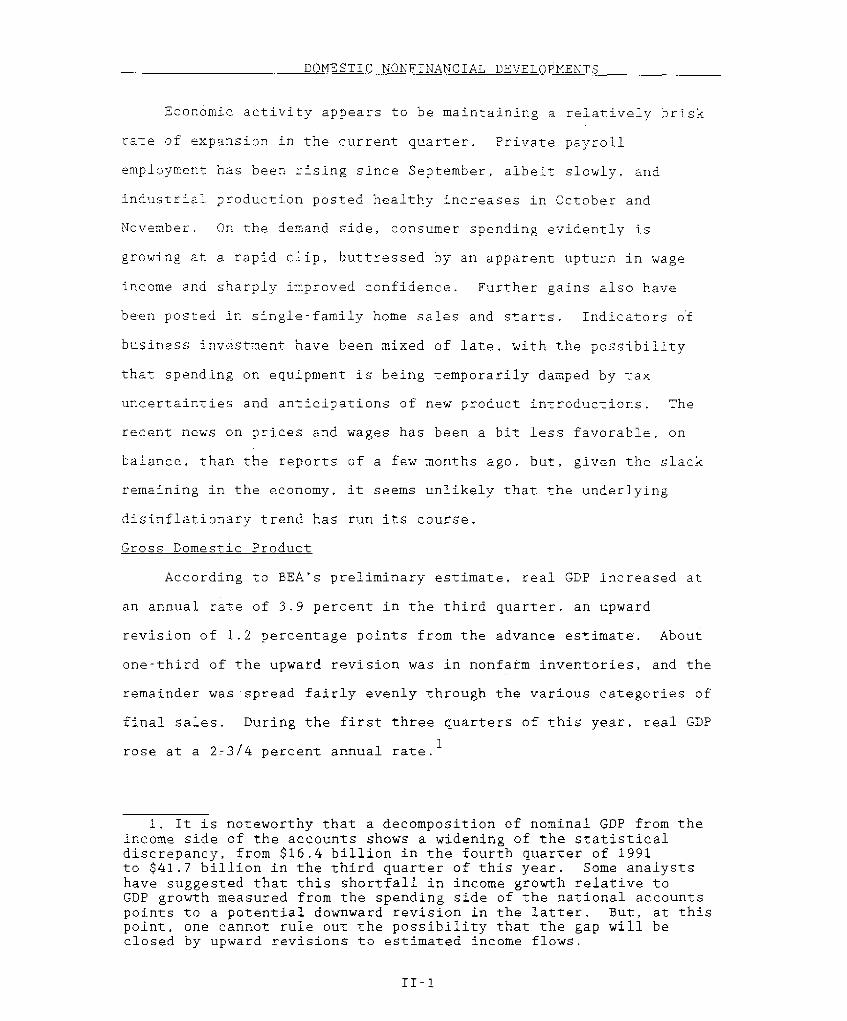
According to BEA's preliminary estimate, real GDP increased at
an annual rate of 3.9 percent in the third quarter, an upward
revision of 1.2 percentage points from the advance estimate. About
one-third of the upward revision was in nonfarm inventories, and the
remainder was spread fairly evenly through the various categories of
final sales. During the first three quarters of this year, real GDP
rose at a 2-3/4 percent annual rate.
1. It is noteworthy that a decomposition of nominal GDP from theincome side of the accounts shows a widening of the statisticaldiscrepancy, from $16.4 billion in the fourth quarter of 1991to $41.7 billion in the third quarter of this year. Some analystshave suggested that this shortfall in income growth relative toGDP growth measured from the spending side of the national accountspoints to a potential downward revision in the latter. But, at thispoint, one cannot rule out the possibility that the gap will beclosed by upward revisions to estimated income flows.
II-1
II-2
REAL GROSS DOMESTIC PRODUCT AND RELATED ITEMS(Percent change from previous period at compound annual rates;
based on seasonally adjusted data, measured in 1987 dollars)
1990-Q4 to 1992-Q2 1992-Q3 1992-Q31991-Q4 Final Advance Preliminary
1. Gross domestic product .1 1.5 2.7 3.9
2. Final sales -. 6 -. 1 2.1 2.9
3. Consumer spending .0 -. 1 3.4 3.7
4. Business fixed investment -7.0 16.1 .3 1.95. Producers' durable equipment -3.5 24.1 8.5 9.26. Nonresidential structures -14.3 -. 8 -17.7 -14.4
7. Residential investment -. 1 12.6 .4 .8
8. Government purchases -. 6 -1.2 2.0 3.3
9. Exports of goods and services 7.4 -1.4 1.9 9.4
10. Imports of goods and services 4.8 14.7 6.9 12.8
ADDENDA:11. Nonfarm inventory investment1 -9.6 2 6.0 9.8 14.812. Retail autos 1 -1.3 2 5.5 2.4 1.613. Excluding retail autos 1 -8.3 2 .5 7.4 13.2
14. Farm inventory investment 1 .3 2 1.8 5.0 5.3
15. Net exports of goods and services 1 -21.8 2 -43.9 -51.5 -49.8
16. Nominal GDP 3.5 4.3 4.5 5.6
17. GDP fixed-weight price index 3.5 2.9 2.1 2.2
18. GDP implicit price deflator 3.4 2.8 1.8 1.7
19. Corporate profits 3 346.3 2 388.4 n.a. 370.4
20. Profit share (percent) 4 6.1 2 6.6 n.a. 6.2
21. Personal saving rate (percent) 4.7 2 5.3 4.5 4.5
1. Level, billions of 1987 dollars.2. Annual average.3. With inventory valuation and capital consumption adjustments; level, billions of dollars.4. Economic profit as a share of nominal GNP.

II-3
Labor Markets
Recent data indicate some strengthening of labor demand. In
November, private payrolls expanded slightly for the third
consecutive month; however, the average workweek also increased
further in November, and hours for private production and
nonsupervisory workers rose 3/4 percent, matching the October gain.
On average, aggregate hours in October and November were about
2-3/4 percent at an annual rate above the third-quarter level.
Meanwhile, the civilian unemployment rate fell for a fifth
consecutive month in November to 7.2 percent, 0.6 percentage point
less than its most recent peak of last June. In addition, since the
time of the November labor market surveys, initial claims for
unemployment insurance benefits have declined further. 2
Total nonfarm payroll employment expanded 105,000 in November.
Government employment was up 60,000 last month, but about three-
fourths of this increase reflected temporary hiring to staff polling
places during the general election. Manufacturing employment rose
35,000 in November after three months of sizable declines. In the
service-producing sector, 64,000 jobs were added, with gains in
health, business, and a range of other services. Construction
employment fell back a bit last month; it has changed little, on
net, for the year to date. after dropping by a total of about
600,000 workers in 1990 and 1991. In the retail sector, employment
was off 46,000 last month, because of less-than-usual seasonal
hiring at general merchandise stores. 3
2. Much of the especially sharp decline in initial claims for theweek ended November 28 likely was due to seasonal adjustmentproblems associated with the Thanksgiving holiday.
3. On a not seasonally adjusted basis, retail employment was up240,000 last month, but the seasonal factors were looking for anincrease of 286,000; as a result, seasonally adjusted employmentshowed a decline. The seasonal factors expect a 280,000 increase inthe number of retail jobs in December.

II-4
CHANGES IN EMPLOYMENT1(Thousands of employees; based on seasonally adjusted data)
1992 19921991 Q1 Q2 Q3 Sep. Oct. Nov.
----------- Average monthly changes -----------
Nonfarm payroll employment2 -79 15 74 25 12 34 105
Private -91 -4 64 -13 44 66 45Manufacturing -36 -17 -14 -45 -43 -65 35
Durable -33 -16 -15 -33 -27 -45 20Defense-related -8 -9 -12 -13 -10 -18 -8
Nondurable -3 -1 1 -11 -16 -20 15Construction -26 4 -1 -9 -17 24 -11Retail trade -35 -7 21 -11 16 16 -46Finance, insurance, real estate -3 2 -1 -1 8 11 -4Services 30 28 70 70 84 77 64Health services 29 16 20 20 18 29 22Business services 3 11 39 10 3 77 21
Total government 12 19 10 37 -32 -32 60
Private nonfarm production workers -76 18 89 -16 44 106 10Manufacturing production workers -23 1 -9 -36 -37 -43 40
Total employment4 -62 207 75 42 -36 -76 420Nonagricultural -54 203 56 46 -60 6 369
Memo:Aggregate hours of private production
workers (percent change) -.1 .1 .0 -.1 -1.0 .7 .7Average workweek (hours) 34.3 34.5 34.4 34.4 34.3 34.5 34.7
Manufacturing (hours) 40.7 41.0 41.1 41.0 40.9 41.1 41.3
1. Average change from final month of preceding period to final month of periodindicated.
2. Survey of establishments.3. Industries which are dependent on defense expenditures for at least 50 percent
of their output.4. Survey of households.
UNEMPLOYMENT AND LABOR FORCE PARTICIPATION RATES(Percent: seasonally adjusted)
1992 19921990 1991 Q1 Q2 Q3 Sep. Oct. Nov.
Civilian unemployment rate(16 years and older) 5.5 6.7 7.2 7.5 7.6 7.5 7.4 7.2
Teenagers 15.5 18.7 19.6 21.0 20.4 20.4 18.3 20.220-24 years old 8.8 10.8 11.1 11.3 11.6 11.6 10.9 11.1Men, 25 years and older 4.4 5.7 6.3 6.5 6.6 6.6 6.6 6.1Women, 25 years and older 4.3 5.1 5.6 5.8 5.8 5.7 5.6 5.7
Labor force participation rate 66.4 66.0 66.2 66.5 66.4 66.3 66.1 66.2

II-5
LABOR MARKET INDICATORS
Aggregate Hours, Private Nonfarmlevel, 1982 = 100
Aggregate Hours, Manufacturing 19 00level, 1982= 100
1989 1990 1991 1992 1989 1990 1991 1992
Manpower Inc. Net Hiring StrengthPercentage points
1989 1990 1991 1992
initial Claims for Unemployment Insurance (BLS Seasonals)
All Regular Programs(Including EUC Adjustments)
Thousands
\ :Nov 28349.8
I I1992
600
550
500
450
400
350
300
250
2001989 1990 1991
1. Percent of firms planning to increase employment minus those planning decreases, seasonally adjusted.
I IIrrii Iirriiilri
II-6
INDICATORS FROM THE SURVEY OF HOUSEHOLDS
MillionsUnemployment
Nov
I I Ii i I ii i Ii Ii i1990 1992
Nov- 9
-1 7
I I I ii llli II i1990 1992
Job Losers 1
1979 1981 1983 1985 1987 1989 1991
Long-term Unemployment
1979 1981 1983 1985
1 :As a share of civilian labor force.
2. Unemployed 27 weeks or more as a share of the civilian labor force.
1 019931987 1989 1991
Labor ForceMillions
PercentS10
9
8
7
6
5
4Nov
3
2
I o
19931993
Percent
"""""""'
II-7
In November, the average workweek in the private nonfarm sector
posted its second consecutive monthly gain of 0.2 hour; at
34.7 hours, its level is the highest since late 1989. In
manufacturing, the workweek climbed to a 26-year high of 41.3 hours;
under the circumstances, it seems likely that future increases in
manufacturing production worker hours will be achieved largely by an
expansion in payrolls.
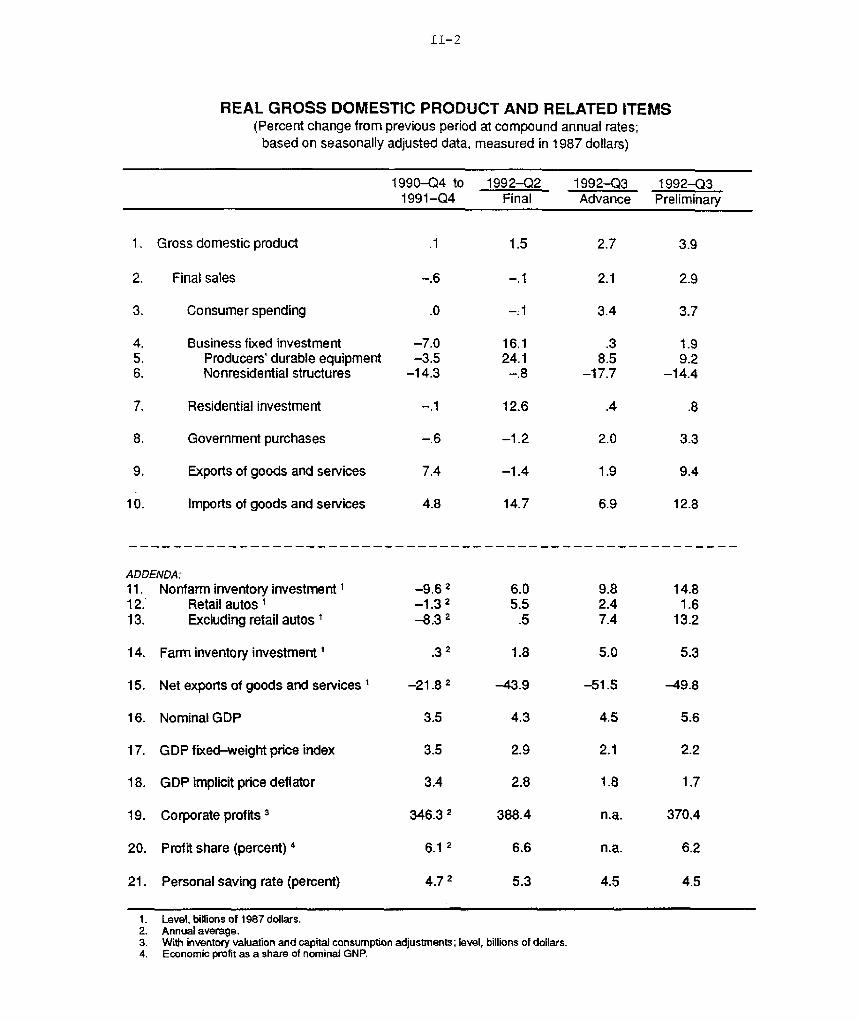
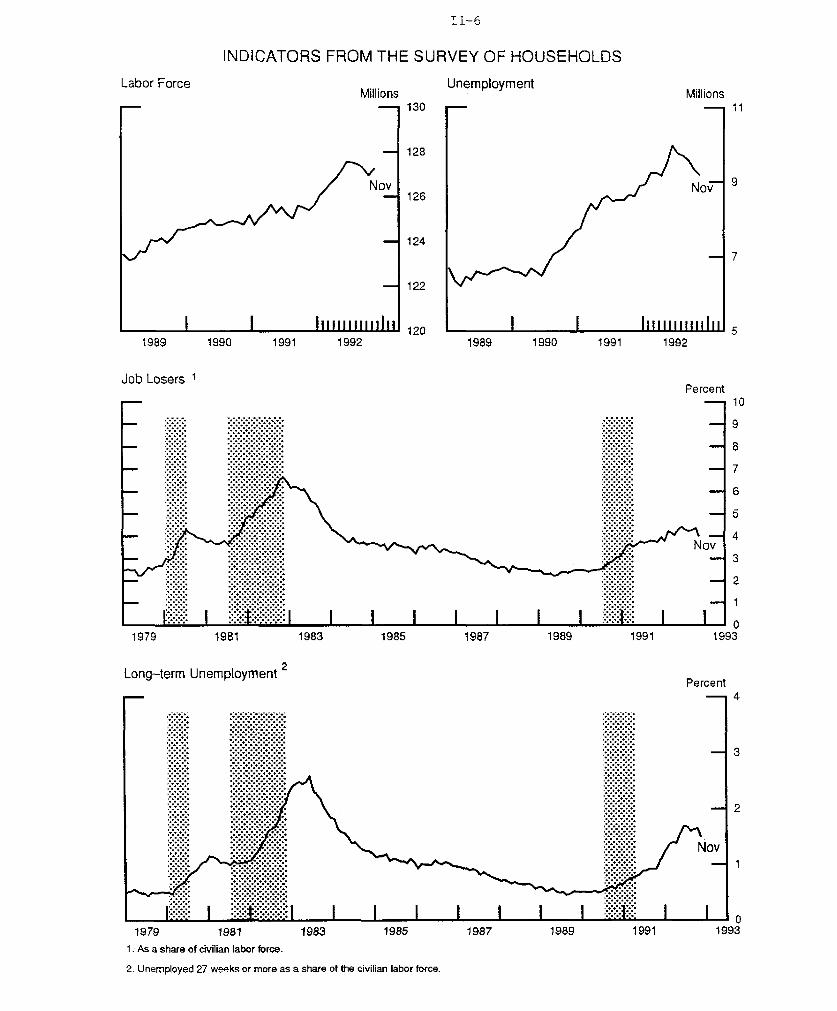
Data from the household survey for November also suggest an
improvement in labor demand. The declines in the unemployment rate
from July through September resulted from jobless workers exiting
the labor force rather than strength in hiring. However, last month
this pattern changed noticeably: Both employment and the labor
force expanded, but household employment was up much more than the
labor force; as a result, the unemployment rate declined
1/4 percentage point. Other encouraging data from the November
household survey included a decline in the number of job losers
(particularly those on permanent layoff) and a small drop in long-
term unemployment (those unemployed twenty-seven weeks or longer).
Looking ahead, the latest Manpower Inc. survey of hiring plans
for the first quarter of 1993 was mildly favorable. The survey,
which was conducted in late October and early November, showed that
firms plan modest employment growth in services, trade, and finance,
insurance, and real estate early next year. In addition, the survey
indicates that first-quarter job gains are likely in construction
and in manufacturing. Through October, however, the Conference
Board survey of help-wanted advertising showed only slight
improvement, remaining near its cyclical low.
Turning to recent data on wages, average hourly earnings of
private production or nonsupervisory workers rose 0.6 percent in
November, after a 0.2 percent increase in October. The largest gain
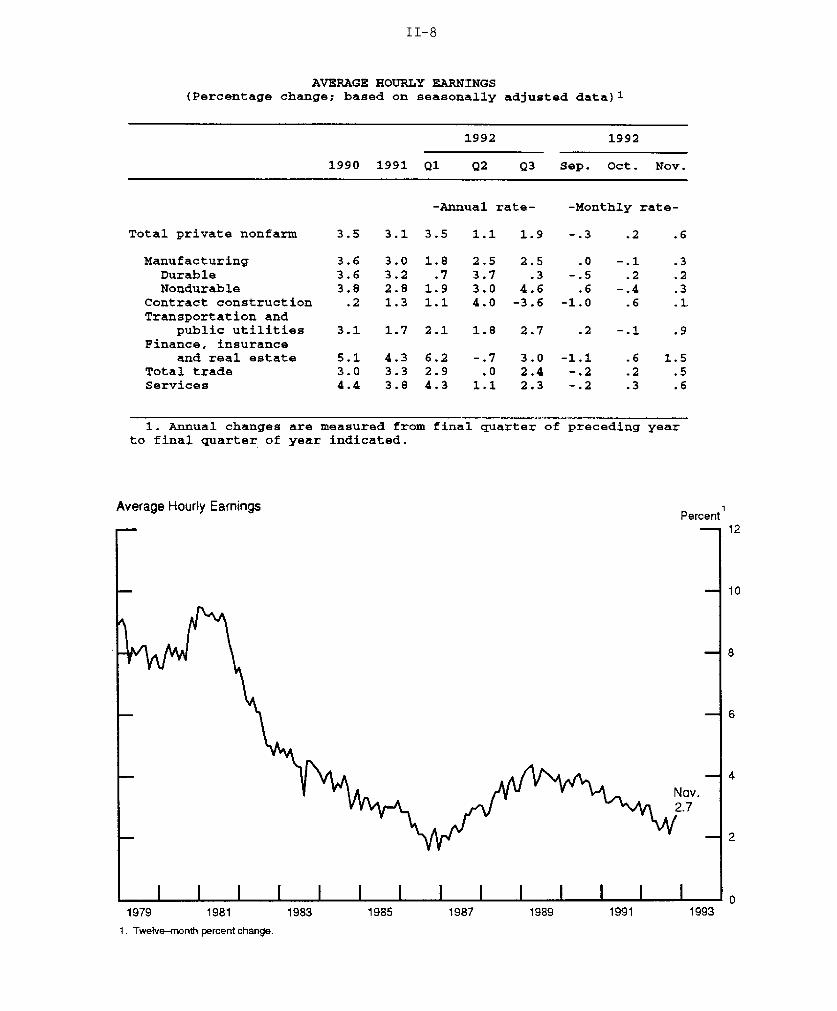
II-8
AVERAGE HOURLY EARNINGS(Percentage change; based on seasonally adjusted data) 1
1992 1992
1990 1991 Q1 Q2 Q3 Sep. Oct. Nov.
-Annual rate- -Monthly rate-
Total private nonfarm 3.5 3.1 3.5 1.1 1.9 -.3 .2 .6
Manufacturing 3.6 3.0 1.8 2.5 2.5 .0 -.1 .3Durable 3.6 3.2 .7 3.7 .3 -.5 .2 .2Nondurable 3.8 2.8 1.9 3.0 4.6 .6 -.4 .3
Contract construction .2 1.3 1.1 4.0 -3.6 -1.0 .6 .1Transportation and
public utilities 3.1 1.7 2.1 1.8 2.7 .2 -.1 .9Finance, insurance
and real estate 5.1 4.3 6.2 -.7 3.0 -1.1 .6 1.5Total trade 3.0 3.3 2.9 .0 2.4 -.2 .2 .5Services 4.4 3.8 4.3 1.1 2.3 -.2 .3 .6
1. Annual changes are measured from final quarter of preceding yearto final quarter of year indicated.
Average Hourly EarningsPercent
1979 1981 1983 1985 1987 1989 1991 1993
1. Twelve-month percent change.

II-9
was in finance, insurance, and real estate, where wages jumped
1-1/2 percent, but several other sectors reported sizable increases.
Nevertheless, over the twelve months ended in November, hourly
earnings were up only 2.7 percent, slightly less than the increase
during the previous twelve-month period.
Industrial Production and Capacity Utilization
Industrial production advanced 0.4 percent in November, after
an upward-revised gain of 0.5 percent in October. Increases were
widespread in November within the manufacturing and mining
industries, while output at utilities dropped.
Motor vehicle assemblies were about unchanged in November, but
an increase appears to be in train this month; weekly data suggest
that the step-up in auto assemblies planned by manufacturers is
under way, while truck assemblies appear to be holding at about the
November level, a little short of the scheduled rate. Current
schedules for the opening months of 1993 point to a sizable
increase, but there has been a clear tendency over the past several
years for initial announcements for the first quarter to be pared
back considerably.
Outside of motor vehicles, output of consumer goods showed
small increases in October and November. The gains were
concentrated in nondurables, although, among durables, furniture
production increased sharply. The output of business equipment rose
another 1/2 percent last month; within that category, production of
information processing equipment increased nearly 1 percent, as
output of computers continued to climb. Industrial equipment also
posted a healthy gain in November; elsewhere, output of equipment

II-10
GROWTH IN SELECTED COMPONENTS OF INDUSTRIAL PRODUCTION(Percent change from preceding comparable period)
Proportion 1992 1992in
totalIP
1991:Q4 Q1 Q2 Q3 Sep. Oct. Nov.
----- Annual Rate------ ----- Monthly Rate-----
Total index 100.0 -2.9 5.2 2.1 -.3 .5 .4Previous -2.9 5.2 1.9 -.2 .3
Motor vehicles and parts 4.2 -20.0 44.4 -9.3 -2.3 4.3 .7
EXCLUDING MOTOR VEHICLESAND PARTS:
Total index 95.8 -2.1 3.8 2.7 -.2 .3 .4Products, total 57.1 -1.4 2.0 2.0 -.3 .4 .3
Final products 42.9 -2.1 2.6 2.3 -.3 .4 .3Consumer goods 25.0 -1.2 2.5 2.4 -.3 .3 .2
Durables 3.7 3.1 9.1 .8 -2.2 -.5 .0Nondurables 20.9 -2.1 1.4 2.7 .1 .4 .3
Excluding energy 18.2 -.7 1.4 3.3 .1 .3 .3
Business equipment 14.6 -1.7 7.6 5.7 -.3 .7 .5Information processing 6.9 5.8 13.3 11.3 -.1 1.7 .9Industrial 3.9 -12.1 6.3 .0 -.7 .3 .7Other 3.8 -3.5 -.8 1.5 -.2 -.8 -.7
Defense and space equip. 4.4 -10.9 -9.1 -10.6 -.9 -.7 -.9
Intermediate products 14.2 .8 .4 1.1 -.4 .5 .2Construction supplies 5.3 2.7 4.7 3.3 -1.8 1.1 .6
Materials 38.7 -3.2 6.4 3.7 -. 1 .1 .5Durables 18.2 -1.7 6.5 3.8 -. 8 .8 .4Nondurables 9.0 -1.4 8.0 3.7 .2 -.3 1.6Energy 10.2 -6.0 2.8 3.8 1.3 -.8 -.2
Memo:Manufacturing excluding
motor vehicles and parts 80.8 -1.1 3.9 2.6 -.3 .4 .4Mining 7.3 -7.1 4.3 2.0 .0 .1 .6Utilities 7.7 -8.5 1.5 6.3 .3 -.5 -.6
1. From the final quarter of the previous period to the final quarter of the periodindicated.
CAPACITY UTILIZATION(Percent of capacity; seasonally adjusted)
1967-91 1992 1992
Avg. Q1 Q2 Q3 Sep. Oct. Nov.
Total industry 82.1 78.2 78.8 78.8 78.5 78.7 78.9
Manufacturing 81.4 77.3 77.9 77.8 77.4 77.7 77.9
Primary processing 82.3 80.5 81.3 81.9 81.3 81.6 82.4Advanced processing 81.0 76.0 76.5 76.2 75.9 76.2 76.2

II-11
was held down by a further decline in commercial aircraft
production.
Output of construction supplies grew noticeably in October and
November, retracing part of the losses that occurred in late summer.
These increases partly reflected gains in output of lumber and are
broadly consistent with the recent firming in homebuilding activity.
Production of industrial materials also grew in November, as output
of paper, textiles, and chemicals posted notable gains.
PRODUCTION OF DOMESTIC AUTOS AND TRUCKS(Millions of units at an annual rate; FRB seasonal basis)
1992 1993 1992
Q2 Q3 Q4 Q1 1 Oct. Nov. Dec. 1
Domestic production 10.0 9.5 10.2 11.1 9.9 10.1 10.7Autos 6.1 5.6 5.7 6.3 5.5 5.6 6.0Trucks 3.9 3.9 4.5 4.8 4.4 4.5 4.7
1. Figures beyond November are based on current manufacturers'schedules.
Personal Consumption and Income
Incoming data on retail sales point to a further strong advance
in consumer spending in the current quarter, and consumer
confidence, which was stuck in the doldrums last summer and early
fall, has risen impressively of late.
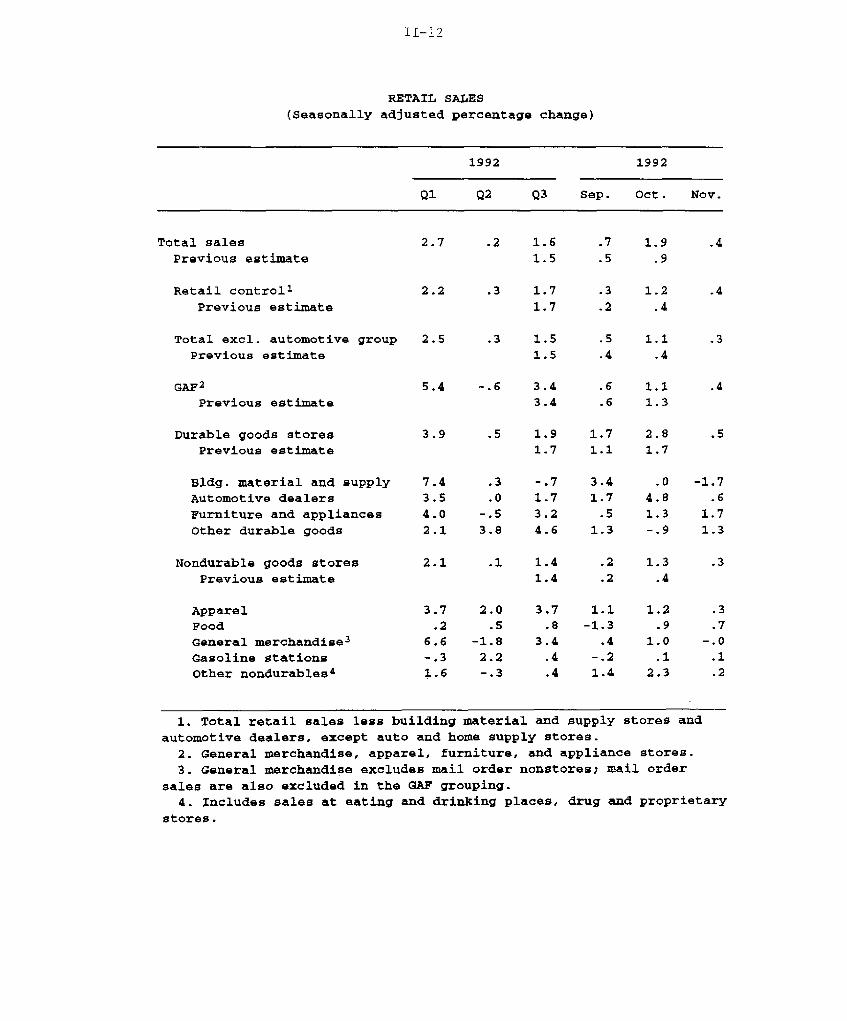
Total retail sales posted a modest increase in November after a
substantial upward revision to growth in October. November spending
in the retail control category, which excludes auto sales and sales
at building material and supply stores, advanced 0.4 percent last
month, and the October gain was revised up 0.8 percentage point, to
4. Production cutbacks at Boeing are expected to continuethroughout 1993 in response to weak new orders, cancellations, andcustomer requests for delayed deliveries.
II-12
RETAIL SALES
(Seasonally adjusted percentage change)
1992 1992
Q1 Q2 Q3 Sep. Oct. Nov.
Total salesPrevious estimate
Retail control 1
Previous estimate
Total excl. automotive groupPrevious estimate
GAF2
Previous estimate
Durable goods storesPrevious estimate
Bldg. material and supplyAutomotive dealersFurniture and appliancesOther durable goods
Nondurable goods storesPrevious estimate
ApparelFoodGeneral merchandise 3
Gasoline stationsOther nondurables 4
.2 1.61.5
.3 1.71.7
.3 1.51.5
5.4 -. 6 3.43.4
3.9
7.43.54.0
2.1
2.1
.5 1.9 1.7 2.81.7 1.1 1.7
.3
.0-. 5
3.8
-. 71.73.24.6
.1 1.41.4
2.0.5
-1.82.2-.3
1.1-1.3
.4-. 2
1.4
1. Total retail sales less building material and supply stores and
automotive dealers, except auto and home supply stores.2. General merchandise, apparel, furniture, and appliance stores.3. General merchandise excludes mail order nonstores; mail order
sales are also excluded in the GAF grouping.4. Includes sales at eating and drinking places, drug and proprietary
stores.
1.2
.4
1.1.4
1.11.3
.5
-1.7.6
1.71.3
1.2.9
1.0.1
2.3

1.2 percent.5 The average level of nominal sales in the control
category in October and November was up substantially
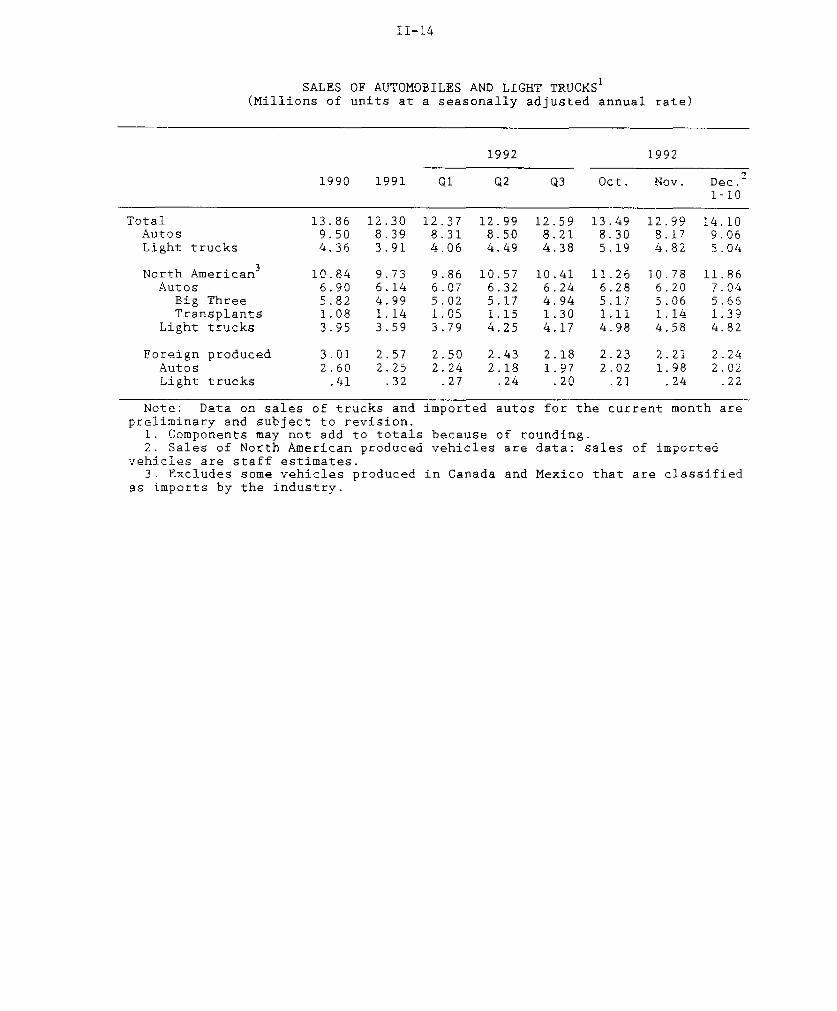
(1-3/4 percent) from the third-quarter average. Sales of light
vehicles also rose considerably in October and November, compared
with their average selling pace during the third quarter, and a
further gain was reported in the first ten days of December.
Increases in the sales of light trucks accounted for the gains of
October and November, but the very recent data show stronger numbers
for cars as well. All told, the data in hand indicate that consumer
outlays for goods, which registered a sizable gain last quarter,
have remained on a solid upward trajectory.
According to both the Michigan and the Conference Board
surveys, consumer sentiment (chart) has rebounded since October.
Comparison of the preliminary and final releases of the Michigan
survey for November indicates that sentiment was higher in the
latter half of the month than in the first half, and the preliminary
reading for December showed a further increase. This pattern
invites the interpretation that the initial surge in optimism around
the election may have been reinforced by the predominantly upbeat
tone of the economic news since the beginning of November.
The higher level of consumer sentiment is not surprising from
the standpoint of econometric models of sentiment. Indeed, what is
surprising is that spirits remained so low earlier. Econometric
models have consistently overpredicted both the Michigan and the
Conference Board indexes for most of the past two years; however,
with the December increase in the preliminary reading from the
5. Press reports about holiday sales have featured supposedlyimpressive year-over-year increases. However, this perspective mayprovide an exaggerated view about the near-term performance ofsales. For example, even if (seasonally adjusted) spending atgeneral merchandise stores did not grow at all in December, year-over-year comparisons would show an increase in sales of close to12 percent because sales were strong from January through October.
II-14
SALES OF AUTOMOBILES AND LIGHT TRUCKS1
(Millions of units at a seasonally adjusted annual rate)
1992 1992
1990 1991 Q1 Q2 Q3 Oct. Nov. Dec. 2
1-10
Total 13.86 12.30 12.37 12.99 12.59 13.49 12.99 14.10Autos 9.50 8.39 8.31 8.50 8.21 8.30 8.17 9.06Light trucks 4.36 3.91 4.06 4.49 4.38 5.19 4.82 5.04
North American3 10.84 9.73 9.86 10.57 10.41 11.26 10.78 11.86Autos 6.90 6.14 6.07 6.32 6.24 6.28 6.20 7.04
Big Three 5.82 4.99 5.02 5.17 4.94 5.17 5.06 5.66Transplants 1.08 1.14 1.05 1.15 1.30 1.11 1.14 1.39
Light trucks 3.95 3.59 3.79 4.25 4.17 4.98 4.58 4.82
Foreign produced 3.01 2.57 2.50 2.43 2.18 2.23 2.21 2.24Autos 2.60 2.25 2.24 2.18 1.97 2.02 1.98 2.02Light trucks .41 .32 .27 .24 .20 .21 .24 .22
Note: Data on sales of trucks and imported autos for the current month arepreliminary and subject to revision.
1. Components may not add to totals because of rounding.2. Sales of North American produced vehicles are data: sales of imported
vehicles are staff estimates.3. Excludes some vehicles produced in Canada and Mexico that are classified
as imports by the industry.

II-15
CONSUMER SENTIMENT
Michigan Survey---- Conference Board Survey
\A
\I,AA I
1978 1980 1982 1984 1986
ACTUAL AND FITTED VALUES OF CONSUMER SENTIMENT 1
Michigan Survey---- Fitted Value
1988 1990 1992
Index150
-140
-130
-120
- 110
-100
iec.(p)
-90
80
-70Nov.
- 60
-50
- 40
Index
1978 1980 1982 1984 1986 1988 1990 1992
1. The equation for estimating consumer sentiment is described in the text.p = preliminary

II-16
PERSONAL INCOME(Average monthly change at an annual rate; billions of dollars)
1992 1992
1991 Q1 Q2 Q3 Sep. Oct.
Total personal income 12.8 21.6 9.6 13.5 24.4 51.1
Wages and salaries 5.2 11.3 3.6 5.6 -4.1 18.3Private 3.8 8.6 .9 5.6 -3.8 15.0
Other labor income 1.5 1.4 1.4 1.4 1.4 1.5
Proprietors' income .1 7.1 -4.2 5.4 20.2 21.2Farm -.3 1.7 -5.9 2.6 14.2 16.9
Rent .6 -.1 3.7 -1.2 2.2 5.4Dividend -.8 .1 1.2 1.5 1.0 1.5Interest -.6 -8.6 -.8 -3.8 -3.7 -3.0
Transfer payments 7.8 12.2 5.3 5.2 7.2 7.5
Less: Personal contributionsfor social insurance 1.1 1.9 .6 .5 -.2 1.1
Less: Personal tax and nontaxpayments -.1 -5.0 3.3 4.6 2.0 5.3
Equals: Disposable personal income 12.9 26.6 6.3 8.9 22.4 45.8
Memo: Real disposable income 1.2 9.8 -1.9 1.6 -3.2 22.0
1REAL PERSONAL CONSUMPTION EXPENDITURES
1992 1992
1991 Q1 Q2 Q3 Sep. Oct.
------Annual rate----- Monthly ratePersonal consumption
expenditures .0 5.1 -.1 3.7 .3 .3
Durable goods -2.5 16.5 -2.1 9.5 .4 1.8Excluding motor vehicles -1.0 15.2 -1.6 18.6 .6 .3
Nondurable goods -1.5 5.5 -1.5 2.5 .1 .1Excluding gasoline -1.6 5.6 -1.7 2.8 -.2 .3
Services 1.6 2.2 1.2 3.0 .3 .0Excluding energy 1.5 3.0 .9 3.2 .2 .1
Memo:Personal saving rate
(percent) 4.7 4.9 5.3 4.5 4.4 4.7
1. The revised data on retail sales for September and October have not yet beenincorporated into the PCE data.

II-17
Michigan survey, confidence is much closer to the level predicted by
various regression equations (chart).
Real disposable personal income rose only 0.4 percent (annual
rate) in the third quarter (table), and adjusting income for the
negative effects of Hurricanes Andrew and Iniki would raise the
third-quarter growth rate only about 1/4 percentage point. Nominal
personal income jumped 1 percent in October, but most of the gain
was due to special factors such as a rebound from the depressing
effects of the hurricanes, one-time transfers to Japanese-Americans
interned during World War II, and retirement incentives for Postal
Service employees. Excluding these factors, nominal income was up a
more modest 0.4 percent in October. However, average weekly
earnings posted a sizable gain in November, suggesting that wage and
salary income will show a substantial improvement in that month.
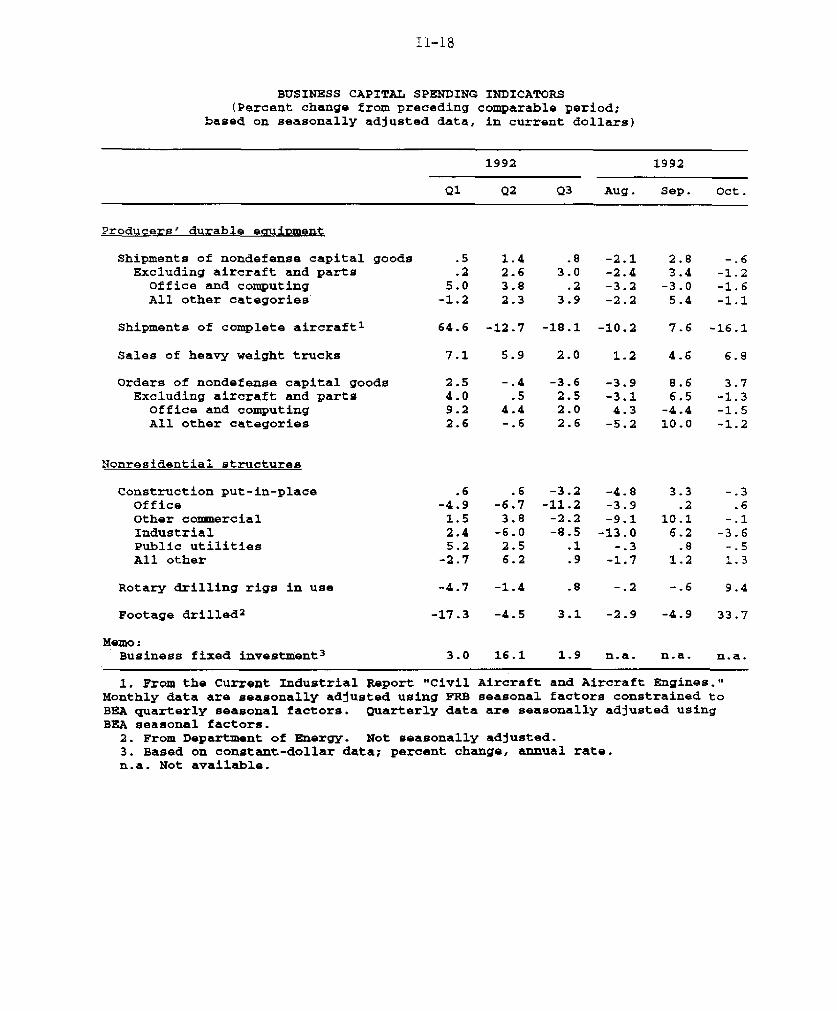
Business Fixed Investment
Real outlays for producers' durable equipment, which rose at an
average annual rate of more than 10 percent over the first three
quarters of 1992, appear to be on track for another advance in the
current quarter. Equipment investment probably has been supported
by the pick-up in economic growth in recent quarters as well as a
substantial increase in cash flow since late last year. Meanwhile,
the outlays for nonresidential construction appear to have firmed a
little in early autumn, after a steep drop during the summer.
In the near term, one potentially important influence on
equipment spending is the possible enactment of investment
6. The fitted values of sentiment in the chart are derived from amodel that relates the level of sentiment in month t to severalright-hand variables: the unemployment rate in month t, the changein the unemployment rate in month t, the change in the unemploymentrate over the last year, the change in real disposable income inmonth t, the change in income over the last year, the change inprices in month t, the change in prices over the last year, and atrend. The model was estimated over the period from January 1960 toJune 1990 and simulated for the period since June 1990. Similarresults were obtained with a variety of other specifications.
II-18
BUSINESS CAPITAL SPENDINIG INDICATORS(Percent change from preceding comparable period;
based on seasonally adjusted data, in current dollars)
1992 1992
Q1 Q2 Q3 Aug. Sep. Oct.
Producers' durable equipment
Shipments of nondefense capital goods .5 1.4 .8 -2.1 2.8 -.6Excluding aircraft and parts .2 2.6 3.0 -2.4 3.4 -1.2
office and computing 5.0 3.8 .2 -3.2 -3.0 -1.6All other categories -1.2 2.3 3.9 -2.2 5.4 -1.1
Shipments of complete aircraft1 64.6 -12.7 -18.1 -10.2 7.6 -16.1
Sales of heavy weight trucks 7.1 5.9 2.0 1.2 4.6 6.8
Orders of nondefense capital goods 2.5 -.4 -3.6 -3.9 8.6 3.7Excluding aircraft and parts 4.0 .5 2.5 -3.1 6.5 -1.3
Office and computing 9.2 4.4 2.0 4.3 -4.4 -1.5All other categories 2.6 -.6 2.6 -5.2 10.0 -1.2
Nonresidential structures
Construction put-in-place .6 .6 -3.2 -4.8 3.3 -.3Office -4.9 -6.7 -11.2 -3.9 .2 .6Other commercial 1.5 3.8 -2.2 -9.1 10.1 -.1Industrial 2.4 -6.0 -8.5 -13.0 6.2 -3.6Public utilities 5.2 2.5 .1 -.3 .8 -.5All other -2.7 6.2 .9 -1.7 1.2 1.3
Rotary drilling rigs in use -4.7 -1.4 .8 -.2 -.6 9.4
Footage drilled2 -17.3 -4.5 3.1 -2.9 -4.9 33.7
Memo:Business fixed investment 3 3.0 16.1 1.9 n.a. n.a. n.a.
1. From the Current Industrial Report "Civil Aircraft and Aircraft Engines."Monthly data are seasonally adjusted using FRB seasonal factors constrained toBEA quarterly seasonal factors. Quarterly data are seasonally adjusted usingBEA seasonal factors.
2. From Department of Energy. Not seasonally adjusted.3. Based on constant-dollar data; percent change, annual rate.n.a. Not available.

II-19
incentives in 1993. Although no explicit policy has been proposed,
President-elect Clinton has supported targeted investment
incentives, and a marginal investment tax credit has been widely
discussed. In similar episodes in the past, anticipation of the
future enactment of such incentives led businesses to shift their
capital spending plans to reduce their tax liabilities. However,
several aspects of the current experience suggest that these
transitory forces will not significantly alter the near-term path of
investment in producers durable equipment. First, delivery lags are
such that most current shipments are the result of orders placed
before the election. Second, congressional leaders have indicated
that any tax change should be made retroactive to the beginning of
December. 7
The available data on shipments of nondefense capital goods,
which extend only through October, indicate that some significant
shifts in the composition of spending are occurring. Outlays for
computing equipment trended up at an annual rate of close to 40
percent from early 1991 through the third quarter of this year,
accounting for almost all of the advance in total equipment outlays
over the period. However, nominal shipments of computers declined
nearly 8 percent from August to October, and nominal orders have
fallen in each of the past two months. The recent softening in the
sector may have been driven, in part, by the expectation of
continued large price declines, and by the anticipation of new
7. The anticipation of an investment tax credit probably willhave a relatively small effect on production of capital goods, giventhat a substantial proportion of the domestic production ofthese goods is exported (and the prospect of an ITC has no bearingon foreign demand); moreover, if manufacturers think that anyweakness in orders late this year is transitory, in that it stemsfrom the possible enactment of a tax credit, they may decide tomaintain production, temporarily holding more inventories.

II-20
RECENT DATA ON ORDERS AND SHIPMENTS
Office and Computing Equipment Other Equipment (ex. aircraft and computers)
Billions of dollars Billions of dollars
Orders- --- Shipments
/1 ' octiS111
I
1991 1992
OUTLAYS FOR COMPUTERS
(1987 dollars, seasonally adjusted)
Billions, ratio scale
1991 1992
DEFLATOR FOR COMPUTERS
(Seasonally adjusted)
1987 = 100, ratio scale
1 I I 1 I I i 1 I1991 19871987 1989 1989 1991

II-21
products set to be introduced early next year, such as Intel's
powerful Pentium processor. 8
The segment of the computer market in which the recent softness
has been concentrated is still a matter of conjecture. According to
recent press reports, the leading PC producers are seeing continued
strong demand, and have accumulated relatively large backlogs in
recent months; this suggests that the declines in overall orders and
shipments of computing equipment stems from weakness for higher-
value products, such as mainframes and workstations. Whatever the
case, the continuing rapid downtrend in the overall price index for
computers (chart) likely will offset the weakness in nominal
shipments, thus giving rise to a firmer picture in terms of
constant-dollar outlays.
Recent data on other equipment investment have been more
positive. Sales of heavy trucks have risen notably in recent
months, and the increase in light vehicle sales so far this quarter
probably reflects greater demand from both businesses and
9households. In addition, domestic aircraft purchases should not
be the big negative that they were in the previous quarter; these
purchases had soared to an unsustainably high level last spring, and
their third-quarter drop brought them to a more normal level.
Nonetheless, outlays in this sector probably will be trending down
during the next couple of years, reflecting the problems that
currently beset the domestic airlines.
8. Industry sources have informed us that this processor may beat least three times faster than the top-of-the-line PC chips thatare currently available. The speed gains offered by Pentium-basedsystems are such that PCs incorporating this chip will becompetitive with the low end of the workstation market. Theprospective list prices for the machines unveiled so far have rangedfrom $5,000 to $15,000. Industry sources have suggested that thesemachines will most likely sell at even lower prices by next spring.
9. Navistar, which marketed its products aggressively as itsfiscal year came to an end in October, accounted for two-thirds ofthe increase in heavy truck sales in that month.

II-22
NONRESIDENTIAL CONSTRUCTION AND SELECTED INDICATORS*(Index, Dec. 1982 = 100, ratio scale)
Total Building
Construction (C)------- Permits (P), Contracts (CN), or
New commitments (NC)
1980 1982 1984 1986 1988 1990 1992
Office-- 175
- t
I I I I I1986 1988
'I
I t
1990 1992
Industrial
Other Commercial
1984 1986 1988 1990 1992
Institutional
(CN II I
1984 1986 1988 1990 1992 1984 1986 1988 1990 1992
'Six-month moving average for all series shown. For contacts, total only includes private, while individual sectors include private and public.New commitments are the sum of permits and contracts.
1984· · · _·_·_

II-23
Outlays for items other than transportation and computing
equipment increased at an annual rate of 11 percent in the third
quarter, and, on net, recent data on orders and shipments point to
a further solid gain this quarter (chart). One particularly strong
area in recent months has been communications equipment such as
cellular phones and equipment for communications networks.
Turning to the recent detail on nonresidential construction,
the expenditures for office buildings, which had plunged during the
summer, flattened out in September and October. However, the long-
run trend in this sector probably still is pointing downward.
Construction in the "other commercial" sector dropped sharply in
August but jumped back in September and held steady in October; its
trend this year has been essentially sideways. Elsewhere, the
uptrend in institutional construction that was evident earlier in
the year appears to have moderated in recent months, and outlays for
industrial structures continued weak in the early autumn.
Price declines for office buildings and other commercial
properties continued in the third quarter. According to the
Russell-NCREIF index (chart), the national average of nominal
appraised values for office properties fell 3-1/2 percent in that
period. The values of retail properties and warehouses also
declined. Other evidence of continued softening in prices comes
from the FDIC's October Survey of Real Estate. Nearly one-third of
the banking examiners and liquidators who responded to that survey
reported continued declines in real estate prices, and only
5 percent reported price increases. The persistence of high office
vacancy rates, especially in downtown locations, continues to be an
important factor depressing prices.

II-24
PRIVATE HOUSING ACTIVITYMillions of units; seasonally adjusted annual rates)
1991Annual
All unitsPermitsStarts
.951.01
Single-family unitsPermitsStarts
SalesNew homesExisting homes
Multifamily unitsPermitsStarts
.513 .22
.20
.17
1992n01 7 ? r
1.12 1.05 1.09 1.131.26 1.14 1.19 1.22
.921.06
.623.41
.19
.20
.563.43
.17
.16
.891.02
.643.35
.20
.17
p Preliminary. r Revised estimates. n.a. Not available.
PRIVATE HOUSING STARTS(Seasonally adjusted annual rate)
Millions of units
1983 1984 1985 1986 1987 1988 1989 1990 1991 1992
r1992
nf-l r
1.141.22
.961.09
.603.60
.18
.14
M, P
1.121.24
.951.10
n.a.n.a.
.17
.14
.911.05
.673.30
.21
.17
--

II-25
PRICES OF COMMERCIAL BUILDINGS(Percent change, national average)
19921990 1991 Q1 Q2 Q3
Russell-NCREIF indexOffice buildings -8.5 -17.5 -1.7 -4.0 -3.5Retail stores -.3 -8.3 -1.9 -1.9 -1.5Warehouses -4.6 -8.7 -1.8 -2.1 -3.0
One recent bright spot in the nonresidential structures
sector is drilling activity; the count of rigs in use jumped
9-1/2 percent in October and advanced 5 percent further last month.
These gains are reportedly attributable to the increase in natural
gas prices since last spring and to the expiration, at the end of
the year, of a roughly $6 per barrel tax subsidy.10 Presumably,
the part of the recent increase in drilling activity that is related
to the expiration of the tax subsidy is being borrowed from the
future. Moreover, oil drilling in coming months likely will be
adversely influenced by the recent slump in crude oil prices.
Housing Markets
Housing demand and production appear to be continuing on
gradual recovery paths. Total housing starts in November were
little changed from a month earlier, but single-family starts were
revised upward for October and posted a further gain in November, to
the highest level since February. By contrast, apartment building
continues to be depressed. Since the housing trough early last
year, single-family homebuilding has accounted for nearly 90 percent
10. An economist at the American Gas Association estimates thatabout one-third of the recent uptick in drilling activity isattributable to the expiration of this subsidy; he argued that therest of the increase reflects the usual response of drillingactivity to higher prices.

II-26
The Market for New Homes
Preliminary and Revised New Home Sales(Seasonally adjusted annual rate) Thousands of units
-- 690
I'
I'S
*I,
*I
I %jP I I
'I'a
1991
SOct.
1992
Home Builders' Evaluations(Seasonally adjusted) Diffusion index
C Current sales- - - - Expected sales in the next six months
1984 1985 1986 1987 1988 1989 1990 1991
SRevised------- Preliminary
- I
19901 1 I I I I I I I I I I I I I I .. .L I 1 I 1 I I I 1 I I

II-27
of the increase in residential investment expenditures, a much
higher share than in previous recoveries.
Home sales also have been firming. The estimate of new home
sales in September was revised up to the highest monthly pace since
late 1989. Because of continuing difficulties with the Census
Bureau's new home survey, the preliminary estimate of a sharp
decline in sales in October appears to be unreliable; the October
figure likely will be revised upward, as has been the case with each
preliminary monthly estimate this year (chart).1 Additional
evidence of stepped-up demand for new homes comes from builders
surveyed by the National Association of Home Builders, whose
evaluations of current and prospective home sales are the most
positive since the mid-1980s. In the market for existing homes,
sales jumped 9 percent in October to the highest monthly pace since
1988. A near-record 79 percent of consumers think "now is a good
time to buy," according to the Michigan survey.
Recent evidence on the direction of house prices has been
mixed. For the country as a whole, sales prices of new and existing
homes in October were up 2 to 5 percent from a year earlier, a bit
above other recent monthly readings. However, constant-quality
price indexes, which are available only on a quarterly basis, have
remained flat.
The cost of constructing new homes may be receiving some upward
pressure from materials costs: Spot prices for plywood have jumped
24 percent since late October, and spot prices for lumber have risen
11 percent. The previous spike in these prices occurred in late
summer, in the wake of Hurricane Andrew. In contrast, the recent
increases in lumber and plywood prices appear to stem from the
11. The Census Bureau plans to introduce, perhaps as early as nextmonth, new estimation procedures that should eliminate the bias inthe preliminary estimate of monthly sales.
II-28
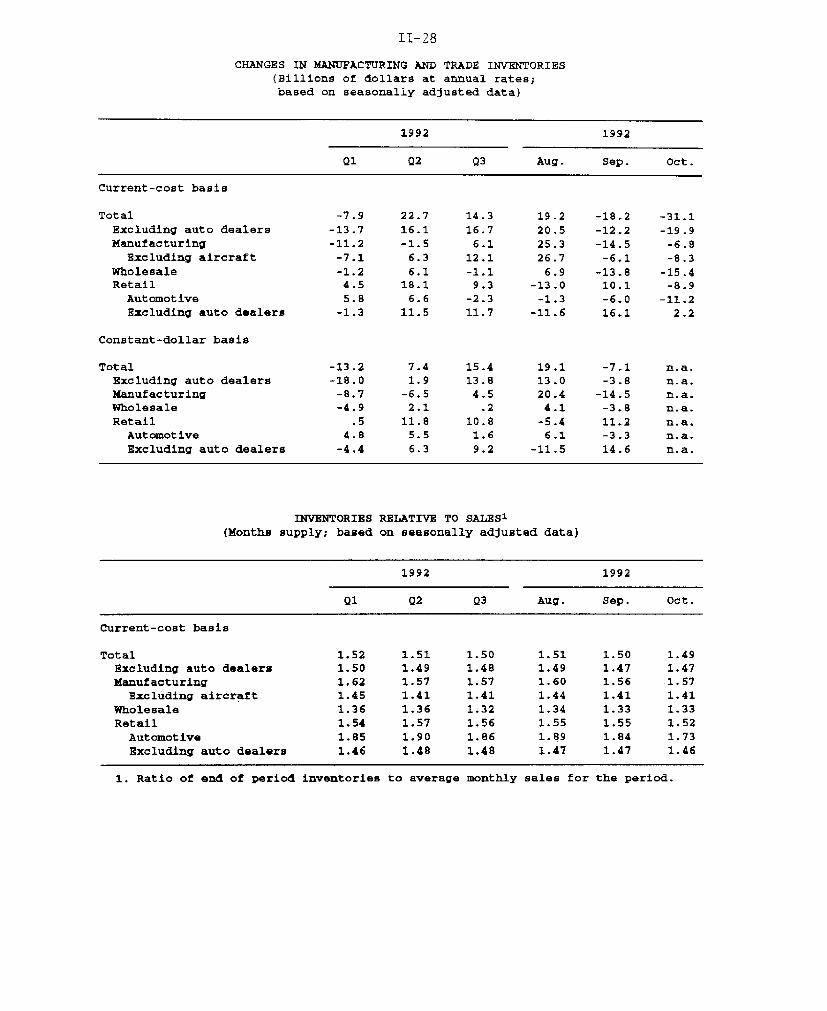
CHANGES IN MANUFACTURING AND TRADE INVENTORIES(Billions of dollars at annual rates;based on seasonally adjusted data)
1992 1992
Q1 Q2 Q3 Aug. Sep. Oct.
Current-cost basis
Total -7.9 22.7 14.3 19.2 -18.2 -31.1Excluding auto dealers -13.7 16.1 16.7 20.5 -12.2 -19.9Manufacturing -11.2 -1.5 6.1 25.3 -14.5 -6.8
Excluding aircraft -7.1 6.3 12.1 26.7 -6.1 -8.3Wholesale -1.2 6.1 -1.1 6.9 -13.8 -15.4Retail 4.5 18.1 9.3 -13.0 10.1 -8.9Automotive 5.8 6.6 -2.3 -1.3 -6.0 -11.2Excluding auto dealers -1.3 11.5 11.7 -11.6 16.1 2.2
Constant-dollar basis
Total -13.2 7.4 15.4 19.1 -7.1 n.a.Excluding auto dealers -18.0 1.9 13.8 13.0 -3.8 n.a.Manufacturing -8.7 -6.5 4.5 20.4 -14.5 n.a.Wholesale -4.9 2.1 .2 4.1 -3.8 n.a.Retail .5 11.8 10.8 -5.4 11.2 n.a.
Automotive 4.8 5.5 1.6 6.1 -3.3 n.a.Excluding auto dealers -4.4 6.3 9.2 -11.5 14.6 n.a.
INVENTORIES RELATIVE TO SALES1(Months supply; based on seasonally adjusted data)
1992 1992
Q1 Q2 Q3 Aug. Sep. Oct.
Current-cost basis
Total 1.52 1.51 1.50 1.51 1.50 1.49Excluding auto dealers 1.50 1.49 1.48 1.49 1.47 1.47Manufacturing 1.62 1.57 1.57 1.60 1.56 1.57
Excluding aircraft 1.45 1.41 1.41 1.44 1.41 1.41Wholesale 1.36 1.36 1.32 1.34 1.33 1.33Retail 1.54 1.57 1.56 1.55 1.55 1.52
Automotive 1.85 1.90 1.86 1.89 1.84 1.73Excluding auto dealers 1.46 1.48 1.48 1.47 1.47 1.46
1. Ratio of end of period inventories to average monthly sales for the period.
II-29
improvement in the housing sector for the nation as a whole.
Industry analysts speculate that the increasing evidence of a
housing recovery and the likelihood of future increases in demand
for wood products has caused some hoarding, which may be responsible
for part of the recent increases in lumber and plywood prices. 1 2
Business Inventories
The business inventory situation has changed little over the
last few months. Stocks in major sectors have remained broadly in
line with sales (chart), and there have been no signs of serious
overhangs either in the incoming data or in anecdotal reports. By
the same token, there still is little hard evidence of firms moving
more aggressively toward intended accumulation of stocks.
In the early part of the fourth quarter, manufacturers
continued to show restraint in their inventory behavior. Factory
stocks were reduced further in October, even as output expanded and
new orders rose for the second month in a row. Nonetheless, the
pace of inventory trimming was slower than in September. By stage
of processing, the October drawdown was largely in inventories of
materials and supplies, especially in the transportation equipment
industry. Work-in-process inventories rose in October (again, a
substantial part of it in transportation equipment), while stocks of
finished goods were about unchanged.
In the trade sector, retail inventories declined about
$9 billion in October, with a sharp drop in the stocks held by auto
dealers more than accounting for the decline. Excluding the auto
sector, retail stocks increased only slightly in October, and, as a
result of a strong increase in sales, the inventory-sales ratio for
these stores edged down. For stores in the GAF grouping (that is,
12. Direct use of lumber in home building accounts for about40 percent of total domestic lumber consumption.

II-30
RATIO OF INVENTORIES TO SALES(Current-cost data)
Ratio2.1
Manufacturing
1.9
. Total 1.7
'", ,,'> ,' ', - 1.5Oct.Excluding aircraft '2•.-,, " '',* .', ,
1 I I I 1 1 I 1 I 1 1 1.31980 1982 1984 1986 1988 1990 1992
Ratio1.5
Wholesale
1.4
Oct.
S 1.3
1.2
I I I I I I I I I I I I1.
1980 1982 1984 1986 1988 1990 1992
Ratio Ratio2.7 - - 1.7
Retail
:, ~,l, GAF group
2.5 - ' * ". - 1.6', : "U*. .w i 1.6
*.* 4 'y *t;g 1-* 14111
S r " u Oct
2.3 Oc 1.5
2.1 - Total excluding auto - 1.4
1980 1982 1984 1986 1988 1990 1992

II-31
general merchandise, apparel, and furniture stores) the inventory-
sales ratio fell to a relatively low level (chart, lower panel).
In the wholesale sector, inventories were drawn down
$15-1/2 billion at an annual rate in October, after a downward-
revised liquidation of nearly $14 billion in September. Wholesale
inventory data at the industry level showed widespread declines in
both September and October; two exceptions were the apparel and
motor vehicles industries. The inventory-sales ratio for the
merchant wholesale sector in October was near the low end of the
range observed over the past two years (chart, middle panel).
Federal Sector
With the Congress in recess and the incoming administration
forging its fiscal plans, the news on the federal sector is
relatively light.
The unified federal budget showed a deficit of $49 billion in
October, an increase of $12 billion from the deficit recorded in the
same month of 1991. Nearly all of the increase was on the outlays
side. A shift in the timing of disbursements for military pay,
veterans' benefits, and social security payments accounted for about
$5 billion of the rise in outlays; these payments were moved forward
into October because November 1, the normal date of disbursement,
came on a weekend. Most of the remaining increase in outlays
resulted from increased spending on Medicaid, Medicare, income
security, and social security.
Defense outlays resumed their downward trend in October, after
13a temporary bulge in the third quarter.13 After adjustment for
13. The degree to which the third-quarter bulge in real defenseexpenditures translated into increased production of goods andservices is not altogether clear. In particular, about half of thethird-quarter bulge in defense outlays was accounted for byincreased spending for durable goods, but defense inventories heldby manufacturers fell by roughly the same amount. Taken at facevalue, these data would seem to suggest that the rise in outlays for(Footnote continues on next page)

II-32
FEDERAL GOVERNMENT OUTLAYS AND RECEIPTS(Unified basis; billions of dollars, except where noted)
Fiscal year to dateOct. Oct. Dollar Percent1991 1992 change change
OutlaysDeposit insurance (DI)Defense Cooperation
account (DCA)
Outlays excluding DI and DCANational defenseNet interestSocial securityMedicare and healthIncome securityOther
ReceiptsPersonal income taxesSocial insurance taxesCorporate income taxesOther
Deficit(+)excluding DI and DCA
114.7 125.7 11.0-.8 -2.6 -1.8
-1.2
116.725.116.822.717.214.320.7
78.140.128.4
.49.1
.0 1.2
128.327.416.524.319.018.322.8
76.837.329.62.17.9
11.62.4-. 31.71.84.02.1
-1.2-2.81.21.7-1.3
36.6 48.9 12.338.6 51.5 12.9
Note: Components may not sum to totals because of
9.6240.1
-97.6
10.09.5-1.87.3
10.728.110.0
-1.6-7.04.1
391.1-13.9
33.533.4
rounding.

II-33
the shift in paydates, defense spending amounted to $24.6 billion in
October, compared with an average of $25.8 billion over the first
nine months of calendar 1992. In real terms, the October level of
these outlays was down about 6 percent from that of a year earlier.
Federal employment shrank in October and November, reflecting
implementation by the Postal Service of a reorganization plan which
was to eliminate 30,000 management and support jobs via an early
retirement program. A larger-than-expected number of workers (about
47,000) accepted early retirement, and the Postal Service plans to
replace some of those retirees; long-term hiring plans call for an
additional 12,000 employees.
State and Local Government Sector
After a jump early in the year, the real purchases of state and
local governments have risen only slightly, on net, over the past
couple of quarters, and the indicators for the current quarter are
mixed. Employment jumped in November after edging down the month
before, but most of the November advance reflected the temporary
hiring of election workers. Meanwhile, real outlays for state and
local construction projects edged down in October to a level
1.0 percent below the third-quarter average. The largest declines
were in outlays for highways and hospitals.
For the year to date, state and local construction outlays have
been running at a level well above that of 1991. Construction of
educational facilities has risen a bit further this year, after
strong gains over the previous few years, and spending for other
(Footnote continued from previous page)
durable goods did not generate any new production in the thirdquarter; however, the data are sufficiently unreliable as to makeone wary of such a strong conclusion. The remaining portion of thethird-quarter spending bulge reflected a rise in the outlays fordefense services (other than compensation); that gain was moreclearly an increment to current production in the third quarter.

II-34
types of buildings is up considerably. Outlays for roads and
highways also have increased appreciably this year; over the first
ten months of 1992, the average level of these expenditures, in real
terms, was more than 13 percent above the annual average for 1991.
Federally funded spending accounts for roughly half of total state
and local outlays on all highways and related structures and appears
to have been one important factor supporting the recent rise in that
category of expenditure. The Intermodal Surface Transportation
Efficiency Act of 1991 authorized the Department of Transportation
to spend up to $20.4 billion on highways in each of the five fiscal
years starting in 1993; although appropriations have fallen well
short of this level, they have moved up considerably since FY1991,
and actual outlays also have increased.
Many states and localities continue to experience severe
budgetary pressures. More than three-fifths of the states say that
revenues in fiscal 1992 (July to June for most states) fell short of
levels projected when the budgets were passed. As for FY93, many
states reportedly are planning reductions, in real terms, in their
general fund spending; in some cases lawmakers are said to be making
new efforts to impose greater restraint on entitlements. Hiring,
especially at the state level, also appears likely to be restrained.
Indeed, many states are planning to reduce employment in 1993, with
the largest decreases slated to be in New Jersey, Michigan, and
Massachusetts. In addition, about one-third of the states are
planning no rise in compensation for state employees during fiscal
1993. Localities, on the whole, may be faring a little better, as
employment at that level has increased about 3 percent since the end
of 1990, compared with only a 1 percent rise at the state level.
II-35
Prices
After a string of good reports on inflation, the data for the
last couple of months have been somewhat less favorable. In October
and November, the consumer price index for items other than food and
energy rose 0.5 and 0.3 percent, respectively, after five
consecutive increases of only 0.2 percent. Nonetheless, there seems
to be little reason to think that the underlying inflation trends
have worsened: A considerable degree of slack remains in the
domestic economy; the dollar has appreciated, on balance, in recent
months; and crude oil prices have been falling of late.
Prices of consumer commodities other than food and energy were
boosted in October by sharply higher prices for apparel, tobacco,
and used cars. In November, however, the prices of apparel and
tobacco stabilized, and increases were small, on net, for the
remaining commodities. In the services category, airfares surged in
October and November, as companies sought to restore profit margins
that had been squeezed by the promotions of last summer; recently,
however, renewed fare discounting has been reported. The cost of
shelter also jumped in October, but a smaller increase was posted in
that category in November. Despite the recent bumpiness, the trend
in core inflation still appears to be headed downward; for the
twelve months ended in November, the CPI excluding food and energy
rose 3.4 percent, compared with 4.5 percent over the preceding
twelve-month period.
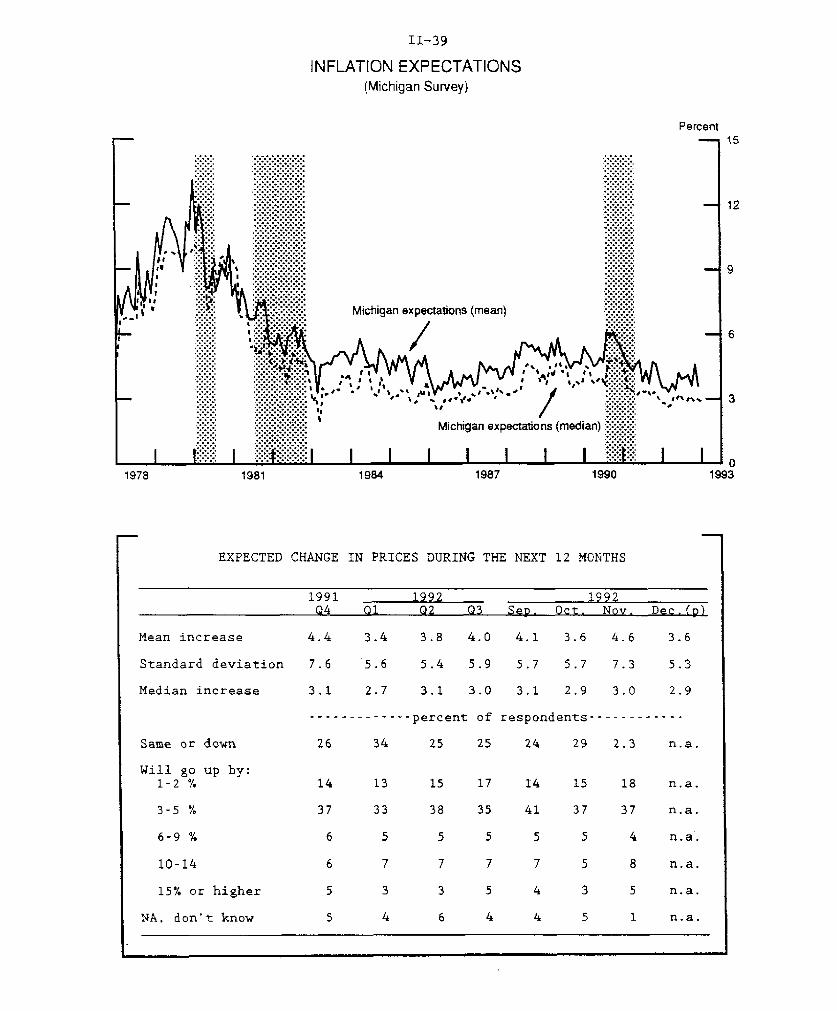
Inflation expectations, as measured by the Michigan consumer
survey's mean expected price change over the next twelve months,
jumped a full percentage point in November to 4.6 percent; however,
this rise was fully reversed in December, according to the
preliminary reading for that month. Such monthly volatility in the
mean estimate of inflation expectations usually can be traced to

II-36
RECENT CHANGES IN PRODUCER PRICES(Percent change; based on seasonally adjusted data)1
Relative 1992 1992importanceDec. 1991 1990 1991 Q1 Q2 Q3 Oct. Nov.
----- Annual rate------ -Monthly rate-
Finished goods 100.0 5.7 -.1 1.0 3.3 1.6 .1 -.2Consumer foods 21.9 2.6 -1.5 .3 -1.0 3.6 .1 -.5Consumer energy 13.8 30.7 -9.6 -7.0 17.9 -.5 1.4 -1.5Other finished goods 64.2 3.5 3.1 3.7 1.8 1.2 -.1 .1
Consumer goods 39.5 3.7 3.4 3.6 2.4 1.2 -.1 .2Capital equipment 24.7 3.4 2.5 3.5 .9 .9 -.2 .1
Intermediate materials2 95.3 4.6 -2.7 .0 5.4 .3 .0 -.2Excluding food and energy 81.7 1.9 -.8 1.7 1.7 1.0 -.2 .0
Crude food materials 41.2 -4.2 -5.8 11.8 1.9 -6.2 .6 -.6Crude energy 40.0 19.1 -16.6 -26.6 51.5 16.4 -.5 .6Other crude materials 18.7 .6 -7.6 15.0 4.8 2.5 -1.3 -.9
1. Changes are from final month of preceding2. Excludes materials for food manufacturing
period to final month of period indicated.and animal feeds.
RECENT CHANGES IN CONSUMER PRICES(Percent change; based on seasonally adjusted data)1
Relative 1992 1992importanceDec. 1991 1990 1991 Q1 Q2 Q3 Oct. Nov.
----- Annual rate------ -Monthly rate-
All items2 100.0 6.1 3.1 3.5 2.6 2.6 .4 .2Food 16.0 5.3 1.9 1.5 -1.2 4.7 .0 .0Energy 7.4 18.1 -7.4 -6.9 12.5 .4 .5 .8All items less food
and energy 76.6 5.2 4.4 4.8 2.8 2.5 .5 .3Commodities 24.8 3.4 4.0 5.3 2.1 2.1 .3 .1Services 51.9 6.0 4.6 4.8 2.9 2.6 .6 .3
Memorandum:
CPI-W 3 100.0 6.1 2.8 3.0 2.7 2.9 .4 .2
1. Changes are from final month of preceding period to final month of period indicated.2. Official index for all urban consumers.3. Index for urban wage earners and clerical workers.

II-37
changes in the number of survey respondents who expect very large
increases in prices over the next twelve months (table). By
contrast, the median of the distribution, which is less sensitive to
such outliers, exhibits smaller monthly fluctuations; it has
remained in the neighborhood of 3 percent since late last year.1
The CPI for food has flattened in the past two months after a
spurt in August and September. Fruit and vegetable prices have been
responsible for much of the volatility in food prices for some time
now; they fell sharply in the spring, rebounded in late summer, and
recently have turned down once again. Apart from fruit and
vegetable prices, increases in food prices have been quite subdued
in the past year, and recent reports on crop and livestock
production suggest no shortfalls that might pose a serious threat to
the continuation of this trend.
After rising 0.5 percent in October, consumer energy prices
moved up an additional 0.8 percent in November. Gasoline prices
rose sharply in November as a drop in crude oil costs was more than
offset by the effect of new federal requirements for winter-season
additives that are designed to reduce the formation of smog.
Industry analysts say that the new regulations, which went into
effect in thirty-nine major metropolitan areas at the start of
November, will raise costs by three to five cents per gallon. The
regulations will be in effect in at least some cities until the end
of February. Meanwhile, further declines in crude oil prices in
recent weeks suggest that softer gasoline and heating oil prices may
be in the offing in coming months; indeed, at the producer level,
14. The median is less volatile than the mean and therefore givesa more reliable signal of changes in expectations. However, themedian gives a forecast of inflation that is biased downward. Bycontrast, the mean forecast is unbiased. After adjustment for thehistorical bias in the median forecast, both measures indicate thatconsumers expect inflation to run at about 4 percent next year, wellabove this year's apparent outcome.

II-38
INFLATION RATES EXCLUDING FOOD AND ENERGY
CPI
Goods
Alcoholic beveragesNew vehiclesApparelHousefurnishingsHousekeeping suppliesEntertainment
Services
Owners' equivalent rentTenants' rentOther renters' costsAirline faresMedical careEntertainment
PPI Finished goods
Consumer goods
Capital equipment, excludingcomputers
Computers
PPI intermediate materials
PPI crude materials
Percent
Nov.1990
5.3
3.1
4.31.84.2.6
3.33.2
6.2
5.04.1
13.118.69.85.6
3.6
3.9
3.2n.a.
1.8
.2
I
Factors Affecting Price Inflation
ECI hourly compensation1 4.9 4.5 3.4Goods-producing 5.0 4.5 3.9Service-producing 4.8 4.5 3.1
Civilian unemployment rate 6.0 6.9 7.2
Capacity utilization2 80.7 78.2 77.9(manufacturing)
Non-oil import prices3 2.4 .4 2.8Consumer goods, excluding autos,
food, and beverages 3.6 .5 3.7Autos 1.0 4.2 2.3
1. Private industry workers, periods ended in September.2. End-of-period value.3. BLS import price index (not seasonally adjusted), periods ended
in September.n.a. - not available
change from twelveearlierNov.1991
4.5
4.4
10.03.74.4
.92.53.7
4.5
3.73.17.8
-5.27.95.1
3.1
3.4
2.6n.a.
-1.0
-8.3
months
Nov.1992
3.4
2.5
2.92.6
.91.4.5
1.8
3.9
3.02.55.99.07.32.8
2.0
2.1
2.3-15.8
1.0
2.8
II-39
INFLATION EXPECTATIONS(Michigan Survey)
Percent
Michigan expectations (mean)
1978 1981 1984 1987 1990
EXPECTED CHANGE IN PRICES DURING THE NEXT 12 MONTHS
1991 _ 1992 1992Q4 Q1 Q2 Q3 Sep. Oct. Nov. Dec.(p)
Mean increase 4.4 3.4 3.8 4.0 4.1 3.6 4.6 3.6
Standard deviation 7.6 5.6 5.4 5.9 5.7 5.7 7.3 5.3
Median increase 3.1 2.7 3.1 3.0 3.1 2.9 3.0 2.9
------------- percent of respondents------------
Same or down 26 34 25 25 24 29 2.3 n.a.
Will go up by:1-2 % 14 13 15 17 14 15 18 n.a.
3-5 % 37 33 38 35 41 37 37 n.a.
6-9 % 6 5 5 5 5 5 4 n.a.
10-14 6 7 7 7 7 5 8 n.a.
15% or higher 5 3 3 5 4 3 5 n.a.
NA. don't know 5 4 6 4 4 5 1 n.a.
-- 01993

II-40
PRICE INDEXES FOR COMMODITIES AND MATERIALS 1
Percent change2
Lastobser-vationn
1992
To Nov. 103
Nov. to10 3 r t-1990 19qq
MemoYear
earlier
to date
1. PPI for crude materials4
la. Foods and feedsla. Energylb. Excluding food and energyIc. Excluding food and energy,
seasonally adjusted
2. Commodity Research Bureau2a. Futures prices2b. Industrial spot prices
3. Journal of Commerce industrials3a. Metals
4. Dow-Jones Spot
5. IMF commodity index4
5a. Metals5b. Nonfood agriculture
6. Economist (U.S. dollar index)6a. Industrials
Nov.
Nov.Nov.Nov.
Nov.
Dec. 15Dec. 15
6.0 -11.6
-4.219.1
.6
-5.8-16.6-7.6
.7 -7.6
-2.7 -6.5.6 -11.3
Dec. 15 -2.4 -7.2Dec. 15 -3.9 -7.1
Dec. 15 -1.7 -12.1
Oct.Oct.Oct.
-5.2-1.1-3.5
.7-8.9
1.3
-4.1-. 6
2.9-.3
4.0
-3.4-. 43.5
Dec. 8 -4.4 -9.1 -3.1Dec. 8 -3.2 -14.9 -1.6
n.a.
n.a.n.an.a.
n.a.
1.4.6
-.2.9
7.0
n.a.n.a.n.a.
2.93.2
Not seasonally adjusted.Change is measured to end of period, fromWeek of the November Greenbook.Monthly observations. IMF index includesNot available
last observation of previous period
items not shown separately.
Index Weights
Food Commodities
0Precious Metals
E
PPI for crude materials
CRB futures
CRB industrials
Journal of Commerce index
Dow-Jones
IMF index
Economist
41 41 1 18
14 57 14 14
100
12 88
58 17 25
455
50 5o
1. Forest products, industria metals, and other industrial materals.
1.2.3.4.
n.a.
-3.8-. 4
2.9.7
7.9
-3.7-1.8
3.4
Energy
aOthers'I
.------ -~

II-41
the prices of these products already were down by a considerable
amount in November. Natural gas prices in the CPI moved up sharply
in November, as the spike in spot-market price increases associated
with Hurricane Andrew was passed on to the consumer level. Much of
this increase should be reversed in coming months, as spot prices
for natural gas have returned most of the way to their pre-hurricane
level.
Producer prices at the finished level declined 1/4 percent in
November, pulled down by the large declines in gasoline and fuel oil
prices and a 1/2 percent decline in food prices. Excluding food and
energy, the PPI increased 0.1 percent last month, a bit less than
the average pace over the previous twelve months. Automobile prices
were up 1 percent in November, but this followed a decline of more
than 2 percent in October. Auto manufacturers apparently introduced
price discounts earlier than usual, leading to swings in the
seasonally adjusted numbers. At earlier stages of processing,
prices of intermediate materials other than food and energy have
been about flat in recent months. Over the past twelve months,
intermediate materials prices have risen about 1 percent, after
falling by a similar amount over the preceding twelve months.
Prices of industrial commodities have changed relatively little
since the last Greenbook (table and chart). However, prices of
forest products (plywood and lumber) are up sharply; as noted
earlier, recent price increases in this sector may reflect, in part,
expectations in the industry of stronger demand for new housing.
Prices of farm crops (corn, wheat, and soybeans) also have moved up
in recent weeks from earlier lows; stronger-than-expected exports of
wheat, weather-related lags in the corn harvest, and normal seasonal
influences appear to be the chief causes of these increases.
Finally, in the oil market, the spot price of West Texas

II-42
COMMODITY PRICE MEASURES *
-- Journal of Commerce Index, total- - Journal of Commerce Index, metals
i L I 1 93Nov Dec
1992
CRB Spot Industrials
Ratio scale, indx(1967-100)
CFB Incustrials 7-1 277
1992
Nov1992
L 195Dec
Weekly data, Tuesdays; Journal of Commerce data monthly before 1985
CRB Futures
Dotted ine indicate week aolasti Greenbook.

II-43
Intermediate has come down about $1.50 per barrel since the last
Greenbook, as the recent OPEC agreement to curtail production
apparently has failed to impress the markets.

II-44
Daily Spot and Posted Prices of West Texas Intermediate 1
Dollars per barrel
Jan Feb Mar Apr May June July Aug Sep Oct Nov Dec1. Posted prices are evaluated as the mean of the range listed in the Wall Street Journal.
MONTHLY AVERAGE PRICES-WEST TEXAS INTERMEDIATE
Year and Month Posted Spot
January 17.63 18.82February 17.72 19.00March 17.81 18.92April 19.20 20.24May 19.90 20.94June 21.46 22.38July 20.77 21.76August 20.32 21.35September 20.83 21.90October 20.77 21.68November 19.38 20.34December1 18.17 19.13
1. Price through December 15.

DOMESTIC FINANCIALDEVELOPMENTS

III-T-1 1SELECTED FINANCIAL MARKET QUOTATIONS
(percent)....................................................................................
1992 1992 1992
FOMCSept 4 Nov 17 Dec 15
Short-term ratesShort-term rates
Change from:
FOMCSept 4 Nov 17
Federal funds 2
Treasury bills 3
3-month6-month1-year
Commercial paper1-month3-month
Large negotiable CDs 3
1-month3-month6-month
Eurodollar deposits1-month3-month
Bank prime rate
3.19 3.04 2.92
2.922.963.06
3.173.383.54
3.223.403.63
3.22 3.29 3.803.22 3.83 3.71
3.063.063.11
3.183.773.77
-.27 -.12
.30 .05
.44 .02
.57 .09
.58 .51
.49 -.12
.52 .40
.43 -.28
.46 -.20
.25 .43
.19 -.38
.00 .00
3.583.493.57
3.31 3.13 3.563.31 3.88 3.50
6.00 6.00 6.00
Intermediate- and long-term rates
U.S. Treasury (constant maturity)3-year10-year30-year
Municipal revenue(Bond Buyer)
Corporate--A utilityrecently offered
4.386.407.29
5.216.867.55
5.296.837.45
6.31 6.57 6.46
8.06 8.45 8.27
Home mortgage rates6
FHLMC 30-yr. FRM 7.84 8.32 8.23FHLMC 1-yr. ARM 5.15 5.20 5.47
...................................................................
1989 1992
Record Lows FOMChighs Date Jan 3 Nov 17 Dec 15
.39 -.09
.32 .27
Percent change from:
Record 1989 FOMChighs lows Nov 17
Stock prices
Dow-Jones Industrial 3413.21 6/1/92 2144.64 3193.32 3284.36 -3.78 53.14 2.85NYSE Composite 240.24 12/8/92 154.00 231.09 238.02 -.92 54.56 3.00AMEX Composite 418.99 2/12/92 305.24 384.29 390.66 -6.76 27.98 1.66NASDAQ (OTC) 667.12 12/8/92 378.56 627.07 650.75 -2.45 71.90 3.78Wilshire 4278.27 12/8/92 2718.59 4101.16 4232.63 -1.07 55.69 3.21
1/ One-day quotes except as noted.2/ Average for two-week reserve maintenance period
closest to date shown. Last observation is averageto date for maintenance period endingDecember 23. 1992.
3/ Secondary market.4/ Bid rates for Eurodollar
deposits at 11 a.m. London time.5/ Based on one-day Thursday quotes
and futures market index changes.6/ Quotes for week ending
Friday previous to date shown.
.91 .08
.43 -.03
.16 -.10
.15 -.11
.21 -.18

Selected Interest Rates*
Statement Week AveragesShort-Term
1989 1990 1991 1992Long-Term
1993Percent
Primary Fixed-RateMortgage
--1 11
-- t 10
30-Year T-Bond . * I
1989 1990 1991 1992 1993
Friday weeks are plotted through December 11 statement weeks through December 9, 1992.
11
Percent
11/17 11/24 12/1 12/8 12/151992 Percent
Corporate Bond(Weekly)
"............. -.
Primary Fixed-RateMortgage(Weekly)
30-Year T-Bond(Daily)
.1 1 I tIr I I I 2
11/17 11/24 12/11992
12/8 1 .12/8 12/1S
•A
DOMESTIC FINANCIAL DEVELOPMENTS
The federal funds rate has remained around 3 percent over the
intermeeting period, and other short-term rates have registered
mixed changes. Likely responding in part to increased supply,
yields on Treasury bills have risen slightly. One-month private
rates rose sharply around December 1st, as maturity dates crossed
year-end, but have declined somewhat since then. Most 3- to 6-month
private rates have fallen, probably reflecting lessened year-end
pressures and perceptions of reduced credit risk as the economy
strengthened. Bond rates rose in the first part of the intermeeting
period on evidence of a more robust economy, but they have declined
about 10 basis points on balance, partly because concerns have
diminished about the odds of a deficit-expanding fiscal package next
year. Stock prices have risen between 2 and 4 percent in the
intermeeting period; most of the major indexes--with the notable
exception of the Dow-Jones Industrials--set record highs in early
December.
Private borrowing appears to have picked up in the fourth
quarter. In the household sector, consumer installment credit
registered a further slight increase in October. In addition, it
seems likely that home mortgage debt will accelerate because of
increased home sales and some liquification of home equity in
refinancing transactions. Short-term borrowing by nonfinancial
businesses was strong in November, as outstanding commercial paper
grew rapidly and business loans at banks also advanced; part of the
pickup in short-term borrowing, however, reflected a shift from bond
markets. Overall, borrowing by nonfinancial firms thus probably has
been limited, but this is a substantial change from the slight
declines recorded in the second and third quarters. Equity issuance
in the fourth quarter continues near its reduced third-quarter pace.
III-1
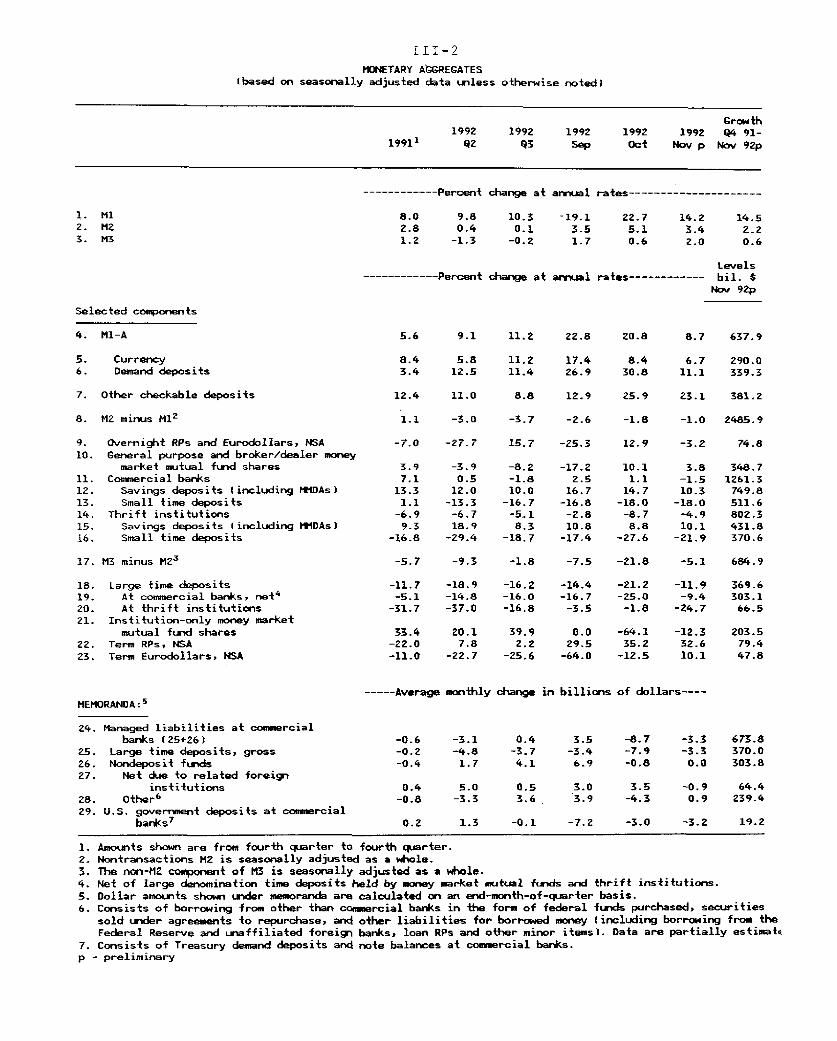
III-2
MONETARY AGGREGATES(based on seasonally adjusted data unless otherwise noted)
Growth1992 1992 1992 1992 1992 Q4 91-
1991 1 Q2 Q3 Sep Oct Nov p Nov 92p
------------ Percent change at annual rates--------------------
8.0 9.8 10.3 -19.1 22.7 14.2 14.52.8 0.4 0.1 3.5 5.1 3.4 2.21.2 -1.3 -0.2 1.7 0.6 2.0 0.6
------------ Percent change at annualLevels
rates--------- bil. $Nov 92p
Selected components
4. Ml-A
5. Currency6. Demand deposits
7. Other checkable deposits
8. M2 minus M1 2
9. Overnight RPs and Eurodollars, NSA10. General purpose and broker/dealer money
market mutual fund shares11. Commercial banks12. Savings deposits (including MMDAs)13. Small time deposits14. Thrift institutions15. Savings deposits (including MMDAs)
16. Small time deposits
17. M3 minus M2 3
18. Large time deposits19. At commercial banks, net
4
20. At thrift institutions21. Institution-only money market
mutual fund shares22. Term RPs, NSA23. Term Eurodollars, NSA
MEMORANDA:5
24. Managed liabilities at commercialbanks (25+26)
25. Large time deposits, gross
26. Nondeposit funds27. Net due to related foreign
institutions
28. Other6
29. U.S. government deposits at commercialbanks
7
5.6 9.1 11.2 22.8 20.8 8.7 637.9
8.4 5.8 11.2 17.4 8.4 6.7 290.03.4 12.5 11.4 26.9 30.8 11.1 339.3
12.4 11.0 8.8 12.9 25.9 23.1 381.2
1.1 -3.0 -3.7 -2.6 -1.8 -1.0 2485.9
-7.0 -27.7 15.7 -25.3 12.9 -3.2 74.8
3.9 -3.9 -8.2 -17.2 10.1 3.8 348.77.1 0.5 -1.8 2.5 1.1 -1.5 1261.313.3 12.0 10.0 16.7 14.7 10.3 749.81.1 -13.3 -16.7 -16.8 -18.0 -18.0 511.6
-6.9 -6.7 -5.1 -2.8 -8.7 -4.9 802.39.3 18.9 8.3 10.8 8.8 10.1 431.8
-16.8 -29.4 -18.7 -17.4 -27.6 -21.9 370.6
-5.7 -9.3 -1.8 -7.5 -21.8 -5.1 684.9
-11.7 -18.9-5.1 -14.8
-31.7 -37.0
33.4-22.0-11.0
20.17.8
-22.7
-16.2-16.0-16.8
39.92.2
-25.6
-14.4 -21.2-16.7 -25.0-3.5 -1.8
0.029.5-64.0
-64.135.2
-12.5
-11.9-9.4
-24.7
-12.332.610.1
369.6303.1
66.5
203.579.447.8
---- Average monthly change in billions of dollars----
-0.6 -3.1 0.4 3.5 -8.7
-0.2 -4.8 -3.7 -3.4 -7.9-0.4 1.7 4.1 6.9 -0.8
-3.3 673.8-3.3 370.00.0 303.8
0.4 5.0 0.5 3.0 3.5 -0.9 64.4-0.8 -3.3 3.6 3.9 -4.3 0.9 239.4
0.2 1.3 -0.1 -7.2 -3.0 -3.2 19.2
1. Amounts shown are from fourth quarter to fourth quarter.2. Nontransactions M2 is seasonally adjusted as a whole.3. The non-MZ component of M3 is seasonally adjusted as a whole.4. Net of large denomination time deposits held by money market mutual funds and thrift institutions.5. Dollar amounts shown under memoranda are calculated on an end-month-of-quarter basis.6. Consists of borrowing from other than commercial banks in the form of federal funds purchased, securities
sold under agreements to repurchase, and other liabilities for borrowed money (including borrowing from theFederal Reserve and unaffiliated foreign banks, loan RPs and other minor items). Data are partially estimati
7. Consists of Treasury demand deposits and note balances at commercial banks.p - preliminary
1. Ml2. H23. M3
III-3
Gross issuance of bonds by state and local governments cooled off in
November, after three strong months. In contrast, federal borrowing
has risen more than seasonally to finance a large fourth-quarter
deficit.
M2 growth fell back a bit in November while M3 growth increased
somewhat. M2 and M3 in November were both somewhat below their
annual growth cones. 1 Data for early December point to a weak
month for both aggregates.
Monetary Aggregates and Bank Credit
The slowing of M2 growth in November, to a 3-1/2 percent annual
rate, mainly reflected a sharp deceleration in demand deposits,
which owed partly to a backup in money market rates and to a slowing
in the rate of increase in mortgage refinancing activity. Other
checkable deposit (OCD) growth remained robust, with about half of
its increase stemming from reclassification of large
time deposits as OCDs. M2 growth for the fourth quarter appears to
be below that of nominal income, which would produce the seventh
successive quarterly increase in M2 velocity. Despite the slowing
in M2, growth in M3 picked up a bit in November, as the contraction
of institution-only money funds abated and runoffs of large time
deposits at banks slowed.
In November, bank credit, boosted again by loan growth,
expanded at a 4-3/4 percent pace. As loan growth has picked up,
banks' security acquisitions have run well below the torrid pace set
earlier this year. Business loans expanded at a 5-1/4 percent rate
in November, the third consecutive advance after a series of runoffs
dating back to late 1991. Last month's business loan growth likely
was boosted by the slowdown in junk bond and equity issuance and by
efforts to lock in year-end financing; however, perhaps half of it
1. Growth in the monetary and debt aggregates in 1992 isdiscussed in the appendix.
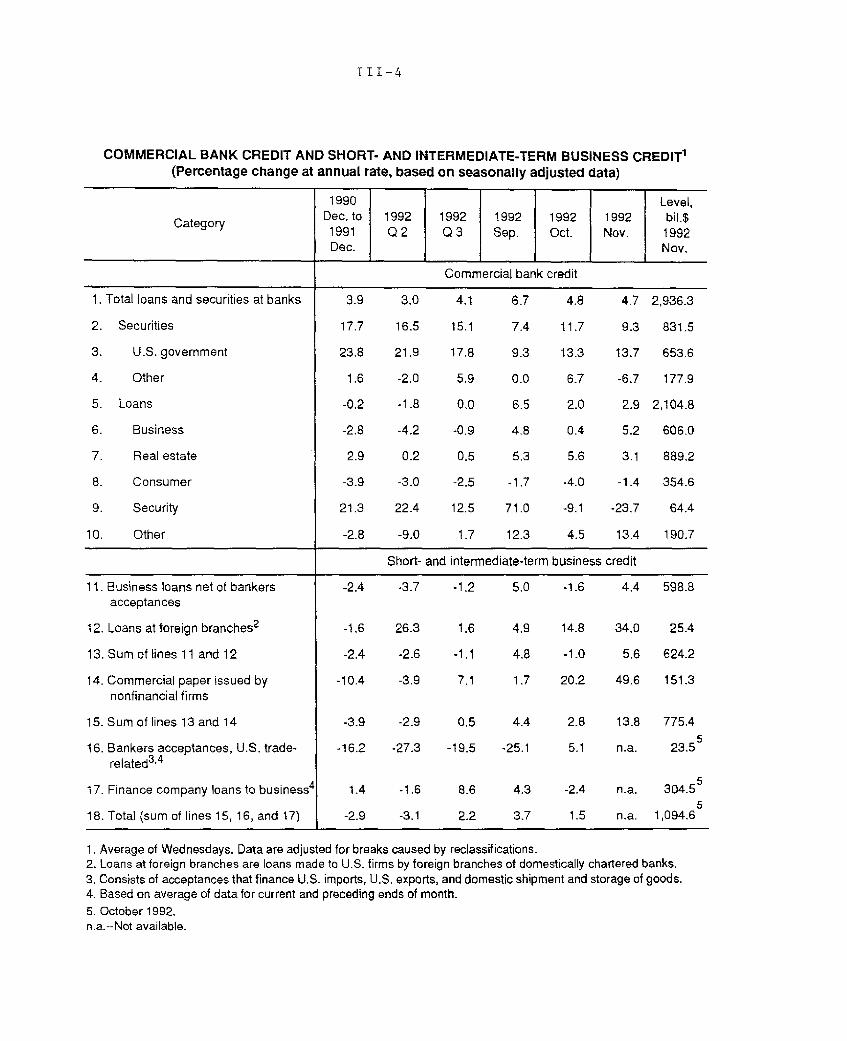
III-4
COMMERCIAL BANK CREDIT AND SHORT- AND INTERMEDIATE-TERM BUSINESS CREDIT 1
(Percentage change at annual rate, based on seasonally adjusted data)
1990 Level,Category Dec. to 1992 1992 1992 1992 1992 bil.$
1991 Q2 Q3 Sep. Oct. Nov. 1992Dec. Nov.
Commercial bank credit
1. Total loans and securities at banks 3.9 3.0 4.1 6.7 4.8 4.7 2,936.3
2. Securities 17.7 16.5 15.1 7.4 11.7 9.3 831.5
3. U.S. government 23.8 21.9 17.8 9.3 13.3 13.7 653.6
4. Other 1.6 -2.0 5.9 0.0 6.7 -6.7 177.9
5. Loans -0.2 -1.8 0,0 6.5 2.0 2.9 2,104.8
6. Business -2.8 -4.2 -0.9 4.8 0.4 5.2 606.0
7. Real estate 2.9 0.2 0.5 5.3 5.6 3.1 889.2
8. Consumer -3.9 -3.0 -2.5 -1.7 -4.0 -1.4 354.6
9. Security 21.3 22.4 12.5 71.0 -9.1 -23.7 64.4
10. Other -2.8 -9.0 1.7 12.3 4.5 13.4 190.7
Short- and intermediate-term business credit
11. Business loans net of bankers -2.4 -3.7 -1.2 5.0 -1.6 4.4 598.8acceptances
12. Loans at foreign branches 2 -1.6 26.3 1.6 4.9 14.8 34.0 25.4
13. Sum of lines 11 and 12 -2.4 -2.6 -1.1 4.8 -1.0 5.6 624.2
14. Commercial paper issued by -10.4 -3.9 7.1 1.7 20.2 49.6 151.3nonfinancial firms
15. Sum of lines 13 and 14 -3.9 -2.9 0.5 4.4 2.8 13.8 775.45
16. Bankers acceptances, U.S. trade- -16.2 -27.3 -19.5 -25.1 5.1 n.a. 23.5related 3 ,4
17. Finance company loans to business4 1.4 -1.6 8.6 4.3 -2.4 n.a. 304.5 55
18. Total (sum of lines 15, 16, and 17) -2.9 -3.1 2.2 3.7 1.5 n.a. 1,094.6
1. Average of Wednesdays. Data are adjusted for breaks caused by reclassifications.2. Loans at foreign branches are loans made to U.S. firms by foreign branches of domestically chartered banks.3. Consists of acceptances that finance U.S. imports, U.S. exports, and domestic shipment and storage of goods.4. Based on average of data for current and preceding ends of month.5. October 1992.n.a.--Not available.

III-5
resulted from drawdowns on a line of credit by a single nonfinancial
firm experiencing difficulty in the commercial paper market. Real
estate loans continued their moderate rate of expansion in November,
with all of the growth occurring at domestic banks. Foreign-related
institutions, whose real estate lending is mainly to the commercial
sector, ran down their portfolios slightly.
The quality of bank loan portfolios continued to improve in the
third quarter. Call report data showed delinquency rates for the
major categories of loans declining further, although they remained
high (chart). Delinquency rates for real estate loans peaked in
1991 in most regions of the country, but they continued to rise in
the West. ABA data on the percentage of delinquent closed-end
consumer loans confirmed the downward trend of the call report data,
but delinquency rates for credit card debt moved up. Call report
data on net charge-off rates for business and consumer loans in the
third quarter were below recent peaks. Net charge-off rates for
real estate loans, however, continued to rise, largely because of
heavier write-offs of commercial mortgages.
As banks have improved their capital positions in 1992, through
higher retained earnings and market sales of debt and equity, the
proportion of total loans held at adequately and well-capitalized
banks has risen substantially (table). Since December 1991, the
share of loans at institutions classified as well capitalized under
FDICIA has nearly doubled, the share at adequately capitalized banks
has been halved, and the share at under capitalized banks has
drifted toward insignificance.
Improvements in capital positions have affected deposit and
loan growth at banks this year. About half of the large commercial
2. The table, which is based solely on capital ratios, overstatessomewhat the share of loans held by banks that are officiallyclassified in the adequately and well-capitalized groups becauseexaminers can downgrade a bank with a poor CAMEL rating.
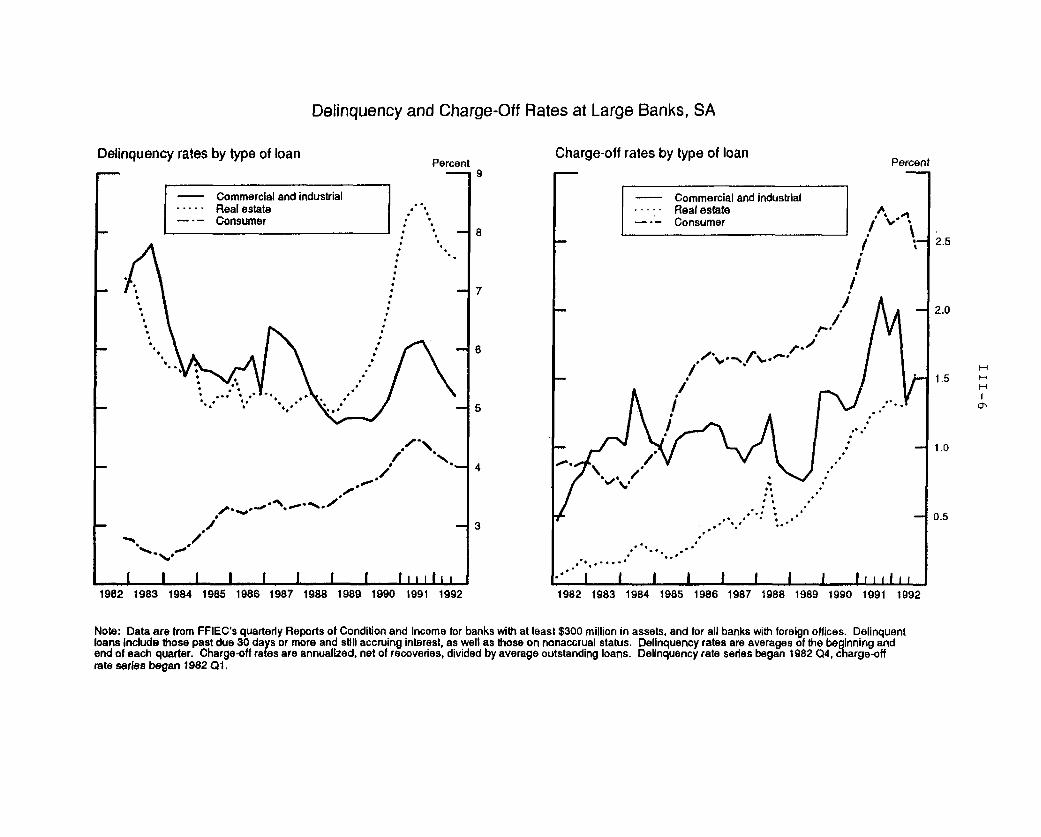
Delinquency and Charge-Off Rates at Large Banks, SA
Delinquency rates by type of loanPercent
- Commercial and industrial-.... Real estate
--- Consumer_ .
. 1
12 /
I I I I I I I I II iIit1982 1983 1984 1985 1986 1987 1988 1989 1990 1991 1992
Charge-off rates by type of loanPercent
2.5
2.0
HI1.5 i
1.0
0.5
Note: Data are from FFIEC's quarterly Reports of Condition and Income for banks with at least $300 million in assets, and for all banks with foreign offices. Delinquentloans include those past due 30 days or more and still accruing interest, as well as those on nonaccrual status. Delinquency rates are averages of the beginning andend of each quarter. Charge-off rates are annualized, net of recoveries, divided by average outstanding loans. Delinquency rate series began 1982 Q4, charge-offrate series began 1982 Q1.

III-7
DISTRIBUTION OF BANK LOANS BY CAPITAL STATUS OF THE BANK(percent)
Capital StatusShare on call date:
Dec 91 SMar 92 Jun 92
Well capitalized
Adequatelycapitalized
Under capitalized
39.9
50.2
10.0
49.9
43.7
6.4
61.5
36.3
2.2
75.2
23.4
1.4
MEDIAN CHANGE IN GROWTH RATES AT LARGE COMMERCIAL BANKS(growth in 1992 Q3 relative to growth in 1992 HI)
(annual rate, percentage points)
Capital position in June 1992
Capital positionin December 1991 Did not improve Improved
M2 deposit growth* Under 1.2 3.5* Adequate 3.4 7.5
Securities growth* Under 30.0 -1.3* Adequate -0.1 0.0
Loan growth* Under -0.9 4.4* Adequate 1.8 3.5
Sep 92I
III-8
banks that were undercapitalized in December 1991 improved their
capital positions by June 1992, with most becoming adequately
capitalized. Growth of M2 deposits at these banks stepped up in the
third quarter by 3-1/2 percentage points, relative to the growth
rate in the first half of the year. Banks that improved from
adequately capitalized to well capitalized posted an even larger
acceleration, 7-1/2 percentage points. Similarly, banks that
improved their capital zones relied on securities acquisitions less
and on loan growth more than banks that did not improve. Only banks
that had been undercapitalized in December 1991 and remained so in
June 1992 had a higher pace of acquisitions of securities and a
slower rate of loan growth in the third quarter than in the first
half of the year.
Corporate Securities Markets
Pressures related to the year-end began to emerge in money
market rates in the first week of November, about a month earlier
than in 1990 and 1991. Market participants cited several factors
for this earlier onset: the length of the year-end period, less
willingness by investors to hold paper backed by Japanese banks,
concern about GMAC and other large direct issuers, and potential
restraints on bank lending resulting from the more stringent capital
tests imposed by FDICIA. As many borrowers reportedly have
accomplished their funding objectives, the implied turn-of-the year
forward rates have eased noticeably recently--but they remain well
above the 3 percent federal funds rate.
While the desire to lock in funding over year-end probably
contributed to the nearly 50 percent annual rate of growth of
commercial paper outstanding in November, another important
influence was the departure of borrowers from long-term debt markets
amid a backup in long-term rates that began in October and continued
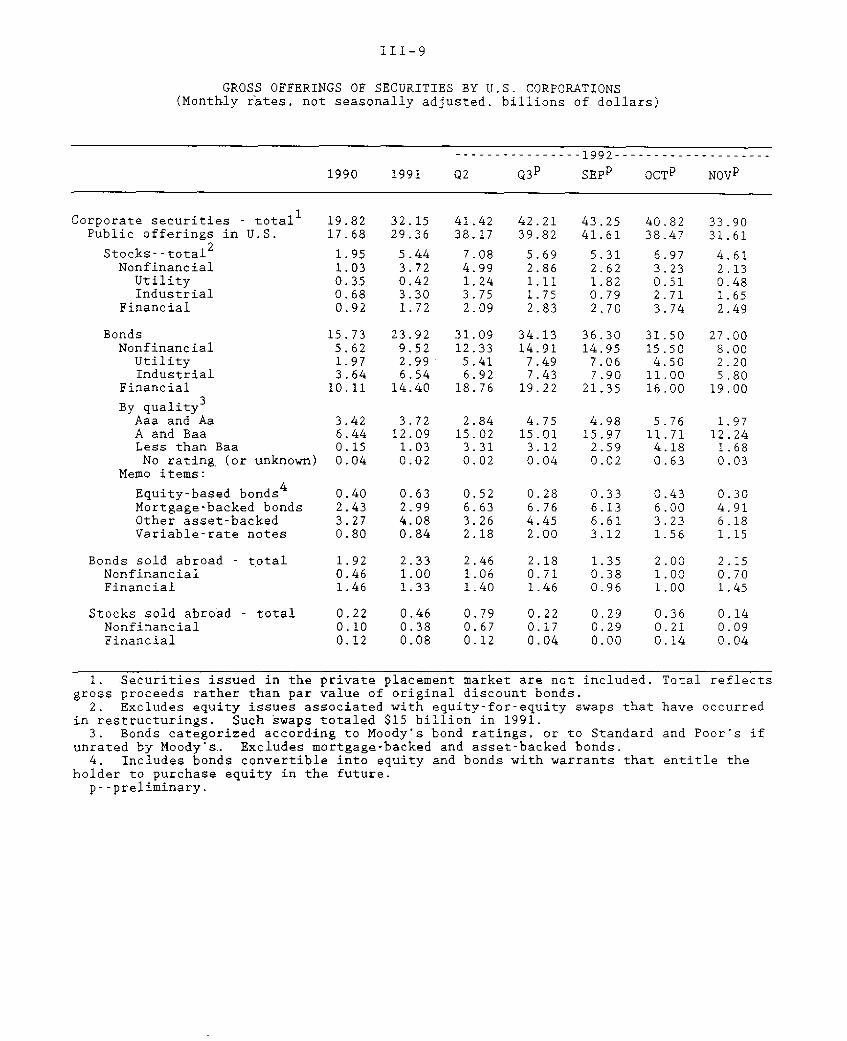
III-9
GROSS OFFERINGS OF SECURITIES BY U.S. CORPORATIONS(Monthly rates, not seasonally adjusted, billions of dollars)
-----. ..-------- 1992-------------------
1990 1991 Q2 Q3p SEPp OCT p NOVp
Corporate securities - total 1 19.82 32.15 41.42 42.21 43.25 40.82 33.90Public offerings in U.S. 17.68 29.36 38.17 39.82 41.61 38.47 31.61
Stocks--total 2 1.95 5.44 7.08 5.69 5.31 6.97 4.61Nonfinancial 1.03 3.72 4.99 2.86 2.62 3.23 2.13
Utility 0.35 0.42 1.24 1.11 1.82 0.51 0.48Industrial 0.68 3.30 3.75 1.75 0.79 2.71 1.65
Financial 0.92 1.72 2.09 2.83 2.70 3.74 2.49
Bonds 15.73 23.92 31.09 34.13 36.30 31.50 27.00Nonfinancial 5.62 9.52 12.33 14.91 14.95 15.50 8.00
Utility 1.97 2.99 5.41 7.49 7.06 4.50 2.20Industrial 3.64 6.54 6.92 7.43 7.90 11.00 5.80
Financial 10.11 14.40 18.76 19.22 21.35 16.00 19.00
By quality 3
Aaa and Aa 3.42 3.72 2.84 4.75 4.98 5.76 1.97A and Baa 6.44 12.09 15.02 15.01 15.97 11.71 12.24Less than Baa 0.15 1.03 3.31 3.12 2.59 4.18 1.68No rating (or unknown) 0.04 0.02 0.02 0.04 0.02 0.63 0.03
Memo items:
Equity-based bonds 4 0.40 0.63 0.52 0.28 0.33 0.43 0.30Mortgage-backed bonds 2.43 2.99 6.63 6.76 6.13 6.00 4.91Other asset-backed 3.27 4.08 3.26 4.45 6.61 3.23 6.18Variable-rate notes 0.80 0.84 2.18 2.00 3.12 1.56 1.15
Bonds sold abroad - total 1.92 2.33 2.46 2.18 1.35 2.00 2.15Nonfinancial 0.46 1.00 1.06 0.71 0.38 1.00 0.70Financial 1.46 1.33 1.40 1.46 0.96 1.00 1.45
Stocks sold abroad - total 0.22 0.46 0.79 0.22 0.29 0.36 0.14Nonfinancial 0.10 0.38 0.67 0.17 0.29 0.21 0.09Financial 0.12 0.08 0.12 0.04 0.00 0.14 0.04
1. Securities issued in the private placement market are not included. Total reflectsgross proceeds rather than par value of original discount bonds.2. Excludes equity issues associated with equity-for-equity swaps that
in restructurings. Such swaps totaled $15 billion in 1991.3. Bonds categorized according to Moody's bond ratings, or to Standard
unrated by Moody's.. Excludes mortgage-backed and asset-backed bonds.4. Includes bonds convertible into equity and bonds with warrants that
holder to purchase equity in the future.p--preliminary.
have occurred
and Poor's if
entitle the

III-10
through mid-November. Public offerings of bonds by nonfinancial
investment-grade firms were only about $6.5 billion in November
compared with $11.5 billion in October. The decline in long rates
beginning in late November has sparked a rebound in issuance this
month.
Despite record stock prices and extremely high average P-E
ratios, equity issuance by nonfinancial firms slowed in November,
but appeared to be picking up some in the early weeks of December.
In particular, IPOs, which had been slow since June, showed signs in
December of returning to the faster pace recorded in the spring of
this year.
Two major finance companies experienced difficulties in the
intermeeting period. GMAC faced higher borrowing costs in light of
questions about GM's financial health. A week before Thanksgiving,
GMAC announced that it would no longer finance vehicles not produced
by GM, and market participants took this announcement as indicating
that the company was having difficulties raising funds in capital
markets. Shortly thereafter, Moody's downgraded GMAC's senior long-
term debt rating from A2 to Baal and its commercial paper rating
from P-1 to P-2. Westinghouse Electric, already under fire from
investors for losses at Westinghouse Credit, announced that it would
liquidate its credit subsidiary and take an additional $2.3 billion
pre-tax charge against its loan portfolio. With this announcement
Westinghouse's share price rose 25 percent, because investors
believed that the firm was leaving its major problem behind.
Investor concern and downgrades had already forced Westinghouse to
replace most of its commercial paper by drawing on bank lines.
November's heavy issuance of asset-backed securities has
carried over into December. Thus far, $5.8 billion have been sold
after offerings of $6.2 billion in November. The market continued

III-11
to be receptive to innovative transactions and to offerings sold by
infrequent issuers. For example, Chrysler Financial successfully
sold an auto-loan-backed issue with a tranche that carried a final
maturity of one year and thus was eligible for purchase by money
market mutual funds under SEC Rule 2a-7. Demand also was strong for
auto-loan-backed debt issued for Honda Motor Credit, which was in
the market for the first time. On the other hand, the market has
demanded a premium for new GMAC issues, as the company has already
issued $11 billion of auto-loan-backed securities this year.
The set of assets securitizable in the public market is
expected to grow in 1993 because of the SEC's adoption of a new rule
exempting structured financings from the Investment Company Act of
1940. As a result securities backed by instruments such as small
business loans, Medicare receivables, and high-yield bonds,
available to date only in the private placement market or abroad,
are expected to be introduced to the public markets in the near
future.
Treasury and Sponsored Agency Financing
The staff projects that the federal government's $128 billion
fourth-quarter deficit will be financed largely by $75 billion of
marketable borrowing and by a $42 billion drawdown in the cash
balance. To date in the fourth quarter, the Treasury has increased
the gross sizes of the weekly bill auctions from $20.4 billion to
$24.8 billion and gross sizes of coupon auctions by as much as $500
million. Further increases in both bill and coupon auction sizes
are likely.
An announcement by Argentina that it would purchase directly
from the Treasury the zero-coupon securities required to defease the
principal of its restructured debt was widely anticipated and had
little effect on Treasury bond yields. Spreads over Treasuries of

III-12
TREASURY AND AGENCY FINANCING1
(Total for period; billions of dollars)
1992
Q3 Q 4p Oct. Nov.p Dec.p
Treasury financing
Total surplus/deficit (-) -62.4 -128.1 -48.9 -37.2 -42.0
Means of financing deficit:
Net cash borrowingfrom the public 77.0 79.7 -1.6 62.1 19.2
Marketable borrowings/repayments (-) 72.6 75.2 -2.5 59.7 18.0
Bills 16.1 22.6 -6.5 17.2 11.9Coupons 56.4 52.7 4.0 42.5 6.1
Nonmarketable 4.4 4.5 .9 2.3 1.2
Decrease in the cashbalance -11.7 42.3 39.4 -7.3 10.2
Memo: Cash balanceat end of period 58.8 16.5 19.4 26.7 16.5
2Other -2.8 6.1 11.0 -17.5 12.6
Federally sponsored creditagencies, net cash
borrowing3 17.0 -- 3.3
FHLBs 4.8 -- 1.6
FHLMC 4.3 -- -2.6
FNMA 6.2 -- 4.5
Farm Credit Banks 0.9 -- -.2
SLMA .7 - - -- -
FAMC4 .0 -- -. 0
1. Data reported on a not seasonally adjusted, payment basis.
2. Includes checks issued less checks paid, accrued items and other
transactions.3. Excludes mortgage pass-through securities issued by FNMA and FHLMC.
4. Federal Agricultural mortgage Corporation,
p--projected.Note: Details may not add to totals due to rounding.

III-13
intermediate-maturity debt instruments of GSEs widened 8 to 10 basis
points over the intermeeting period, in part because Federal Home
Loan banks stopped paying down their outstanding debt, as advances
to members began growing after a long period of runoffs.
As of early December the Treasury had about $120 billion of
leeway for net new debt issuance under the $4.15 trillion debt
ceiling. The debt ceiling likely will be reached late during the
first quarter of 1993.
Municipal Securities
Municipal bond yields were pushed lower in recent weeks by a
drop in gross issuance from its recent torrid pace. The prospect of
$9 billion in bond redemptions in January 1993, representing more
than 1 percent of the outstanding stock, also nudged yields
downward. In addition, market reports suggested increased interest
in tax-exempt securities by high-income individuals, in anticipation
of higher personal income tax rates under the Clinton
administration. Both new capital and refunding issuance fell in
November, reaching the lowest levels since early in the year.
Nonetheless, about $90 billion of refunding debt has been sold thus
far in 1992, a rate of issuance that is more than 30 percent faster
than the previous record, set in 1986, and which may have nearly
exhausted the pool of issues that can be refunded profitably at
current yields. 3
Some issuers have sold municipal bonds with transferable call
options, a device that allows an issuer to reap the benefits of a
refunding without actually calling the old bond and incurring the
cost of issuing a new bond. If interest rates were to fall so that
a refunding became attractive, the issuer could sell the call
3. Recent revisions by IDD, the source for municipal volume data,have boosted reported refunding issuance for 1992. The rapid paceof refundings in 1986 owed to falling interest rates and anticipatedlimits on the number of pre-refundings.

III-14
GROSS OFFERINGS OF MUNICIPAL SECURITIES(Monthly rates, not seasonally adjusted, billions of dollars)
1992 1992
1990 1991 Q1 Q2 Q3 Sep. Oct. p Nov.p
Total offerings 1 13.49 16.60 17.80 24.35 25.09 23.33 23.67 15.05
Total tax-exempt 13.24 16.18 17.26 23.61 24.65 29.06 23.06 14.61Long-term2 10.26 12.84 15.53 19.31 18.62 18.70 21.09 14.13
Refundings 1.68 3.11 6.18 8.52 8.60 8.20 7.33 6.10New capital 8.58 9.73 9.35 10.79 10.02 10.50 13.76 8.03
Short-term 2.96 3.39 1.73 4.29 6.03 10.36 1.97 .48Total taxable .25 .42 .55 .75 .44 .39 .61 .44
p--preliminary.1. Includes issues for public and private purposes.2. Includes all refunding bonds, not just advance refundings.
option, either to the current holders of the bonds or to other
investors desiring to hedge a portfolio of callable bonds. The
issuer of the option would receive cash about equal to the present
value of the interest savings that could have been achieved by
refunding the bond. This feature was very attractive to issuers
(such as those constrained to one refunding per issue by the Tax
Reform Act of 1986) that could not refund through traditional means.
Nearly $2 billion of debt with these call options has been sold
since Paine-Webber pioneered their use in April 1992. Recently the
first sale of the options themselves took place when Georgia Utility
sold call options on a general obligation issue; most of the calls
reportedly were purchased by mutual funds.
Prices of municipal bonds backed by the guaranteed investment
contracts (GICs) of Executive Life Insurance Company, which failed
in April 1991, jumped after a ruling by the California state court
of appeals. The court ruled that holders of the nearly $2 billion
in GICs shared with regular Executive Life policyholders the right
to pursue claims on company assets. The municipal GICs were viewed
as annuities that could be classified as insurance products under
California law.

III-15
Mortgage Markets
Commitment rates on thirty-year, fixed-rate mortgages were down
about 10 basis points over the intermeeting period, while those on
adjustable-rate mortgages rose about 25 basis points. ARM rates
stood at their highest level since mid-July, but their initial rate
advantage over FRMs was still 270 basis points. In the past, when
spreads were this wide, ARMs accounted for over two-thirds of
conventional loan closings, but for much of this year they have
accounted for less than one-quarter of conventional originations
(chart).
Through the first three quarters of 1992, relatively low ARM
volume did not prevent ARM-backed securities from picking up
substantially, versus the same period a year ago. Private conduits
accounted for 40 percent of new ARM-backed securities issued through
September 1992 (table), reflecting securitizations by the RTC
(classified as private because they lack a government guarantee), a
few California-based thrifts, and other channels. The agencies
accounted for the remaining 60 percent. Gross issuance of FRM-
backed pass-throughs by the agencies rose to a record $42 billion in
October, reflecting heavy issuance by Fannie Mae and Freddie Mac.
Intermediate-term mortgages continued to account for around
40 percent of agency pass-through issuance.
Borrowers have seen substantial benefits from the reduction in
mortgage interest rates. Staff estimates, based on the change over
the past two years in the average interest rate for the stock of
residential mortgage debt outstanding in December 1990, suggest as
much as $35 billion in annual interest savings on fixed- and
adjustable-rate mortgages combined. This estimate is essentially
the change in the average cost of carry for mortgage debt existing
at the end of 1990. Some of the savings may, of course, be offset

III-16
ARM Share vs. FRM-ARM Initial Rate Spread
St\-\( \ FRM-ARM Initial Rate Spread
50 1-
Oct.
1985 1986 1987 1988 1989 1990 1991 1992
MORTGAGE-BACKED SECURITY ISSUANCE(Monthly averages, billions of dollars. NSA unless noted)
Pass-through securitiesFederal Agency Private
Total Fixed- ARM- Fixed- ARM-(SA) Rate backed Rate backed
Multiclass securitiesPrivate FNMAissues1 REMICs
FHLMC AgencyREMICs REMICs
10.214.117.220.4
29.136.830.0
29.831.641.9
2.32.72.42.0
.3
.71.42.5
2.0 4.9 2.03.6 5.4 1.63.2 6.1 2.3
3.0 4.1 2.53.5 7.5 2.73.5 4.4 2.4
6.88.4
11.518.4
23.533.936.1
36.732.441.5
5.01.62.43.0
4.8 11.16.6 13.96.8 16.7
8.0 15.06.1 15.46.0 19.0
1. Excludes pass-through securities with senior/subordinated structures.p--preliminary r--revised n.a.--not available
Percent
Monthly
8asis Points--
-1 400
-1 320
Ii;l tlrllllrlrr rtllllr1984
1988198919901991
1992-Q1Q2Q3
1992-Aug.Sep.Oct.
13.717.721.726.2
34.249.240.2
37.144.251.7
.93.23.46.0
n.a..3.6.9
.6
.91.1
.81.13.0
7.012.411.5
12.99.9
13.5
· _·____I·_·_·_·____ ___________~~~_____ ______~_~_~_~_~_ _~~~_~______
vse t-

III-17
initially by the transactions costs (points, taxes, and fees)
involved in refinancing, which can be significant.
Evidence on the quality of real estate loan portfolios was
mixed. As mentioned above, delinquency rates at commercial banks
declined in the third quarter. However, data from the Mortgage
Bankers Association (MBA) on the number of delinquent loans
indicated that the overall delinquency rate on home mortgages rose
slightly in the third quarter. These data, from a survey of 330
mortgage servicers, showed that the deterioration primarily was in
loans 90 or more days overdue, as the 30-day and 60-day delinquency
rates fell slightly. Despite the small increase, the overall
delinquency rate remained below its 1991 average. Delinquency rates
on commercial mortgages, reported by the American Council of Life
Insurance, fell in the third quarter for the first time in two
years, but remained at a fairly high level.
Fragmentary data suggest that fourth-quarter growth of mortgage
credit will outstrip the estimated 2 percent pace for the third
quarter. In that quarter, multifamily and commercial mortgage debt
contracted at annual rates of 3-1/2 and 7-1/2 percent, respectively,
but single-family mortgage and farm mortgage debt grew at annual
rates of 5 and 1-1/4 percent, respectively.
Consumer Credit
Consumer installment credit outstanding inched up at a 1/2
percent annual rate in October, down from a 2-1/2 percent rate in
September. The October increase was dominated by a strong advance
in revolving credit, which more than offset continued weakness in
the auto and other categories. While weak, auto loans did not
decline in September and October; after contractions in the
outstanding stock of auto loans over the past two years, even small
amounts of new auto lending now tend to exceed the volume of

TOTAL CONSUMER INSTALLMENT CREDIT OUTSTANDING(YEAR TO YEAR PERCENT CHANGES)
Percent45
!~ - 40
-i35
25
1-41- 20
10*~8 *i: *'I *i~i~i ~ a~ 83 i~i~ ~ Q ·" 8i +
:f~ ~fl 0
1962 1967 1972j-I 519921977 1982 19871952 1957

III-19
repayments flowing from the reduced stock. Total consumer credit
(installment plus noninstallment) declined at a 3 percent annual
rate in October.
CONSUMER CREDIT(Seasonally adjusted)
Memo:Out-
Percent change standings(at annual rate) $(billion)
1992 1992 1992
19891 1990 1991 HI Q3r Sept. r Oct.p Oct. p
Installment 5.8 2.6 -1.0 -1.3 -.5 2.4 .4 722.3
Auto 1.4 -2.4 -7.6 -4.3 .1 2.1 .1 257.4Revolving 15.2 11.9 8.9 3.8 4.2 9.5 7.9 251.7Other 4.2 .8 -2.3 -3.5 -6.3 -5.4 -8.1 213.3
Non-installment 3.9 -3.5 -10.0 13.0 8.2 3.4 -46.1 55.2
Total 5.6 2.1 -1.7 -.4 .2 2.5 -3.1 777.5
1. Growth rates are adjusted for discontinuity in data betweenDecember 1988 and January 1989.
r--revised, p--preliminary.Note: Details may not add to totals due to rounding.
Despite its recent increases, outstanding consumer installment
credit in October remained below its year-earlier level (chart).
The extended weakness in this cycle is unprecedented in the past 42
years. Indeed, there have been only two prior periods of negative
year-over-year changes (1958 and 1980-81), both of which were
considerably shorter in duration. The first followed the short, but
severe, 1957-58 recession, while the second followed the imposition
of credit controls in the first half of 1980. The current episode
of contraction contrasts with historical experience this far into a
recovery and undoubtedly reflects in part the paydown of relatively
expensive debt with low-yielding liquid assets.
Interest rates on consumer loans continued to decline in the
most recent months but remained at relatively wide spreads compared
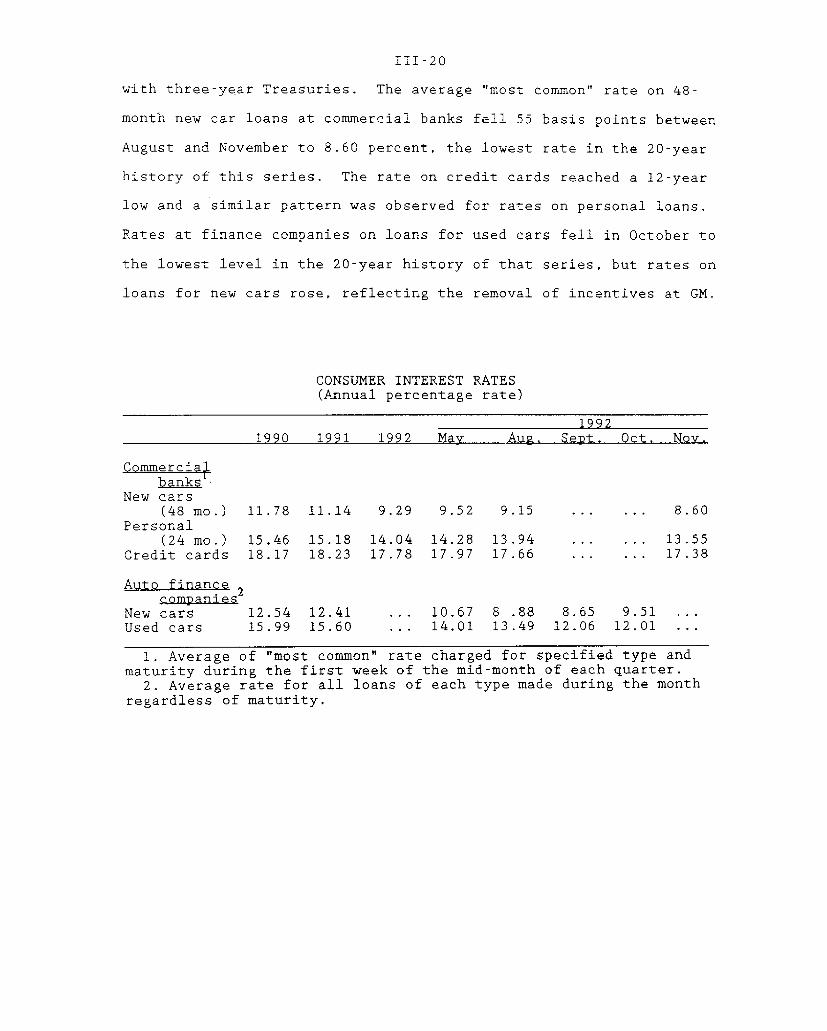
III-20
with three-year Treasuries. The average "most common" rate on 48-
month new car loans at commercial banks fell 55 basis points between
August and November to 8.60 percent, the lowest rate in the 20-year
history of this series. The rate on credit cards reached a 12-year
low and a similar pattern was observed for rates on personal loans.
Rates at finance companies on loans for used cars fell in October to
the lowest level in the 20-year history of that series, but rates on
loans for new cars rose, reflecting the removal of incentives at GM.
CONSUMER INTEREST RATES(Annual percentage rate)
19921990 1991 1992 May Aug. Sept. Oct. Nov.
Commercialbanks
New cars(48 mo.) 11.78 11.14 9.29 9.52 9.15 .. ... 8.60
Personal(24 mo.) 15.46 15.18 14.04 14.28 13.94 .... . . 13.55
Credit cards 18.17 18.23 17.78 17.97 17.66 ... ... 17.38
Auto financecompanies
New cars 12.54 12.41 ... 10.67 8 .88 8.65 9.51 ...Used cars 15.99 15.60 ... 14.01 13.49 12.06 12.01 ...
1. Average of "most common" rate charged for specified type andmaturity during the first week of the mid-month of each quarter.
2. Average rate for all loans of each type made during the monthregardless of maturity.
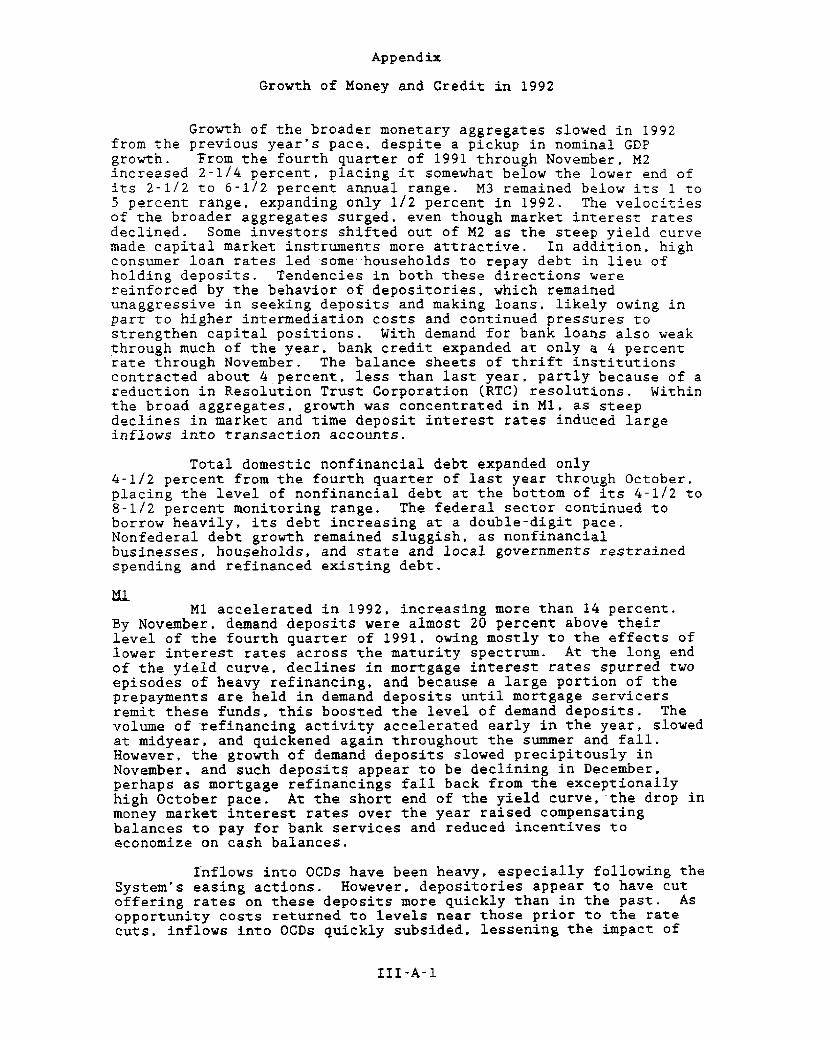
Appendix
Growth of Money and Credit in 1992
Growth of the broader monetary aggregates slowed in 1992from the previous year's pace, despite a pickup in nominal GDPgrowth. From the fourth quarter of 1991 through November, M2increased 2-1/4 percent, placing it somewhat below the lower end ofits 2-1/2 to 6-1/2 percent annual range. M3 remained below its 1 to5 percent range, expanding only 1/2 percent in 1992. The velocitiesof the broader aggregates surged, even though market interest ratesdeclined. Some investors shifted out of M2 as the steep yield curvemade capital market instruments more attractive. In addition, highconsumer loan rates led some households to repay debt in lieu ofholding deposits. Tendencies in both these directions werereinforced by the behavior of depositories, which remainedunaggressive in seeking deposits and making loans, likely owing inpart to higher intermediation costs and continued pressures tostrengthen capital positions. With demand for bank loans also weakthrough much of the year. bank credit expanded at only a 4 percentrate through November. The balance sheets of thrift institutionscontracted about 4 percent, less than last year, partly because of areduction in Resolution Trust Corporation (RTC) resolutions. Withinthe broad aggregates, growth was concentrated in M1, as steepdeclines in market and time deposit interest rates induced largeinflows into transaction accounts.
Total domestic nonfinancial debt expanded only4-1/2 percent from the fourth quarter of last year through October,placing the level of nonfinancial debt at the bottom of its 4-1/2 to8-1/2 percent monitoring range. The federal sector continued toborrow heavily, its debt increasing at a double-digit pace.Nonfederal debt growth remained sluggish, as nonfinancialbusinesses, households, and state and local governments restrainedspending and refinanced existing debt.
M1Ml accelerated in 1992, increasing more than 14 percent.
By November, demand deposits were almost 20 percent above theirlevel of the fourth quarter of 1991, owing mostly to the effects oflower interest rates across the maturity spectrum. At the long endof the yield curve, declines in mortgage interest rates spurred twoepisodes of heavy refinancing, and because a large portion of theprepayments are held in demand deposits until mortgage servicersremit these funds, this boosted the level of demand deposits. Thevolume of refinancing activity accelerated early in the year, slowedat midyear, and quickened again throughout the summer and fall.However, the growth of demand deposits slowed precipitously inNovember, and such deposits appear to be declining in December,perhaps as mortgage refinancings fall back from the exceptionallyhigh October pace. At the short end of the yield curve, the drop inmoney market interest rates over the year raised compensatingbalances to pay for bank services and reduced incentives toeconomize on cash balances.
Inflows into OCDs have been heavy, especially following theSystem's easing actions. However, depositories appear to have cutoffering rates on these deposits more quickly than in the past. Asopportunity costs returned to levels near those prior to the ratecuts, inflows into OCDs quickly subsided, lessening the impact of
III-A-1
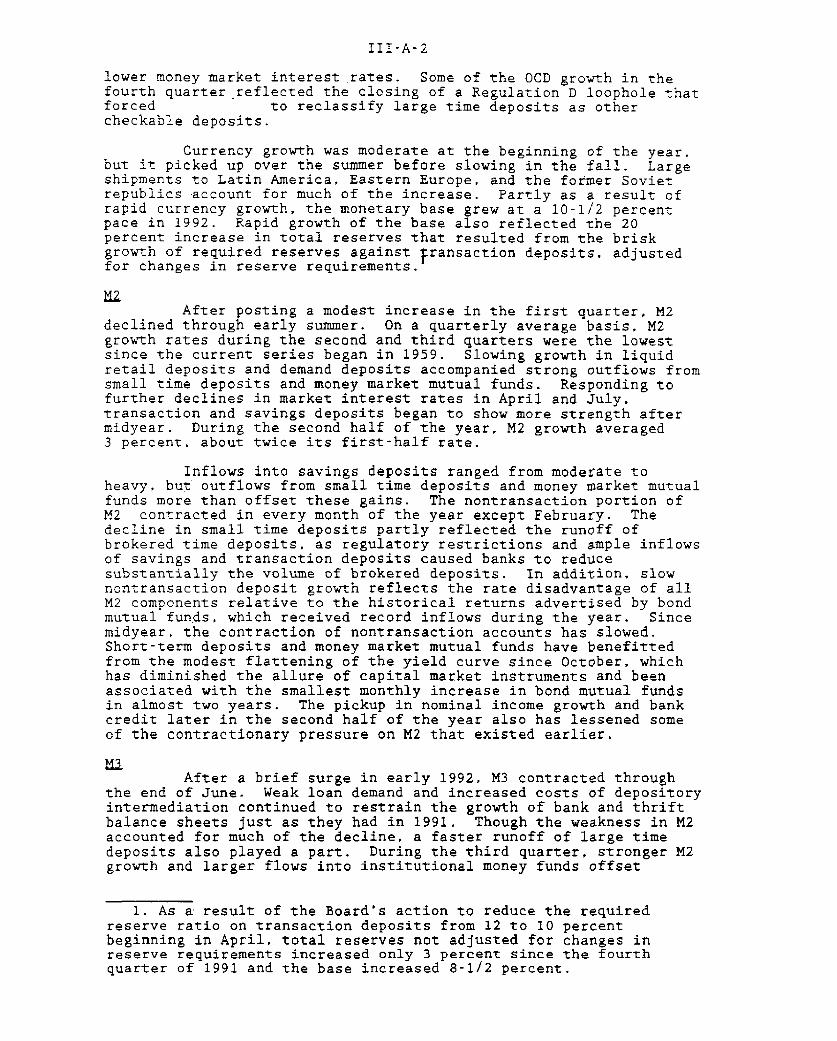
III-A-2
lower money market interest rates. Some of the OCD growth in thefourth quarter reflected the closing of a Regulation D loophole thatforced to reclassify large time deposits as othercheckable deposits.
Currency growth was moderate at the beginning of the year,but it picked up over the summer before slowing in the fall. Largeshipments to Latin America, Eastern Europe, and the former Sovietrepublics account for much of the increase. Partly as a result ofrapid currency growth, the monetary base grew at a 10-1/2 percentpace in 1992. Rapid growth of the base also reflected the 20percent increase in total reserves that resulted from the briskgrowth of required reserves against transaction deposits, adjustedfor changes in reserve requirements.
M2After posting a modest increase in the first quarter, M2
declined through early summer. On a quarterly average basis, M2growth rates during the second and third quarters were the lowestsince the current series began in 1959. Slowing growth in liquidretail deposits and demand deposits accompanied strong outflows fromsmall time deposits and money market mutual funds. Responding tofurther declines in market interest rates in April and July,transaction and savings deposits began to show more strength aftermidyear. During the second half of the year, M2 growth averaged3 percent, about twice its first-half rate.
Inflows into savings deposits ranged from moderate toheavy, but outflows from small time deposits and money market mutualfunds more than offset these gains. The nontransaction portion ofM2 contracted in every month of the year except February. Thedecline in small time deposits partly reflected the runoff ofbrokered time deposits, as regulatory restrictions and ample inflowsof savings and transaction deposits caused banks to reducesubstantially the volume of brokered deposits. In addition, slownontransaction deposit growth reflects the rate disadvantage of allM2 components relative to the historical returns advertised by bondmutual funds, which received record inflows during the year. Sincemidyear, the contraction of nontransaction accounts has slowed.Short-term deposits and money market mutual funds have benefittedfrom the modest flattening of the yield curve since October, whichhas diminished the allure of capital market instruments and beenassociated with the smallest monthly increase in bond mutual fundsin almost two years. The pickup in nominal income growth and bankcredit later in the second half of the year also has lessened someof the contractionary pressure on M2 that existed earlier.
After a brief surge in early 1992, M3 contracted throughthe end of June. Weak loan demand and increased costs of depositoryintermediation continued to restrain the growth of bank and thriftbalance sheets just as they had in 1991. Though the weakness in M2accounted for much of the decline, a faster runoff of large timedeposits also played a part. During the third quarter, stronger M2growth and larger flows into institutional money funds offset
1. As a result of the Board's action to reduce the requiredreserve ratio on transaction deposits from 12 to 10 percentbeginning in April, total reserves not adjusted for changes inreserve requirements increased only 3 percent since the fourthquarter of 1991 and the base increased 8-1/2 percent.
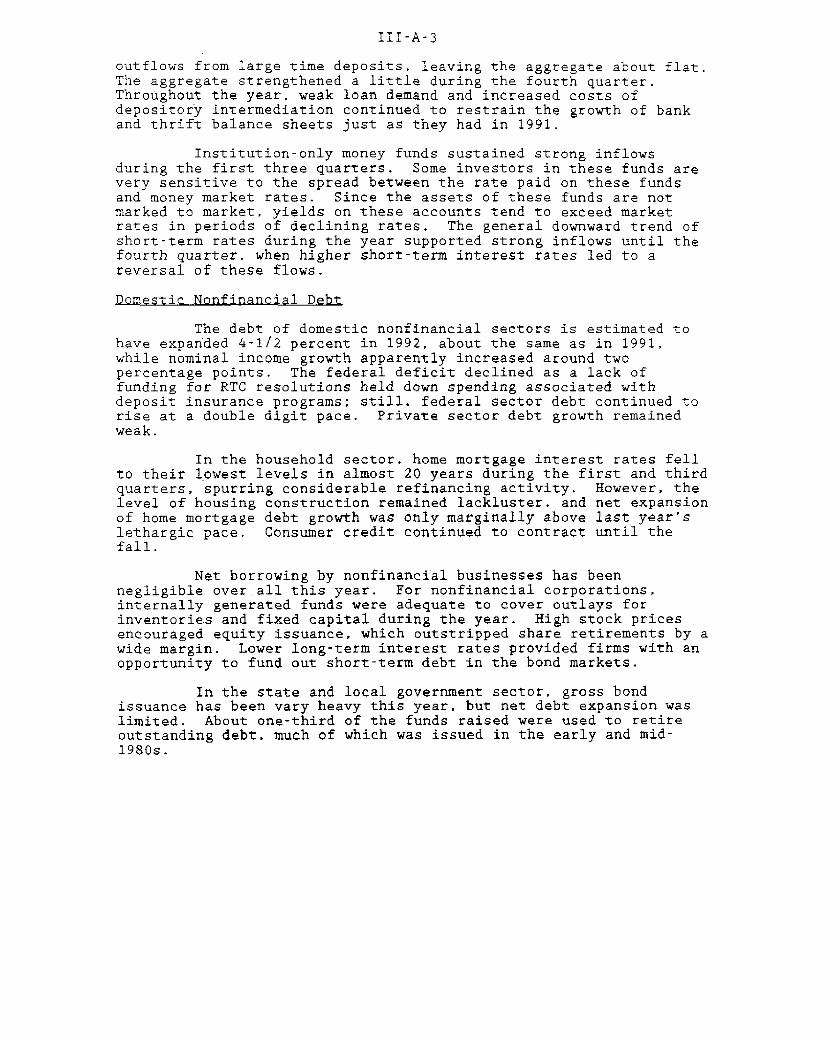
III-A-3
outflows from large time deposits, leaving the aggregate about flat.The aggregate strengthened a little during the fourth quarter.Throughout the year, weak loan demand and increased costs ofdepository intermediation continued to restrain the growth of bankand thrift balance sheets just as they had in 1991.
Institution-only money funds sustained strong inflowsduring the first three quarters. Some investors in these funds arevery sensitive to the spread between the rate paid on these fundsand money market rates. Since the assets of these funds are notmarked to market, yields on these accounts tend to exceed marketrates in periods of declining rates. The general downward trend ofshort-term rates during the year supported strong inflows until thefourth quarter, when higher short-term interest rates led to areversal of these flows.
Domestic Nonfinancial Debt
The debt of domestic nonfinancial sectors is estimated tohave expanded 4-1/2 percent in 1992, about the same as in 1991,while nominal income growth apparently increased around twopercentage points. The federal deficit declined as a lack offunding for RTC resolutions held down spending associated withdeposit insurance programs; still, federal sector debt continued torise at a double digit pace. Private sector debt growth remainedweak.
In the household sector, home mortgage interest rates fellto their lowest levels in almost 20 years during the first and thirdquarters, spurring considerable refinancing activity. However, thelevel of housing construction remained lackluster, and net expansionof home mortgage debt growth was only marginally above last year'slethargic pace. Consumer credit continued to contract until thefall.
Net borrowing by nonfinancial businesses has beennegligible over all this year. For nonfinancial corporations,internally generated funds were adequate to cover outlays forinventories and fixed capital during the year. High stock pricesencouraged equity issuance, which outstripped share retirements by awide margin. Lower long-term interest rates provided firms with anopportunity to fund out short-term debt in the bond markets.
In the state and local government sector, gross bondissuance has been vary heavy this year, but net debt expansion waslimited. About one-third of the funds raised were used to retireoutstanding debt, much of which was issued in the early and mid-1980s.
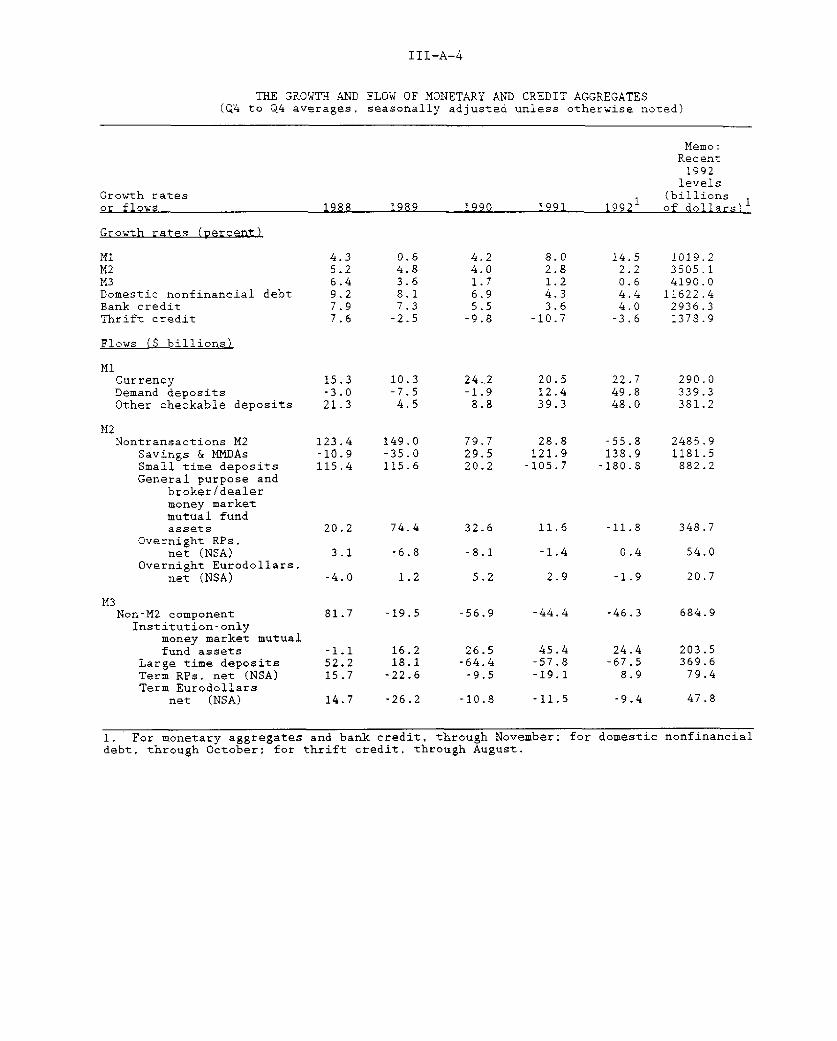
III-A-4
THE GROWTH AND FLOW OF MONETARY AND CREDIT AGGREGATES(Q4 to Q4 averages, seasonally adjusted unless otherwise noted)
Memo:Recent1992
levelsGrowth rates (billionsor flows 1988 1989 1990 1991 1992 of dollars)
Growth rates (percent)
M1M2M3Domestic nonfinancial debtBank creditThrift credit
0.64.83.68.17.3-2.5
4.24.01.76.95.5-9.8
8.02.81.24.33.6
-10.7
14.52.20.64.44.0-3.6
1019.23505.14190.011622.42936.31378.9
Flows ($ billions)
CurrencyDemand depositsOther checkable deposits
M2Nontransactions M2
Savings & MMDAsSmall time depositsGeneral purpose and
broker/dealermoney marketmutual fundassets
Overnight RPs.net (NSA)
Overnight Eurodollars,net (NSA)
M3Non-M2 component
Institution-onlymoney market mutualfund assets
Large time depositsTerm RPs, net (NSA)Term Eurodollars
net (NSA)
15.3-3.021.3
123.4-10.9115.4
20.2
3.1
-4.0
10.3-7.54.5
149.0-35.0115.6
74.4
-6.8
1.2
81.7 -19.5
-1.152.215.7
14.7
16.218.1
-22.6
-26.2
domestic nonfinancial
24.2-1.98.8
79.729.520.2
32.6
-8.1
5.2
-56.9
26.5-64.4-9.5
-10.8
20.512.439.3
28.8121.9105.7
11.6
-1.4
2.9
-44.4
45.4-57.8-19.1
-11.5
22.749.848.0
-55.8138.9180.8
-11.8
0.4
-1.9
-46.3
24.4-67.5
8.9
-9.4
290.0339.3381.2
2485.91181.5882.2
348.7
54.0
20.7
684.9
203.5369.679.4
47.8
1. For monetary aggregates and bank credit, through November; fordebt, through October; for thrift credit, through August.

INTERNATIONAL DEVELOPMENTS

INTERNATIONAL DEVELOPMENTS
Merchandise Trade
The U.S. merchandise trade deficit narrowed slightly in
September to $8.3 billion (seasonally adjusted, Census basis),
compared with $8.9 billion (revised) in August. A 7 percent
increase in exports outweighed a 4 percent rise in imports. The
increase in exports was largely in capital goods (particularly
computers and semiconductors, and to a lesser extent other
machinery). Nearly half of the rise in imports was in consumer
goods; the rest of the increase was spread among the other major
trade categories. Data for October will be released December 17 and
will be included in the Greenbook supplement.
U.S. MERCHANDISE TRADE: MONTHLY DATA(Billions of dollars, seasonally adjusted. Census basis)
Exports ImportsTotal Ag. NonAg. Total Oil NonOil Balance
1992-Jan 35.5 3.6 31.9 41.3 3.6 37.6 -5.8Feb 37.7 3.7 33.9 40.9 3.3 37.6 -3.3Mar 37.1 3.5 33.6 42.7 3.4 39.2 -5.6
Apr 36.4 3.8 32.7 43.5 4.0 39.5 -7.1May 35.7 3.3 32.4 42.9 4.2 38.7 -7.1Jun 38.2 3.5 34.7 44.9 4.8 40.1 -6.7
Jul 37.8 3.9 33.9 45.1 4.8 40.3 -7.3Aug 35.8 3.6 32.2 44.7 4.6 40.2 -8.9Sep 38.2 4.0 34.2 46.5 4.8 41.7 -8.3
Source: U.S. Department of Commerce, Bureau of the Census.
In the third quarter, the trade deficit widened to $106 billion
at an annual rate (BOP basis) from $98 billion annual rate in the
second quarter. Exports increased 3 percent while imports rose 4
percent.
The growth in exports in the third quarter was the first
increase recorded since the fourth quarter of last year. The
IV-1

IV-2
MAJOR TRADE CATEGORIES(Billions of dollars. BOP basis. SAAR)
Year 1991 1992 _ Change1991 Q3 Q4 Q1 Q2 Q3 Q3-Q3 Q3-Q2
Trade Balance -73.4 -80.7 -74.2 -68.9 -98.2 -106.2 -25.5 -7.9
Total U.S. Exports 416.0 416.6 431.4 431.8 429.9 443.2 26.6 13.4
Agric. Exports 40.1 40.7 43.2 43.3 41.9 46.4 5.7 4.5Nonagric. Exports 375.8 375.9 388.2 388.5 388.0 396.8 20.9 8.9
Industrial Suppl. 101.8 100.5 100.0 99.7 100.3 103.2 2.7 2.9Gold 3.6 3.4 3.6 3.8 3.5 3.7 0.2 0.2Fuels 14.3 12.7 14.7 13.9 13.5 13.4 0.7 -0.0Other Ind. Suppl. 83.9 84.3 81.8 82.1 83.3 86.1 1.8 2.8
Capital Goods 167.0 166.7 176.3 176.4 173.9 174.6 7.8 0.7Aircraft & Parts 36.4 35.4 40.8 42.6 37.7 33.3 -2.1 -4.4Computers & Parts 27.3 26.8 27.9 27.4 28.6 29.0 2.2 0.4Other Machinery 103.3 104.5 107.5 106.4 107.6 112.2 7.8 4.6
Automotive Goods 40.0 43.7 41.7 42.9 46.2 49.0 5.3 2.8To Canada 22.8 25.0 23.1 20.8 23.7 24.5 -0.5 0.8To Other 17.5 18.7 18.6 22.1 22.5 24.5 5.8 2.0
Consumer Goods 45.9 44.9 48.2 47.9 48.5 51.4 6.5 2.9Other Nonagric. 21.0 20.1 22.1 21.5 19.1 18.6 -1.5 -0.4
Total U.S. Imports 489.4 497.3 505.6 500.7 528.1 549.4 52.1 21.3
Oil Imports 51.2 52.5 48.8 41.5 51.7 56.9 4.4 5.1Non-Oil Imports 438.2 444.8 456.8 459.2 476.4 492.5 47.7 16.2
Industrial Suppl. 83.9 80.0 83.3 84.3 88.3 88.0 8.0 -0.3Gold 2.9 2.3 3.1 2.3 3.6 2.8 0.5 -0.8Other Fuels 3.9 3.8 4.8 4.4 4.6 4.4 0.6 -0.2Other Ind. Suppl. 77.1 73.9 75.4 77.7 80.1 80.8 6.9 0.7
Capital Goods 120.7 121.3 122.1 125.1 131.4 138.0 16.7 6.6Aircraft & Parts 11.7 12.5 11.5 12.1 13.5 12.3 -0.3 -1.2Computers & Parts 26.1 27.1 26.8 27.7 30.7 33.8 6.8 3.1Other Machinery 82.9 81.7 83.8 85.4 87.2 91.9 10.2 4.7
Automotive Goods 84.9 90.8 88.6 87.8 89.5 91.3 0.5 1.8From Canada 28.8 33.1 30.1 30.9 31.7 33.0 -0.1 1.3From Other 56.2 57.7 58.5 56.9 57.8 58.3 0.6 0.5
Consumer Goods 108.0 109.9 118.7 116.2 119.2 128.5 18.5 9.2Foods 26.5 26.3 26.4 26.8 29.1 28.3 2.0 -0.8All Other 14.1 16.5 17.7 19.0 18.9 18.5 1.9 -0.4
Source: U.S. Department of Commerce, Bureau of Economic Analysis.

IV-3
increase was spread among all major trade categories and primarily
went to developing countries in Latin America and Asia. A sharp
rise in exports to Japan in the third quarter reversed a drop in the
second quarter; exports to Japan in the third quarter were only
slightly higher than in the first quarter. Exports to Western
Europe declined for the second quarter in a row and were at their
lowest level since the third quarter of last year; the largest
declines were to the United Kingdom and France.
Most of the growth in exports in the third quarter was in
quantity, with the largest increases recorded for agricultural
products, computers, and other machinery; there were also strong
increases in exported automotive products and consumer goods.
Aircraft exports declined for the second consecutive quarter from
peak levels reached in the first quarter of this year.
Non-oil imports grew 3-1/2 percent in the third quarter, all in
quantity. Forty percent of the increase was in consumer goods; the
increase was in a wide range of items -- from apparel to toys and
entertainment equipment -- and came primarily from China and various
other developing countries in Asia. The increase in imported
consumer goods in the third quarter was followed by a strong pickup
in U.S. consumer spending in October and November. The remaining
increase in non-oil imports in the third quarter was in capital
goods (especially computers). U.S. domestic sales of computers have
been very strong, fueled by price wars and by a push by U.S.
businesses to upgrade PCs and workstations to take advantage of
improved software. Most of the increased sales were in the low end
of the computer spectrum, items that are often imported. Imports of
machinery other than computers also rose solidly in the third
quarter; the steady increase in these imports throughout 1992
represents the first turnup in these items since 1988 and is

IV-4
consistent with some firming in domestic spending for this
equipment.
Oil Imports
The quantity of oil imports rose sharply in September as stocks
were built up. The volume of oil imports for the third quarter was
almost 0.3 mb/d above the second-quarter rate, the result of
increased consumption and a drop in domestic production that was in
part the result of Hurricane Andrew.
OIL IMPORTS(BOP basis, seasonally adjusted annual rates)
1992 MonthsQ1 02 03 Jun Jul Aug Sep
Value (Bil. $) 41.47 51.73 56.85 57.24 57.56 54.90 58.10Price ($/BBL) 15.27 17.47 18.55 18.81 18.67 18.49 18.47Quantity (mb/d) 7.44 8.11 8.39 8.33 8.44 8.13 8.61
Source: U.S. Department of Commerce, Bureau of Economic Analysis.
Prices of oil imports moved in a narrow range from June through
September, mirroring the stability over a similar period in spot oil
prices. Since the middle of October, spot prices have fallen
roughly $3.00 per barrel on strong production by Saudi Arabia and
Iran, lackluster product demand, and disappointment with the
November OPEC agreement. Spot West Texas Intermediate currently
stands just above $19.00 per barrel. These movements in spot prices
(after accounting for shipping and contract lags) suggest that
import prices should fall to roughly $16.50 per barrel in December.
Prices of Non-oil Imports and Exports
In October, prices of non-oil imports rose 0.3 percent, the
fifth consecutive month of increase. The largest rise was in the
price of imported consumer goods. (Price data for November will be

IV-5
IMPORT AND EXPORT PRICE MEASURES(percent change from previous period, annual rate)
Year Quarters Months1992-Q3 1992 19921991-Q3 Q1 Q2 Q3 Sep Oct
(Quarterly Average, AR) (Monthly Rates)
--------------------- BLS Prices---------------------
Imports. Total 2.8 -1.2 0.8 6.6 0.2 0.6Foods, Feeds, Bev. -1.1 10.0 -15.0 -1.5 0.4 0.3Industrial Supplies 1.8 -15.1 12.1 9.7 0.2 1.1
Ind Supp Ex Oil* 0.4 4.7 -0.5 2.1 0.2 0.2Capital Goods 4.0 4.7 -3.4 8.4 0.7 0.0Automotive Products 2.5 0.9 -2.6 4.6 0.1 0.4Consumer Goods 4.2 6.2 0.3 5.3 -0.1 0.6
Memo:Oil 4.5 -45.0 44.4 25.5 0.1 2.6Non-oil 2.6 4.4 -2.7 4.8 0.2 0.3
Exports. Total 1.0 -1.2 2.0 0.7 0.2 -0.4Foods, Feeds, Bev. -0.4 -1.3 -2.0 -13.6 3.0 -2.6Industrial Supplies 0.2 -6.5 5.5 5.5 -0.3 -0.5Capital Goods 1.4 1.2 0.9 1.2 -0.2 -0.2Automotive Products 1.8 1.6 1.2 1.3 0.2 0.6Consumer Goods 2.6 5.9 1.6 0.3 0.0 0.2
Memo:Agricultural -0.5 -3.3 -1.0 -7.6 1.9 -2.0Nonagricultural 1.2 -1.0 2.7 2.0 -0.1 -0.2
------------ Prices in the NIPA Accounts------------
Fixed-WeightImports, Total 2.5 -4.2 4.8 5.9
Oil 8.0 -48.9 72.1 28.6 -
Non-oil 2.1 -1.8 0.0 4.3
Exports, Total 0.8 -0.7 1.5 0.4Ag -1.0 -4.1 -1.1 -8.2Nonag 1.1 -0.4 1.8 1.8
DeflatorsImports, Total -0.1 -6.9 2.3 2.3
Oil 7.6 -48.6 70.7 26.7Non-oil -0.9 -1.5 -2.3 -0.1
Exports. Total -0.9 -1.1 -1.8 -1.6 -
Ag -1.9 -5.2 -1.6 -5.2Nonag -0.8 -0.7 -1.8 -1.4
*/ Months not for publication.

IV-6
released December 24.) For the third quarter, prices of non-oil
imports rose at about a 4-1/2 percent annual rate. Strong price
increases for imports of capital goods were attributable in part to
the depreciation of the dollar over the summer. Prices of imported
consumer goods and automotive products also rose noticeably in the
third quarter.
Prices of exports have changed little on average in recent
months. Prices of nonagricultural exports decreased slightly in
October (with most of the decrease in industrial supplies and
capital goods) and rose slightly in the third quarter (with
increases in all major categories). Prices of agricultural exports
declined in October as they did in the first three quarters.
U.S. Current Account
The U.S. current account deficit in the third quarter was $57
billion (seasonally adjusted, annual rate), $14 billion smaller than
in the second quarter.
U.S. Current Account(billions of dollars, seasonally adjusted annual rates)
Current Acct BalanceMerchandise Services Investment Transfers Ex SpecialTrade, net net Income, net net Pub. Grants 1/
Years1989 -115.7 25.8 14.3 -25.6 -101.1 -101.11990 -108.9 32.1 19.2 -32.9 -90.4 -87.51991 -73.4 45.3 16.4 8.0 -3.7 -41.0
Quarters1991-1 -73.3 37.4 27.9 56.8 48.8 -37.1
2 -65.6 43.1 15.7 16.5 9.7 -36.23 -80.7 48.1 12.3 -24.0 -44.3 -47.14 -74.2 52.5 9.8 -17.1 -28.9 -43.5
1992-1 -68.9 55.4 17.9 -28.0 -23.6 -25.42-r -98.2 50.6 7.7 -31.2 -71.2 -74.23 -106.2 62.5 14.2 -27.5 -57.0 -57.0
1/ Excludes foreign cash grants to the United States to cover costs ofthe war in the Persian Gulf. These grants amounted to $4.3 billion in1990, $42.6 billion in 1991, and $1.3 billion in 1992; they are shown inthe accounts as positive unilateral transfers. Also excludes specialU.S. grants to foreign countries amounting to $7.2 billion in 1990 and$5.2 billion in 1991.
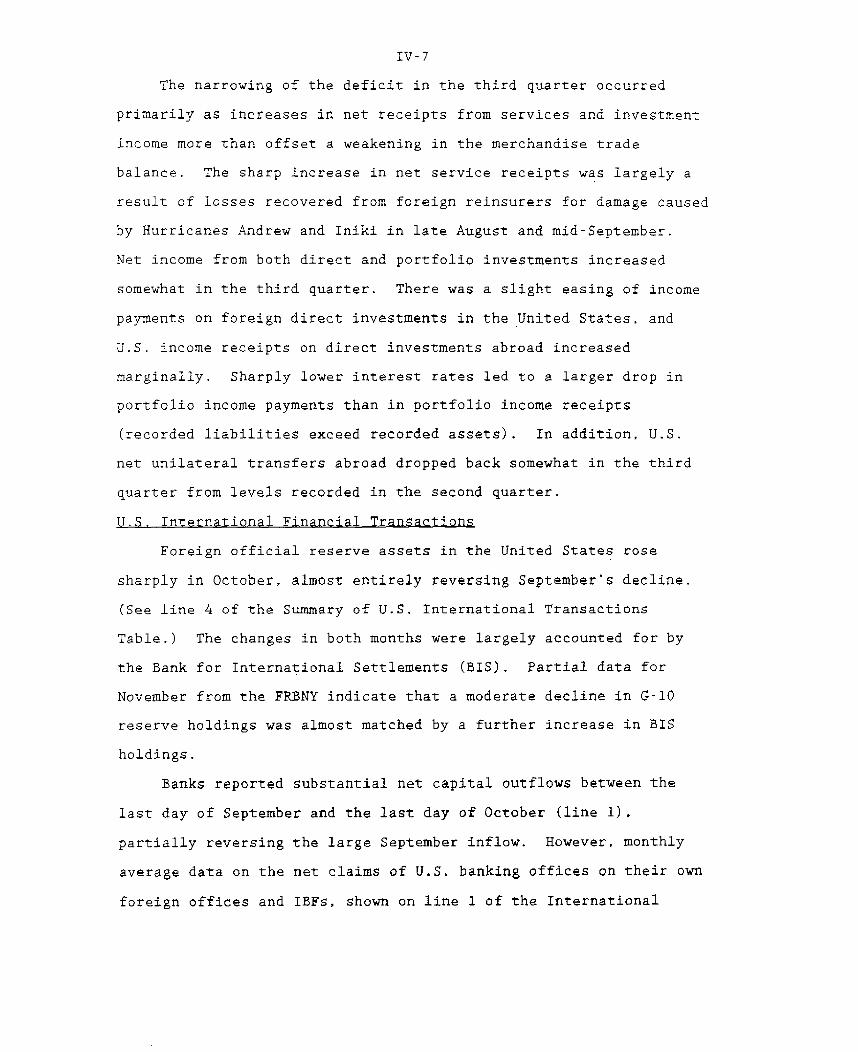
IV-7
The narrowing of the deficit in the third quarter occurred
primarily as increases in net receipts from services and investment
income more than offset a weakening in the merchandise trade
balance. The sharp increase in net service receipts was largely a
result of losses recovered from foreign reinsurers for damage caused
by Hurricanes Andrew and Iniki in late August and mid-September.
Net income from both direct and portfolio investments increased
somewhat in the third quarter. There was a slight easing of income
payments on foreign direct investments in the United States, and
U.S. income receipts on direct investments abroad increased
marginally. Sharply lower interest rates led to a larger drop in
portfolio income payments than in portfolio income receipts
(recorded liabilities exceed recorded assets). In addition, U.S.
net unilateral transfers abroad dropped back somewhat in the third
quarter from levels recorded in the second quarter.
U.S. International Financial Transactions
Foreign official reserve assets in the United States rose
sharply in October, almost entirely reversing September's decline.
(See line 4 of the Summary of U.S. International Transactions
Table.) The changes in both months were largely accounted for by
the Bank for International Settlements (BIS). Partial data for
November from the FRBNY indicate that a moderate decline in G-10
reserve holdings was almost matched by a further increase in BIS
holdings.
Banks reported substantial net capital outflows between the
last day of September and the last day of October (line 1),
partially reversing the large September inflow. However, monthly
average data on the net claims of U.S. banking offices on their own
foreign offices and IBFs, shown on line 1 of the International
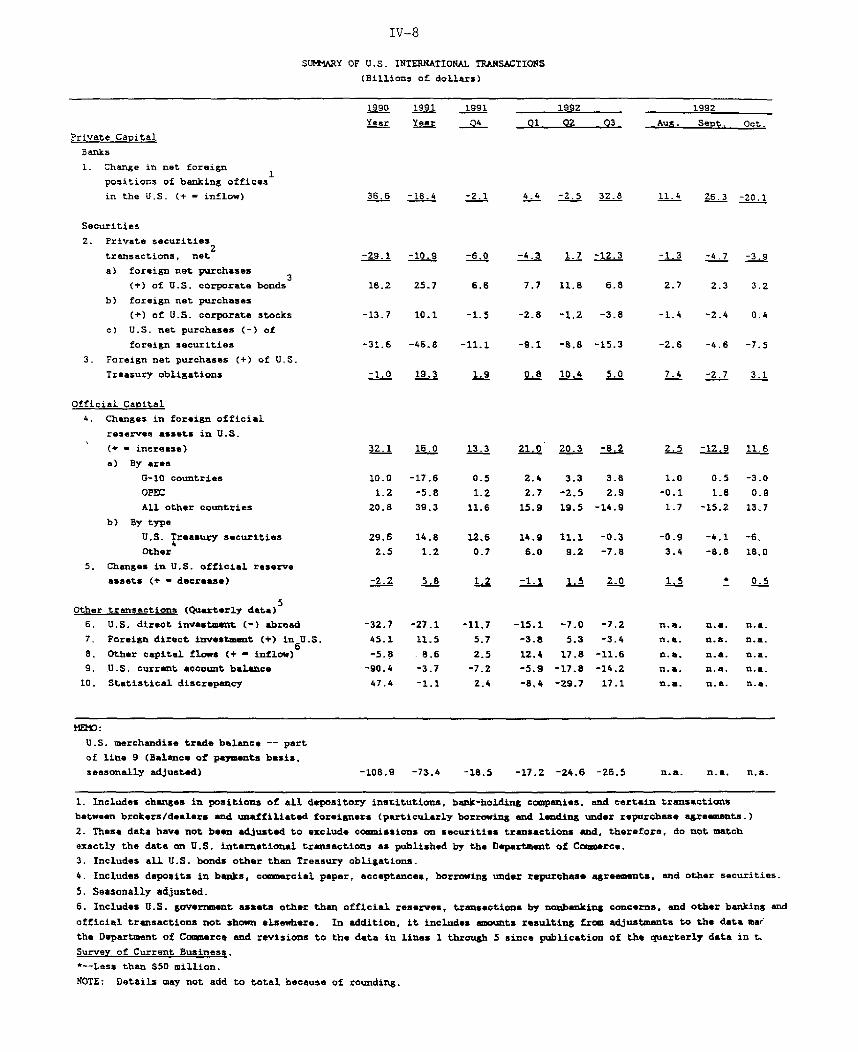
IV-8
SUMMARY OF U.S. INTERNATIONAL TRANSACTIONS
(Billions of dollars)
1990 1991 1991 1992
Year Year Q4 Q1 Q2 03
1992
Aug. Sept. Oct.
Private Capital
Banks
1. Change in net foreign1
positions of banking offices
in the U.S. (+ = inflow)
Securities
2. Private securities2
transactions, net
a) foreign net purchases3
(+) of U.S. corporate bonds
b) foreign net purchases
(+) of U.S. corporate stocks
c) U.S. net purchases (-) of
foreign securities
3. Foreign net purchases (+) of U.S.
Treasury obligations
Official Capital
4. Changes in foreign official
reserves assets in U.S.
(+ - increase)
a) By area
G-10 countries
OPEC
All other countries
b) By type
U.S. Treasury securities4
Other
5. Changes in U.S. official reserve
assets (+ - decrease)
5
Other transactions (Quarterly data)
6. U.S. direct investment (-) abroad
7. Foreign direct investment (+) in U.S.
8. Other capital flows (+ - inflow)
9. U.S. current account balance
10. Statistical discrepancy
36.6 -18.4 -2.1 4.4 -2.5 32.8 11.4 26.3 -20.1
-29.1 -10.9 -6.0 -4.3 1.7 -12.3 -1.3 -4. 7 -3.9
16.2 25.7 6.6 7.7 11.8 6.8
-13.7 10.1 -1.5 -2.8 -1.2 -3.8
-31.6 -46.8 -11.1 -9.1 -. 8 -15.3
-1.0 19.3 1.9 0.8 10.4 5.0
321 1. 13.3 21.0 20.3 -8
10.0 -17.6
1.2 -5.8
20.8 39.3
0.5 2.4 3.3 3.8
1.2 2.7 -2.5 2.9
11.6 15.9 19.5 -14.9
29.6 14.8 12.6 14.9 11.1 -0.3
2.5 1.2 0,7 6.0 9.2 -7.8
2 58 12 -1.1 15 2.0
-32.7
45.1
-5.8
-90.4
47.4
-27.1
11.5
8.6
-3.7
-1.1
-11.7
5.7
2.5
-7.22.4
-15.1
-3.8
12.4-5.9
-8,4
-7.0
5.3
17.8
-17.8
-29.7
2.7 2.3 3.2
-1.4 -2.4 0.4
-2.6 -4.6 -7.5
7.4 -2.7 3.1
2.5 -12.9 11.6
1.0 0.5
-0.1 1.8
1.7 -15.2
-0.9 -4.1 -6,
3.4 -8.8 18,0
* 0.5
-7.2-3.4
-11.6
-14.2
17.1
MEMO:
U.S. merchandise trade balance -- part
of Line 9 (Balance of payments basis,
seasonally adjusted) -108.9 -73.4 -18.5 -17.2 -24.6 -26.5 n.a. n.a, n.a.
1. Includes changes in positions of all depository institutions, bank-holding companies, and certain transactions
between brokers/dealers and unaffiliated foreigners (particularly borrowing and lending under repurchase agreements.)
2. These data have not been adjusted to exclude conmissions on securities transactions and, therefore, do not matchexactly the data on U.S. international transactions as published by the Department of Cotmerce.3. Includes all U.S. bonds other than Treasury obligations.
4. Includes deposits in banks, coamercial paper, acceptances, borrowing under repurchase agreements, and other securities.
5. Seasonally adjusted.6. Includes U.S. government assets other than official reserves, transactions by nonbanking concerns, and other banking and
official transactions not shown elsewhere. In addition, it includes amounts resulting from adjustments to the data marthe Department of Commerce and revisions to the data in lines 1 through 5 since publication of the quarterly data in t.
Survey of Current Business.*--Less than $50 million.
NOTE: Details may not add to total because of rounding.

IV-9
Banking Data Table, show far less volatility. On a monthly average
basis, net Eurodollar borrowing by foreign-chartered banks (line 1b)
has been increasing since August, a net inflow. These increases
have been concentrated at branches and agencies of non-Japanese
banks and have coincided with asset growth at these banks.
U.S. net purchases of foreign stocks and bonds were very high
in October (line 2c of the Summary of U.S. International
Transactions Table), bringing the total for the first 10 months of
1992 close to the record 1991 pace. Net purchases of equities of
about $4.1 billion in October were concentrated in the United
Kingdom, Switzerland, and Australia. Net bond purchases ($3.4
billion) were concentrated in the United Kingdom and France.
Private foreign net purchases of U.S. bonds were also
substantial in October: $3.1 billion in U.S. Treasury securities
(line 3), $2.6 billion in U.S. government agency bonds, and $0.6
billion in corporate bonds (both included in line 2a). In addition,
foreigners bought U.S. stocks net in October (line 2b), after four
consecutive months of net sales.
Data recently released by BEA for the third quarter are shown
in lines 6 through 10. U.S. direct investment abroad (line 6)
continued strong at more than $7 billion, although the outflow for
the second quarter was revised down from $11 billion to $7 billion.
Foreign direct investment in the United States (line 7) was a net
outflow of $3 billion, largely reflecting outflows on intercompany
accounts and negative reinvested earnings.
The statistical discrepancy in the U.S. international accounts
(line 10) rose to $17 billion in the third quarter, partially
reversing the large negative discrepancy in the accounts in the
first half of the year. A small part of this shift can be explained

INTERNATIONAL BANKING DATA
(Billions of dollars)
1990 1991 1992
Dec. Mar. June Sept. Dec. June July Aug. Sept. Oct. Nov.
1. Net Claims of U.S. Banking
Offices (excluding IBFS) on Own
Foreign Offices and IBFS -31.3 -23.8 -13.7 -14.1 -35.8 -56.8 -56.0 -54.1 -58.0 -61.4 -66.6
(a) U.S.-chartered banks 5.5 7.6 5.4 11.0 12.4 8.3 9.0 11.2 12.7 14.6 13.5
(b) Foreign-chartered banks -36.9 -31.3 -19.2 -25.2 -48.3 -65.1 -65.0 -65.3 -70.9 -76.1 -80.1
2. Credit Extended to U.S.
Nonbank Residents by Foreign
Branches of U.S. Banks 24.7 26.0 23.9 23.7 23.9 24.5 25.1 24.8 24.8 25.1 25.1
3. Eurodollar Holdings of
U.S. Nonbank Residents 1/ 115.1 114,6 105.8 100.8 102.9 91.2 88.2 85.4 84.6 86.7 89.0
1. Includes term and overnight Eurodollars held by money market mutual funds, Note:
overall banking data incorporated in the international transactions accounts. Line 1
These data differ in coverage and timing from the
is an average of daily data reported to the Federal
Reserve by U.S. banking offices.
average of Wednesday data for the
Line 2 is an average of daily data. Line 3
term component.
is an average of daily data for the overnight component and an

IV-11
by an acceleration of shipments of U.S. currency abroad in the third
quarter; no data on increases in foreign holdings of U.S. currency
are included by BEA in the international transactions accounts.
According to confidential data collected by the FRBNY, net currency
shipments amounted to $6.7 billion in the third quarter, compared
with $2.3 billion in the second quarter and $1.7 billion in the
first. In October, net shipments fell to $0.6 billion.
Foreign Exchange Markets
The weighted average foreign exchange value of the dollar in
terms of the other G-10 currencies has declined slightly on balance
since the last meeting and posted a net decline of about 1-1/4
percent. The dollar has declined nearly 3 percent against the mark,
and about 1-1/4 percent against the yen. The dollar had a slight
upward drift for the first half of the period in response to data
showing that the outlook for U.S. economic growth is improving,
while the outlook for economic growth in Japan and Germany is
deteriorating. Towards the end of the period, in thin end-of-year
markets, the dollar gave up its gains. Strong anti-inflation
rhetoric by Bundesbank officials in the latter half of the period
reduced expectations of Bundesbank near-term easing and contributed
to the dollar's decline.
The dominant development in foreign exchange markets during the
period has been an apparent rekindling of exchange rate pressures on
some of those currencies that had unilaterally (Sweden and Norway)
or multilaterally (the Exchange Rate Mechanism countries) tied their
currencies to the other European currencies. On November 19,
following very large sales of foreign currency over the previous
1-1/2 weeks, the Bank of Sweden allowed its currency to float.
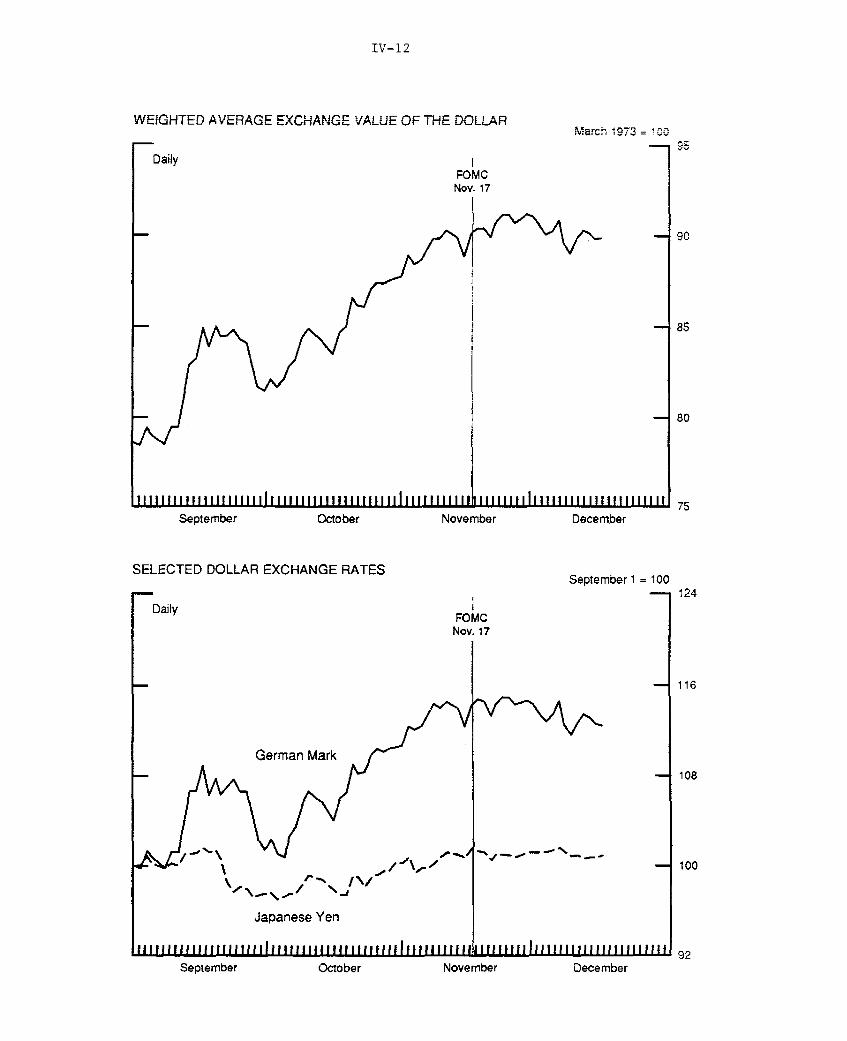
IV-12
WEIGHTED AVERAGE EXCHANGE VALUE OF THE DOLLARMarch 1973 = 100
September October November December
SELECTED DOLLAR EXCHANGE RATESSeptember 1 = 100
October NovemberSeptember December

IV-13
The floating of Sweden's currency placed pressures on the
currencies of Norway and Denmark. Pressures also emerged for the
currencies of Spain, Portugal, and Ireland. These three currencies
were considered prime candidates for devaluation at the beginning of
the period because the floating of the lira and sterling in
September had reduced the competitiveness of their exports, and
because during the previous exchange rate pressures in September
these countries had defended their currencies with capital controls
that, in the case of Spain and Ireland, were expected to be removed
by year-end.
During the intermeeting period, but following Sweden's
floating, three other currencies were either floated or realigned.
The peseta and escudo were devalued 6 percent shortly following the
Swedish action. This devaluation of the peseta is in addition to
its 7 percent devaluation in September. Spain and Portugal also
removed their capital controls during the period. Toward the end of
the period, Norway, , allowed its currency
to float.
The French franc was also under pressure during the period.
Harsh rhetoric by Bundesbank President Schlesinger in which he
indicated that it would be improper to ease German interest rates to
help other countries, and in which he termed ERM intervention at the
limit as destabilizing, contributed to pressures on the franc.
Later, statements by the finance ministers of both countries as well
as statements by Bundesbank officials indicated support for the
franc at its current parities.
Although the currencies of Ireland and Denmark were not
devalued during the period, both currencies experienced intermittent
periods of intense pressure. The last such period was just prior to
the Edinburgh summit, on the possibility that the currencies of both

IV-14
countries would be devalued during the summit. Following the
summit, pressures on these currencies eased.
The Swiss franc appears to have gained on safe-haven concerns
over the turmoil in Europe. During the period, a referendum to join
the European Economic Area was rejected by Swiss voters. Following
the rejection, the Swiss franc advanced against the mark. On
balance, the Swiss franc has appreciated 1-1/4 percent against the
mark during the intermeeting period.
Three-month interest rates in Japan rose 5 basis points during
the intermeeting period while long rates were unchanged. Three-
month rates rose 10 basis points in Germany during the period,
perhaps in part due to the strong anti-inflation rhetoric coming
from Bundesbank officials. Long rates in Germany have stayed firm.
Three-month rates in France have risen just over 150 basis points in
response to the renewed exchange pressures on the French franc.
Sweden's three-month rate has declined 250 basis points to 10-1/4
percent because Sweden no longer needs to maintain high interest
rates to support its currency.
In world equity markets, the Hang Seng index of the Hong Kong
stock market declined 12 percent during the intermeeting period as a
result of a dispute between the United Kingdom and China over
democratic reforms for Hong Kong. This dispute has called into
question the commitment of the Chinese government not to exert
control over Hong Kong's markets. The Swedish stock market rose 21
percent during the intermeeting period. This rally is likely to be
attributable to several factors, including lower interest rates in
Sweden and an increase in the competitiveness of Sweden's exports
following the krona's floating. Also, expectations that the Swedish
currency would soon devalue or float may have deterred investment in
Swedish equities before the devaluation.
IV-15
Developments in Foreign Industrial Countries
Most recent indicators point to continued weakness in the major
foreign industrial countries. In the third quarter, real GDP
(sa.a.r.) declined 1.5 percent in Japan and 1.9 percent in Germany.
In both countries early fourth-quarter data also suggest weak
activity. In France and Canada, real GDP increased in the third
quarter, but only at annual rates of about 1-1/2 percent. In the
United Kingdom, provisional data suggest that real GDP was either
flat or down slightly in the third quarter. With activity weak,
inflation rates generally have continued to trend lower.
Several countries recently announced monetary targets for next
year. The German target for M3, which appears likely to be exceeded
significantly this year, was raised slightly. The French target
also was edged upward, while the Swiss and Italian targets remained
unchanged.
Individual country notes. In Japan, real GDP declined 1.5
percent (s.a.a.r.) in the third quarter, following a downward
revised decline of 0.9 percent in the second quarter. While
consumption rose in the third quarter (up 2.7 percent), plant and
equipment investment showed a further sharp decline (down 8.4
percent). Housing investment was about flat. Government investment
declined 12.3 percent, but this only partially reversed the very
rapid increase of the previous quarter, and on a year-over-year
basis government investment was up 12.8 percent. A reduced pace of
inventory investment made a negative contribution to growth of 0.7
percentage point. Net exports made a 0.3 percent percentage point

REAL GNP AND INDUSTRIAL PRODUCTION IN MAJOR INDUSTRIAL COUNTRIES(Percentage change from previous period, seasonally adjusted) 1
Q4/Q4 Q4/Q41990 1991
1991
Q4
1992 1992-----------------------------
Q1 Q2 Q3 July Aug. Sept. Oct. Nov.Latest 3 months
from year ago 2
Canada
GDPIP
France
GDPIP
WEST GERMANY
GDPIP
Italy
GDPIP
JAPAN
GDPIP
United Kingdom
GDPIP
UNITED STATES
GDPIP
-2.0 -.0-6.3 -1.4
1.5 1.7-.3 1.9
5.8 2.05.4 .3
1.6 1.7-3.8 -.5
4.7 3.06.9 -1.6
-1.0 -1.6-3.1 -. 7
-. 5 .1.3 -. 5
.0 .2 .1 .4-1.1 -.2 .4 n.a.
.1 1.0 .2 .4-. 2 .1 -. 1 n.a.
-. 3 2.0 -. 3 -. 5-1.2 2.8 -2.0 -1.3
.4 .6 .2 n.a.1.1 2.5 -2.8 n.a.
.5 1.0 -.2 -.4-1.2 -3.1 -2.3 .3
-.4 1.9 n.a. n.a. n.a.
.0 .0 n.a. n.a. n.a.
-.4 .2 .0 -2.2 n.a.
n.a. n.a. n.a. n.a. n.a.
.4 -4.2 5.2 -2.9 n.a.
-. 3 -. 4 -. 2 .0 x X x X-.1 -.8 -.3 .7 1.1 -.3 .5 1.0 n.a.
.1 .7 .4 1.0-. 2 -. 7 1.3 .5
.8 -. 2 -. 3 .5 .4
.8 -. 2 -. 3 .5 .4
1. Asterisk indicates that monthly data are not available.2. For quarterly data, latest quarter from year ago.
.7-. 4
1.7-. 7
.9-1.9
1.5.5
.9-6.2
2.2.9

CONSUMER AND WHOLESALE PRICES IN MAJOR INDUSTRIAL COUNTRIES(Percentage change from previous period) 1
Q4/Q4 Q4/Q41990 1991
1991 1992 1992*------------------ ------------------- --------------------------- Latest 3 monthsQ2 Q3 Q4 Q1 Q2 Q3 Aug. Sept. Oct. Nov. from year ago
Canada
CPIWPI
France
CPIWPI
West Germany
CPIWPI
Italy
CPIWPI
Japan
CPIWPI
United Kingdom
CPIWPI
United States
CPI (SA)WPI (SA)
4.9 4.11.9 -3.2
3.6 2.9.7 -3.6
3.0 3.9.9 1.6
6.3 6.19.9 1.1
3.2 3.21.9 -1.3
10.0 4.25.9 4.9
6.3 3.06.4 -.1
.7-1.6
.7-1.5
.6 -. 1-. 9 -. 4
.8 .8-. 7 -1.0
.9 1.5
.3 .7
.4 .5 .4
.5 .6 .8
.5n.a.
.7 1.2
.2 .4
.0 -. 1
.1 .6.2 n.a..5 n.a.
.1 .1 .1 .0* N X K
1.1 .5.5 -2.0
1.4 1.0 1.7 1.4 1.2-1.0 .5 1.4 .0 .8
.7-. 5
.4 1.1 -. 3 1.3 -. 1-.4 -. 7 -. 4 .0 -. 1
.4 1.0
.6 .5
.7 .9
.0 .5
.5 2.2 -.11.4 1.1 .4
.8 .6
.8 .4
.5n.a.
.3 .6 .6
.2 n.a. n.a.
.1 .5 -. 1
.1 -. 3 -. 7
.1 .4 .4 -. 1
.1 .1 .1 .3
.2 .4 .2
.3 .1 -. 2
monthly data are not available.
1.32.2
2.3-1 .1
3,7-1.2
4.91.7
1.3-1 .3
3,43.3
3.11.5
--
1. Asterisk indicates that

TRADE AND CURRENT ACCOUNT BALANCES OF MAJOR INDUSTRIAL COUNTRIES 1(Billions of U.S. dollars, seasonally adjusted except where otherwise noted)
1990 1991
Canada
TradeCurrent account
France
TradeCurrent account
Germany 2
Trade (NSA)Current Account (NSA)
Italy
TradeCurrent account (NSA)
Japan
TradeCurrent account
United Kingdom
TradeCurrent account
United States
TradeCurrent account
9.4 5.0-21.5 -25.5
-9.3 -5.3-9.5 -4.7
65.2 12.946.4 -19.5
-12.2 -13.0-14.4 -21.5
51.7 78.535.9 73.1
-33.0 -18.3-26.8 -9.9
-108.9 -73.4-90.4 -3.7
1991 1992-------------------- --------------------
Q2 Q3 Q4 Q1 Q2 Q3
1.7 .9 1.0 1.6 1.6 1.5-6.0 -6.6 -7.3 -6.2 -6.2 -6.4
-1.5 -1.5 .4 1.1 1.9 1.3-1.6 -.2 1.1 n.a. n.a. n.a.
-1.1 2.8 6.7 4.4 3.4 8.5-5.9 -5.9 -2.2 -5.6 -6.1 -9.0
-3.5 -4.9 -3.3 -1.9 -4.0 n.a.-4.6 -3.7 -5.0 n.a. n.a. n.a.
19.7 21.0 21.2 28.0 24.5 26.218.8 19.5 22.9 28.6 28.8 28.1
-3.8 -4.0 -4.7 -5.4 -5.7 -6.2-.4 -2.1 -3.0 -5.1 -5.1 -5.7
-16.4 -20.2 -18.5 -17.2 -24.6 -26.52.4 -11.1 -7.2 -5.9 -17.8 n.a.
1992---------------------------Aug. Sept. Oct. Nov.
.6 .4 n.a. n.a.x x K N
.7 .2 n.a.S XN X
3.9 3.8 n.a. n.a.-1.3 -2.5 r.8 n.a.
n.a. n.a. n.a. n.a.
8.3 9.4 10.4 8.88.5 9.9 10.4 n.a.
-2.2 -1.8 -1.9 n.a.-2.1 -1.6 -1.8 n.a.
-9.4 -9.0 n.a.X X
n.a.n
1. The current account includes goods,that monthly data are not available.2. Before July 1990, West Germany only
services, and private and official transfers. Asterisk indicates

IV-19
positive contribution to growth as exports increased 3.5 percent
while imports rose 3.3 percent.
Indicators of activity early in the fourth quarter have also
been generally weak. Industrial production (s.a.) fell 2.9 percent
in October, and its 12-month decline widened to 6.4 percent. Retail
sales in October were 2.6 percent below their year-earlier level.
New passenger car registrations (s.a.) fell a further 9.3 percent in
October and were down 16.1 percent on a 12-month basis. New
machinery orders (s.a.) fell 30.7 percent in October, more than
reversing their sharp increase of the previous month, and were 23.9
percent below their year-earlier level. The unemployment rate
(s.a.) remained unchanged for the fourth consecutive month at 2.2
percent in October, but the job offers to applicants ratio (s.a.)
dropped a further 5 percent to a level 34.7 percent below its peak
of March 1991.
The Bank of Japan's quarterly economic survey (Tankan) taken in
November reported a further deterioration in business sentiment.
The index measuring the business sentiment of major manufacturing
firms (the percent having a favorable view of business conditions
minus the percent with an unfavorable outlook) fell to minus 44 from
minus 37 in the last survey taken in August, its lowest level since
1975. On average, firms predicted a 4.7 percent decline in
investment in the current fiscal year, down from the 2.8 percent
JAPANESE ECONOMIC INDICATORS(percent change from previous period except where noted, s.a.)
1992Q1 Q2 Q3 Q4 Aug. Sep. Oct.
Machinery Orders 2.4 -14.3 11.4 -- 4.4 20.7 -30.7New Car Registrations 1.5 -6.7 -2.6 -- -6.1 6.5 -9.3Job Offers Ratio -5.3 -9.6 -9.7 -- -2.0 -1.0 -5.0Business Sentiment* (%) -5 -24 -37 -44
* Percent of manufacturing firms having a favorable view ofbusiness conditions minus those with an unfavorable outlook.

IV-20
reduction forecast in the previous Tankan. The index showing the
degree to which firms felt inventories were excessive edged down to
37 from 38 in the previous survey.
Consumer prices in the Tokyo area (n.s.a.) declined 0.3 percent
in November, and their 12-month increase fell to 0.6 percent.
However, nearly all of this reduction was due to a sharp fall in
perishable food prices that had been elevated last year by the
effects of typhoons. Excluding these items, the 12-month consumer
price inflation rate was 2.1 percent, little changed from that of
recent months. Wholesale prices (n.s.a.) were unchanged in November
and showed a 12-month decline of 1.3 percent.
The trade surplus (s.a.) decreased slightly in November, but
for the first eleven months of the year the surplus was $107 billion
(a.r.), 39 percent above the surplus in the corresponding period
last year.
Real GDP in western Germany continued to decline in the third
quarter, registering a drop of 1.9 percent (s.a.a.r.) that reflected
significant weakness in domestic demand. Both consumption and
investment spending fell sharply, while net exports provided a
partial offset. Net exports, which include trade with eastern
Germany, have continued to contribute to growth in real GDP despite
weak growth in Germany's major trading partners.
Industrial production (s.a.) in western Germany has been on a
downtrend since early this year. Data for October suggest that the
fourth quarter is off to a poor start, with industrial production
more than 2 percent below its September level. The volume of new
orders for west German manufactured goods (s.a.) has fallen steadily
since early in the year, and declined more than 5 percent in October
relative to the third-quarter average. After remaining steady
throughout 1991 at roughly 6.3 percent, the unemployment rate (s.a.)

IV-21
in western Germany has edged up since February and stood at 6.7
percent in November.
WESTERN GERMAN ECONOMIC INDICATORS(percent change from previous period except where noted, s.a.)
1991 1992Q4 Q1 Q2 Q3 Sep. Oct. Nov.
Manufacturing Orders -1.5 2.2 -4.0 -2.1 0.2 -5.1Capacity Utilization -0.9 -0.6 -1.4 -2.2 -
Unemployment Rate (%) 6.3 6.2 6.5 6.6 6.5 6.6 6.7Production Plans* (%) -1.7 -3.7 -6.0 -12.0 -21.0 -35.0
* Percent of mining and manufacturing firms that expect to increaseproduction minus those who expect to decrease it.
On a year-over-year basis, consumer prices increased almost 3.5
percent in the third quarter and were up 3.7 percent in November.
Wholesale prices (n.s.a.) in western Germany dropped 1.7 percent in
October on a year-over-year basis, and increases in producer prices
have moderated significantly. Import prices (n.s.a.) in western
Germany began to edge down in June, and declined in September to
reach a level almost 5 percent below their level in September 1991.
After improving in the fourth quarter of last year, the pan-
German current account (n.s.a.) deteriorated in the first three
quarters of this year. The widening of the current account deficit,
which reached a cumulative $21.5 billion (n.s.a.) through October,
primarily reflects a drop off in the value of exports.
Through October, M3 in western and eastern Germany combined
increased 10.2 percent (s.a.a.r.) in 1992, relative to the fourth
quarter of 1991. In both September and October, growth in M3 was
boosted by the sizable DM intervention in exchange markets that
occurred in mid-September. Monetary expansion remains well above
the Bundesbank's M3 target range of 3-1/2 percent to 5-1/2 percent
growth for 1992. The Bundesbank announced recently that its

IV-22
monetary target for next year is M3 growth in the range of 4-1/2
percent to 6-1/2 percent.
On November 27, the German parliament approved a draft budget
for 1993 that holds the growth of nominal Federal expenditures to
2.5 percent. However, there remains a significant risk that the
economic assumptions upon which the 1993 budget is based are too
optimistic and that the actual deficit will exceed the projected
DM 43 billion. In addition, Finance Minister Waigel announced that
he intends to introduce next spring additional programs for eastern
Germany in a supplemental budget of DM 2-3 billion. The government
has indicated that the new programs will be financed through the
reduction of other expenditures.
The round of yearly wage negotiations just beginning is off to
a promising start, and it appears likely that the Kohl government
will achieve its rumored goal of limiting nominal wage increases to
4 percent or less. So far, workers in the insurance and steel
industries have agreed to wage increases of 4.2 percent and 3.4
percent, respectively, with the steel contract extending over an
18-month period. The union representing 2.3 million public sector
employees, which is likely to be the trendsetter, has tabled a bid
for a 5 percent increase.
In France, real marketable GDP, a reliable preliminary
indicator of total GDP, rose 1.6 percent (s.a.a.r.) in the third
quarter. The increase was entirely due to strong consumption, which
registered growth of 3.6 percent, after declining 0.8 percent in the
second quarter. Net exports and investment both made negative
contributions. Recent monthly indicators have been mixed but, on
balance, suggest that the modest second-quarter strength will not be
sustained into the fourth quarter. Both the Bank of France's
measure of industrial output (s.a.) and survey measures of

IV-23
production and investment intentions (s.a.) fell in October. The
unemployment rate (s.a.) also rose slightly in October to 10.4
percent. In contrast, consumption of manufactured products (s.a.),
equal to one-third of total consumption, increased 1.6 percent in
October, suggesting that some of the third-quarter strength in
consumption continued into the fourth quarter.
Finance Minister Sapin announced that the 1993 target range for
M3 would be 4 percent to 6-1/2 percent, up slightly from the 1992
range of 4 percent to 6 percent. He also predicted that the final
figure for actual M3 growth this year would be roughly 6 percent.
The target range was announced on the same day as the German target
range with the same upper limit of 6-1/2 percent in part to signal
that monetary cooperation between France and Germany would continue
to be close. Monetary targets are less important to the conduct of
monetary policy in France than in Germany because France's
participation in the ERM leads it to target the FF/DM exchange rate.
Inflation has continued to decline. In November, the consumer
price index was 2.1 percent above its year-earlier level, down from
2.4 percent in the previous month.
The cumulative trade surplus (s.a.) over the first 10 months of
this year was $4.3 billion; over the same period a year earlier
France registered a deficit of $4.9 billion.
In Italy, economic growth continues to slow. Adjusting for the
number of working days. industrial production in September fell 5.5
percent below its year-earlier level. In August, new orders fell
10.8 percent below their August 1991 level, while retail sales rose
only 2.8 percent on this basis. This weakening trend in consumption
is likely to continue because of plummeting consumer confidence. In
October, the consumer confidence index fell 8.5 percent below
September's level, which in turn was 10.5 percent below July's
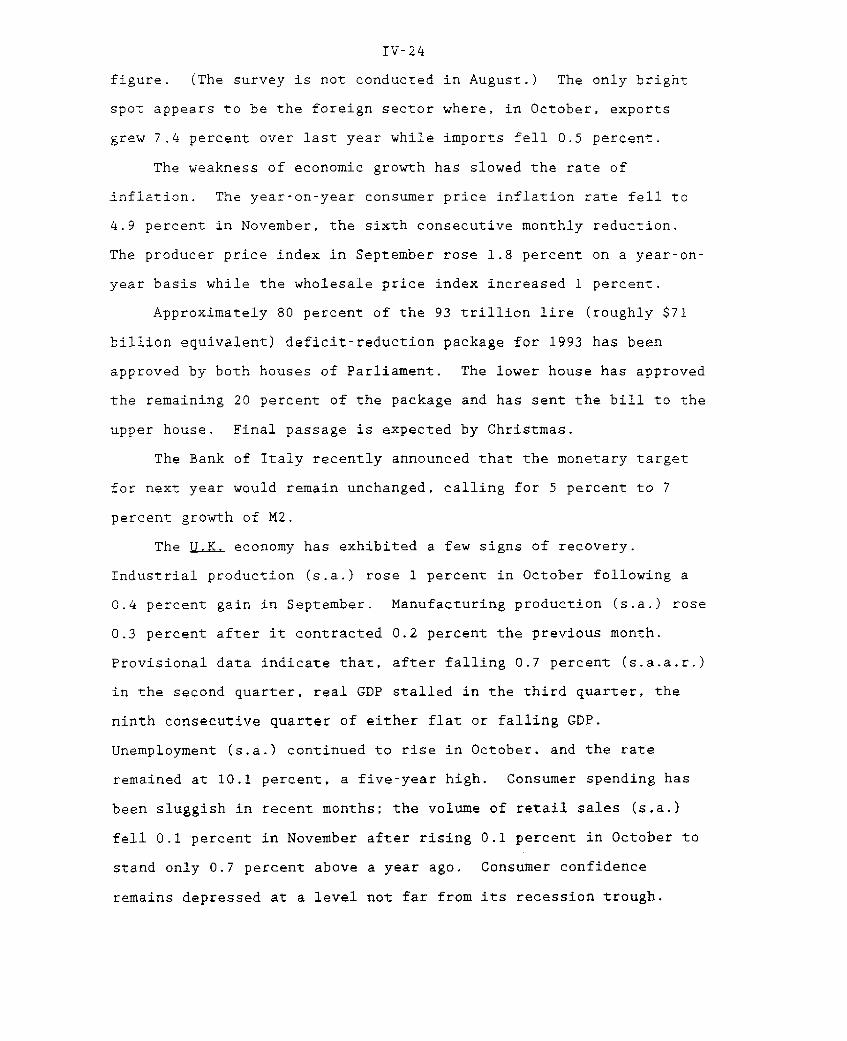
IV-24
figure. (The survey is not conducted in August.) The only bright
spot appears to be the foreign sector where, in October, exports
grew 7.4 percent over last year while imports fell 0.5 percent.
The weakness of economic growth has slowed the rate of
inflation. The year-on-year consumer price inflation rate fell to
4.9 percent in November, the sixth consecutive monthly reduction.
The producer price index in September rose 1.8 percent on a year-on-
year basis while the wholesale price index increased 1 percent.
Approximately 80 percent of the 93 trillion lire (roughly $71
billion equivalent) deficit-reduction package for 1993 has been
approved by both houses of Parliament. The lower house has approved
the remaining 20 percent of the package and has sent the bill to the
upper house. Final passage is expected by Christmas.
The Bank of Italy recently announced that the monetary target
for next year would remain unchanged, calling for 5 percent to 7
percent growth of M2.
The U.K. economy has exhibited a few signs of recovery.
Industrial production (s.a.) rose 1 percent in October following a
0.4 percent gain in September. Manufacturing production (s.a.) rose
0.3 percent after it contracted 0.2 percent the previous month.
Provisional data indicate that, after falling 0.7 percent (s.a.a.r.)
in the second quarter, real GDP stalled in the third quarter, the
ninth consecutive quarter of either flat or falling GDP.
Unemployment (s.a.) continued to rise in October, and the rate
remained at 10.1 percent, a five-year high. Consumer spending has
been sluggish in recent months; the volume of retail sales (sa.)
fell 0.1 percent in November after rising 0.1 percent in October to
stand only 0.7 percent above a year ago. Consumer confidence
remains depressed at a level not far from its recession trough.

IV-25
Consumer price inflation continues to moderate, despite the
recent depreciation of the pound. Consumer prices (n.s.a.) fell 0.1
percent in November after rising 0.4 percent in October, making the
12-month rate of inflation 3 percent, the lowest level since 1986.
Excluding mortgage interest rates, consumer prices were 3.6 percent
above their level of November 1991, within the government's
inflation target of 1-4 percent. Producers' output prices (s.a.)
rose 0.3 percent in November after they rose 0.1 percent in October
and were 3.3 percent above their year-earlier level. The prices of
producers' materials and fuels (n.s.a.) rose 3 percent in November
after rising 2.7 percent in October, largely reflecting price
increases of imported materials associated with sterling's
devaluation.
Despite continued weakness in domestic demand, the trade
deficit (s.a.) widened considerably in recent months. The
cumulative current account deficit for the first ten months of the
year was $21.3 billion (s.a.a.r.), compared with a deficit of $9.5
billion in the same period of 1991.
The Canadian economy continued to inch forward in the third
quarter. GDP increased 1.4 percent (s.a.a.r.) but still stood 1.6
percent below its cyclical peak in the first quarter of 1990. Final
domestic demand rose 5.3 percent, and private investment in
machinery and equipment surged to an all-time high, as Canadian
businesses took advantage of low U.S. computer prices. However, the
external sector made a negative net contribution as imports grew
11.4 percent. In addition, inventory destocking accelerated.
Activity indicators for the fourth quarter suggest continued
sluggishness. In October, motor vehicle sales (s.a.) fell 4 percent
below their third-quarter average. Housing starts (s.a.) in October
and November combined were down 3.5 percent from the third quarter.

IV-26
A sharp upturn in the labor force participation rate caused the
unemployment rate (s.a.) to soar from 11.3 percent in October to
11.8 percent in November, its highest level in nine years. However,
total employment (s.a.) rose 0.1 percent, the fourth consecutive
monthly advance.
Recent price data show that inflation has remained moderate.
The targeted 12-month change in the CPI, excluding food and energy,
increased from 1.6 percent to 1.7 percent in October. The all-items
CPI was up 1.6 percent over this period, and wholesale prices rose
2.8 percent. Average wage settlements (a.r.) for the first three
quarters increased 2.3 percent, compared with a 3.6 percent average
for all of 1991 and 5.6 percent for 1990.
On December 2, Finance Minister Don Mazankowski announced that
he now expects the federal budget deficit for fiscal year 1992,
which ends March 31, 1993, to reach C$34.4 billion (5 percent of
GDP), about 25 percent above its target level. Accordingly, the
government announced C$0.7 billion in spending cuts over the next
four months (the end of fiscal year 1992), and further cuts for
fiscal years 1993 and 1994.
In Switzerland, third-quarter national income account data
showed continued weakness. GDP declined 0.1 percent (s.a.a.r.).
after declining 0.4 percent in the second quarter. Strong positive
contributions from net exports and the government sector limited
this decline. The other components fell sharply, with consumption
declining 1.1 percent in the third quarter after declining 3 percent
in the second quarter, and investment dropping 4.5 percent after
falling 10.4 percent in the second quarter. Inflation declined
again in November to 3.3 percent on a year-over-year basis from 3.5
percent in the previous month, and was well below its 5-1/2 percent
rate of a year ago.
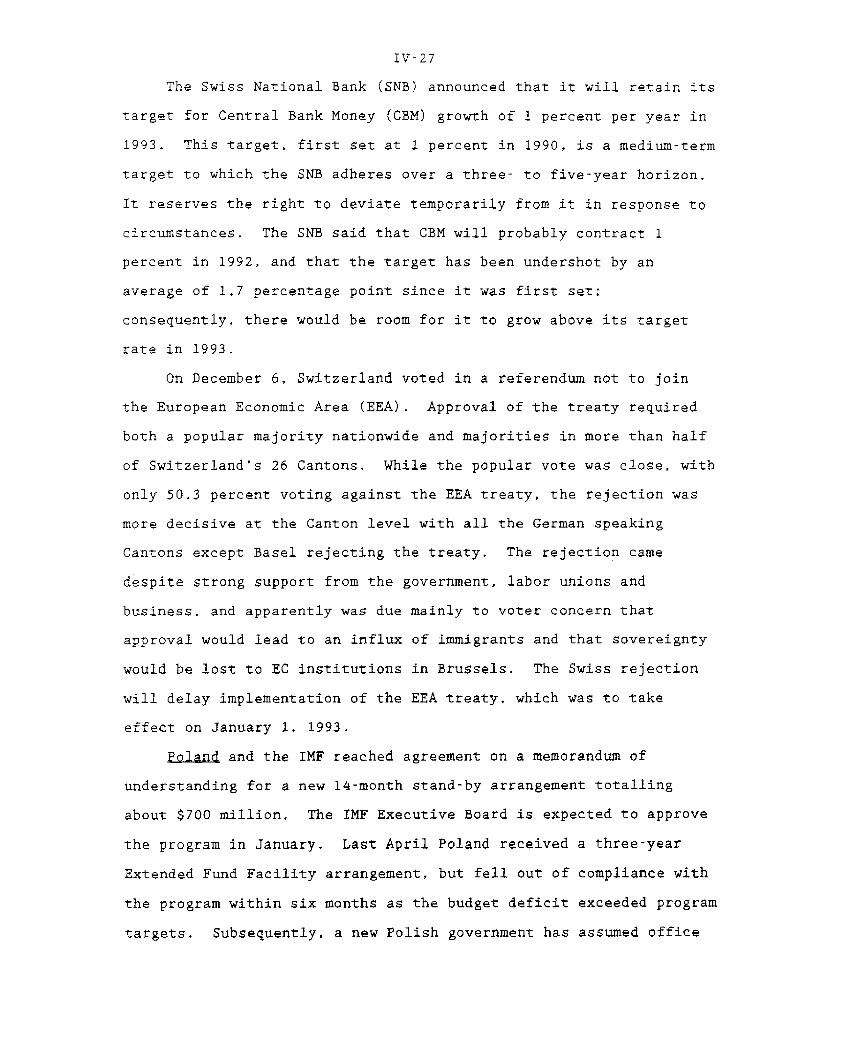
IV-27
The Swiss National Bank (SNB) announced that it will retain its
target for Central Bank Money (CBM) growth of 1 percent per year in
1993. This target, first set at 1 percent in 1990, is a medium-term
target to which the SNB adheres over a three- to five-year horizon.
It reserves the right to deviate temporarily from it in response to
circumstances. The SNB said that CBM will probably contract 1
percent in 1992, and that the target has been undershot by an
average of 1.7 percentage point since it was first set;
consequently, there would be room for it to grow above its target
rate in 1993.
On December 6, Switzerland voted in a referendum not to join
the European Economic Area (EEA). Approval of the treaty required
both a popular majority nationwide and majorities in more than half
of Switzerland's 26 Cantons. While the popular vote was close, with
only 50.3 percent voting against the EEA treaty, the rejection was
more decisive at the Canton level with all the German speaking
Cantons except Basel rejecting the treaty. The rejection came
despite strong support from the government, labor unions and
business, and apparently was due mainly to voter concern that
approval would lead to an influx of immigrants and that sovereignty
would be lost to EC institutions in Brussels. The Swiss rejection
will delay implementation of the EEA treaty, which was to take
effect on January 1, 1993.
Poland and the IMF reached agreement on a memorandum of
understanding for a new 14-month stand-by arrangement totalling
about $700 million. The IMF Executive Board is expected to approve
the program in January. Last April Poland received a three-year
Extended Fund Facility arrangement, but fell out of compliance with
the program within six months as the budget deficit exceeded program
targets. Subsequently, a new Polish government has assumed office

IV-28
and has addressed several economic issues, including proposal of a
tight 1993 budget. With agreement on a new IMF program, Poland is
expected to approach commercial bank creditors again for reduction
of its $12 billion in commercial debt. In 1991 Paris Club creditors
agreed to reduce by 50 percent the net present value of Poland's
official debt, which is estimated to be about $35 billion. In late
November seven countries, including the United States, agreed to
redirect resources from the Polish currency stabilization fund to a
proposal for Polish bank recapitalization and privatization. Of the
$500 million pledged thus far, the U.S. contribution is $200
million.
The Russian Congress of People's Deputies closed its most recent
session on December 14 after confirming Viktor Chernomyrdin as Prime
Minister. Chernomyrdin, formerly Deputy Prime Minister for energy,
was nominated for the post by President Yeltsin. The Congress also
agreed to hold a referendum on April 11 on constitutional changes
aimed at clarifying the distribution of powers among the different
branches of the Russian government. Yeltsin's decision to nominate
Chernomyrdin was somewhat of a surprise because under an agreement
reached earlier with the Congress Yeltsin could have retained Acting
Prime Minister Gaidar in his post at least until the referendum in
April. Chernomyrdin has said that he will maintain Gaidar's
reforms, but it is unclear how the change in the Russian government
will affect the course of reform.
Economic Situation in Other Countries
In Mexico, real GDP in the third quarter was 2.8 percent above
a year earlier. The trade deficit is continuing to widen, and the
authorities have introduced some trade barriers to slow this trend.
The North American Free Trade Area agreement will be signed Decem-
ber 17. Growth in Taiwan and Korea has slowed. In Taiwan,

IV-29
sluggish world demand has weakened activity and narrowed the trade
surplus. In Korea, slower growth reflects tight economic policies.
As a result, Korea's trade deficit has narrowed considerably. In
Brazil, economic activity continues to be depressed and inflation
high as a result of the Franco government's inability to enact
controversial fiscal and other economic reforms. On December 10,
the economic subcommittee of the Brazilian Senate ratified the Brady
Plan restructuring of Brazil's $44 billion commercial bank debt.
The agreement is not expected to be implemented until Brazil takes
more serious steps towards economic reform. In Venezuela, the
economic and political climate remains unsettled in the wake of the
coup attempt on November 27. In Argentina, industrial output in the
third quarter was 13.4 percent above a year earlier. The trade
surplus has narrowed considerably, mainly because of real exchange
rate appreciation. On December 6, a signing ceremony was held for
the Brady Plan commercial bank debt restructuring agreement.
Individual country notes. In Mexico, real GDP was 2.8 percent
higher in the third quarter than a year earlier, the same rate of
growth as in the first half (year-over-year). The government has
forecast 1993 growth at 2.5 to 3 percent. The CPI rose by 0.8
percent in November, leaving the index 12.9 percent higher than a
year earlier. Fiscal and monetary policies remain tight, with the
aim of lowering twelve-month consumer price inflation to single
digits in early 1993. A public sector fiscal surplus of 0.4 percent
of GDP, excluding privatization proceeds, is expected in 1992.
Another small surplus is budgeted for 1993.
Despite these restrictive policies, the cumulative trade
deficit through September 1992 was $11.1 billion, up from $4.3
billion a year earlier, in part because of the continuing real
appreciation of the peso. Imports were 28 percent higher, due in

IV-30
part to a 38 percent increase in consumer goods imports. Manufac-
tured exports were only 9.4 percent higher, petroleum exports were
unchanged, and other exports were lower.
In an apparent effort to slow the widening of the trade and
current account deficits, some trade restrictions have been
introduced in recent months, including labeling and certification
rules, a sharply reduced duty-free allowance on goods imported into
Mexico by land, and a 33 percent duty on any amount above the
exemption. These actions disrupted U.S. exports to Mexico and may
weaken U.S. industry and Congressional support for the North
American Free Trade Area agreement. The agreement will be signed
December 17.
The twenty-eight-day Treasury bill auction rate was 17 percent
on December 16, down from its October 14 peak of 19.7 percent. The
decline in part reflects the reduced expectation of an imminent
devaluation after the October decision to increase the pace at which
the exchange rate band is being widened and the consequent reduction
in the risk premium demanded by bidders for these instruments.
Secondary market interest rates have fallen by less. Private sector
demand for credit remains strong, but commercial banks are
increasingly cautious because of the growth of non-performing loans
and the need to meet higher capitalization requirements that take
effect January 1. Some banks may have difficulty meeting the new
requirements. Non-performing loans were nearly 6 percent of total
loans outstanding last August compared with less than 1 percent in
1989.
The spot rate for the dollar has fluctuated narrowly in the
past five weeks and stood at 3,120 pesos on December 15, which is
near the mid-point of the exchange rate band. On December 15, the

IV-31
Mexico City stock market index was nearly 37 percent above its late
September low and nearly 20 percent higher than the end of 1991.
In Taiwan, real GNP was 5.2 percent higher in the third quarter
than a year earlier, the slowest growth in two years. Net export
growth continued to slow, mainly in response to weak world demand.
In the first 11 months of 1992, exports were about 7.5 percent
higher than during the same period in 1991, well below the average
export growth rate of 14.4 percent per year in 1987-91. Imports
were about 14.9 percent higher. The trade surplus for the 11-month
period fell to $9.1 billion from $12.4 billion in January-November
1991, despite a growing trade surplus with China, mainly through
Hong Kong. Investment has picked up at the start of an ambitious
six-year infrastructure program, with total investment projected to
rise roughly 13 percent by year-end. Although public investment is
lower than the target previously set for 1992, overall investment
growth is above last year's rate of 9.5 percent. Consumer price
inflation in Taiwan has increased recently, largely because of the
extraordinary effects of a typhoon. Consumer prices were 5.1
percent higher in October than a year earlier.
The Korean government's controls on construction and tight
credit policy have led to a slowdown in domestic demand, a reduction
in inflationary pressures, and a narrowing of the trade deficit this
year. Growth in the first three quarters of 1992 was 5.7 percent
above the same period last year, well below potential estimated at 7
percent and growth of 8.8 percent recorded in the same period last
year. Investment, the main source of the expansion last year, was
little changed in the first three quarters. Consumer prices were
5.4 percent higher in October than a year earlier, down from an
increase of 9 percent in the year ending October 1991. In the first
eleven months of this year, Korea's trade deficit (on a customs

IV-32
clearance basis) fell to $5.2 billion from $11 billion in the same
period last year. Exports grew 8.6 percent in the first eleven
months of 1992, down slightly from last year. Imports were
unchanged, compared with growth of 18 percent in the same period
last year.
In Brazil, real GDP in the second quarter was 2 percent below a
year earlier. Inflation in November is estimated to have been 23
percent and would have been higher had Acting President Franco not
delayed increases in public sector tariffs. Depressed internal
demand and improved competitiveness following a 17 percent real
effective exchange rate depreciation in late 1991 combined to widen
the cumulative trade surplus through October to $13 billion from
$9.3 billion in the same period of 1991. Exports were 10 percent
higher, while imports were 5 percent lower.
As of early December, international reserves were an estimated
$20 billion, down from a record level of $23 billion in September.
The decline probably reflects capital outflows resulting from the
loss of investor confidence in the government. Acting President
Franco advocates government controls on interest rates and prices to
alleviate social and economic inequities. The rest of the
government is mired in gridlock, unable to reach the consensus
needed to cut budgetary deficits and enact other controversial
reforms. This lack of consensus was underscored by the government
decision on December 15 to postpone the privatization of a large
steel mill that had been scheduled for December 22.
On December 10, the economic subcommittee of the Brazilian
Senate ratified the Brady Plan restructuring of Brazil's $44 billion
commercial bank debt. The accord is not expected to be implemented
until Brazil takes more serious steps towards economic reform.

IV-33
In Venezuela, the political and economic climate remains
unsettled in the wake of the unsuccessful military coup attempt on
November 27, the second one this year. The coup attempt highlighted
serious shortcomings in policymakers' ability to spread the benefits
of Venezuela's rapid economic growth during 1991-92 to the lower and
middle classes. However, the public is not enthusiastic about the
prospect of military rule.
The bolivar has remained relatively stable vis-a-vis the dollar
from mid-November through December 15,
The price of
Venezuela's "Brady bonds" declined from 56.75 percent of face value
on November 26, before the coup attempt, to 54.5 percent of face
value on December 15. The Caracas stock exchange index fell from
20,353 on November 26 to 19,125 on November 30, the first business
day after the coup, but rallied to 20,400 as of December 15.
In Argentina, economic activity slowed in the third quarter,
while inflation has fallen to its lowest level in more than a
decade. Industrial production in the third quarter was 13.4 percent
above a year earlier, down from a 20.5 percent increase in the
second quarter (year-over-year). Consumer prices rose by only 0.5
percent during November, compared with monthly averages of 1.1
percent during the previous six months and 5.2 percent during 1991.
The cumulative trade surplus through August 1992 was $630 million,
down from nearly $4 billion a year earlier. The slowdown in growth
and the smaller trade surplus are largely attributable to high real
interest rates and an estimated 40 percent real appreciation against
the dollar since March 1991.
Real exchange rate appreciation fueled fears of devaluation,
leading to the first run on the peso since the "Convertibility Law"
committed the central bank to exchange pesos for dollars at par in

IV-34
March 1991. During the second week of November, the central bank
successfully defended the exchange rate by purchasing 300 million in
pesos for the equivalent in dollars. The public, for the moment at
least, appears to be more confident that the central bank will
continue to honor its commitment to maintain the one-to-one parity.
Argentina reached final agreement with foreign commercial banks
on a Brady Plan restructuring package on its $28 billion commercial
bank debt. The signing ceremony took place on December 6. Nearly
two-thirds of the debt will be swapped for fixed-rate par bonds
paying a maximum 6 percent interest rate. The remainder will be
exchanged for bonds to be issued at a 35 percent discount and paying
13/16 percent above LIBOR. Argentina will purchase $3.2 billion in
30-year zero-coupon U.S. Treasury bonds as collateral for the par
and discount bonds using about $200 million of its international
reserves and about $3 billion in earmarked loans from the IMF, World
Bank, IDB, and the Japan Export-Import Bank. The exchange of debt
is expected to take place in April 1993.