Fomc 19910206 g Bpt 119910130
41
Prefatory Note The attached document represents the most complete and accurate version available based on original copies culled from the files of the FOMC Secretariat at the Board of Governors of the Federal Reserve System. This electronic document was created through a comprehensive digitization process which included identifying the best- preserved paper copies, scanning those copies, 1 and then making the scanned versions text-searchable. 2 Though a stringent quality assurance process was employed, some imperfections may remain. Please note that this document may contain occasional gaps in the text. These gaps are the result of a redaction process that removed information obtained on a confidential basis. All redacted passages are exempt from disclosure under applicable provisions of the Freedom of Information Act. 1 In some cases, original copies needed to be photocopied before being scanned into electronic format. All scanned images were deskewed (to remove the effects of printer- and scanner-introduced tilting) and lightly cleaned (to remove dark spots caused by staple holes, hole punches, and other blemishes caused after initial printing). 2 A two-step process was used. An advanced optimal character recognition computer program (OCR) first created electronic text from the document image. Where the OCR results were inconclusive, staff checked and corrected the text as necessary. Please note that the numbers and text in charts and tables were not reliably recognized by the OCR process and were not checked or corrected by staff.
-
Upload
fraser-federal-reserve-archive -
Category
Documents
-
view
215 -
download
0
Transcript of Fomc 19910206 g Bpt 119910130

Prefatory Note
The attached document represents the most complete and accurate version available based on original copies culled from the files of the FOMC Secretariat at the Board of Governors of the Federal Reserve System. This electronic document was created through a comprehensive digitization process which included identifying the best-preserved paper copies, scanning those copies,1 and then making the scanned versions text-searchable.2 Though a stringent quality assurance process was employed, some imperfections may remain.
Please note that this document may contain occasional gaps in the text. These gaps are the result of a redaction process that removed information obtained on a confidential basis. All redacted passages are exempt from disclosure under applicable provisions of the Freedom of Information Act.
1 In some cases, original copies needed to be photocopied before being scanned into electronic format. All scanned images were deskewed (to remove the effects of printer- and scanner-introduced tilting) and lightly cleaned (to remove dark spots caused by staple holes, hole punches, and other blemishes caused after initial printing). 2 A two-step process was used. An advanced optimal character recognition computer program (OCR) first created electronic text from the document image. Where the OCR results were inconclusive, staff checked and corrected the text as necessary. Please note that the numbers and text in charts and tables were not reliably recognized by the OCR process and were not checked or corrected by staff.

Strictly Confidential (FR) Class II FOMC
January 30, 1991
SUMMARY AND OUTLOOK
Prepared for the Federal Open Market Committee
By the staff of the Board of Governors of the Federal Reserve System

DOMESTIC NONFINANCIAL DEVELOPMENTS
Overview
The Commerce Department's advance estimate is that real GNP fell
2 percent at an annual rate in the fourth quarter, as businesses--especially
automakers--reduced production aggressively to avoid a runup in inventories.
Available data for the new year, although quite limited, indicate that
economic activity is continuing to decline, and we are forecasting that real
GNP will contract at somewhere between a 1 and 2 percent annual rate this
quarter, before rebounding during the spring.
The onset of hostilities in the Middle East has created a new set of
uncertainties in the economic outlook. Although one can only conjecture as
to the length and intensity of the war, the staff's working assumption is
that the war will end this spring. The associated increment to defense
purchases will raise the level of federal spending relative to its prior
path over the entire projection period. But in the very near term, the war
is expected to have little net effect on aggregate demand. The
uncertainties and anxieties of consumers and businesses probably have not
been fully allayed, despite the initial successes of the Allied forces. In
addition, the lagged effects of the contraction in real income that occurred
last quarter and continued financial strains are weighing on the economy in
the current quarter.
However, we remain optimistic about the prospects for economic recovery
after the current quarter. In the December Greenbook, the staff had
projected a short recession, ending with a clear rebound in growth in the
second quarter. Incoming information appears consistent with that view.

I-2
Importantly, reports suggest that businesses have been largely successful in
preventing a buildup of inventories. An additional encouraging note is that
oil prices declined sharply after the outbreak of fighting; this will
provide a stronger boost to real income. Moreover, short-term interest
rates have moved down further since the last FOMC meeting, and in part
because of higher defense outlays, this forecast incorporates less fiscal
restraint than assumed previously.
As the war comes to an end, we assume that the positive forces just
listed will lead to a firming in spending. And, with inventories expected
to be relatively lean, additional spending should translate quickly into
stronger production. As a result, the staff projects real GNP to advance
nearly 3 percent at an annual rate in the second quarter, halting the rise
in the unemployment rate at about 6-1/2 percent.
In the second half of the year, real GNP is expected to grow a bit
above a 3 percent annual rate. This pace of activity is somewhat faster
than in the last projection, reflecting our view that the Pentagon will be
replacing some of the munitions and equipment expended during the war.
Exports also are projected to provide substantial support to growth later
this year, reflecting a pickup in foreign economic activity and the lagged
effects of the dollar's decline in 1990. In addition, the resumption of
income growth and improved sales prospects bolster consumer and business
spending. The principal exception is commercial construction, where severe
excess supply problems and reduced credit availability likely will keep
activity on a downtrend for some time. In 1992, gradually rising real
interest rates, a decline in real defense purchases, and a flatter
trajectory of inventory investment moderate the expansion of aggregate

I-3
demand, and real GNP growth is projected to slow to roughly a 2-1/2 percent
pace--just a shade above the staff's 2.3 percent point estimate of
intermediate-run potential output growth.
Recent data on consumer prices and espec ally compensation have been
more favorable than we had anticipated, and oil prices have fallen further,
improving the outlook for inflation in the near term. However, the faster
economic growth now projected after the second quarter diminishes the
projected slack in resource utilization, largely offsetting these near-term
developments. Nonetheless, with the unemployment rate expected to average
6-1/4 percent in 1991 and 6 percent in 1992, we still expect to see a
substantial improvement in core inflation over the forecast period. The CPI
excluding food and energy, which rose 5-1/4 percent in 1990, is projected to
slow to 4-3/4 percent in 1991 and to 4 percent in 1992.
Key Assumptions
The major change to the assumption underlying the staff projection is
the onset of the Gulf war. Prior to this projection, we had assumed a
peaceful resolution of the crisis early this year. Our assumption now is
that the war will end in the spring and will raise military costs
significantly above what we had assumed previously. Clearly, even in the
aftermath of a decisive military victory by the Allied forces, the political
situation in the Middle East could remain highly unstable--posing risks to
our assumptions about oil markets and defense spending.
AS it is, the projection assumes that the Gulf war will have little
further effect on the level of crude oil prices. Oil prices have fallen
somewhat more in recent weeks than was anticipated in the December
Greenbook, and our current assumption is that the war will proceed without

I-4
renewed concerns about oil supplies. One apparent reason for lower oil
prices recently is the announced draws of supplies from the U.S. Strategic
Petroleum Reserve and from similar caches in other industrial countries; we
are assuming that additional draws from those reserves would be made
available if production were disrupted enough to raise prices materially.
The spot price of West Texas Intermediate is assumed to fluctuate around
$22-1/2 per barrel over the course of the war. After the war ends, prices
are assumed to remain at this level, in line with the OPEC target
established last July.
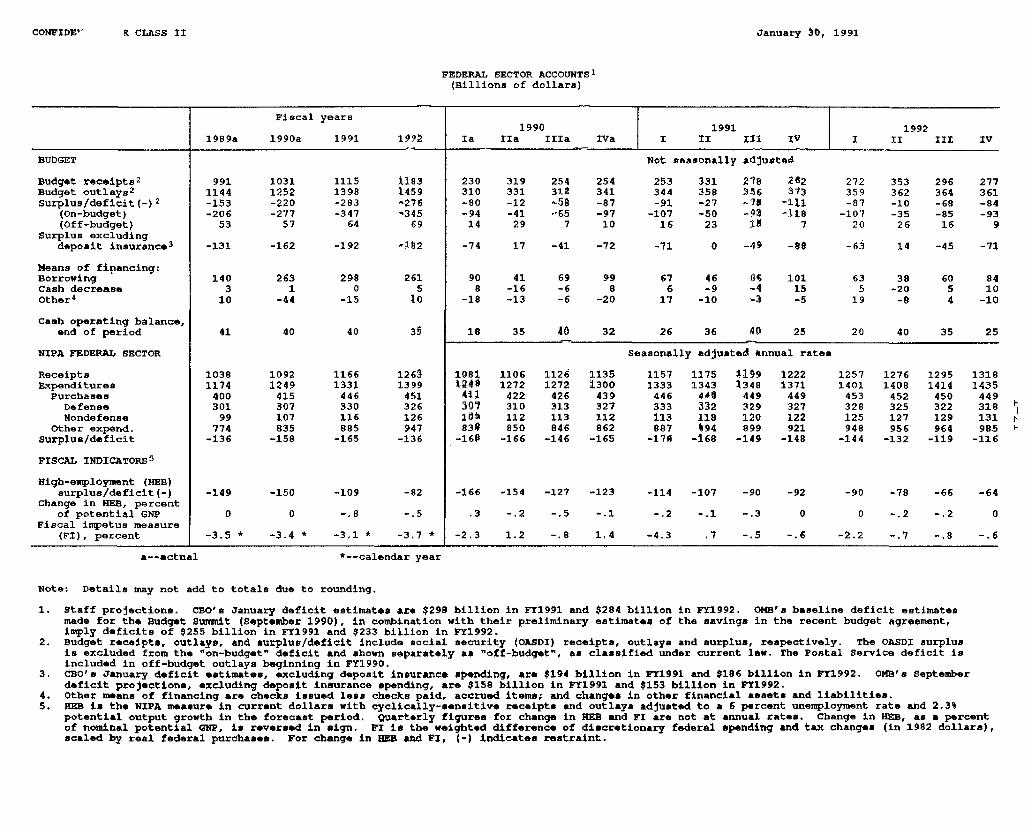
OPERATION DESERT STORM AND THE BUDGET(Billions of dollars)
Total FY1991 FY1992 BeyondTOTAL INCREMENTAL COST: 75
lessUNREPLACED MILITARY HARDWARE: 15equalsBUDGET OUTLAYS: 60 20 20 20lessASSUMED ALLIED CONTRIBUTIONS: 45 20 20 5equalsNET BUDGET DEFICIT EFFECT: 15 0 0 15
These figures include the prewar buildup costs of Operation Desert Shield.
On the fiscal front, higher defense purchases offset some of the
moderate restraint on aggregate demand assumed in the last Greenbook for
FY1991. Defense outlays stemming from the war are assumed to total $60
billion; this is less than the total cost because we assume that some
1. Despite the additions to defense outlays associated with OperationDesert Storm, it is important to point out that we continue to expectoverall real defense expenditures to decline after the current quarter,though less rapidly than in the last Greenbook. Although the Desert Stormexperience inevitably will influence future debates about defenseappropriations, we assume that the plans for multi-year cutbacks agreed tolast fall will remain highly relevant.

I-5
expended military hardware won't be replaced. Additional personnel and
operating costs for the war add immediately to federal purchases; other
expenditures, such as those related to replacement of military equipment and
munitions, are assumed to occur more gradually, extending into 1992 and
beyond. Despite this anticipated pickup in defense outlays, Operation
Desert Storm is expected to have no net effect on the unified federal budget
deficit in FY1991 and FY1992, as the additional spending is offset by cash
and in-kind contributions from other countries. Nevertheless, the staff's
estimate of the budget deficit is substantially higher than that in the
December Greenbook, because of increased cost estimates for transfer and
grant programs and a downward adjustment to receipts (excluding cash
contributions for Operation Desert Storm). In particular, we now expect the
unified budget deficit to be about $280 billion in both FY1991 and FY1992.
(NIPA federal deficits are $165 billion in FY1991 and $136 billion in
FY1992, as compared with $158 billion in FY1990.)
Short-term interest rates are 1/2 percentage point lower in this
projection than in the December Greenbook, reflecting the recent easing of
monetary policy. No further easing actions on the part of the System are
assumed, however, and nominal rates remain at their current levels through
1992. With inflation expectations likely edging downward in coming
quarters, this assumption implies a slight increase in real rates over time,
helping to keep aggregate demand on a moderate growth track.
Credit conditions generally have evolved in line with previous
assumptions. The recent spate of highly publicized bank failures has
underscored the deepening problems of financial intermediaries, and we
expect credit supply conditions to continue worsening in the near term.

I-6
Financial difficulties among nonfinancial enterprises also are manifest and
will be intensified by the further deterioration in cash flow associated
with the business downturn; thus, intermediaries and other lenders are
likely to display increasing caution. However, with the economic recovery
more firmly established by 1992, credit conditions are expected at least to
stabilize, effectively providing a small boost to growth in aggregate
demand. It is worth stating that the assumed influence of the "credit
crunch" is small relative to what might be suggested by the decibel level of
the current outcry, reflecting the staff's belief that the problems are
relatively concentrated regionally and that much of the observed credit
slowing is related to reduced investment opportunities.
M2 is expected to grow in the middle portion of its tentative range of
2-1/2 to 6-1/2 percent in 1991. The expansion of M3 is projected to roughly
match the sluggish pace of 1990, with intermediation continuing to be damped
by the thrift resolution process, cautious lending behavior, and the effects
of higher capital requirements and elevated costs of funds for depositories.
The growth rates of both aggregates are expected to pick up a little in
1992, influenced by credit supply developments.
The expectation regarding the foreign exchange value of the dollar on a
trade-weighted basis is essentially the same as in the December Greenbook.
The dollar benefited earlier in the intermeeting period from some safe-haven
demand, but more recently it has edged back toward its late 1990 lows. In
essence, no major movements in the dollar are anticipated in this forecast.
The staff's projections for near-term economic activity in other major
industrialized countries are slightly lower than in the last Greenbook,
reflecting recent data. Growth in the other G-10 countries is projected to

I-7
remain subdued in the near term but to rebound to nearly a 3 percent annual
rate in 1992. (For further details, see the International Developments
section.)
Recent Developments and the Near-Term Outlook
Real GNP is projected to decline around 1-1/2 percent, at an annual
rate, in the current quarter. Generally, we expect that concerns emanating
from the war and financial fragility will continue to damp consumer and
business confidence in the near term and that weak private domestic demand
will push manufacturing and construction activity substantially lower.
As noted above, the fourth-quarter decline in real GNP was
characterized by a sharp drop in private domestic spending and a sizable
liquidation of inventories. The magnitude of last quarter's contraction in
output, as reported by BEA, was somewhat less than we had expected,
principally because early estimates of defense purchases are higher than we
had anticipated. Nonetheless, our expectation that businesses' efforts to
control inventories would play a major role in the dynamics of the recession
were confirmed. This is especially evident in the motor vehicle sector,
where automakers cut assemblies sharply as dealers--who correctly
anticipated sluggish consumer demand--held down orders to avoid excessive
inventories. Arithmetically, the decline in motor vehicle output more than
accounted for the fourth-quarter drop in real GNP.
Motor vehicle production thus far in January looks to be falling short
of the fourth-quarter pace, but schedules for the remainder of the quarter
suggest a considerable pickup from the current assembly rate. If held to,
production at these levels would effectively bring the first-quarter total
up to the fourth-quarter pace, eliminating a sizable drag on GNP growth.

I-8
Sales of autos and light trucks through the first 20 days of January were
soft, however, and a further deterioration in demand could well prompt
automakers to scale back their assembly plans.
The aggressive production response also has resulted in a sharp
deterioration in labor market conditions in recent months. Nonfarm payroll
employment dropped more than 500,000 in the fourth quarter, with job losses
widespread across sectors. In addition, aggregate hours of production and
nonsupervisory workers fell 4-1/4 percent at an annual rate during the
quarter, and the civilian unemployment rate rose another 0.2 percentage
point to 6.1 percent in December. Weekly initial claims for unemployment
insurance have continued to fluctuate around 450,000 through the middle of
January, a level that we think is indicative of further appreciable
employment losses.
Among the components of final demand, real consumer outlays are
expected to decline another 1-1/2 percent at an annual rate in the current
quarter, as households defer purchases of motor vehicles and other
discretionary items. Additional layoffs are expected to restrain labor
income growth this quarter, and both the war and negative financial news
should keep consumers cautious about near-term economic prospects; as a
result of these latter influences, the personal saving rate is expected to
move up sharply to near 5 percent. 2 Increases in federal excise taxes on
alcoholic beverages and cigarettes and the new tax on luxury goods also are
likely to depress PCE growth in the current quarter, as some consumers
2. Overall, real disposable personal income is expected to rise2-1/2 percent at an annual rate in the first quarter despite decliningemployment because of social security benefit increases and falling energyprices.

I-9
apparently bought in advance of the January 1 tax increase; sales of luxury
import cars appear to have dropped quite sharply after the start of the
year. We estimate that this shift in the timing of purchases raised the
growth of real PCE by around 1/2 percentage point in the fourth quarter and
will reduce growth by roughly 1 percentage point in the first quarter.
Real business fixed investment is projected to fall 9 percent, at an
annual rate, in the current quarter, nearly twice its rate of decline in the
fourth quarter. Generally, the weakness in sales and slumping cash flows
are expected to restrain business spending. The near-term outlook is
especially weak for nonresidential construction; an overhang of office and
other commercial space, together with declining rates of capacity
utilization in the industrial sector, has led to a continued downtrend in
building permits and contracts. However, spending on business equipment
also is expected to turn down sharply in the first quarter. In part, the
projected decline represents a dropback from an elevated level; both an
unusually large number of domestic aircraft deliveries and a surge in
outlays for office and computing equipment held up PDE in the fourth
quarter. In addition, new orders for nondefense capital goods excluding
aircraft declined in the fourth quarter, and motor vehicle sales have slowed
further.
The recent declines in housing starts and permits suggest that
residential construction will fall further in the current quarter. The
decline in mortgage rates has made homebuying more attractive, but a
decisive upturn in demand is likely to require some broader perception that
prices have bottomed out. Builders appear hesitant at this point,
especially in areas where stocks of unsold homes still loom large. Reduced
I-10
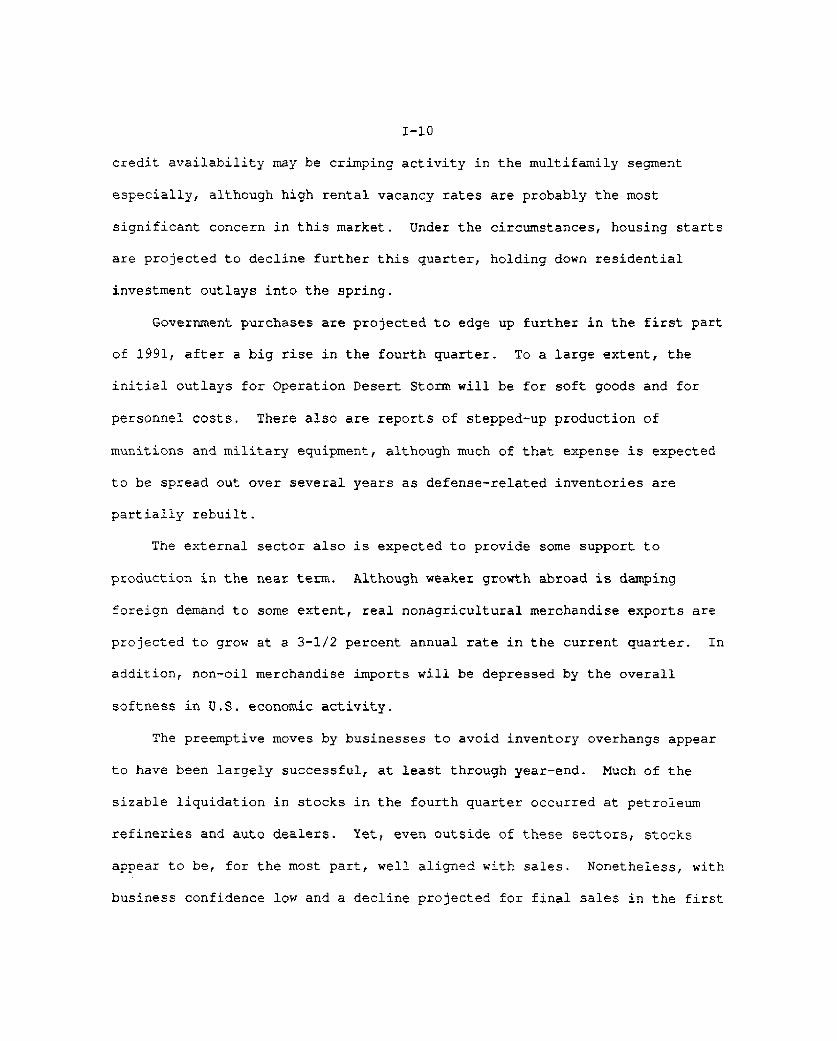
credit availability may be crimping activity in the multifamily segment
especially, although high rental vacancy rates are probably the most
significant concern in this market. Under the circumstances, housing starts
are projected to decline further this quarter, holding down residential
investment outlays into the spring.
Government purchases are projected to edge up further in the first part
of 1991, after a big rise in the fourth quarter. To a large extent, the
initial outlays for Operation Desert Storm will be for soft goods and for
personnel costs. There also are reports of stepped-up production of
munitions and military equipment, although much of that expense is expected
to be spread out over several years as defense-related inventories are
partially rebuilt.
The external sector also is expected to provide some support to
production in the near term. Although weaker growth abroad is damping
foreign demand to some extent, real nonagricultural merchandise exports are
projected to grow at a 3-1/2 percent annual rate in the current quarter. In
addition, non-oil merchandise imports will be depressed by the overall
softness in U.S. economic activity.
The preemptive moves by businesses to avoid inventory overhangs appear
to have been largely successful, at least through year-end. Much of the
sizable liquidation in stocks in the fourth quarter occurred at petroleum
refineries and auto dealers. Yet, even outside of these sectors, stocks
appear to be, for the most part, well aligned with sales. Nonetheless, with
business confidence low and a decline projected for final sales in the first

I-11
quarter, we anticipate some further paring of inventories early this
3year.
Turning to wage and price developments, the consumer price index is
projected to rise just 3-1/2 percent at an annual rate in the current
quarter, after a 7 percent jump in the fourth quarter. Price increases
toward the end of last year were a bit smaller than we had forecast, as oil
prices turned down sharply and increases for shelter costs slowed. With the
further decline in oil prices seen in recent weeks, we now expect a bigger
drop in energy prices in the current quarter as well; indeed, survey data
indicate that retail prices of petroleum products already have moved
significantly lower. Excluding food and energy prices, however, inflation
is expected to accelerate to around a 5-1/4 percent annual rate in the first
quarter, reflecting in part higher excise taxes.
Labor costs also slowed more than anticipated in late 1990, with much
of the deceleration in compensation among workers in sector that have
experienced substantial job losses--notably, construction, manufacturing,
and finance, insurance, and real estate. Rising unemployment should
continue to restrain compensation growth in the near term. Nonetheless,
this influence is temporarily offset by increases in the tax bases for
social security and medicare and another rise in the minimum wage. Overall,
the ECI is projected to rise at a 4-1/2 percent annual pace in the first
half, about 1/2 percentage point slower than in the December Greenbook.
3. Nonfarm inventories excluding autos and oil fell $5 billion in thefourth quarter of 1990 and are projected to decline $14 billion in thecurrent quarter; thus, the negative swing in stockbuilding is a significantdrag on GNP growth this quarter.
I-12
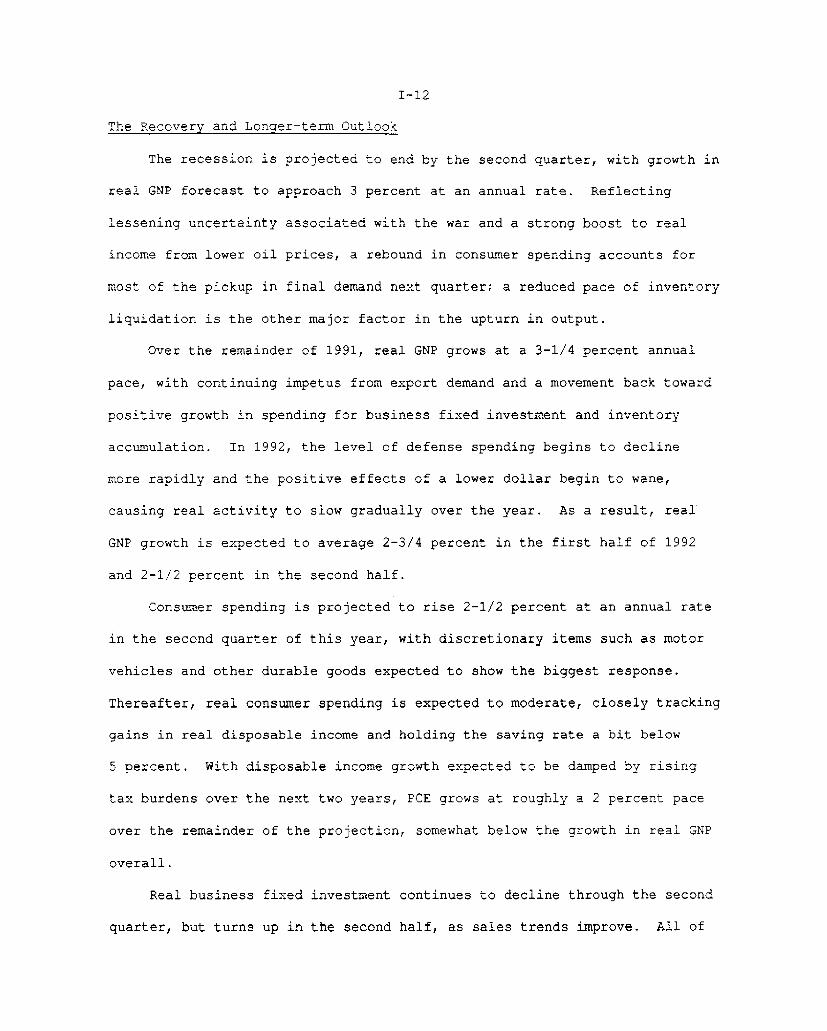
The Recovery and Longer-term Outlook
The recession is projected to end by the second quarter, with growth in
real GNP forecast to approach 3 percent at an annual rate. Reflecting
lessening uncertainty associated with the war and a strong boost to real
income from lower oil prices, a rebound in consumer spending accounts for
most of the pickup in final demand next quarter; a reduced pace of inventory
liquidation is the other major factor in the upturn in output.
Over the remainder of 1991, real GNP grows at a 3-1/4 percent annual
pace, with continuing impetus from export demand and a movement back toward
positive growth in spending for business fixed investment and inventory
accumulation. In 1992, the level of defense spending begins to decline
more rapidly and the positive effects of a lower dollar begin to wane,
causing real activity to slow gradually over the year. As a result, real
GNP growth is expected to average 2-3/4 percent in the first half of 1992
and 2-1/2 percent in the second half.
Consumer spending is projected to rise 2-1/2 percent at an annual rate
in the second quarter of this year, with discretionary items such as motor
vehicles and other durable goods expected to show the biggest response.
Thereafter, real consumer spending is expected to moderate, closely tracking
gains in real disposable income and holding the saving rate a bit below
5 percent. With disposable income growth expected to be damped by rising
tax burdens over the next two years, PCE grows at roughly a 2 percent pace
over the remainder of the projection, somewhat below the growth in real GNP
overall.
Real business fixed investment continues to decline through the second
quarter, but turns up in the second half, as sales trends improve. All of

I-13
the increase is in the equipment category; outlays for nonresidential
construction are projected to fall sharply over the next two years.
Residential construction is expected to stabilize by midyear and then
to move higher, supported both by improved affordability and by prospective
improvements in real income and consumer confidence. The bulk of the
recovery in housing construction is expected to appear in the single-family
sector, but the level of starts remains below 1 million units through 1992
as the current excess stock of units is absorbed. In the multifamily
sector, the current overhang of vacant units looks to be a more serious
impediment, particularly in light of less favorable demographic trends.
Government purchases are expected to be stronger than forecast in the
December Greenbook. In contrast to the declines built into the budget
package, real federal purchases are projected to remain about unchanged this
year, with defense purchases off 2 percent. In 1992, the impact of the war
on defense spending wanes, and defense purchases are projected to decline
5-1/2 percent and total federal purchases 3-1/4 percent. (Nondefense
purchases are expected to rise 7 percent in 1991 and 3-1/2 percent in 1992.)
In the state and local sector, fiscal difficulties are expected to restrain
spending over the next two years. In 1991, state and local purchases rise
just 1/2 percent; they grow 1-3/4 percent in 1992, as the projected
improvement in economic conditions boosts tax receipts.
Our longer-term outlook continues to be for a noticeable slowing in
inflation over the projection period. However, with stronger output growth
in late 1991 and early 1992, the unemployment rate drifts back down to about
6 percent by next year, 1/2 percentage point lower than assumed previously.
This level of joblessness still is above our estimate of the natural rate of

I-14
unemployment, but the resulting downward pressure on labor costs is somewhat
less than in the December Greenbook. Excluding social security and minimum
wage effects, growth in the ECI is expected to decline only slowly between
mid-1991 and the end of 1992. In addition, below-average rates of capacity
utilization should continue to restrain price increases in the industrial
sector. Consequently, the increase in the GNP fixed-weight price index is
expected to slow to around 3-3/4 percent in 1992, compared with a 4 percent
rise in 1991 and a 4-3/4 percent rise last year. Similarly, the consumer
price index less food and energy, which rose 5-1/4 percent last year, is
expected to rise 4-3/4 percent in 1991 and 4 percent in 1992.

I-15
January 30, 1991CONFIDENTIAL - FRCLASS II FOMC STAFF GNP PROJECTIONS
Percent changes, annual rate
GNP fixed-weightprice index
ConsumerPrice Index <1>
12/12/90 1/30/91 12/12/90 1/30/91 12/12/90 1/30/91 12/12/90 1/30/91 12/12/90 1/30/91. . . . . . . . .. . .. . . . . . . . . . . . . . .. . . . . . . .. . . . . . . . . . . .. . . . . . . . . . .- -- -- --- - -- - -- - -- - -- - -- - -- - -- -- - - -- - -- - -- - -- - -- - -- - --- -- - _ - _ _
Annual changes:
1988 <2> 7.!1989 <2> 6.1990 <2> 5.:1991 4.11992 6.3
Quarterly changes:
1989 Q1 <2> 7.i02 <2> 5.103 <2> 5.:04 <2> 3.5
1990 01 <2>
02 <2>
03 <2>Q4 <2>
1991 01
020304
1992 0102
0304
3.6
1.61.7.3
1.7.4
1.4-2.1
-1.52.83.13.1
2.82.62.52.4
4.94.63.13.8
6.63.94.24.1
5.03.74.03.7
4.33.73.7
3.6
5.2 5.25.3 5.35.3 5.35.3 5.3
5.2 5.35.3 5.35.6 5.65.9 5.9
6.4 6.46.4 6.46.5 6.26.5 6.1
Two-quarter changes: <3>
1989 02 <2> 6.7Q4 <2> 4.5
1990 02 <2> 5.9
Q4 <2> 3.3
1991 02 5.0
04 6.0
1992 Q2 6.104 5.8
6.7 2,6 2.64.5 1.0 1.0
1.1 1.1-. 7 -. 4
4.7 4.73.4 3.4
5.3 5.34.3 4.2
4.8 4.43.7 3.8
2.4 2.72.4 2.5
Four-quarter changes: <4>
1988 04 <2> 7.8 7.8 3.5 3.5 4.6 4.6 4.3 4.3 -. 5 -. 51989 04 <2> 5.6 5.6 1.8 1.8 4.0 4.0 4.6 4.6 .0 .01990 04 <2> 4.6 4.3 .2 .3 4.8 4.7 6.3 6.3 .6 .6991 Q4 5.9 5.9 1.8 1.9 4.3 4.1 4.1 3.9 .6 .2192 Q4 6.0 6.2 7.4 2.6 3.8 3.8 3.8 3.9 .0 -. 1
<1> For all urban consumers.<2> Actual.<3> Percent change from two quarters earlier.<4> Percent change from four quarters earlier.
Nomindal GNP Real GNPUneoployment
rate(percent)
.0 .0
.0 .0
.0 .0
.6 .6
.5 .5
.1 -. 3
.0 .0
.0 -. 1

CONFIDENTIAL - FRCLASS II FOMC
EXPENDITURES
Nominal GNPReal GNP
Real GNPGross domestic purchases
Final salesPrivate dom. final purchases
Personal consumption expend.DurablesNondurablesServices
Business fixed investmentProducers' durable equipmentNonresidential structures
Residential structures
ExportsImports
Government purchases
FederalDefense
State and local
Change in business inventoriesNonfarm
Net exports
Nominal GNP
EMPLOYMENT AND PRODUCTION
Nonfarm payroll employmentUnemployment rate
Industrial production indexCapacity utilization rate-mfg.
Housing startsAuto sales
DomesticForeign
INCOME AND SAVING
Nominal personal incomeReal disposable incomePersonal saving rate
Corp. profits with IVA & CCAdjProfit share of GNP
Federal govt. surplus/deficitState and local govt. surplus
Ex.c social insurance funds
PRICES AND COSTS
GNP implicit deflatorGNP fixed-weight price index
Cons. & fixed invest, pricesCPI
Exc. food and energy
ECI hourly compensation
Nonfarm business sectorOutput per hour
Compensation per hour
Unit labor costs
I-16GROSS NATIONAL PRODUCT AND RELATED ITEMS
(Seasonally adjusted; annual rate)
Units
I 1
[Billions of $ 1Billions of 82: ;
[Percent change*II I
IPercenr changeI*
I lli IJPercenttPercent hange*iercen II I
1 IMillionsMillionsI I
I I
Millions
IMilllons
[PercentIPercentIPercent
change*[
change*l
(
IPercent change*I
IPercent
IBillions of 1
]Percent change*'
I II ]
January 30, 1991
Projection
1984 1985 1986 1987 1988 1989 1990 1991 1992
3772.23501.4
5.1
6.4
4.7
5.6
4.1
10.82.33.5
13.814.911.8
6.1
5.9
17.4
7.9
13.06.5
4.4
62.357.8
-84.0
8.6
4014.9 4231.63618.7 3717.9
3.64.3
4.64.6
4.6
7.03.35.0
3.7
4.61.95.8
-2,44.5
8.6
13.37.1
4.9
9.113.4
-104.3
6.6
1.92.1
2.7
2.9
3.8
11.52.9
2.1
-5.5
.4-17.7
11.6
10.6
10.0
3.1
.56.0
5.2
5.68.0
-129.7
4.6
4515.6
3845.3
5.04.2
3.12.5
2.3-1.21.3
4.1
6.18.2
.8-2.2
19.810.4
2.0
1.54.02.3
22.828.7
-118.5
8.2
4873.74016.9
3.5
2.6
4.54.0
4.1
9.3
2.4
3.7
5.3
8.2
-2.7
-. 1
S 14.05.5
1.1
-1. 6-1.8
3.1
23.626.5
-75.9
7.8
5200.84117.7
1.8
1.1
1.7
1.2
1.2-1.4
.6
2.4
4.55.4
1.7-7.1
10.1
4.5
.3-2.8-2.1
2.6
23.818.7
-54.1
5.6
5463.0 5701.94155.8 4177.7
.3 1.9
-.2 1.2
1.2 1.1
-. 2 .4
.2 1.2
-. 8 1.4-2.2 -.6
2.2 2.3
.9 -3.12.8 -1.9
-5.0 -7.2-8.7 -. 9
5.0 5.81.0 1.2
3.8 .3
5.5 .0
4.7 -2.22.5 .5
-1.1 -1.1-2.9 -3.6-37.5 -1.6
4.3 5.9
6071.54294,0
2.62.2
2.4
2.6
2,22.61,0
2.8
3.76.2
-5.37.4
8.5
6,0
-,3
-3.3-5.5
1,8
20.918,4
17.4
6,2
94.5 97.5 99.5 102.2 105.5 108.4 110.3 110.5 112.47.5 7.2 7.0 6.2 5.5 5.3 5.5 6.3 6,0
4.780.4
1.77
10.357.922.43
8.44.36.1
7.47.1
-169.664.6
19.8
3.43.7
3.3
4.2
5.0
4.9
1.5
4.1
2.6
1.979.5
1.74
11.038.22
2.82
6.6
2.7
4.4
9.27.0
-196.965.1
13.8
2.9
3.3
3.43.5
4.3
3.9
1.6
4.6
3.0
1.479.0
1.81
11.448.223.22
5.8
3.3
4.1
-5.66.7
-206.962.8
5.6
2.6
2.6
2.5
1.33.9
3.2
1.34.9
3.6
6.581.4
1.62
10.237.06
3.18
8.1
2.7
2.9
17.46.8
-158.251.0
-8.3
3.0
3.84.54.54.3
3.3
2.3
3.7
1.4
4.583.9
1.4910.657.553.10
7.6
4.34.2
8.26.9
-141.746.5
-16.4
4.1
4.6
4.34.34.5
4.8
1.8
4.2
2.3
1.183.9
1.389.897.062.83
6.8
1.7
4.6
-16.86.0
-134.346.4
-19.9
3.7
4.0
4.3
4.6
4.3
4.8
.1
82.2
1.19
9.536.92
2.61
5.6
-. 44.5
-2.35.4
-161.335.4
-34.0
4.0
4.7
5.26.3
5.2
4.6
-1.6 -. 3
2.2 4.23.9 4.6
2.279.3
1.068.726.392.33
6.2
1.9
4.9
2.54.8
-160.332.9
-39.8
3.94.1
3.83.9
4.7
4.3
1.3
4.5
3.2
3,680.2
1.18
9.336.78
2.56
6.71,9
4,7
2.44.9
-127.857.8
-18.4
3.5
3.8
3.83.9
4.0
4.0
1.3
4.0
2.7
* Percent changes are from fourth quarter to fourth quarter.

I-17
January 30, 1991CONFIDENTIAL - FR GROSS NATIONAL PRODUCT AND RELATED ITEMSCLASS II FOMC (Seasonally adjusted; annual rate)
S1988 1989 1990
S Units I 1 02 03 Q4 Q1 Q2 Q3 04 01 02
EXPENDITURES
Nominal GNP Billions of $ 1 4735.8 4831.4 4917.9 5009.8 5101.3 5174.0 5238.6 5289.3 5375.4 5443.3Real GNP IBillions of 825$ 3970.2 4005.8 4032.1 4059.3 4095.7 4112.2 4129.7 4133.2 4150.6 4155.1
Real GNP tPercent Change 1 5.1 3.6 2.7 2.7 3.6 1.6 1.7 .3 1.7 .4Gross domestic purchases I 1.6 3.0 3.2 2.4 1.2 1.8 2.8 -1.2 .5 1.3
Final sales 7.1 5.1 1.1 4.6 2.4 1.7 1.8 .9 3.8 -. 7Private dom. final purchases 6.7 4.8 3.0 1.7 .8 1.4 4.1 -1.5 2.4 -1,2
Personal consumption expend. 6.9 2.7 3.5 3.5 -. 3 1.3 4.6 -. 8 1.1 .2Durables 21.8 3.7 -1.1 14.1 -6.0 5.6 9.6 -13.0 14.4 -9.5Nondurables 2.6 2.0 4.1 1.2 .6 -1.7 3.9 -. 2 -3.2 -1I.Services 5.6 2.9 4.5 1.9 .9 2.1 3.5 3.1 .1 5.1
Business fixed investmant I 1 11.4 15.7 1.6 -6.3 8.9 6.9 6.3 -3.8 5.0 -4.7Producers' durable equipnt k 20.3 17.9 2.2 -5.5 9.5 12.2 6.1 -5.2 5.7 -3.3Nonresidential structures -10.5 9.9 -. 3 -8.7 7.5 -8.2 7.1 1.3 2.3 -9.0
Residential structures -6.8 6.8 .4 -. 4 -3.6 -11.3 -7.6 -5.5 15.1 -11.2
Exports 1 31,7 4.4 5.4 16.7 15.8 12.4 -. 5 13.5 11.2 -5.0Imports 1 .5 .3 9.2 12.4 -2.3 12.8 6.4 1.7 2.5 .7
Government purchases I -9.2 3.3 -3.8 15.7 -3.3 4.0 -2.4 3.0 2.9 6.2Federal -24.1 3.5 -10.4 33.6 -9.1 7.0 -7.9 -. 4 .4 16.4
Defense -5.6 -1.4 -5.0 4.9 -10.9 3.2 7.2 -7.0 -1.7 3.3State and local I 3.9 3.2 1.2 4.3 1.3 1.8 1.8 5.6 4.8 -. 6
Change in business inventories (UiKiLons of 82$1 31.0 16.9 32.6 14.0 26.1 25.5 24.6 18.9 -2.2 9.5Nonfarm IBillions of 82$1 28.8 19.2 31.0 27.2 16.4 21.5 21.7 15.3 -8.2 11.6
Net exports (Billions of 82$1 -77.3 -72.2 -78.5 -75.7 -51.1 -53.3 -64.1 -47.9 -35.4 -44.1
Nominal GSP IPercent change 7.8 8.3 7.4 7.7 7.5 5.8 5.1 3.9 6.7 5.1
EMPLOYMENT AND PRODUCTION
Nonfarm payroll employment Millions 104.3 105.1 105.9 106.8 107.6 108.2 108.7 109.2 109.9 110.5Unemployment rate IPercent* 5.7 5.5 5.5 5.3 5.2 5.3 5.3 5.3 5.3 5.3
Industrial production index IPercent change 1 5.0 4.2 5.9 2.8 2.7 2.8 -1.2 .2 .6 4.2Capacity utilization rate-mfg. Percent* 83.1 83.6 84.3 84.6 84.7 84.5 83.7 82.9 82.6 82.8
Housing starts IMillions I 1.46 1.49 1.47 1.54 1.51 1.35 1.34 1.35 1.45 1.20Auto sales IMillions 10.91 10.67 10.15 10.88 10.03 10.26 10.20 9.09 10.01 9.53
Domestic (Millions 7.60 7.50 7.20 7.89 7.08 7.26 7.36 6.56 7.11 6.78Foreign INillions 3.30 3.17 2.95 2.99 2.95 3.00 2.84 2.53 2.90 2.75
INCOME AND SAVING
Nominal personal income (Percent change 6.4 8.6 8.1 7.4 11.6 5.8 3.7 6.2 8.6 5.3Real disposable income (Percent change 7.3 2.7 4.9 2.3 4.2 -1.2 2.7 1.2 2.5 .3Personal saving rate IPercent* 4.0 4.1 4.5 4.1 5.2 4.6 4.1 4.6 4.9 5,0
Corp. profits with IVA & CCAdJ (Percent change 9.5 6.6 -1.7 19.5 -23.2 -7.0 -17.1 -19.1 8.4 13.9Profit share of GNP (Percent* 7.0 7.0 6.8 7.0 6.4 6.2 5.9 5.5 5.5 5.6
Federal govt. surplus/deficit IBillions of $ 1 -153.7 -136.9 -120.1 -156.3 -132.6 -122.7 -131.7 -150.1 -168.3 -166.0State and local govt. surplus 45.5 48.3 46.8 45.2 48.9 50.3 48.1 38.5 38.1 38.6
Exc. social insurance funds -15.6 -14.1 -17.0 -19.0 -16.2 -15.6 -18.7 -29.1 -30.2 -30.4
PRICES AND COSTS
GNP implicit deflator 1Percent change 2.7 4.4 4.7 4.7 3.9 3.9 3.2 3.8 4.8 4.7GNP fixed-weight price index I3.9 4.7 5.5 4.4 4.9 4.6 3.1 3.8 6.6 3.9Cons. & fixed invest, prices 2.9 4.9 4.5 5.0 5.0 5.3 2.3 4.6 6.8 2.6CPI 3.5 4.2 5.2 4.1 5.4 6.0 2.9 3.9 8.2 3.8
Exc. food and energy I 4.4 4,7 4.6 4.6 5.2 4.1 3.8 4.4 6.2 4.9
ECI hourly compensation** 5.2 5.2 3.8 5.1 4.2 4.9 5.3 4.4 5.6 5.1
onfarm business sectorOutput per hour 4.7 -. 5 2.8 .2 -2.7 -. 3 -1.0 -2.5 -1.3 .3Compensation per hour 2.4 5.1 5.3 3.8 3.3 1.7 1.6 2.3 3.9 5.0Unit labor costs 1 I -2.2 5.7 2.5 3.6 6.1 2.0 2.6 5.0 5.3 4.7
* Not at an annual rate.** Private industry workers

I-18
January 30, 1991
CONFIDENTIAL - FR GROSS NATIONAL PRODUCT AND RELATED ITEMSCLASS II FOMC (Seasonally adjusted; annual rate)
Projection--------------------------------------------------------------
1990 1991 1992
Units 03 04 01 Q2 Q3 Q4 Q1 02 Q3 Q4
EXPENDITURES
Nominal GNP )Billions of $ 5514.6 5518.9 5563.3 5654.0 5748.1 5842.1 5939.5 $027.4 6115.6 6203.5
Real G1'P Billions of 821 4170.0 4147.6 4132.2 4161.1 4192.5 4224.9 4254.1 4281.0 4307.4 4333.5
Real GNP |Percent Change 1.4 -2.1 -1.5 2.8 3.1 3.1 2.8 2.6 2.5 2.4
Gross domestic purchases I 1.6 -4.2 -2.9 2.3 2.6 2.7 2.2 2.0 2.2 2.2
Final sales 1 1.9 -. 1 -1.3 1.7 1.9 2.1 2.3 2.6 2.5 2.4Private dorm, final purchases I I 2.3 -4.0 -3.5 1.2 1.9 2.2 2.4 2.6 2.8 2.7
Personal consumption expend. 2.7 -3.1 -1.5 2.5 1.7 2.0 2.1 2.2 2.2 2.2
Durables 2.6 -8.6 -6.6 7.6 3.1 2.1 2.4 2.6 2.8 2.5Nondurables 2.3 -5.8 -5.4 1.6 .5 .8 .9 1.0 1.0 1.0Services 3.0 .7 2.9 1.5 2.1 2.7 2.7 2.8 2.8 2.8
Business fixed investment 8.9 -4.6 -9.3 -4.5 .4 1.6 3.1 3.6 4.0 4.1
Producers' durable equipment 10.2 -. 7 -9.4 -3.8 2.5 3.8 5.6 6.2 6.6 6.6
Nonresidential structures 5.1 -16.5 -9.5 -7.2 -6.6 -5.6 -5.5 -5.4 -5.2 -5.2
Residential structures I I -19.8 -15.4 -15.7 -2.8 8.8 8.2 5.6 7.5 9.5 6.9
Exports 6.9 7.8 -. 3 6.5 7.8 9.3 8.9 8.7 8.5 7.8
Imports 7.6 -6.3 -9.0 3.2 5.1 6.3 5.3 5.5 6.9 6.4
Government purchases i 1.2 4.9 .5 1.5 -. 2 -. 6 -. 6 -. 3 -. 4 .0
Federal .1 6.0 .2 2.6 -. 9 -1.9 -3.2 -3.1 -3.7 -3.1Defense 2.7 15.0 2.6 -3.7 -3.7 -3.7 -5.2 -5.3 -6.1 -5.5
State and local 2.0 4.0 .7 .7 .3 .3 1.2 1.7 1.9 2.2
Change in business inventories |Billions of 82$1 4.7 -16.3 -18.3 -7.1 5.1 15.8 20.6 20.6 21.0 21.5
Nonfarm IBillions of 82$1 4.7 -19.8 -21.S -8.7 3.0 13.3 18.1 18.0 18.5 19.0
Net exports IBillions of 82$f -46.5 -23.6 -8.6 -3.6 .6 5.3 11.1 16.5 19.6 22.2
Nominal GNP IPercent change 5.3 .3 3.3 6.7 6.8 6.7 6.8 6.0 6.0 5.9
MPLOYMENT AND PRODUCTION I
Nonfarm payroll employment IMillions 110.7 110,2 109.9 110.1 110.7 111.3 111.7 112.2 112.6 113.1
Unemployment rate IPercent* 5.6 5.9 6.4 6.4 6.2 6.1 6.1 6.1 6.0 6.0
1Industrial production index IPercent change 1 3.9 -7.9 -4.6 4.0 4.9 5.0 4.1 3.5 3.5 3.2
Capacity utilization rate-mfg. IPercent* I 82.8 80.5 78.8 79.0 79.4 79.8 80.1 80.2 80.3 80.3
Housing starts (Millions 1 1.13 1.05 1.00 1.04 1.09 1.11 1.15 1.17 1.20 1.22
Auto sales (Millions I 9.68 8.93 8.20 8.73 8.91 9.02 9.15 9.29 9.40 9.49
Domestic IMillions 7.21 6.59 6.10 6.38 6.49 6.57 6.67 6.75 6.81 6.88
Foreign [Millions 2.47 2.34 2.10 2.35 2.42 2.45 2.48 2.54 2.59 2.61
INCOME AND SAVING
Nominal personal income IPercent change 5.0 3.5 6.3 6.1 5.5 7.0 7.9 6.3 5.9 6.6Real disposable income IPercent change -. 7 -3.6 2.5 2.2 .6 2.4 2.6 1.6 1.4 2.1Personal saving rate IPercent* 4.2 4.1 5.0 4.9 4.7 4.8 4.9 4.8 4.6 4.6
Corp. profits with IVA & CCAdj IPercent change I -7.5 -20.1 -29.7 15.0 21.4 12.5 6.6 -3.0 .6 5.5
Profit share of GNP IPercent* 5.5 5.2 4.7 4.8 4.9 5.0 5.0 4.9 4.8 4.8
Federal govt. surplus/deficit IBillions of $S -145.7 -165.2 -175.6 -168.5 -149.0 -148.2 -144.2 -132.1 -118.6 -116.3
State and local govt. surplus I 39.3 25.5 22.6 28.0 35.9 44.9 51.1 - 55.8 60.3 64.1Exc. social insurance funds I -30.5 -44.9 -48.7 -44.2 -37.2 -29.1 -23.8 -20.0 -16.4 -13.5
PRICES AND COSTS
GNP implicit deflator IPercent change 3.7 2.8 4.7 3.8 3.7 3.5 3.9 3.4 3.4 3.3GNP fixed-weight price index I 4.2 4.1 5.0 3.7 4.0 3.7 4.3 3.7 3.7 3.6
Cons. & fixed invest. prices I 5.4 6.1 3.4 3.8 4.1 3.8 3.9 3.8 3.7 3.6CPI 6.3 6.9 3.4 3.8 4.3 4.1 4.1 4.0 3.6 3.7
Exc. food and energy I I 5.8 3,9 5.2 4.5 4.7 4.6 4.3 4.1 3.9 3.8
ECI hourly compensation*' I 4.3 3.8 4.6 4.4 4.1 4.0 4.3 3.9 3.8 3.8
'onfarm business sector IOutput per hour I .2 -. 3 -.6 2.6 1.8 1.5 1.4 1.3 1.2 1.2Compensation per hour I 4.6 3.6 5.9 4.2 4.0 4.1 4.4 3.9 3.8 3.8Unit labor costs I 4.4 3.8 6.5 1.6 2.2 2.6 3.0 2.6 2.6 2.6
* Not at an annual rate.** Private industry workers

CONFIDENTIAL - FRCLASS II FOMC
GROSS NATIONAL PRODUCT AND RELATED ITEMS(Net changes, billions of 1982 dollars)
January 30, 1991
S1988 1989 1990 1987 1988 1989 1990
S ---------------------------- ---------- --------------- ------------ (fourth quarter to fourth quarter,
S 01 Q2 Q3 Q4 01 Q2 03 Q4 01 02 not change)
I I
Real GNPGross donmstic purchases
Final salesPrivate dotm. final purchases
Personal consurption expend.DurablewNondurablesServices
Business fixed investmentProducers' durable equipmntNonresidential structures
Residential structures
Change in business inventoriesNonfarmFarm
Net exportsExportsImports
Governmnnt purchasesTaederal.
DefenseNondefense
State and local
49.5 35.6 26.315.5 30.5 32.6
66.9 49.7 10.651.8 36.3 24.4
17.3 22,33.8 -1.14.4 9.19.1 14.2
12.7 17.616.0 14.9-3.4 2.9-3.4 3.2
-17.4-26.6
9.1
34.034.7
.7
-18.9-23.2
-3.8-19.4
4.3
-14.1-9.6-4.5
27.2 36.4 16.5 17.5 3.5 17.4 4.524.4 11.8 18.7 28.3 -12.7 4,9 13,7
45.7 24.4 17.0 18.5 9,3 38.4 -7.214.2 6.5 11.4 34.1 -12.9 20.2 -10.3
22.4 -2.1 8.6 30.0 -5.4 7.4 1.513.9 -6.6 5.8 9.9 -15.0 14.5 -10.82.7 1.4 -3.9 8.8 -.4 -7.4 -4.46.0 3.0 6.7 11.3 10.0 .4 16.6
-8.0 10.5 8.4 7.8 -4.9 6.2 -6.2-5.2 8.4 10.9 5.7 -5.2 5.4 -3.3-2.8 2.2 -2.6 2.1 .4 .7 -2.9
-.2 -1.8 -5.7 -3.7 -2,6 6.5 -5,5 1
15.7 -18.611.8 -3.83.9 -14.8
5,1 -6.3 2.85.6 7.0 21.0
.5 13.3 18.2
-7.5-8.9-3.3-5.6
1.3
29.723.93.1
20.84.8
12,1-10.9
22.9
-.6 -.9 -5.7 -21.15,1 .2 -6.4 -23.5
-5.7 -1.1 .7 2.4
24.6 -2.2 -10.820.8 17.1 -. 7-3.7 19.2 10.1
-6.7-8.1-7.4
-. 8
1.5
-4.8-6.9
4.5-11.4
2.1
11.719.8-8.1
16.2 12.5 -9.219.1 16.5 -8.02.8 4.1 1.2
6.0 5.7 12,3-. 3 .3 12.9
-4.7 -1.1 2.14.4 1.4 10.96.3 5.5 -. 7
187.1163,0
117,978.5
56.4-4.911.749.6
26.625.61.0
-4.5
69.266.3
3.0
24.180.556.4
15.35.3
10.2-4.910.0
138.6 73.9 14.4103,0 46.1 -9.9
172.9 69.2 49.5128.7 39.1 -5.1
104.636,421.946,4
31.1 5.9-5.9 -3.2
5.9 -20.231.0 29.3
24.3 21.827.7 19.8-3.4 2.1-,2 -13.8
-34.4-28.2-6.3
35.668,332.7
8.6-5,4
-4.9-.5
13.9
4.9-11.9
16.8
27.856.328.4
2.3-9.6-5.6-4.012.0
4.810.9-6.1
-15.9
-35.2-35.1
-. 1
24.330.86.6
30.318.411.96.4
11.9
- - -- ----
Itf

CONFIDENTIAL - FRCLASS II FOMC
GROSS NATIONAL PRODUCT AND RELATED ITEMS(Net changes, billions of 1982 dollars)
January 30, 1991
1990------------
Real GNPGross domestic purchases
Final salesPrivate dom. final purchases
Personal consumption expend.DurablesNondurablesServices
Business fixed investmentProducers' durable equipmentNonresidential structures
Residential structures
Change in business inventoriesNonfarmFarm
Net exportsExportsImports
Government purchasesFederal
DefenseNondefense
State and local
Projection
1991 1992--. ----------------.---- .. ----------------------------- I
Q3 Q4 01 Q2 Q3 04 01 02 03 Q4
14.9 -22.4 -15.4 28.9 31.4 32.4 29.2 27.0 26.4 26.116.8 -45.3 -30.4 23.9 27.2 27.7 23.4 21.5 23.3 23.4
19.7 -1.4 -13,4 17,7 19.2 21.7 24.4 27,0 26.0 25.619.1 -34.1 -29.4 9.7 15.4 18.3 19.9 22.2 23.9 22.9
18.0 -21.0 -10.0 16.6 11.6 13.1 13.9 14.7 14.9 14.82.7 -9.6 -7.1 7.7 3.2 2.2 2.6 2.8 3.0 2.75.2 -13.6 -12.4 3.9 1.1 1.7 2.1 2.2 2.2 2.3
10.0 2.3 9.6 5.0 7.2 9.2 9.2 9.7 9.7 9.8
10.9 -6.1 -12.4 -5.8 .5 2.0 3.8 4.5 5.0 5.29.5 -.7 -9.6 -3.7 2.4 3.6 5.3 6.0 6.4 6.51.5 -5.4 -2.9 -2.1 -1.9 -1.6 -1,5 -1.5 -1.4 -1.4
-9.8 -7.1 -6.9 -1.1 3.4 3.2 2.3 3.0 3.9 2.9
-4,8 -21.0 -2.0 11.2 12.2 10.7 4.8 .0 .4 .5-6.9 -24,5 -2.0 13.1 11.7 10.3 4.8 -. 1 .5 .52.1 3.5 .0 -1.9 .5 .4 .0 .1 -.1 .0
-1.9 22.9 15.0 5.0 4.2 4.7 5.8 5.4 3.0 2.710.4 11.9 -.5 10.1 12.4 14.9 14.6 14.6 14.7 13.712.3 -11.0 -15.5 5.2 8.2 10.3 8.8 9.1 11.6 11,0
2.5 9.8 1.1 3.0 -.4 -1.3 -1.4 -.7 -.9 .1.1 5.1 .2 2.2 -.8 -1.7 -2.9 -2.7 -3.2 -2.6
1.7 9.2 1.7 -2.5 -2.5 -2.5 -3.5 -3.5 -4.0 -3.5
-1.6 -4.2 -1.4 4.7 1.7 .8 .6 .8 .8 .92.4 4.7 .9 .8 .4 .4 1.5 2.0 2.3 2.7
1989 1990(fourth quarter
Projection
1991 1992
to fourth quarter,net change)
73.9
46.1
69.239.1
31.1-5.95.9
31.0
21.819.8
2.1-13.8
4.9-11.9
16.8
27.856.328.4
2.3-9.6-5.6-4.012.0
14.4 77.3 108.6-9.9 48.4 91.6
49.5 45.2 102.9-5.1 13.9 88.8
5.9-3.2
-20.229.3
4.810.9
-6.1-15.9
-35.2-35.1
-. 1
31.25.9
-5.731.0
-15.7-7.3
-8.5-1.5
32.133.1-1.0
24.3 28.930.8 37.06.6 8.2
30.3 2.418.4 -.111.9 -5.86.4 5.8
11.9 2.5
58.211.0
8.838.4
1.8.524.3-5.812.1
5.75.7
.0
16.957.540.6
-2.9-11.4-14.5
3.18.5
~I
CONFIDENTIAL - FR CLASS II
FEDERAL SECTOR ACCOUNTS 1
(Billions of dollars)
Fiscal years1990 1991 1992
1989a 1990a 1991 1992 Ia IIa IIIa IVa I II III IV I II II Iv
BUDGET Not seasonally adjusted
Budget receipts 2 991 1031 1115 1183 230 319 254 254 253 331 278 282 272 353 296 277Budget outlays 2 1144 1252 1398 1459 310 331 31. 341 344 358 356 313 359 362 364 361Surplus/deficit(-) 2 -153 -220 -283 -276 -80 -12 158 -87 -91 -27 -71 -111 -87 -10 -68 -84
(On-budget) -206 -277 -347 -345 -94 -41 -65 -97 -107 -50 -93 -118 -107 -35 -85 -93(Off-budget) 53 57 64 69 14 29 7 10 16 23 18 7 20 26 16 9
Surplus excludingdeposit insurance 3 -131 -162 -192 -182 -74 17 -41 -72 -71 0 -49 -88 -63 14 -45 -71
Means of financing:Borrowing 140 263 298 261 90 41 69 99 67 46 86 101 63 38 60 84Cash decrease 3 1 0 5 8 -16 -6 8 6 -9 -4 15 5 -20 5 10Other 4 10 -44 -15 10 -18 -13 -6 -20 17 -10 -3 -5 19 -8 4 -10
Cash operating balance,end of period 41 40 40 39 18 35 40 32 26 36 40 25 20 40 35 25
NIPA FEDERAL SECTOR Seasonally adjusted annual rates
Receipts 1038 1092 1166 1263 1081 1106 1126 1135 1157 1175 4199 1222 1257 1276 1295 1318Expenditures 1174 1249 1331 1399 1240 1272 1272 1300 1333 1343 1348 1371 1401 1408 1414 1435
Purchases 400 415 446 451 41 422 426 439 446 440 449 449 453 452 450 449Defense 301 307 330 326 307 310 313 327 333 332 329 327 328 325 322 318Nondefense 99 107 116 126 10I 112 113 112 113 118 120 122 125 127 129 131
Other expend. 774 835 885 947 838 850 846 862 887 494 899 921 948 956 964 985Surplus/deficit -136 -158 -165 -136 -160 -166 -146 -165 -17S -168 -149 -148 -144 -132 -119 -116
FISCAL INDICATORS 5
High-employment (HEB)surplus/deficit(-) -149 -150 -109 -82 -166 -154 -127 -123 -114 -107 -90 -92 -90 -78 -66 -64
Change in HEB, percentof potential GNP 0 0 -. 8 -. 5 .3 -. 2 -. 5 -. 1 -. 2 -. 1 -. 3 0 0 -. 2 -. 2 0
Fiscal impetus measure(FI), percent -3.5 * -3.4 * -3.1 * -3.7 * -2.3 1.2 -. 8 1.4 -4.3 .7 -. 5 -. 6 -2.2 -. 7 -. 8 -. 6
a--actual *--calendar year
Note: Details may not add to totals due to rounding.
1. Staff projections. CBO's January deficit estimates are $298 billion in FY1991 and $284 billion in FY1992. OMB's baseline deficit estimatesmade for the Budget Summit (September 1990), in combination with their preliminary estimates of the savings in the recent budget agreement,imply deficits of $255 billion in FY1991 and $233 billion in FY1992.
2. Budget receipts, outlays, and surplus/deficit include social security (OASDI) receipts, outlays and surplus, respectively. The OASDI surplusis excluded from the "on-budget" deficit and shown separately as "off-budget", as classified under current law. The Postal Service deficit isincluded in off-budget outlays beginning in FY1990.
3. CBO's January deficit estimates, excluding deposit insurance spending, are $194 billion in FT1991 and $186 billion in FY1992. OMB's Septemberdeficit projections, excluding deposit insurance spending, are $158 billion in FY1991 and $153 billion in FY1992.
4. Other means of financing are checks issued less checks paid, accrued items; and changes in other financial assets and liabilities.5. BEB is the NIPA measure in current dollars with cyclically-sensitive receipts and outlays adjusted to a 6 percent unemployment rate and 2.3%
potential output growth in the forecast period. Quarterly figures for change in HEB and FI are not at annual rates. Change in HEB, as a percentof nominal potential GNP, is reversed in sign. FI is the weighted difference of discretionary federal spending and tax changes (in 1982 dollars),scaled by real federal purchases. For change in REB and FI, (-) indicates restraint.
January 3t, 1991

DOMESTIC FINANCIAL DEVELOPMENTS
Recent Developments
Developments in the Middle East exerted considerable influence on stock
and bond markets over the intermeeting period. With the prospects for a
peaceful resolution to the Gulf crisis fading and oil prices rising, stock
and bond prices lost ground as the January 15 deadline approached. After
the outbreak of hostilities, however, sentiment shifted, as investors
concluded that oil supplies were likely to remain ample. For the period as
a whole, net changes in long-term rates were narrowly mixed, while most
major stock indexes moved about 2 percent higher.
In the money market, Treasury bill rates fell between 40 and 50 basis
points, primarily in conjunction with the easing of monetary policy. Other
money market rates posted much larger declines, reflecting the unwinding of
year-end financing pressures. With their funding costs falling, major banks
responded in early January by lowering their prime lending rate one-half
percentage point to 9-1/2 percent. The federal funds rate varied widely
over the period, buffeted by year-end pressures, reserve shortfalls at the
end of maintenance periods, and fluctuating demands for excess reserves
associated with the elimination of reserve requirements on nontransaction
accounts.
Incoming data point to continued sluggish growth in the broad monetary
aggregates. M2 grew at an estimated 2 percent rate in January, around
December's pace. The continued weakness in M2 partly reflected the behavior
of core deposits--consisting of money market deposit accounts, savings
1-22

I-23
deposits, and small time deposits--which increased only slightly despite
further declines in opportunity costs. Also damping growth in M2 was a
large decline in demand deposits that appears, at least partly, to represent
a new seasonal pattern arising from increased use of fees, rather than
compensating balances, to pay for bank services. In contrast, money funds
grew rapidly, owing primarily to an unusually wide gap between yields on
money fund shares and Treasury bill rates; in addition, apprehension about
the condition of the banking system may have prompted some individuals to
shift out of bank deposits, as evidenced both by the increase in
noncompetitive tenders at the weekly bill auctions and by relatively strong
inflows to government-only money funds. Currency growth also was strong in
January, as shipments abroad increased.
After being essentially unchanged since October, M3 grew at an
estimated 4 percent rate in January. It was boosted by a surge in large
time deposits, as banks apparently shifted some of their funding from
overseas sources to the U.S. CD market. Growth in M3 did not reflect a
strengthening in depository credit; indeed, preliminary data indicate that
the shrinkage of thrift assets continued apace in January and bank credit
probably declined slightly after rising at a 2-1/2 percent rate in December.
Business loans contracted in January in reflection of generally weak
business credit demands. In addition, a shift back into commercial paper by
those borrowers who moved out of that market as the year-end approached may
have contributed to the falloff in business lending. Consumer lending,
which had been boosted in December by special factors, also was weak this
month, as was real estate lending, which has been negligible for the past
two months, apart from two banks' purchases of thrift assets in December.

I-24
In line with the falloff in economic activity, debt growth of the
nonfederal sectors declined to an estimated 4-1/2 percent rate in the fourth
quarter. Borrowing by state and local governments fell sharply, primarily
because of a decrease in short-term borrowings, which had been heavy in the
second and third quarters when several states funded revenue shortfalls. In
the household sector, weak housing demand damped mortgage borrowing, while
consumer borrowing slowed significantly. Even revolving consumer credit,
which had grown at double-digit rates for most of the year, slackened in the
fourth quarter, held back by reduced consumer spending and a step-up in
repayments of high-cost debt. Business debt continued to advance at a
lackluster pace in the fourth quarter, evidently reflecting a decrease in
fixed investment and inventory liquidation; early evidence suggests that
business borrowing softened further in January. The composition of
corporate borrowing shifted during the fourth quarter toward bonds and away
from bank loans and commercial paper, as corporations took advantage of the
drop in long-term yields in November and early December. In contrast to the
nonfederal sectors, Treasury borrowing increased sharply, primarily
reflecting the effect of the recession on revenue growth.
New information on the credit crunch points to a little more credit
stringency. The most recent survey of senior loan officers at large banks
revealed further tightening in lending terms on business, consumer, and real
estate loans between October and January. In addition, quality spreads on
corporate bonds are unchanged to up slightly, while those for commercial
paper, though down from their elevated year-end levels, are a bit above
levels prevailing prior to the onset of year-end pressure. Moreover,
ratings changes on municipal, nonfinancial, and financial securities

I-25
displayed further deterioration in the fourth quarter. Finally, December's
survey of credit conditions for small businesses, taken by the National
Federation of Independent Business, continued to show only a small
percentage of respondents encountering increased difficulty in obtaining
credit. No deterioration in credit availability has been picked up in the
survey since June of last year, and the degree of credit stringency reported
thus far is mild compared with earlier recessions.
Outlook
The staff's economic projection is based on the assumption that the
federal funds rate remains around 6-3/4 percent through 1992. This level
represents about a 1/2 percentage point reduction from that assumed in the
December projection, which did not envision the policy easing undertaken
since then. Long-term interest rates have not shared in the recent easing,
and no major change in the benchmark Treasury bond yield is anticipated over
the next two years.
The economic outlook is such as to suggest, however, that risk premia
on business and municipal debt obligations will increase further. In the
past, these premia have risen throughout recessions, and with the credit
quality of both sectors likely to show further deterioration in coming
months, a similar pattern is expected in the current downturn. Furthermore,
lenders probably will remain relatively cautious farther into the recovery
than they typically have in the past, partly because of the need for many
intermediaries to rebuild capital and the slow improvement in many
borrowers' financial condition.
In this context, debt of the domestic nonfinancial sectors is projected
to expand at about a 6-1/2 percent rate in 1991 and 1992, slightly above

I-26
nominal GNP growth but down a bit from last year's rate. In the past, debt
growth has picked up in economic recoveries; the failure to do so in 1991
primarily reflects the relatively subdued pace of the recovery in the
presence of credit supply constraints, which restrain borrowing by the
nonfederal sectors. In 1992, nonfederal borrowing strengthens but is offset
by a sharp drop in federal government borrowing, resulting from a reduction
in net outlays for the RTC, along with more rapid revenue growth. Over the
projection period, the effect of RTC-related outlays on federal debt growth
is considerable, adding 3 percentage points in 1991 and 2 percentage points
in 1992.
Among the nonfederal sectors, borrowing by nonfinancial businesses is
expected to be about unchanged in the current quarter, with the financing
needed for AT&T's expected acquisition of NCR offsetting what are otherwise
weak credit demands. Over the remainder of the projection period, corporate
cash flow recovers much more slowly than capital expenditures, producing a
steady but moderate rise in the financing gap. Net equity retirements,
however, are expected to fall back in the second quarter to the lowest level
since 1983. Little change from this level is anticipated thereafter, as
lenders likely will remain cool to highly leveraged transactions, limiting
acquisition activity primarily to transactions financed by equity exchanges
or to purchasers with strong balance sheets. With limited merger-related
borrowing, business debt picks up only a little through 1992.
In the household sector, consumer debt is expected to be about
unchanged in the current quarter but will start to grow with the start of
the economic recovery in the spring. Consumer debt growth should strengthen
over the remainder of the projection period but remain well below the rates

I-27
experienced throughout most of the 1980s. The restrained growth of consumer
credit is largely a demand phenomenon that reflects a moderate increase in
consumption spending, relatively high debt burdens, and the availability of
tax-advantaged home equity loans. Traditional providers of consumer
credit--banks and finance companies--are not likely to pull back from this
lucrative business unless delinquency rates move well above current levels,
which is not expected to occur in the projected mild recession.
The rate of expansion of home mortgage debt should begin to increase
modestly by midyear in line with rising housing starts and higher turnover
of existing homes. Nonetheless, mortgage debt growth projected through 1992
is moderate, especially compared with the double-digit rates that prevailed
over most of the past decade and a half.
Borrowing by state and local governments will be negligible this year
but will strengthen a bit in 1992. Many governmental units have encountered
revenue shortfalls, which are expected to lead to cutbacks or delays in
capital projects. Net bond offerings also will be damped this year by heavy
retirements financed from the proceeds raised in previous advance
refundings.

Confidential FR Class IIJanuary 30, 1991
GROWTH RATES OF DEBT BY SECTOR 1
(Period-end to period-end)
------------------- Domestic Nonfinancial Sectors------------------
----- Households-----
U.S. Non- HomeTotal govt. federal Total mtgs.
Cons.credit Business
State &localgovts.
------- Memo--------
Privatefinancialassets 2
NominalGNP 3
Annual (percent)
9.311.514.414.212.3
19821983198419851986
19871988198919901991
1992
9.09.17.57.16.5
1989 -- 01Q2Q3Q4
1990 -- Q1Q2Q3Q4
1991 -- Q1Q2Q304
1992 -- Q1Q2Q3Q4
19.418.816.916.213.4
8.08.07.2
12.011.6
8.5
7.04.68.08.3
10.99.7
11.913.1
9.79.6
13.112.2
7.87.78.48.9
6.99.6
13.713.612.0
9.39.57.55.64.8
5.8
5.411.412.914.112.8
11.610.98.97.65.6
4.511.011.711.914.9
14.012.210.5
9.17.1
6.5 7.9
4.412.618.715.99.6
5.17.25.32.01.3
2.9
Quarterly (percent-SAAR)
9.2 10.6 5.18.0 9.7 4.98.7 10.2 4.88.5 9.6 5.7
8.6 10.2 1.87.6 9.4 1.27.8 8.4 3.55.7 7.1 1.2
5.1 6.8 0.05.4 6.7 1.35.7 7.0 2.05.8 7.2 2.0
6.1 7.4 2.56.2 7.6 2.76.4 7.8 3.16.5 8.0 3.1
1. Published data through 1990:3; projections for other periods2. Sometimes referred to as the "Kaufman debt proxy"; it includes holdings
(currency and deposits) and credit market instruments.3. Annual figures are Q4 to Q4.
2.6.3 FOF
of liquid assets
7.88.3
15.611.412.0
7.08.26.74.24.7
5.6
9.17.17.9
23.77.6
9.68.24.92.00.7
3.2
10.311.813.412.09.1
7.88.77.45.84.7
5.0
3.110.48.66.64.6
8.27.85.64.35.9
6.2
6.75.15.30.3
3.36.76.86.7
6.86.06.05.9
8.48.35.63.8
6.03.23.44.0
4.34.34.94.9
5.35.35.75.7
~1~11·

Confidential FR Class IIJanuary 30, 1991
FLOW OF FUNDS PROJECTION HIGHLIGHTS 1(Billions of dollars, seasonally adjusted annual rates)
Calendar year ----------- 1990----------- ----------- 1991-----------1989 1990 1991 1992 Q1 Q2 Q3 Q4 Q1 Q2 Q3 Q4
Net funds raised by domestic1 nonfinancial sectors 554,0 633.0 633.0 686.4 693.1 576.6 634.6 627.7 539.8 568.3 713.4 710.42 Net equity issuance -124,2 -63.0 -49.8 -45.0 -69.0 -48.0 -74.0 -61.0 -64.0 -45.0 -45.0 -45.03 Net debt issuance 678,2 696.0 682.7 731.4 762.1 624.6 708.6 688.7 603.8 613.3 758.4 755.4
Borrowing sectorsNonfinancial business
4 Financing gap2 3.9 35.2 36.7 52.9 10.7 28.1 58.3 43.6 21.9 29.7 40.4 54.95 Net equity issuance -124.2 -63.0 -49.8 -45.0 -69.0 -48.0 -74.0 -61.0 -64.0 -45.0 -45.0 -45.06 Credit market borrowing 211.9 143.8 165.5 208.0 205.4 110.7 118.1 141.0 153.0 153.8 176.9 178.4
Households7 Net borrowing, of which: 285.0 266.6 212.0 258.0 300.0 270.2 283.4 212.5 193.7 205.4 221.4 227.38 Home mortgages 221.6 213.6 183.1 218.1 239.3 226.6 208.1 180.4 175.5 176.2 187.1 193.99 Consumer credit 39,1 15.6 10.9 23.8 14.6 9.8 27.7 10.1 0.1 10.8 16.8 16.1
10 Debt/DPI (percent)3 89.0 92.3 93.7 93.7 92.0 92.8 94.0 94.6 94.3 94.1 94.3 94.2
State and local governments11 Net borrowing 29.6 12.6 4.8 20.7 9.0 14.9 20.5 6.0 5.8 0.5 4.2 8.912 Current surplus4 -25.7 -37.8 -30.5 -10.9 -34.2 -39.7 -41.6 -35.4 -38.7 -34.6 -28.1 -20.4
U.S.government13 Net borrowing from public 151.6 273.0 300.4 244.8 247.6 228.7 286.7 329.1 251.4 253.6 355.9 340.814 Net borrowing from public5 151.6 273,0 300.4 244.8 64.5 40.8 68.4 98.8 67.4 45.7 85.5 101.215 Unified budget deficit5 155.0 236.7 307.0 248.3 80.2 11.8 57.8 86.9 90.6 26.7 78.4 111.3
Funds supplied by16 depository institutions 92.8 -7.6 -65.2 -23.4 133.0 -73.1 -47.1 -43.0 -83.9 -54.6 -57.9 -64.317 Share of total (percent)6 13.5 -1.1 -9.2 -3.1 17.5 -11.0 -6.4 -6.1 -13.4 -8.6 -7.4 -8.2
Memoranda: As percent of GNP:18 Dom. nonfinancial debt3 181.7 186.5 191.4 191.4 186.4 187.0 188.6 191.6 192.7 192.4 192.5 192.619 Dom. nonfinancial borrowing 13.0 12.7 12.0 12.0 14.2 11.5 12.9 12.5 10.9 10.8 13.2 12.920 U.S. government 7 2.9 5.0 5.3 4.0 4.6 4.2 5.2 6.0 4.5 4.5 6.2 5.821 Private 10.1 7.7 6.7 8.0 9.6 7.3 7.7 6.5 6.3 6.4 7.0 7.1
1. Published data through 1990:3; projections for other periods.4. NIPA surplus, net of retirement funds.2. For corporations: excess of capital expenditures over 5. Quarterly data at quarterly rates, nsa.
U.S. internal funds. 6. Total in this ratio includes foreign borrowing3. Annuals are average debt levels in the year (computed as the in U.S.
average of year-end debt positions) divided by annual GNP. 7. Excludes gov't-insured mortgage pool securities.
2.6.4 FOF
INTERNATIONAL DEVELOPMENTS
Recent developments
The weighted-average foreign exchange value of the dollar, in terms of
the other G-10 currencies, is virtually unchanged on balance, since the
December 18 FOMC meeting. The dollar declined 1 percent against the yen and
sterling, but rose 3/4 percent against the mark. The dollar exhibited wide
swings over the period. In thin pre-Christmas markets, the dollar rose more
than 3 percent amid concerns about dollar funding for the year-end and then
remained firm until trading began for the new year. The deteriorating
political situation in the Soviet Union also contributed to the dollar's
temporary strength, especially against the German mark. Soon after year-
end, the dollar rose further as the likelihood of war in the Persian Gulf
appeared to increase. Following the outbreak of war, the dollar appreciated
very briefly, but then declined sharply on news of the apparent success of
the first strike by Allied forces.
Interest rates abroad changed little over the intermeeting period,
except in Canada where short-term interest rates eased by a full percentage
point. Short-term Japanese rates declined 5 to 10 basis points while long-
term rates fell somewhat more. German short-term rates rose early in the
period, but subsequently retraced that rise as expectations of an increase
in the Bundesbank's Lombard rate were not fulfilled. In both Germany and
Japan, stock prices declined considerably in the weeks before the outbreak
of war. Since the fighting began, stock prices in both countries have
partially recovered from pre-war losses.
U.S. authorities did not intervene, but the Desk did convert funds
I-30

I-31
received from Japan to help finance our efforts in the Persian Gulf.
The latest indicators of activity in the foreign industrial countries
show a somewhat mixed pattern, but on balance growth seems to have slowed in
recent months. The reduced pace of activity appears to have come largely in
reaction to monetary policy tightness that began several quarters ago,
higher oil prices, uncertainties about effects of the Gulf crisis, and
slower U.S. growth. In Japan, although pressures on capacity have increased
and labor markets remain tight, there are signs in some sectors that the
economy may be slowing in response to the tighter stance of monetary policy
that has been in place for several quarters. Growth in Western Germany
slowed in the fourth quarter as net exports weakened. Although industrial
production in Eastern Germany picked up in November, the fourth-quarter
average was still nearly 50 percent below the year-earlier level. French
activity appears to have slumped again in the fourth quarter, following a
third-quarter recovery. Fourth-quarter indicators in Canada and the United
Kingdom point to continued recessions.
Declines in oil prices and lessened demand helped moderate the pace of
consumer-price inflation in some countries at the end of the year. The
consumer price index moved up sharply in Japan in January, although special
factors are cited as largely responsible, while accelerating wages and the
introduction of the Goods and Services Tax in Canada may have added to
Canadian price pressures.
The U.S. merchandise trade deficit widened in October to $11.0 billion
(seasonally adjusted, Census basis), but then narrowed to $9.7 billion in
the preliminary data for November. For October-November combined, the
deficit was substantially greater than quarterly averages earlier in 1990.
This increase was more than accounted for by a higher value of oil imports,
as higher prices were partly offset by declines in the quantity of imported

I-32
oil. The average value of non-oil imports in October-November was 4 percent
higher than in the third quarter, while the value of exports rose 5 percent.
According to data released by the BLS, prices of imported oil dropped
for the the second successive month in December, after having doubled
between July and October. Prices of non-oil imports rose at an annual rate
of 6.1 percent in the fourth quarter, after increasing only moderately
earlier in the year. Export prices rose at a 4.4 percent rate in the fourth
quarter, as sharp increases in the prices of nonagricultural products were
only partly offset by further declines in the prices of agricultural
exports.
Outlook
The current forecast incorporates a path for the foreign exchange
value of the dollar essentially unchanged from the projection in the
December Greenbook. Growth in foreign industrial and developing countries,
weighted by their importance to U.S. exports, is projected to be slightly
weaker in the near term than in the December Greenbook, but then to rebound
later this year to record a rate of 2-1/4 percent over the four quarters of
1991 and to reach 3-1/4 percent in 1992.
The projected quantities of both U.S. exports and imports have been
revised up in the near term. Real net exports are forecast to improve
substantially in the current quarter, much the same as presented in the
December Greenbook. Following this improvement in the current quarter, the
projected pattern of external adjustment in both real and nominal terms
calls for continuing, although less rapid, improvement through 1992.
External balances in real and nominal terms are still expected to improve
significantly over the forecast horizon.
The Dollar. The outlook for the foreign exchange value of the dollar
is little changed from that in the December Greenbook, both in terms of the

I-33
other G-10 currencies and in terms of the currencies of eight major
developing countries. Against the G-10 currencies, the dollar is expected
to decline slightly in the near term as the safe-haven demand recedes
further and then to remain unchanged at near its lows in November 1990.
Against the developing country currencies, the dollar is projected to
depreciate slightly in real terms. Risks to the forecast for the dollar
appear to be about evenly balanced in the near term. If the Allied forces
suffer setbacks in the Persian Gulf, if oil supplies are threatened, or if
turmoil in the Soviet Union intensifies, the dollar could appreciate. A
relatively quick resolution of these problems, on the other hand, might
cause market participants to refocus on the weakness in the U.S. economy and
perceptions of fragility in the U.S. financial system and prompt a decline
in the dollar.
Foreign Industrial Countries. On average, growth in the foreign G-10
countries is projected to remain this year at about 2-1/2 percent (on a
Q4/Q4 basis), before strengthening to about 2-3/4 percent in 1992. This
forecast has been revised down slightly in the near term from what had been
projected in December, but the expected rate of growth is unchanged for
1992. Continued growth is projected for Japan and Western Germany in the 3-
1/2 to 3-3/4 percent range in both years, although in the latest forecast
some West German growth has been put off to 1992 in light of the weaker-
than-expected stimulus from Eastern Germany and diminished net exports. The
recession in the United Kingdom appears to be more severe than had been
judged earlier; the staff now estimates that the United Kingdom experienced
nearly 1/2 percent negative growth during 1990 and expects recovery to
proceed more slowly than was forecast in December. Projected recoveries in
Canada and the United Kingdom, as well as positive effects on all countries
of resolution of the uncertainties related to the Gulf crisis, are expected

I-34
to contribute to the modest bounce-back of foreign G-10 growth later this
year and next year.
A somewhat more favorable projection for oil prices and slightly
weaker near-term activity have contributed to a slight lowering of the
forecast for average consumer-price inflation for the foreign G-10 countries
this year to 4 percent (Q4/Q4 basis), nearly a full percentage point less
than the rate of inflation estimated for last year. Average inflation is
expected to ease further to about 3-3/4 percent in 1992.
Monetary policy abroad is expected to be generally unchanged from what
had been assumed for the December outlook. Short-term interest rates in the
foreign G-10 countries on average are expected to remain at about current
levels in the first half of this year and then to move down gradually by
about a percentage point by the end of the forecast horizon. The near-term
projection for short-term interest rates in Germany has been moved up
slightly since the December Greenbook to reflect recent increases. Once
German interest rates reach a peak at roughly mid-year, they still are
expected to move down by about 1/2 percentage point by the end of 1992.
Over the forecast period, Japanese short-term interest rates are expected to
move down from present levels, also by about 1/2 percentage point.
Developing Countries. On average, growth in developing countries
slowed in 1990 to about 2-1/2 percent and is projected to remain largely
unchanged this year before accelerating to about 4 percent in 1992. Since
the last Greenbook, the outlook for growth in 1991 has been revised down
across all regions, especially in the Middle East. Overall growth in 1992
is largely unchanged since the last Greenbook. Average output in developing
countries in the Western Hemisphere is estimated to have declined somewhat
last year, but is projected to recover in 1991-92, due to stronger growth in
oil-exporting countries and a recovery of activity in many non-oil exporting

I-35
countries. Output in Asia, which grew 5 percent in 1990, is not expected to
accelerate further until 1992 when external demand improves.
U.S. Merchandise Trade Quantities. The quantity of U.S.
nonagricultural exports is expected to grow moderately during the current
quarter and then to expand at double-digit rates over the rest of the
forecast period. This outlook reflects the effects of the 15 percent
decline in the weighted-average foreign exchange value of the dollar over
the past year and a projected rebound in growth abroad after the middle of
this year.
Agricultural exports are expected to pick up somewhat in the first
quarter as sales to the Soviet Union increased significantly in recent
weeks. Beyond the first quarter little further growth is anticipated
because demand for imported grains and soybeans in the major U.S. export
markets is expected to remain sluggish.
TRADE QUANTITIES(Percent change, annual rate)
----------- Projection ----------1990 1991 1992
Q4/Q4 Q1/Q4 Q2/Q1 Q4/Q2 Q4/Q4
Nonagricultural exports 9.0 3.6 10.3 12.4 11.3Agricultural exports -5.1 31.8 0.2 -10.2 1.3
Non-oil imports 2.3 -7.8 0.7 7.1 7.2Oil imports -9.8 6.1 33.0 7.0 6.7
* GNP basis, 1982 dollars.
The quantity of non-oil imports is projected to decline in the first
quarter, as a result of the downturn in U.S. domestic demand. This near-
term drop in imports is somewhat larger than in the December forecast,
reflecting an expected reversal of some of the unusually strong increases

I-36
recorded in the fourth quarter. These imports are projected to resume
expanding with the recovery in U.S. economic activity.
After having declined in the fourth quarter, the quantity of oil
imports is expected to continue at a low rate in the first quarter as oil is
withdrawn from the strategic petroleum reserve. Oil imports are projected
to expand steadily over the next two years as domestic demand recovers and
as domestic production of crude oil continues to trend down.
Real Net Exports of Goods and Services. Real net exports of
merchandise are expected to improve significantly in the first quarter and
less rapidly thereafter. After the first quarter, this outlook is a bit
weaker than in the December Greenbook, largely because of some strengthening
in the projection for U.S. real GNP and a slightly weaker outlook for demand
in the rest of the world. With real net exports of services still expected
to show a moderately positive trend over the forecast period, net exports of
goods and services are projected to improve by nearly $30 billion at an
annual rate during the four quarters of 1991 and by another $17 billion next
year.
Merchandise Trade Prices. The fixed-weight price index for
nonagricultural exports is projected to increase only moderately during the
first half of 1991 and then to rise at about a 2-3/4 percent rate
thereafter, in line with the projected rate of increase in domestic producer
prices (weighted by export shares). The rate of increase in prices of non-
oil imports is expected to be about 5-1/2 percent through the first half of
this year, and then to decline over the forecast period. This outlook is
only marginally changed from the last Greenbook forecast.

I-37
SELECTED PRICE INDICATORS(Percent change, annual rate)
----------- Projection ----------1990 1991 1992
Q4/Q4 Q1/Q4 Q2/Q1 Q4/Q2 Q4/Q4
PPI (export-share wts.) 4.7 -0.7 0.4 2.4 2.7Nonagric exports (Fx-Wt) 2.7 1.0 1.4 2.6 2.7
Non-oil imports (Fx-Wt) 3.2 5.4 5.3 4.4 3.6Oil imports (Fx-Wt) 63.7 -60.3 -24.1 0.0 0.0
Oil Import Price. The quarterly average price of oil imports peaked
in 1990-Q4 at an estimated $29 per barrel and is expected to decline to $21
per barrel in the second quarter and remain at that level through 1992.
This projection for oil import prices is somewhat lower than in the December
Greenbook, reflecting recent events and our changed assumptions about
developments in the Middle East. Underlying the current price path is the
assumption that OPEC producers will set production in order to maintain the
$21 per barrel target agreed upon in the July 1990 accord. This outcome
would be achieved, for example, if Saudi Arabian production averaged more
than 8 mb/d during 1991 and Iraq gradually resumed production after the
assumed end to the Gulf war in the middle of the second quarter. To
maintain the $21 per barrel price in 1992, Saudi Arabia would need to reduce
production if Iraq increased production further and Kuwaiti production
began to recover. There is tremendous uncertainty regarding post-war
production capability in both Iraq and Kuwait and the response of Saudi
Arabia to a resumption of production in Iraq and Kuwait. Moreover, prices
are likely to move in an erratic pattern in the short run, depending on the
course of events.

I-38
Current Account Balance. The continuing effects of the depreciation
of the dollar are projected to contribute to a gradual improvement in the
trade deficit, which is forecast to reach an annual rate of about $90
billion in 1991 and $80 billion in 1992. The projected deficits for 1991
and 1992 are not significantly different from the forecast in the December
Greenbook.
Net portfolio payments to foreigners are expected to rise over the
next two years because of rising U.S. international indebtedness. These
rising net payments are expected to be offset by increased receipts on net
direct investment income. While both projected receipts and expenditures on
travel have been lowered slightly for the first three quarters of 1991 as a
result of the Persian Gulf war, net travel receipts are little changed. The
outlook for military transactions (part of "services") incorporates
increased military sales and expenditure. Sales to Saudi Arabia under
special Desert Shield/Storm arrangements amounted to an estimated $1.7
billion (not annual rate) in the fourth quarter of 1990; since this
equipment came out of military inventories, these transactions were excluded
from exports in the GNP accounts. Similar sales of military equipment to
foreign governments from U.S. inventories are projected for 1991.
The outlook for the current account also includes an estimate for cash
grants received from foreign governments associated with Operation Desert
Shield/Storm. These grants are now estimated to amount to $4-1/2 billion
(not at an annual rate) in the fourth quarter of 1990, and $20 billion in
both 1991 and 1992 (assumed to be received at a rate of $5 billion per
quarter). As a result, the current account balance is now projected to have
narrowed substantially during the fourth quarter, to narrow further in the
first quarter, and to continue to improve on balance at a more moderate pace
thereafter, reaching about $35 billion for 1992.

Strictly Confidentialtial (FR) Class II-FOMC
Outlook for U.S. Net Exports and Related Items(Billions of Dollars, Seasonally Adjusted Annual Rates)
January 29, 1991
1. GNP Exports and Imports 1/
Current $, NetExports of G+SImports of G+S
Constant 82 $, NetExports of G+SImports of G+S
2. Merchandise Trade Balance 2/
ExportsAgriculturalNon-Agricultural
ImportsPetroleum and ProductsNon-Petroleum
3. Other Current Account Trans.
Capital Gains and Losses 3/Other D.I. Income, NetPortfolio Income, NetOther Current Account, Net
4. U.S. Current Account Balance
Including Capital G/LExcluding Capital G/L
5. Foreign Outlook 4/
Real GNP--Ten Industrial 5/Real GNP--LDC 6/Consumer Prices--Ten Ind. 5/
ANNUAL1990-P 1991-P 1992-P
-38.0670.4708.4
-13.1713.5726.7
9.7790.1780.5
-37.5 -1.6 17.4630.3 659.5 715.7667.8 661.1 698.3
-111.2 -92.5
389.1 425.240.6 42.7
348.5 382.5
-80.6
480.445.1
435.3
500.3 517.7 561.063.1 64.2 68.1437.3 453.5 492.9
2,7 0.0 0.045.4 46.7 47,4
-43.4 -45.8 -46.613.2 38.1 46.4
---------------------.
S 1990-03 -04
-41.3672.7716.1
-55.9687.77 43.7
191PQl-P -Q2-P -Q3-P -Q4-P
-24.3688.8713.2
-14.0703.0717.1
-9.6720.8730.5
-4.5741.3745.8
1992Q1-P -Q2-P -Q3-P -Q4-P
2.1760. 9759 0
8.1780.4772.4
12.3 16.4800.1 818.9787.9 802.6
-46.5 -23.6 -8.6 -3.6 0.6 5.3 11.1 16.5 19.6 22.2630.5 642.4 641.9 652.1 664.5 679.4 694.0 708.6 723.2 736.9677.0 666.0 650.5 655.7 663.9 674.2 682.9 692.1 703,7 714.7
-119.0 -128.4 • -99.7 -92.2 -90,4 -87.9 -84.3 -81.6 -79.4 -77.1
384.6538.9
345.7
399.738.3
361 .4P
406.441.8
364.6
417.742.7
375.0
431 .443.1
388 .4
445.243.1
402.1
459.9 473,9 487,743.7 44.4 45.6416.1 429.4 442.1
500.046.6
453.3
503.6 528.1 506.1 509.9 521.8 533.0 544.2 555.5 567.1 577.162.8 78.50 63.2 63.4 64.5 65.5 66.3 67.1 68.9 69.9440.9 449.6 442.9 446.5 457.3 467.5 477.9 488.3 498.2 507.2
5.6 0.0 0.0 0.0 0.0 0.0 0.0 0.0 0.0 0.0 o47.7 49.22 46.4 46.9 46.9 46.6 47.2 47.7 47.5 47.3 '
-43.5 -44.?f -45.7 -45.5 -45.9 -46.1 -46,2 -46,4 -46.7 -47.06.8 29.0 P 35,5 37,1 39.9 40.0 44.7 46.7 48.1 46.3
-93.4 -53.5 -33.3 -102.3 -94,6 -63.4 -53.7 -49.4 -47.4 -38,7 -33.6 -30.5 -30.4-96.0 -53.5 -33.3 -10 7 .9 -94.60 -63.4 -53.7 -49.4 -47.4 -38.7 -33.6 -30.5 -30.4
3.1 1.9 2.82.6 2.6 4.24.6 4.4 3.7
2.7 0.8 1.7 2.2 2.9 3.0 2.8 2.8 2.8 2.82.3 2.2 z 2.2 2.7 3.3 3.8 4.3 4,6 4.8 5.03.8 5 .5C 4.4 4.4 3.1 3.9 3.5 4.0 3.3 4.1
1/ National Income and Product Account data.2/ International accounts basis.3/ The net of gains (+) or losses (-) on foreign-currency denominated assets due to their revaluation at current exchange ratesand other valuation adjustments.4/ Percent change, annual rates.5/ Weighted by multilateral trade-weights of G-10 countries plus "^itzerland; prices are not seasonally adjusted.6/ Weighted by share in LDC GNP.P/ Projected