Fomc 19851001 g Bpt 119850925
26
Prefatory Note The attached document represents the most complete and accurate version available based on original copies culled from the files of the FOMC Secretariat at the Board of Governors of the Federal Reserve System. This electronic document was created through a comprehensive digitization process which included identifying the best- preserved paper copies, scanning those copies, 1 and then making the scanned versions text-searchable. 2 Though a stringent quality assurance process was employed, some imperfections may remain. Please note that this document may contain occasional gaps in the text. These gaps are the result of a redaction process that removed information obtained on a confidential basis. All redacted passages are exempt from disclosure under applicable provisions of the Freedom of Information Act. 1 In some cases, original copies needed to be photocopied before being scanned into electronic format. All scanned images were deskewed (to remove the effects of printer- and scanner-introduced tilting) and lightly cleaned (to remove dark spots caused by staple holes, hole punches, and other blemishes caused after initial printing). 2 A two-step process was used. An advanced optimal character recognition computer program (OCR) first created electronic text from the document image. Where the OCR results were inconclusive, staff checked and corrected the text as necessary. Please note that the numbers and text in charts and tables were not reliably recognized by the OCR process and were not checked or corrected by staff.
-
Upload
fraser-federal-reserve-archive -
Category
Documents
-
view
213 -
download
0
Transcript of Fomc 19851001 g Bpt 119850925

Prefatory Note
The attached document represents the most complete and accurate version available based on original copies culled from the files of the FOMC Secretariat at the Board of Governors of the Federal Reserve System. This electronic document was created through a comprehensive digitization process which included identifying the best-preserved paper copies, scanning those copies,1 and then making the scanned versions text-searchable.2 Though a stringent quality assurance process was employed, some imperfections may remain.
Please note that this document may contain occasional gaps in the text. These gaps are the result of a redaction process that removed information obtained on a confidential basis. All redacted passages are exempt from disclosure under applicable provisions of the Freedom of Information Act.
1 In some cases, original copies needed to be photocopied before being scanned into electronic format. All scanned images were deskewed (to remove the effects of printer- and scanner-introduced tilting) and lightly cleaned (to remove dark spots caused by staple holes, hole punches, and other blemishes caused after initial printing). 2 A two-step process was used. An advanced optimal character recognition computer program (OCR) first created electronic text from the document image. Where the OCR results were inconclusive, staff checked and corrected the text as necessary. Please note that the numbers and text in charts and tables were not reliably recognized by the OCR process and were not checked or corrected by staff.

Strictly Confidential (FR) Class I FOMC
September 25, 1985
SUMMARY AND OUTLOOK
Prepared for the Federal Open Market Committee
By the staff of the Board of Governors of the Federal Reserve System

DOMESTIC NONFINANCIAL DEVELOPMENTS
Recent developments. Economic activity appears to have expanded
moderately in the third quarter. Auto sales have increased sharply since
mid-August, reducing the stocks of 1985 cars. But outlays for other
types of consumer and investment goods have been sluggish in recent
months. At the same time, recent increases in prices and wages have been
relatively small.
The index of industrial production rose 0.3 percent in August, but
with downward revisions to earlier months, was only 1/2 percent above the
second-quarter average. Increases in August were largest for consumer
durable goods--mainly because of a spurt in assemblies of light trucks--
and for defense and space equipment. Output of consumer goods other than
motor vehicles has shown little net change in recent months. Industrial
capacity utilization--at 80-1/2 percent in August--has been essentially
flat since spring.
Labor demand picked up in August, with nonfarm payroll employment
expanding nearly 300,000-well above the average monthly increment in the
preceding four months. Hiring continued to be brisk in services, trade,
and finance. In addition, manufacturing employment rose for the first
time since January, although much of the reported increase may reflect
seasonal adjustment difficulties during the model changeover period in
the motor vehicles industry. The civilian unemployment rate, which had
held at 7.3 percent since February, dropped to 7.0 percent in August.
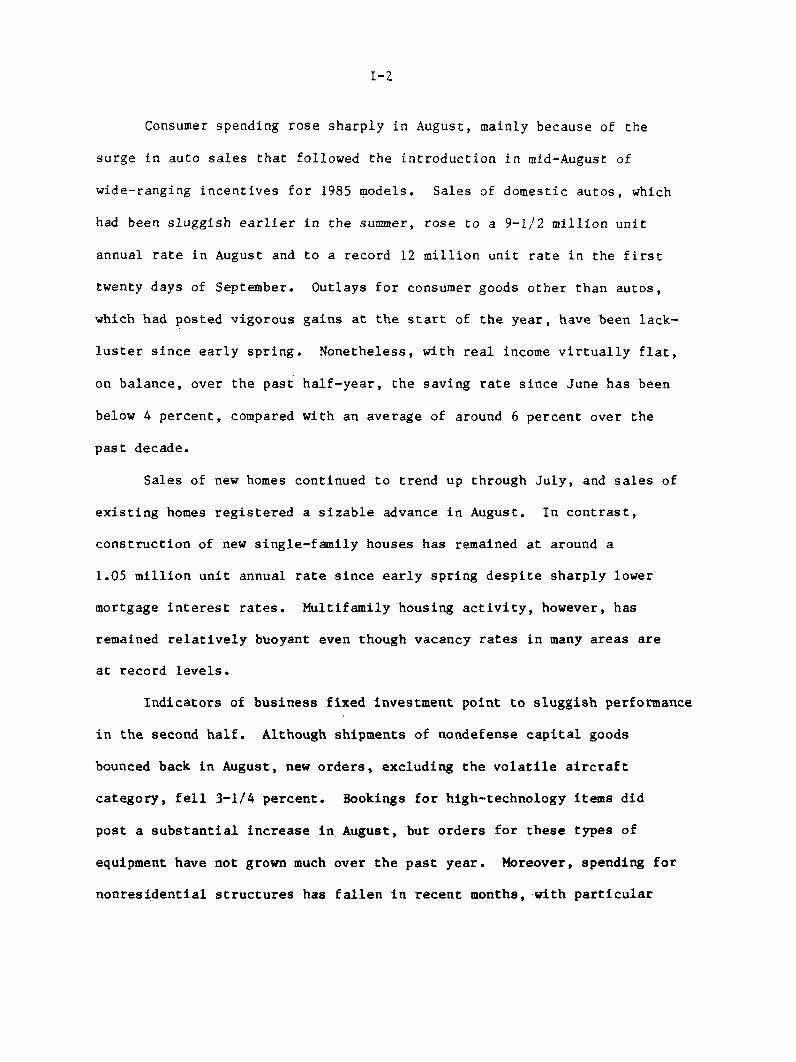
Consumer spending rose sharply in August, mainly because of the
surge in auto sales that followed the introduction in mid-August of
wide-ranging incentives for 1985 models. Sales of domestic autos, which
had been sluggish earlier in the summer, rose to a 9-1/2 million unit
annual rate in August and to a record 12 million unit rate in the first
twenty days of September. Outlays for consumer goods other than autos,
which had posted vigorous gains at the start of the year, have been lack-
luster since early spring. Nonetheless, with real income virtually flat,
on balance, over the past half-year, the saving rate since June has been
below 4 percent, compared with an average of around 6 percent over the
past decade.
Sales of new homes continued to trend up through July, and sales of
existing homes registered a sizable advance in August. In contrast,
construction of new single-family houses has remained at around a
1.05 million unit annual rate since early spring despite sharply lower
mortgage interest rates. Multifamily housing activity, however, has
remained relatively buoyant even though vacancy rates in many areas are
at record levels.
Indicators of business fixed investment point to sluggish performance
in the second half. Although shipments of nondefense capital goods
bounced back in August, new orders, excluding the volatile aircraft
category, fell 3-1/4 percent. Bookings for high-technology items did
post a substantial increase in August, but orders for these types of
equipment have not grown much over the past year. Moreover, spending for
nonresidential structures has fallen in recent months, with particular

weakness in outlays for "other" commercial buildings such as stores and
warehouses and for industrial structures.
Inventory investment in July continued at about the slow second-
quarter pace. Faced with sluggish orders and shipments, manufacturers
have held their stocks unchanged this year. In the trade sector,
stocks at nonauto retailers also have shown little change, on balance,
in recent months, although they continue to appear a bit high in relation
to sales. At automobile dealers, stocks of 1985 models are being drawn
down by the special financing incentives; given current production
schedules and an expected sales "payback" in coming months, an accumulation
of 1986 models is likely in the fourth quarter.
Recent price and wage data suggest that inflation is holding
steady at rates somewhat lower than earlier in the year. The consumer
price index rose 0.2 percent for a fourth month in August, below the
average monthly change between December and April. Retail food and
energy prices, on balance, have been virtually flat since early spring.
Prices of goods other than food and energy were little changed in
August after declining for three months, in part because of continuing
competition from low-priced imports; increases in prices of services,
however, remain sizable. Wage rates, as measured by the index of
average hourly earnings, were flat in July and August, and now stand
just 3 percent above the level of a year earlier.
Outlook. The staff estimates that real GNP rose at a 3 percent
annual rate in the third quarter, compared with a 1 percent rate in the
first half. Growth in domestic final demand appears to have been
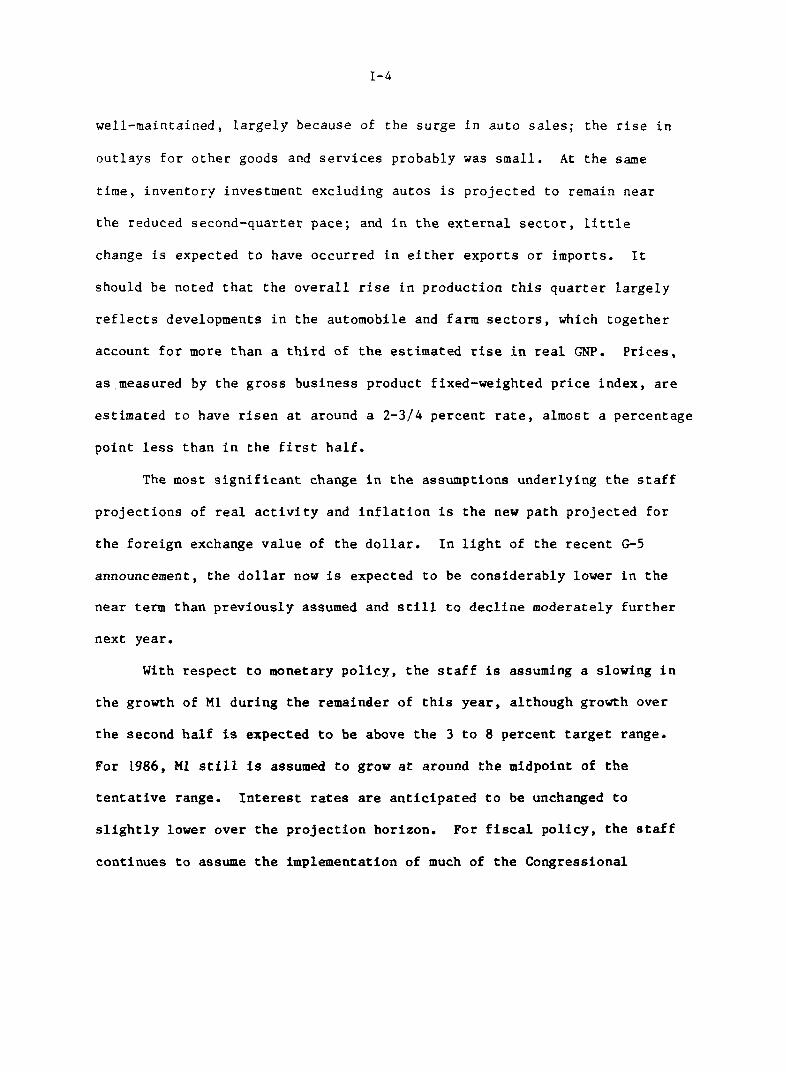
well-maintained, largely because of the surge in auto sales; the rise in
outlays for other goods and services probably was small. At the same
time, inventory investment excluding autos is projected to remain near
the reduced second-quarter pace; and in the external sector, little
change is expected to have occurred in either exports or imports. It
should be noted that the overall rise in production this quarter largely
reflects developments in the automobile and farm sectors, which together
account for more than a third of the estimated rise in real GNP. Prices,
as measured by the gross business product fixed-weighted price index, are
estimated to have risen at around a 2-3/4 percent rate, almost a percentage
point less than in the first half.
The most significant change in the assumptions underlying the staff
projections of real activity and inflation is the new path projected for
the foreign exchange value of the dollar. In light of the recent G-5
announcement, the dollar now is expected to be considerably lower in the
near term than previously assumed and still to decline moderately further
next year.
With respect to monetary policy, the staff is assuming a slowing in
the growth of M1 during the remainder of this year, although growth over
the second half is expected to be above the 3 to 8 percent target range.
For 1986, M1 still is assumed to grow at around the midpoint of the
tentative range. Interest rates are anticipated to be unchanged to
slightly lower over the projection horizon. For fiscal policy, the staff
continues to assume the implementation of much of the Congressional

Budget Resolution that was passed in August, although the assumed reductions
in outlays for defense, human resources, and farm programs are a bit
smaller than the congressional targets. The federal budget deficit on a
unified budget basis is now estimated at $200 billion in fiscal year 1985
and is projected to decline only a bit, to around $192 billion in fiscal
year 1986. After four years of rapid growth, the structural deficit is
likely to show little change in 1986.
Real GNP growth is expected to average around 2-3/4 percent over
the next five quarters--a bit more than in the last Greenbook. The principal
changes to this projection reflect the lower exchange rate. In particular,
imports of goods and services are now projected to stabilize during 1986,
owing to anticipated large increases in prices of foreign goods. In
addition, increased competitiveness for U.S. exports is expected to be a
stimulus to domestic production next year. Thus, despite a projected
moderation in domestic final demand to a 2 percent rate during 1986,
domestic production is projected to pick up somewhat.
For domestic demand, the smaller gains projected for 1986 reflect
the absence of incremental fiscal stimulus, the diminishing backlog of
pent-up demands for household durables, and continued slow growth of
business investment. With the saving rate currently below 4 percent and
indebtedness historically high, consumer spending is expected to slow to
a pace more in line with underlying income growth. Auto sales, in particular,
are expected to be well maintained at around 10-3/4 million units next
year, but to make no further net contribution to gains in household
spending. Growth in business fixed investment also is projected to

remain slow. Although the incentive to invest in new technologies
remains strong, gains in the equipment area are likely to be inhibited by
the substantial margin of existing unused capacity, and outlays for
structures are anticipated to be held down by the end of the boom in
office building. In contrast, homebuilding is projected to provide some
impetus to growth.
The outlook for inflation also is affected by the revised path for
the dollar. Incoming information on prices and wages has been quite
favorable, and resource utilization rates are anticipated to be little
changed over the projection horizon. However, the forces restraining
inflationary pressures are anticipated to be more than offset by rising
costs associated with the sharper depreciation of the dollar. In addition,
food prices, which are expected to be essentially flat in 1985, are
projected to rise nearly as much as overall prices in 1986. Reflecting
these influences, the fixed-weighted price index for gross business
product is projected to increase 4-1/4 percent next year, an acceleration
from the 3-1/4 percent rise expected this year that is sharper than shown
in the last Greenbook.
Detailed data for these projections are in the tables shown on the
following pages.

September 25, 1985I-7
STAFF GNP PROJECTIONS
Percent changes, annual rate
Gross domesticbusiness productfixed-weightedprice index Unemployment
Nominal GNP Real GNP ------------------------ rate
Total Excluding food (percent)and energy
8/14/85 9/25/85 8/14/85 9/25/85 8/14/85 9/25/85 8/14/85 9/25/85 8/14/85 9/25/85
Annual changes:
1983 <1> 7.71984 <1> 10.81985 6.11986 6.2
Quarterly changes:
1984 Q1 <1> 14.9Q2 <1> 10.7Q3 <1> 5.6Q4 <1> 7.1
1985 Ql <1>Q2 <1>Q3Q4
1986 Q1Q2Q3Q4
Two-quarter changes: <2>
1984 Q2 <1> 12.8Q4 <1> 6.4
7.710.8
6.16.3
14.910.7
5.67.1
5.64.56.25.8
5.67.17.37.6
12.86.4
3.76.82.42.7
10.17.11.64.3
.31.93.03.0
2.52.72.82.9
8.6 8.62.9 2.9
1985 Q2 <1> 5.1 5.1 1.0 1.1Q4 6.1 6.0 3.1 3.0
1986 Q2 6.3 6.3 2.5 2.6Q4 6.5 7.4 2.5 2.9
4.2 4.23.8 3.8
3.5 3.73.4 2.8
3.8 3.94.2 4.4
4.4 4.44.4 4.4
4.1 4.44.5 4.8
Four-quarter changes: <3>
1983 Q4 <1> 10.4 10.41984 Q4 <1> 9.5 9.51985 Q4 5.6 5.51986 Q4 6.4 6.9
9.6 9.67.5 7.57.3 7.37.1 7.1
7.9 7.97.5 7.57.4 7.47.2 7.2
7.3 7.37.3 7.37.3 7.27.2 7.2
7.1 7.27.1 7.17.1 7.07.1 7.0
-1.0 -1.0-. 3 -. 3
.1 .1-. 1 -. 1
-. 1 -. 1.0 -. 1
-2.1 -2.1-1.3 -1.3
.0 .0-. 1 -. 2
<1> Actual.<2> Percent change from two quarters earlier.<3> Percent change from four quarters earlier.

CONFIDENTIAL - FRCLASS II FOMC
September 25, 1985GROSS NATIONAL PRODUCT AND RELATED ITEMS
(Quarterly figures are seasonally adjusted. Expenditures and income
figures are billions of current dollars at annual rates.)
1983 1984
Q1 Q2 Q3 Q4 Q1 Q2 Q3 Q4
3173.83154.23216.82538.02518.4
Gross National ProductGross domestic purchases
Final salesPrivateDomestic final purchases
Personal consumption expendituresGoodsServices
Gross private domestic investmentResidential structuresBusiness fixed investmentChange in business inventoriesNonfarm
Net exports of goods and services <1>ExportsImports
Gov't. purchases of goods and servicesFederal <2>State and local
Gross national product inconstant (1972) dollars
3267.03273.43286.42604.22610.7
3346.63363.03350.92661.12677.5
3431.73461.53419.02727.62757.4
3553.33604.83479.52775.12826.6
3644.73703.43594.12850.42909.1
3694.63785.23622.82861.82952.4
3758.73814.83722.12941.62997.6
2070.4 2141.6 2181.4 2230.2 2276.5 2332.7 2361.4 2396.51034.6 1073.0 1095.8 1122.8 1152.2 1179.0 1178.6 1192.81035.8 1068.6 1085.7 1107.5 1124.4 1153.7 1182.8 1203.8
405.0113.3334.6-42.9-32.6
19.6328.5308.9
678.8273.0405.8
449.6129.8339.3-19.4
-5.4
-6.5328.1334.5
682.2270.5411.6
491.9142.3353.9
-4.311.6
-16.4342.0358.4
689.8269.2420.6
540.0143.4383.9
12.714.1
-29.8346.1375.9
691.4266.3425.1
623.8151.2398.8
73.860.6
-51.5358.9410.4
704.4267.6436.8
627.0155.6420.8
50.647.0
-58.7362.4421.1
743.7296.4447.4
662.8155.3435.7
71.863.7
-90.6368.6459.3
761.0302.0458.9
637.8153.5447.7
36.627.2
-56.0367.2423.2
780.5315.7464.8
1491.0 1524.8 1550.2 1572.7 1610.9 1638.8 1645.2 1662.4
Personal incomeWage and salary disbursements
Disposable personal incomeSaving rate (percent)
Corporate profits with I.V.A. and C.C. Adj.Corporate profits before tax
Federal government surplus or deficit (-)(N.I.A. basis)High employment surplus or deficit (-) <3>
State and local government surplus ordeficit(-) (N.I.A. basis)
Excluding social insurance funds
Civilian labor force (millions)Unemployment rate (percent)
Nonfarm payroll employmentManufacturing
Industrial production (1977=100)Capacity utilization: all manufacturing (percent)Materials (percent)
Housing starts, private (million units, A.R.)New auto sales (millions, A.R.)Domestic modelsForeign models
2662.81608.12261.4
5.7
2714.41642.12302.9
4.2
2763.31671.32367.4
5.0
2836.51715.42428.6
5.3
2920.51755.72502.2
6.1
2984.61793.12554.3
5.7
3047.31819.52606.4
6.3
3096.21847.62644.5
6.2
179.1 216.7 245.0 260.0 277.4 291.1 282.8 291.6161.7 198.2 227.4 225.5 243.3 246.0 224.8 228.7
-185.7 -167.3 -180.9 -180.5 -161.3 -163.7 -180.6 -197.8-80.9 -74.2 -102.5 -113.1 -113.3 -129.6 -146.1 -169.3
34.1 43.9 47.4 51.2 53.9 54.5 47.6 55.6-1.9 7.0 9.5 12.0 13.4 12.6 4.3 11.1
110.7 111.2 112.1 112.1 112.710.4 10.2 9.3 8.5 7.9
113.57.5
113.87.4
114.27.2
88.8 89.6 90.5 91.8 93.0 94.0 94.9 95.818.1 18.3 18.5 18.9 19.2 19.4 19.5 19.6
103.370.271.4
106.872.573.6
111.775.877.0
114.977.479.3
119.379.882.0
1.64 1.67 1.79 1.72 1.958.46 9.10 9.22 9.94 10.526.06 6.81 6.92 7.29 8.222.40 2.28 2.31 2.65 2.30
121.580.882.6
1.8610.60
8.232.38
123.481.683.0
1.6610.307.942.36
123.181.081.4
1.6010.297.502.79
<1> Balance of payments data and details underlying these estimates are shown in the International Developmentssection of this part of the Greenbook.
<2> Components of purchases and total receipts and total expenditures are shown in the Federal Sector Account tablewhich follows.
<3> Estimates in table are evaluated at a 6 percent high employment unemployment rate.
September 25, 1985
CONFIDENTIAL - FRCLASS II FOMC
PERCENT CHANGES IN GROSS NATIONAL PRODUCTAND RELATED ITEMS
(Annual rates compounded quarterly)
1983 1984
Q1 Q2 Q3 Q4 Q1 Q2 Q3 Q4
Constant (1972) Dollars
Gross national productGross domestic purchases
Final salesPrivateDomestic final purchases
Personal consumption expendituresGoodsServices
Gross private domestic investmentResidential structuresBusiness fixed investment
Gov't. purchases of goods and servicesFederalNational defenseState and local
Disposable personal income
Current Dollars
Gross national productGross domestic purchases
Final sales
Personal consumption expendituresGoodsServices
Gross private domestic investmentResidential structuresBusiness fixed investment
Gov't. purchases of goods and servicesFederalNational defense
State and local
Disposable personal incomePersonal income
Wage and salary disbursements
3.3 9.43.7 12.31.1 6.43.5 8.64.0 12.1
2.6 10.03.5 12.61.5 7.3
6.8 5.9 10.1 7.1 1.6 4.37.4 8.7 12.9 7.9 5.4 .94.9 4.2 3.6 10.3 -1.0 7.96.2 6.3 4.2 8.5 -2.4 8.46.9 9.7 7.6 9.5 2.3 4.0
3.8 6.8 4.6 7.9 .7 3.65.4 9.5 7.8 10.7 -1.9 3.82.1 3.8 1.2 4.6 3.8 3.3
34.1 52.5 38.4 37.0 71.6 -2.2 24.9 -13.164.5 78.1 31.6 4.0 21.3 1.2 -4.6 -5.5
.0 9.6 18.7 30.6 20.6 21.3 13.7 8.5
-8.2 -2.6 -.5 -4.3 1.0 18.6 5.4 5.9-17.4 -5.9 -5.3 -8.7 -2.8 45.2 6.2 15.2
6.8 7.6 -1.9 9.2 3.4 12.2 -2.3 17.5-1.2 -.2 2.7 -1.4 3.5 3.7 4.8 -.2
2.1 3.3 7.7 8.2 8.6 6.3 3.9 3.5
8.5 12.3 10.1 10.6 14.9 10.7 5.6 7.16.7 16.0 11.4 12.2 17.6 11.4 9.1 3.25.9 8.9 8.1 8.4 7.3 13.8 3.2 11.4
4.8 14.53.6 15.76.1 13.3
7.6 9.2 8.6 10.2 5.08.8 10.2 10.9 9.6 -.16.6 8.3 6.2 10.9 10.5
34.3 52.0 43.2 45.3 78.0 2.0 24.9 -14.379.3 71.9 44.4 3.3 23.6 12.1 -. 6 -4.7-5.5 5.7 18.5 38.4 16.5 23.9 14.9 11.5
-1.3 2.0 4.5 .9 7.8 24.3 9.6 10.7-6.9 -3. -2.0 -4.3 2.0 50.5 7.8 19.47.9 9.8 3.3 13.2 12.5 14.7 -.8 22.14.2 5.8 9.0 4.4 11.5 10.0 10.7 5.2
4. 7.5 11.7 10.7 12.7 8.6 8.4 6.03.6 8.0 7.3 11.0 12.4 9.1 8.6 6.75.6 8.7 7.3 11.0 9.7 8.8 5.9 6.5
Corporate profite with I.V.A. and C.C.Adl. 94.8 114.3 63.4 26.8 29.6 21.3 -10.9 13.0Corporate pofits before tea 16.0 125.7 73.3 -3.3 35.5 4.5 -30.3 7.1
Nonfarm payroll wem oywtManufacturint
Nonfarm businass sectorOutput per hourCompensation per hourUnit labor costs
GNP implicit deflator <1>Gross domestic business product
fixed-vwighted price index <2>Excluding food and energy
Consumer price index (all urban)
Industrial production
.5 3.4 4.2 5.8 5.5 4.3 3.9 4.0-1.2 4.4 6.2 7.8 6.4 4.5 2.4 1.1
4.4 8.15.7 3.51.3 -4.2
2.1 1.0 2.9 5.5 -1.1 2.22.2 4.1 6.1 3.7 3.6 3.7.1 3.0 3.1 -1.7 4.7 1.4
3.0 2.6 3.1 4.4 4.4 3.3 3.9 2.8
2.7 3.9 4.5 3.5 4. 4.1 . 4.0 3.54.9 3.5 3.4 3.8 3.k 5.6 4.9 3.9
.4 4.3 4.2 4.2 5.2 3.7 3.7 3.6
11.5 14.0 19.8 12.0 16.0 7.6 6.4 -. 7
<1> Excluding the federal pay increase, the rate of change in 1393-Q4 was 4.4 percent.<2> Uses expenditures in 1972 as weights.

CONFIDENTIAL - FRCLASS II FOMC
I-10 September 25, 1985GROSS NATIONAL PRODUCT AND RELATED ITEMS
(Quarterly figures are seasonally adjusted. Expenditures and incomefigures are billions of current dollars at annual rates.)
Projected1985 1986
Q1 Q2 Q3 Q4 Q1 Q2 Q3 Q4
Gross National ProductGross domestic purchases
Final salesPrivate
Domestic final purchases
Personal consumption expendituresGoodsServices
Gross private domestic investmentResidential structuresBusiness fixed investmentChange in business inventories
Nonfarm
Net exports of goods and services1ExportsImports
Gov't. purchases of goods and servicesFederal
2
State and local
Gross national product inconstant (1972) dollars
Personal incomeWage and salary disbursements
Disposable personal incomeSaving rate (percent)
Corporate profits with I.V.A. and C.C. Adj.Corporate profits before tax
Federal government surplus or deficit (-)(N.I.A. basis)High employment surplus or deficit (-)3
State and local government surplus ordeficit(-) (N.I.A. basis)
Excluding social insurance funds
Civilian labor force (millions)Unemployment rate (percent)
Nonfarm payroll employmentManufacturing
Industrial production (1977=l00)Capacity utilization: all manufacturing (percent)
Materials (percent)
Housing starts, private (million units, A.R.)New auto sales (millions, A.R.)
Domestic modelsForeign models
3810.63885.23770.02978.13052.6
2446.51212.11234.4
646.8155.2450.940.734.1
-74.5360.7435.2
791.9319.9472.0
3853.13947.13835.23024.33118.3
2493.01231.11261.9
643.2158.0467.3
17.911.4
-94.0347.7441.6
810.9324.2486.7
3911.24005.93907.63070.23164.8
2536.01246.51289.5
632.4160.5468.3
3.61.0
-94.6346.6441.3
837.4339.1498.3
3967.24073.03933.63084.73190.5
2550.21235.91314.3
673.8167.1473.2
33.531.4
-105.8358.0463.8
848.9342.7506.2
4021.54138.23988.53130.63247.3
2596.51255.41341.1
683.8170.3480.5
33.131.4
-116.7363.0479.7
857.9344.0513.9
4091.14200.04057.53189.63298.5
2636.71269.51367.2
695.4174.4487.4
33.632.4
-108.9375.2484.1
867.9346.5521.4
4163.64267.44129.23247.43351.2
2677.01283.41393.6
708.6179.5494.7
34.433.2
-103.8387.5491.3
881.8352.6529.2
4240.34335.44205.53308.23403.3
2717.61296.91420.7
720.5183.4502.3
34.833.6
-95.1402.8497.9
897.3360.0537.3
1663.5 1671.3 1683.6 1696.3 1706.8 1718.3 1730.3 1742.9
3143.81882.72654.8
4.5
292.3222.3
3174.71910.62726.5
5.1
298.5221.0
3202.01933.42718.5
3.2
319.4240.6
3264.21963.42771.1
4.4
311.2232.0
3317.91993.12826.7
4.6
301.5222.8
3371.92023.92869.0
4.5
308.0228.3
3429.72055.32915.0
4.5
313.3232.1
3490.62087.62963.4
4.6
319.7237.0
-165.1 -214.1 -192.9 -198.7 -204.8 -195.7 -190.3 -189.0-129.4 -178.3 -157.3 -163.4 -169.2 -160.1 -155.4 -155.0
53.78.3
115.27.3
96.619.6
123.880.581.5
1.8010.878.462.42
50.34.2
115.27.3
97.319.4
124.280.380.4
1.7710.928.272.65
48.61.6
115.47.2
98.019.4
124.780.279.9
1.7312.109.202.90
48.91.1
116.07.2
98.619.5
125.680.179.9
1.809.906.903.00
50.31.7
116.67.2
99.119.5
126.480.179.8
1.8010.707.703.00
52.02.6
117.17.1
99.719.6
127.380.079.8
1.8010.707.703.00
52.72.5
117.67.0
100.319.6
128.380.179.7
1.8010.707.603.10
53.92.7
118.17.0
100.819.7
129.280.179.7
1.8010.607.503.10
1. Balance of payments data and details underlying these estimates are sh in the International Developmentssection of this part of the Greenbook.2. Components of purchases and total receipts and total expenditures are ebom is the Federal Sector Account tablewhich follows.3. Estimates in table are evaluated at a 6 perceot hlah employment unmployeat rate.

CONFIDENTIAL - FRCLASS II FOMC
I-11
PERCENT CHANGES IN GROSS NATIONAL PRODUCTAND RELATED ITEMS
(Annual rates compounded quarterly)
September 25, 1985
Projected_1985 1986
Q1 Q2 Q3 Q4 Q1 Q2 Q3 Q4
Constant (1972) Dollars
Gross national productGross domestic purchases
Final salesPrivateDomestic final purchases
Personal consumption expendituresGoodsServices
Gross private domestic investmentResidential structuresBusiness fixed investment
Gov't. purchases of goods and servicesFederalNational defenseState and local
Disposable personal income
Current Dollars
Gross national productGross domestic purchases
Final sales
Personal consumption expendituresGoodsServices
Gross private domestic investmentResidential structuresBusiness fixed investment
Gov't. purchases of goods and servicesFederalNational defenseState and local
Disposable personal incomePersonal incomeWage and salary disbursements
Corporate profits with I.V.A. and C.C.Adj.Corporate profits before tax
Nonfarm payroll employmentManufacturing
Nonfarm business sectorOutput per hourCompensation per hourUnit labor costs
GNP implicit deflator1
Gross domestic business productfixed-weighted price index
2
Excluding food and energyConsumer price index (all urban)
Industrial production
.3 1.9 3.0 3.03.9 3.2 2.9 2.7-. 3 4.6 4.6 -. 1-. 4 4.8 3.2 -. 54.1 6.4 3.1 -. 8
5.2 4.8 4.3 -2.05.4 5.4 5.1 -5.85.0 4.2 3.4 2.6
3.1 -3.5 -9.8 24.75.3 6.4 3.9 13.0
-1.6 14.5 -2.6 1.6
.3 3.7 10.8 1.4
.7 -. 4 20.0 .2-. 2 7.2 8.3 2.1
.0 6.7 4.4 2.2
-1.6 8.2 -3.7 3.5
5.6 4.5 6.2 5.87.6 6.5 6.1 6.95.2 7.1 7.8 2.7
8.6 7.8 7.1 2.36.6 6.4 5.1 -3.4
10.6 9.2 9.0 7.9
5.8 -2.2 -6.5 28.94.6 7.4 6.5 17.53.0 15.3 .9 4.3
2.5 2.72.4 1.82.7 2.73.3 3.23.2 2.1
3.2 1.73.9 1.52.4 2.0
2.0 3.43.7 6.12.8 2.8
.2 .8-2.6 -1.2
2.1 2.12.2 2.1
4.0 1.5 1.8 1.8
5.6 7.16.6 6.15.7 7.1
7.5 6.36.5 4.68.4 8.0
6.1 7.07.9 10.06.3 5.9
5.9 10.0 13.7 5.6 4.3 4.85.4 5.6 19.7 4.3 1.5 2.94.0 12.8 9.8 7.3 6.5 5.66.3 13.0 9.9 6.5 6.2 6.0
1.6 11.2 -1.2 8.0 8.3 6.16.3 4.0 3.5 8.0 6.7 6.77.8 6.1 4.9 6.4 6.2 6.3
1.0 8.8 31.4 -9.9 -11.9 8.9-10.7 -2.3 40.5 -13.5 -14.9 10.2
3.3 2.9 2.7 2.3 2.4 2.3.0 -2.7 .0 1.2 .8 .8
-3.1 1.0 1.0 .7 1.2 .95.0 3.3 3.0 3.9 4.8 4.38.4 2.3 2.0 3.2 3.6 3.4
5.4 2.6 3.1 2.7 3.0 4.3
3.6 3.7 2.8 2.8 3.5 4.34.6 3.8 3.7 3.5 4.0 4.73.2 4.2 2.3 2.9 4.1 4.5
2.1 1.4 1.7 2.9 2.6 2.8
7.3 7.66.6 6.57.3 7.6
6.3 6.24.4 4.38.0 8.0
7.8 6.812.2 9.06.1 6.2
6.6 7.27.2 8.77.3 7.26.1 6.3
6.6 6.87.0 7.36.4 6.4
7.1 8.46.8 8.7
2.3 2.11.0 1.0
1.2 1.24.5 4.73.3 3.5
4.3 4.5
4.3 4.54.7 4.84.6 4.8
3.0 3.1
1. Excluding Federal pay increase, the rate of change in 1985-Q1 is 5.0 percent and in 1986-Q1 is 2.9 percent.2. Uses expenditures in 1972 as weights.

CONFIDENTIAL - FRCLASS II FOMC
September 25, 1985GROSS NATIONAL PRODUCT AND RELATED ITEMS
(Expenditures and income figures are billions of current dollars.)
-Projected-1979 1980 1981 1982 1983 1984 1985 1986
Gross national productGross domestic purchases
Final salesPrivateDomestic final purchases
Personal consumption expendituresGoodsServices
Gross private domestic investmentResidential constructionBusiness fixed investmentChange in business inventories
Nonfarm
Net exports of goods and services1ExportsImports
Gov't. purchases of goods and servicesFederal
2
State and local
2417.82404.52403.51929.21915.9
1507.1813.4693.7
423.0118.5290.2
14.38.6
13.2281.3268.1
474.4168.3306.0
2631.72607.72641.42103.72079.7
1668.0883.5784.5
401.9102.9308.8-9.8-4.5
23.9338.8314.8
537.8197.0340.8
2957.72929.82931.72335.22307.2
1849.1966.1883.0
484.2104.3353.926.018.2
28.0369.9341.9
596.5228.9367.6
3069.23050.23095.42444.92425.9
1984.91002.6
982.2
414.991.3
349.6-26.1-23.9
19.0348.4329.4
650.5258.9391.5
3304.83313.13318.32632.72641.0
2155.91081.51074.4
471.6132.2352.9-13.5-3.1
-8.3336.2344.4
685.5269.7415.8
3662.83727.03604.62857.22921.4
2341.81175.71166.1
637.8153.9425.7
58.249.6
-64.2364.3428.5
747.4295.4452.0
3885.53977.73861.63039.33131.6
2506.41231.41275.0
649.1160.2464.923.919.5
-92.2353.3445.5
822.3331.5490.8
4129.14235.24095.23219.03325.1
2656.91276.31380.6
702.1176.9491.2
34.032.6
-106.1382.1488.2
876.2350.8525.4
Gross national product inconstant (1972) dollars
Personal incomeWage and salary disbursements
Disposable personal incomeSaving rate (percent)
Corporate profits with I.V.A. and C.C.Adj.Corporate profits before tax
Federal government surplus or deficit (-)(N.I.A. basis)High employment surplus or deficit (-)
State and local government surplus ordeficit (-) (N.I.A. basis)
Excluding social insurance funds
Civilian labor force (millions)Unemployment rate (percent)
Nonfarm payroll employment (millions)Manufacturing
Industrial production (1977=100)Capacity utilization: all manufacturing (percent)
Materials (percent)
Housing starts, private (million units, A.R.)New auto sales (millions, A.R.)Domestic modelsForeign models
1479.4 1475.0 1512.1 1480.0 1534.7 1639.3 1678.7 1724.6
1951.1 2165.3 2429.41237.6 1356.7 1493.11650.2 1828.9 2041.7
5.9 6.0 6.7
2584.61568.72180.5
6.2
2744.21659.22340.1
5.0
3012.11804.02576.8
6.1
3196.21922.52717.7
4.3
3402.52040.02893.5
4.6
194.8 175.4 189.9 159.1 225.2 285.7 305.3 310.6252.7 234.6 221.2 165.5 203.2 235.7 228.9 230.0
-16.1 -61.2 ,-64.3 -148.2 -178.6 -175.8 -192.7 -194.9-20.8 -36.4 -31.3 -61.6 -92.7 -139.6 -157.1 -160.0
30.4 30.6 37.6 32.9 44.1 52.9 50.4 52.26.6 3.5 7.8 -.8 6.6 10.4 3.8. 2.4
105.0 106.9 108.7 110.2 111.6 113.5 115.4 117.35.8 7.1 7.6 9.7 9.6 7.5 7.3 7.1
89.8 90.4 91.2 89.6 90.2 94.5 97.6 100.021.0 20.3 20.2 18.8 18.4 19.4 19.5 19.6
110.784.687.1
1.7210.688.362.32
108.6 111.0 103.179.3 78.3 70.381.1 81.1 71.7
109.2 121.8 124.674.0 80.8 80.375.3 82.3 80.4
1.30 1.10 1.06 1.70 1.779.04 8.56 8.00 9.18 10.436.62 6.24 5.77 6.77 7.972.42 2.32 2.23 2.41 2.46
1.7710.948.202.74
127.880.179.8
1.8010.687.633.05
Developments section of this
Federal Sector Accounts table
1. Balance of payments data underlying these estimates are shown in the Internationalpart of the Greenbook.2. Components of purchases and total receipts and total expenditures are shown in thewhich follows.
1-12

CONFIDENTIAL - FRCLASS II FOMC
PERCENT CHANGES IN GROSS NATIONAL PRODUCTAND RELATED ITEMS
September 25, 1985
-Projected--1979 1980 1981 1982 1983 1984 1985 1986
Constant (1972) Dollars
Gross national productGross domestic purchases
Final salesPrivateDomestic final purchases
Personal consumption expendituresGoodsServices
Gross private domestic investmentResidential structuresBusiness fixed investment
Gov't. purchases of goods and servicesFederalNational defense
State and local
-. 3-1.2
.5
.1-1.0
.5 2.0-1.4 1.72.7 2.3
-. 2 -11.8-5.3 -20.37.3 -2.4
-2.1-1.2
-. 7-1.3
-. 2
4.8 5.3 3.8 1.86.0 7.1 3.7 1.33.4 3.2 4.0 2.5
13.7 31.2 .2 4.541.7 12.2 2.1 6.72.5 19.8 6.4 2.5
-. 3 3.5 5.0 2.5-. 6 5.4 8.4 2.27.1 5.8 6.0 3.3
.0 2.2 2.7 2.7
10.7 -15.8-5.5 -14.8
5.6 -4.7
1.3 2.2 1.0 2.01.8 4.2 3.6 6.12.6 3.9 5.1 7.61.1 1.0 -. 6 -. 6
Disposable personal income 2.7 .6 2.7 .9 3.5 6.7 2.3 2.3
Current Dollars
Gross national productGross doestic purchases
Final sales
Personal consumption expendituresGoodsServices
Gross private domestic investmentResidential structuresBusiness fixed investment
Gov't. purchases of goods and servicesFederalNational defense
State and local
Disposable personal incomePersonal income
Wage and salary disbursements
Corporate profits with I.V.A. and C.C.Adj.Corporate profits before tax
Nonfarm payroll employmentManufacturing
Nonfarm business sectorOutput per hourCompensation per hourUnit labor costs
GNP implicit deflatorGross domestic business product
fixed-weighted price index 1Excluding food and energy
Consumer price index (all urban)
Industrial production
11.7 8.8 12.4 3.8 7.711.1 8.4 12.3 4.1 8.612.4 9.9 11.0 5.6 7.2
11.9 10.7 10.9 7.3 8.611.7 8.6 9.3 3.8 7.912.2 13.1 12.6 11.2 9.4
9.4 -5.06.6 -13.2
16.6 6.4
20.5 -14.31.4 -12.4
14.6 -1.2
10.8 6.1 6.312.5 6.7 6.58.6 7.1 6.0
7.0 6.04.7 3.69.3 8.3
13.7 35.2 1.8 8.244.7 16.4 4.1 10.4
.9 20.6 9.2 - 5.7
9.8 13.4 10.9 9.0 5.4 9.0 10.0 6.69.6 17.1 16.2 13.1 4.2 9.5 12.2 5.8
11.5 17.3 17.2 16.8 11.7 10.5 9.8 7.49.9 11.4 7.9 6.5 6.2 8.7 8.6 7.1
12.0 10.8 11.6 6.8 7.3 10.1 5.5 6.512.6 11.0 12.2 6.4 6.2 9.6 6.1 6.511.9 9.6 10.1 5.1 5.8 8.7 6.6 6.1
1.2 -9.9 8.3 -16.2 41.5 26.9 6.9 1.710.3 -7.1 -5.7 -25.2 22.8 16.0 -2.9 .5
3.6 .6 .8 -1.7 .7 4.7 3.4 2.42.6 -3.6 -. 6 -6.9 -1.8 5.3 .3 .6
-1.5 -. 7 1.59.0 10.3 9.6
10.7 11.1 8.0
1.4
9.98.46
11.3
9.2
9.98.5
13.5 -
9.6
9.79.4
10.3
.2 3.5 2.7 .2 1.08.0 4.9 4.1 3.9 4.27.7 1.4 1.4 3.7 3.1
6.0 3.8 3. 3.6 3.4
5.9 3.7 4.0. 3.6 3.67.0 4.6 4.3 4.2 4.26.1 3.2 4.1 3.4 3.9
3.9 -1.9 2.2 -7.1 5.9 11.6 2.3 2.6
1. Uses expenditures in 1972 as weights.

September 25, 1985FEDERAL SECTOR ACCOUNTS(Billions of dollars)
___________ _______at FRBstaff eImates
Fiscal Fy985 2737~ F- 986e / 37 CY985 Calenda quarterna not aeasonally adusted .ear Adeln. FIB Admin. PRB CY FRB 1984 1985 19861O84a 1/ Staff 1/ Staff 1984* Staff IV* I* 1I* Itl IV I II IlI
Unified budget receipts 666 736 736 780 775 683 744Untfted budget outlays 42 937 936 955 967 868 942
Surplus/deficit(-). unfied budtI4 -37A -201 -200 -175 -192 -184 -197Surplus/deficit(-). off-budget
agencies4
-10 -10 -11 -2 -5 -10 -13Combined deficit to be fluancd -185 -211 -211 -178 -197 -195 -210
166 174 207 189 175 181 224 195239 230 234 234 244 241 241 242-72 -56 -27 -45 -69 -60 -16 -67
1 -3 -5 -4 -1 -I -2 -1-71 -59 -32 -49 -70 -61 -18 -48
Means of fliancig combined deficit:Net borrowing from publicDecrease l cash operlttls lencAOther 5
Cash operatin ele se. 0d of pertod
Hmoe: Sponsored agency borrowiag8
NIA Budget
ReceptsExpenditure
PurchasesDefeseMoandefense
All other expendituresSurplus/deficit(-)
171 203 197 180 199 199 202'7 10 13 0 -8 -6 2
* -2 r -2 6 2 5
64 42 4513 4 -10-6 13 -3
30 20 18 20 25 18 15 18 14 24 18
30 U.a. 21 n.a. 19 30 21 4
688 756 749 809 795 705 764860 946 942 978 993 881 956283 326 325 343 347 295 331215 238 238 255 257 222 24368 88 86 88 89 74 88
577 620 617 635 646 586 625-172 -188 -193 -169 -198 -176 -193
High employment surplus/deficit(-)evaluated at 6 pqrcat woe ploymant -126 n.a. -159 n.a. -162 -140 -157
W-actual e--estimated
1. Nid-eaaSioe aSview, AStuqt 30, 1985.2. The Coagrqstel i Buoget 1e4olution, passed August I, 1985. shows revenuea of
$737 billion *q $796 billio, cembined unified and off-budget outlays of$946 bilktp id $96 billion, and total deficite of $210 billion and $172billeso i'tinfel y"r"n 1185 and 190.. repeattvrly.
3. The latest CW B.gt estigtem tht l* orpeate the Budget Resolution policyaseauptioas and the Auguet 1985 CO pcomomic forecast abho revenues of $737billion a $790 billlote, ebim g ualfted *ad off-%bdget outlays of $946 billionand $965 illtlon, an total defiq to of 1210 billion and $175 billion in fiscalyears 194ve * ) , z aet l p.
Note: Details pt naF4 ad to total* due to roundiag.
69 52 31 462 0 -10 0
-1 8 -3 2
15 15 25 25
9 4 4
Seasonally adjusted annual rates722 771 734 770 780 784 801 817920 937 948 963 979 989 996 1001316 320 324 339 343 344 347 353232 234 241 247 251 255 259 26384 86 83 92 92 89 88 89
604 617 624 624 636 645 650 655-198 -165 -214 -193 -199 -205 -196 -190
-169 -129 -178 -157 -163 -169 -160 -155
n.a.--not available
4. Includes Federal Financing Bank, Postal Service Fund, RuralElectrification and Telephone Revolving Fund, Rural Telephone Bankand Strategic Petroleum Reserve.
5. Checks Issued less checks paid, accrued items and other transact ons.6. Sponsored agency borrowing Includes net debt issuance by Federal
Home Loan Banks. FHLMC (excluding participation certificates). FNMA(excluding mortgage-backed securitles). Federal land Banks. FederalIntermediate Credit Banks, Banks for Cooperatives, and Student LoanMarketing Association marketable debt on a payment basis. TheAdminlstration's definition of borrowing by these agencies Issomewhat broader.
~__ __ ~___1__ ~ ~~ _~__I_~_ ~__I______~___I

DOMESTIC FINANCIAL DEVELOPMENTS
Recent developments. Interest rates have recorded generally small
mixed changes on net since the August FOMC meeting. The federal funds
market has been a touch firmer, with trading mostly in the 7-3/4 to 8
percent range, but fluctuations in rates over the intermeeting period have
been influenced more by incoming economic news. Most recently, short-term
rates have eased somewhat with the announcement by financial officials of
the five major industrial countries of policies aimed at lowering the value
of the dollar.
Supply conditions and credit quality concerns meanwhile have had some
notable effects on the structure of market rates. Yields on short-dated
Treasury bills, for example, have declined about 1/4 percentage point, owing
in large part to constraints imposed on bill issuance by the federal debt
ceiling. Municipal bond rates have risen relative to taxable rates under
the pressure of continued heavy supply. The perceived riskiness of debt
of some federal agencies has been increased in recent weeks by discussion
of the Farm Credit System's problems and of means of assisting the FSLIC;
the deterioration in yield spreads for Farm Credit securities has been
especially marked. In the mortgage sector, the problems of the EPIC
partnerships led to some weakening of the market for pass-through
securities that rely on private insurance. Mortgage-backed securities of
federally sponsored agencies, however, experienced only transitory rate
pressures, and available evidence suggests that the home mortgage market
overall has not been significantly affected by the EPIC situation.
The monetary aggregates surged again in August, after some
deceleration in July. M1 increased in August at more than a 20 percent
I-15

I-16
pace and growth continued rapid in early September, leaving MI appreciably
above its 3 to 8 percent target range. The lower opportunity cost of
holding money balances no doubt has continued to boost M1 growth, but the
rise in this aggregate greatly exceeds what would be expected based on
historical relationships linking M1 to income and interest rates. Growth
in M2 jumped to 11-1/4 percent in August, reflecting the strength in M1.
Among other M2 components, inflows to MMDAS and savings deposits continued
strong while small time deposits contracted further as depositors shifted
to more liquid assets. M3, expanding at an 8-1/2 percent annual rate,
remained well within its annual growth range. In addition to the strength
of its M2 component, large time deposits in M3 increased in August after
declining sharply in June and July.
Borrowing by domestic nonfinancial sectors seems to have slowed a
little in the third quarter, owing primarily to a temporary easing in
federal government demands. By drawing down cash balances built up in
July, the Treasury limited its net borrowing from the public to $16 billion
in August. As noted above, federal borrowing has been constrained in
September by the debt ceiling, which forced the Treasury not only to pay
down bills but also to postpone its normal end-of-quarter financing.
In the household sector, the growth in consumer installment credit
in June and July was appreciably below the 20 percent pace earlier in the
year, owing to a sharp slowdown in revolving credit. Consumer lending at
banks weakened further in August, reflecting in part stiffer competition
from auto finance company sales programs. However, given the reported
slowing in retail sales of goods other than autos, installment credit
expansion may have continued at a reduced pace in August. Growth in

I-17
mortgage indebtedness has been well maintained, with the sale of mortgage-
beacked securities to diversified investors accounting for a large share
of the credit flow.
Nonfinancial businesses in August and September concentrated their
still heavy borrowing in long-term markets, as yields on corporate bonds--
though continuing to back up a bit--remained close to the 6-year lows
reached at midyear. Gross volume in August and September continued near
the strong second-quarter rate with an increased portion of new issues
carrying maturities of 20 years or more. Short-term borrowing, in contrast,
has slowed appreciably except for a spurt in commercial paper issuance in
early August. A great part of recent long-term borrowing by business firms
appears to be for purposes of balance sheet restructuring and financing
mergers and acquisitions. Despite increased offerings of new equity, stock
retirements continued to exceed new stock issuance by a large margin.
Municipal market activity has been particularly robust in the
third quarter, with tax-exempt volume buoyed by a heavy slate of refunding
issues. Private-purpose revenue bonds have constituted the major portion
of tax-exempt volume. Sales of industrial development bonds have accelerated,
and those of housing revenue bonds remain strong.
Outlook. The staff anticipates that interest rates generally will
fluctuate around present levels over the remainder of the year, with market
participants closely assessing incoming data for signs of strength or
weakness in economic activity. Total credit expansion is expected to
remain brisk and even increase in the fourth quarter, bolstered by heavy
federal borrowing and increased issuance in tax-exempt markets. Looking
further ahead, however, the credit market pressures could ease a bit,
producing a decline in interest rates. Government demands on the credit

I-18
market should diminish somewhat after the fourth quarter, and the household
sector likely will move to a more sustainable saving posture.
The Treasury is expected to run a combined deficit of $70 billion
in the fourth quarter, which probably will be financed almost entirely by
borrowing from the public. Another bulge in debt issuance by state and
local governments--both for public and private purposes--is expected in the
final months of 1985. As in several recent years, legislative proposals to
limit or eliminate certain types of tax-exempt financing have created
incentives to rush issues to market prior to year-end. Even in the absence
of legislative action on the tax reform proposals, the volume of municipal
offerings is likely to fall off appreciably after year-end, as potential
issuers employ the proceeds of late 1985 offerings and await clarification
of the nature and timing of possible restrictions.
The volume of merger activity and stock retirements will continue
to inflate corporate borrowing in the fourth quarter. In addition, the gap
between capital outlays and internal funds, which appears to have turned
negative in the third quarter, is expected to become moderately positive
again in coming months as inventory accumulation picks up and cash flow
slows. Borrowers porbably will continue to place emphasis on long-term
financing, but bank borrowing may strengthen somewhat from the recent
weak pace.
The termination of interest rate concession programs on autos and
some slowing in other durable expenditure categories likely will damp
further the pace of consumer credit growth in coming months. However,
home mortgage borrowing is expected to pick up as activity in the single-
family housing market responds to earlier interest rate declines. Mortgage

I-19
pools are apt to remain an important vehicle for mortgage flows, as thrift
institutions restrain their asset growth to avoid tighter regulatory net
worth restrictions.

INTERNATIONAL DEVELOPMENTS
Recent developments. After increasing by 5 percent from the last
FOMC meeting through mid-September, the weighted average foreign exchange
value of the dollar began to decline, with movements in the dollar during
this period continuing to be strongly influenced by shifting views about
the strength of U.S. economic activity. Following the announcement on
September 22 by the G-5 finance ministers and central bank governors that
exchange rates should better reflect fundamental economic conditions, the
dollar fell sharply, resulting in an overall decrease of about 2 percent
since the August FOMC meeting. In their announcement, the G-5 financial
officials expressed their belief that in view of present and prospective
fundamental economic conditions and policy actions, some further orderly
appreciation of foreign currencies against the dollar was desirable, and
that they stood ready to encourage such exchange rate movements when it
would be helpful to do so.
. The New York Desk sold a total of $276
million against yen and marks on September 23 and 24.
In July, foreign official purchases of U.S. Treasury securities
fell off from their second-quarter pace, but foreign private net
purchases -- primarily by Japanese residents -- rose sharply.
Similarly, net foreign purchases of U.S. corporate securities were up
significantly from their second-quarter rate. Foreign net purchases of
I-20

I-21
U.S. corporate bonds exceeded $4 billion in July, bringing the total for
the first seven months of the year to nearly $22 billion. Available
banking data suggest a sizable net inflow into U.S. banking offices from
abroad during the third quarter.
U.S. chartered banks' claims on foreigners resumed their decline
in the second quarter of 1985, decreasing about $9 billion (2 percent).
As was generally the case last year, the drop in total claims was
concentrated on the major industrial countries and offshore banking
centers. Since the beginning of 1984, U.S. bank claims on the non-OPEC
developing countries have been essentially unchanged; there was a small
decline in such claims in the first half of this year.
The U.S. current account recorded a deficit of $127 billion,
s.a.a.r., in the second quarter of 1985, slightly larger than in the
first quarter. A larger merchandise trade deficit - exports dropped by
4-1/2 percent and imports increased slightly - was partly offset by
increased income receipts from investment abroad. Most of the increase
in income receipts was from U.S. direct investment abroad and was
accounted for by a shift from large capital losses to small capital
gains, primarily as a consequence of the decline in the exchange value
of the dollar.
In July, the U.S. merchandise trade deficit (s.a.a.r.) was
smaller than that registered in June and for the second quarter,
resulting from a sharp drop in imports that was offset somewhat by a
moderate decline in exports. The decline in imports was widespread
across major commodity groups, including oil. Much of the July drop in
exports was in agricultural commodities, particularly wheat. While

I-22
nonagricultural exports decreased from June levels, they were about the
same as the second-quarter rate, as a decline in machinery exports was
offset by increases in exports of aircraft and of automotive products to
Canada.
The pace of economic activity in the major foreign industrial
countries has rebounded on balance since the first quarter, but growth
remains uneven and influenced by special factors. Inflation abroad has
remained low. The current accounts in Japan and Germany have
strengthened so far this year.
Among the major developing countries, Mexico has fallen out of
compliance with its IMF program and will have to forgo the last three
drawings under its present IMF arrangement. Argentina has completed the
process leading to the initial disbursement from its $4.2 billion bank
credit and is expected soon to reduce sharply its arrears, but
difficulties loom ahead regarding compliance with the end-September IMF
performance tests. The prospects that Brazil will succeed in
negotiating an IMF program in the near term were dealt a setback when
the finance minister and the central bank president resigned. The
Philippines did not meet the qualitative targets for the second IMF
program review, and the September IMF drawing is being delayed.
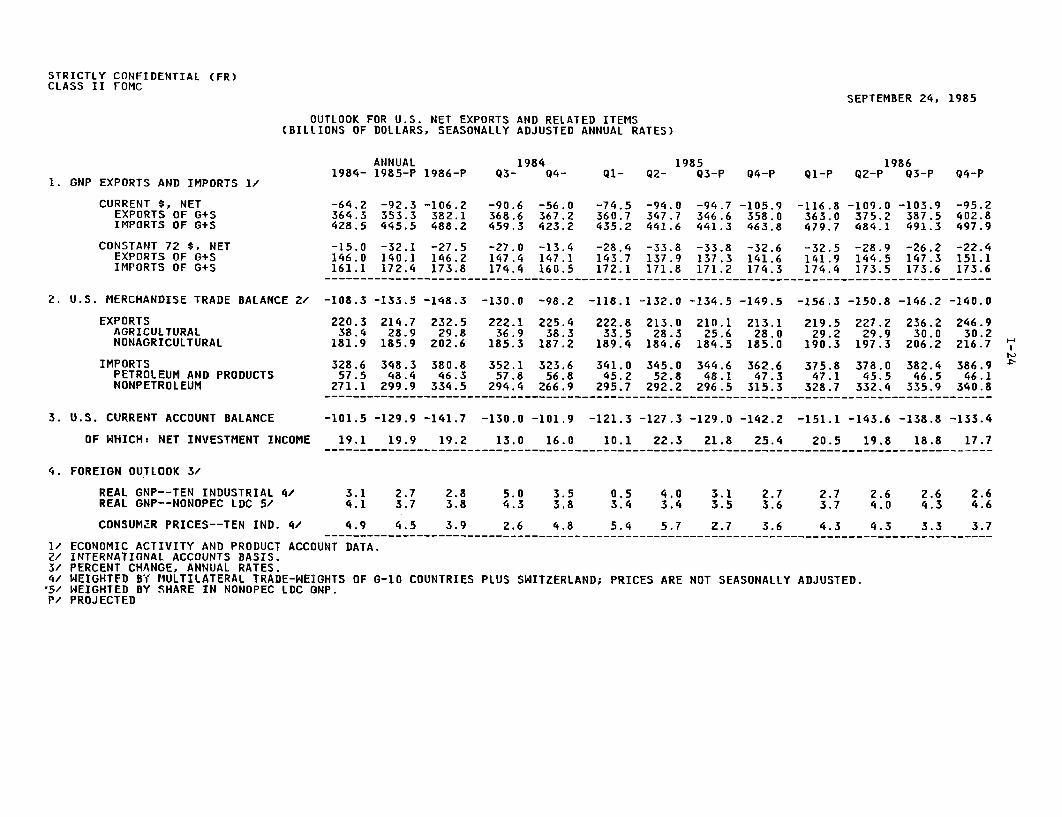
Outlook. The staff is now projecting a more substantial
depreciation of the dollar than previously, in the near term, followed
by a continued moderate rate of decline. The projected level of the
dollar at the end of the forecast period is about 5 percent less than in
the last Greenbook. The staff projection for economic activity in the

I-23
foreign industrial countries is essentially the same as in the last
Greenbook, but somewhat slower growth is now expected in the developing
countries. Based on recent data for merchandise trade and other
transactions (which suggest some offsetting adjustments in the
components) and the recent decline in the dollar, the staff has reduced
somewhat its projection of the current account deficit for 1985, to
$130 billion, and for 1986, to about $140 billion.
STRICTLY CONFIDENTIAL (FR)CLASS II FOMC
SEPTEMBER 24, 1985
OUTLOOK FOR U.S. NET EXPORTS AND RELATED ITEMS(BILLIONS OF DOLLARS, SEASONALLY ADJUSTED ANNUAL RATES)
1. GNP EXPORTS AND IMPORTS 1/
CURRENT $, NETEXPORTS OF G+SIMPORTS OF G+S
CONSTANT 72 $, NETEXPORTS OF G+SIMPORTS OF G+S
2. U.S. MERCHANDISE TRADE BALANCE 2/
EXPORTSAGRICULTURALNONAGRICULTURAL
IMPORTSPETROLEUM AND PRODUCTSNONPETROLEUM
3. U.S. CURRENT ACCOUNT BALANCE
OF WHICH: NET INVESTMENT INCOME
ANNUAL1984- 1985-P 1986-P
1984Q3- (
1985Ql- Q2- Q3-P Q4-P
1986l1-P Q2-P Q3-P Q4-P
-64.2 -92.3 -106.2 -90.6 -56.0 -74.5 -94.0 -94.7 -105.9 -116.8 -109.0 -103.9 -95.2364.3 353.3 382.1 368.6 367.2 360.7 347.7 346.6 358.0 363.0 375.2 387.5 402.8428.5 445.5 488.2 459.3 423.2 435.2 441.6 441.3 463.8 479.7 484.1 491.3 497.9
-15.0 -32.1 -27.5 -27.0 -13.4 -28.4 -33.8 -33.8 -32.6 -32.5 -28.9 -26.2 -22.4146.0 140.1 146.2 147.4 147.1 143.7 137.9 137.3 141.6 141.9 144.5 147.3 151.1161.1 172.4 173.8 174.4 160.5 172.1 171.8 171.2 174.3 174.4 173.5 173.6 173.6
-108.3 -133.5 -148.3 -130.0 -98.2 -118.1 -132.0 -134.5 -149.5 -156.3 -150.8 -146.2 -140.0
220.3 214.7 232.5 222.1 225.4 222.8 213.0 210.1 213.1 219.5 227.2 236.2 246.938.4 28.9 29.8 36.9 38.3 33.5 28.3 25.6 28.0 29.2 29.9 30.0 30.2181.9 185.9 202.6 185.3 187.2 189.4 184.6 184.5 185.0 190.3 197.3 206.2 216.7
328.6 348.3 380.8 352.1 323.6 341.0 345.0 344.6 362.6 375.8 378.0 382.4 386.957.5 48.4 46.3 57.8 56.8 45.2 52.8 48.1 47.3 47.1 45.5 46.5 46.1
271.1 299.9 334.5 294.4 266.9 295.7 292.2 296.5 315.3 328.7 332.4 335.9 340.8
-101.5 -129.9 -141.7 -130.0 -101.9 -121.3 -127.3 -129.0 -142.2 -151.1 -143.6 -138.8 -133.4
19.1 19.9 19.2 13.0 16.0 10.1 22.3 21.8 25.4 20.5 19.8 18.8 17.7
4. FOREIGN OUTLOOK 3/
REAL GNP--TEN INDUSTRIAL 4/ 3.1 2.7 2.8 5.0 3.5 0.5 4.0 3.1 2.7 2.7 2.6 2.6 2.6REAL GNP--NONOPEC LDC 5/ 4.1 3.7 3.8 4.3 3.8 3.4 3.4 3.5 3.6 3.7 4.0 4.3 4.6
CONSUMER PRICES--TEN IND. 4/ 4.9 4.5 3.9 2.6 4.8 5.4 5.7 2.7 3.6 4.3 4.3 3.3 3.7
1/ ECONOMIC ACTIVITY AND PRODUCT ACCOUNT DATA.2/ INTERNATIONAL ACCOUNTS BASIS.3/ PERCENT CHANGE, ANNUAL RATES.4/ WEIGHTED BY MULTILATERAL TRADE-WEIGHTS OF G-10 COUNTRIES PLUS SWITZERLAND; PRICES ARE NOT SEASONALLY ADJUSTED.*5/ WEIGHTED BY SHARE IN NONOPEC LDC GNP.P/ PROJECTED