FMRI Group Analysis - University of Texas Health...
154
FMRI Group Analysis Effect size statistics Statistic Image Significant voxels/clusters Contrast Thresholding GLM Design matrix Effect size subject-series Voxel-wise group analysis Group effect size statistics Subject groupings 1 1 1 1 1 1 0 0 0 0 0 0 0 0 0 0 0 0 1 1 1 1 1 1 Standard-space brain atlas subjects Single-subject Single-subject Single-subject Single-subject effect size statistics subjects Register subjects into a standard space
Transcript of FMRI Group Analysis - University of Texas Health...
FMRI Group Analysis
Effect sizestatistics
Statistic ImageSignificant
voxels/clusters
Contrast
Thresholding
GLM
Design matrix
Effect size subject-series
Voxel-wise group analysis
Groupeffect sizestatistics
Subjectgroupings
111111000000
000000111111
Standard-spacebrain atlas
subjects
Single-subject effect sizestatistics
Single-subject effect sizestatistics
Single-subject effect sizestatistics
Single-subject effect sizestatistics
subjects
Registersubjects intoa standardspace
jacklancaster
Sticky Note
This is a two-group study with all subjects in group A indicated as "1" and all subjects in group B as "1" in the right column.Here "0" is to indicate not member of a group.
jacklancaster
Sticky Note
The background image with zstat overlaid for group analyses is either the template brain or an average MRI for the group.
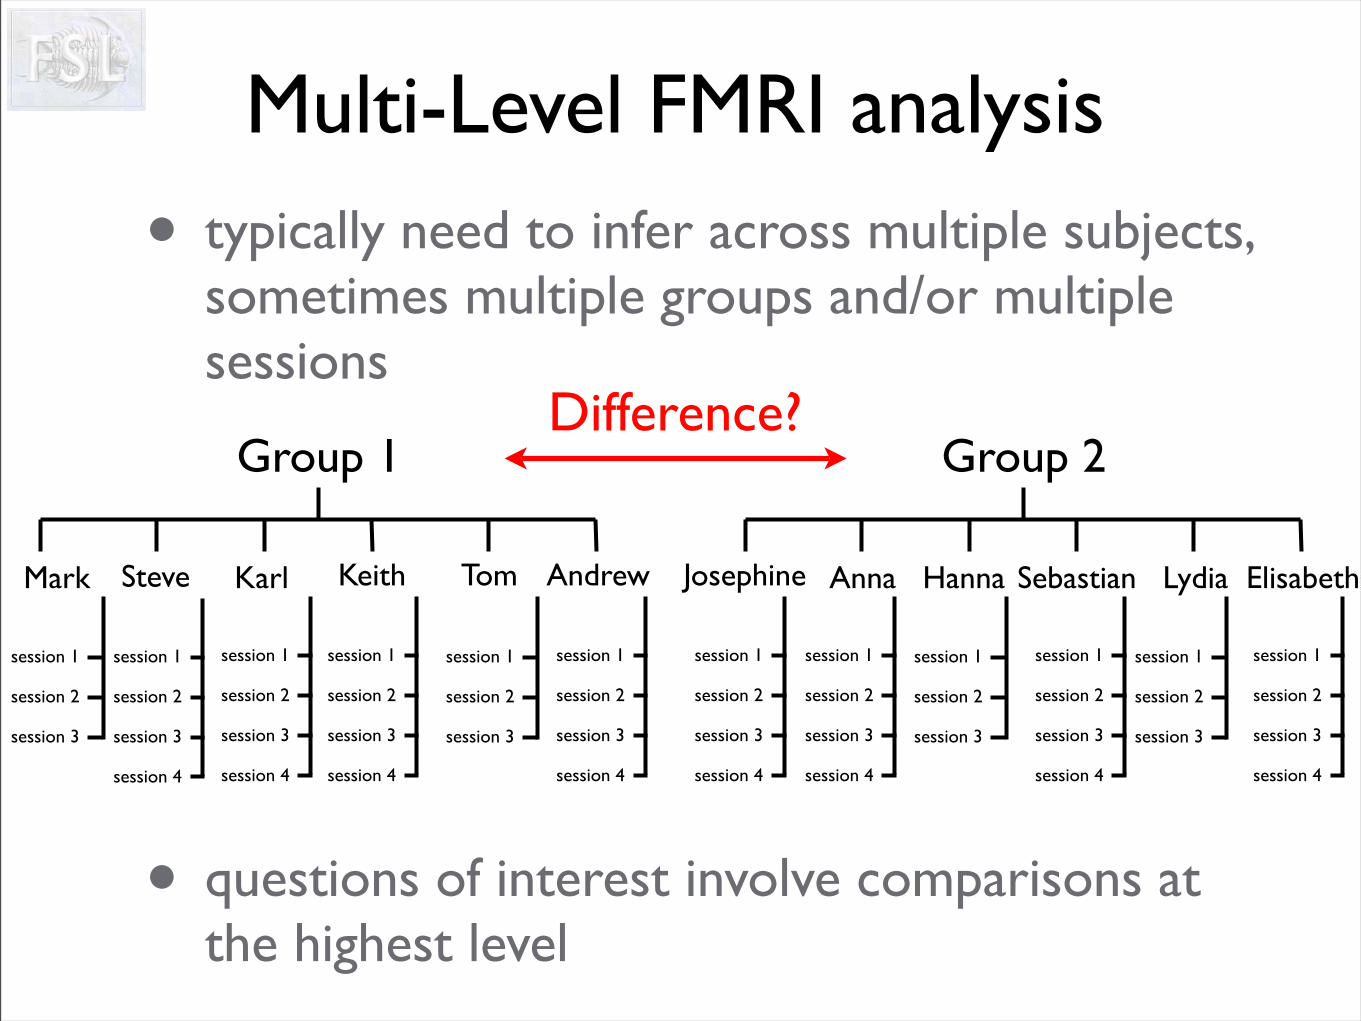
• typically need to infer across multiple subjects, sometimes multiple groups and/or multiple sessions
• questions of interest involve comparisons at the highest level
Multi-Level FMRI analysis
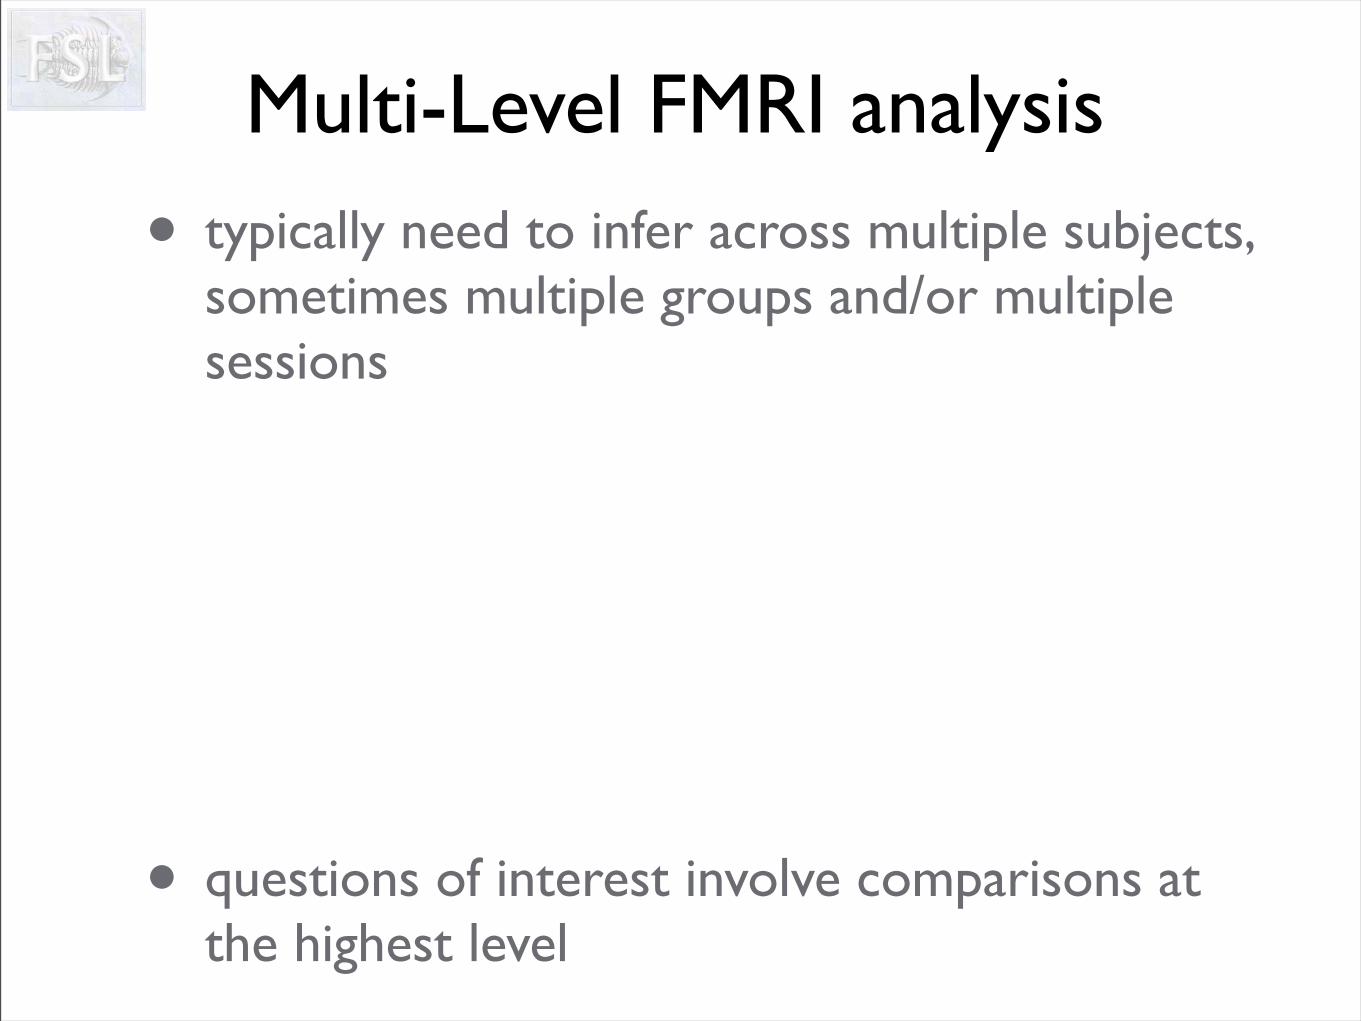
• typically need to infer across multiple subjects, sometimes multiple groups and/or multiple sessions
• questions of interest involve comparisons at the highest level
Multi-Level FMRI analysis
Group 2
HannaJosephine Anna Sebastian Lydia Elisabeth
Group 1
Mark Steve Karl Keith Tom Andrew
session 1
session 2
session 3
session 4
session 1
session 2
session 3
session 1
session 2
session 3
session 4
session 1
session 2
session 3
session 1
session 2
session 3
session 4
session 1
session 2
session 3
session 4
session 1
session 2
session 3
session 4
session 1
session 2
session 3
session 1
session 2
session 3
session 4
session 1
session 2
session 3
session 1
session 2
session 3
session 4
session 1
session 2
session 3
session 4
Difference?
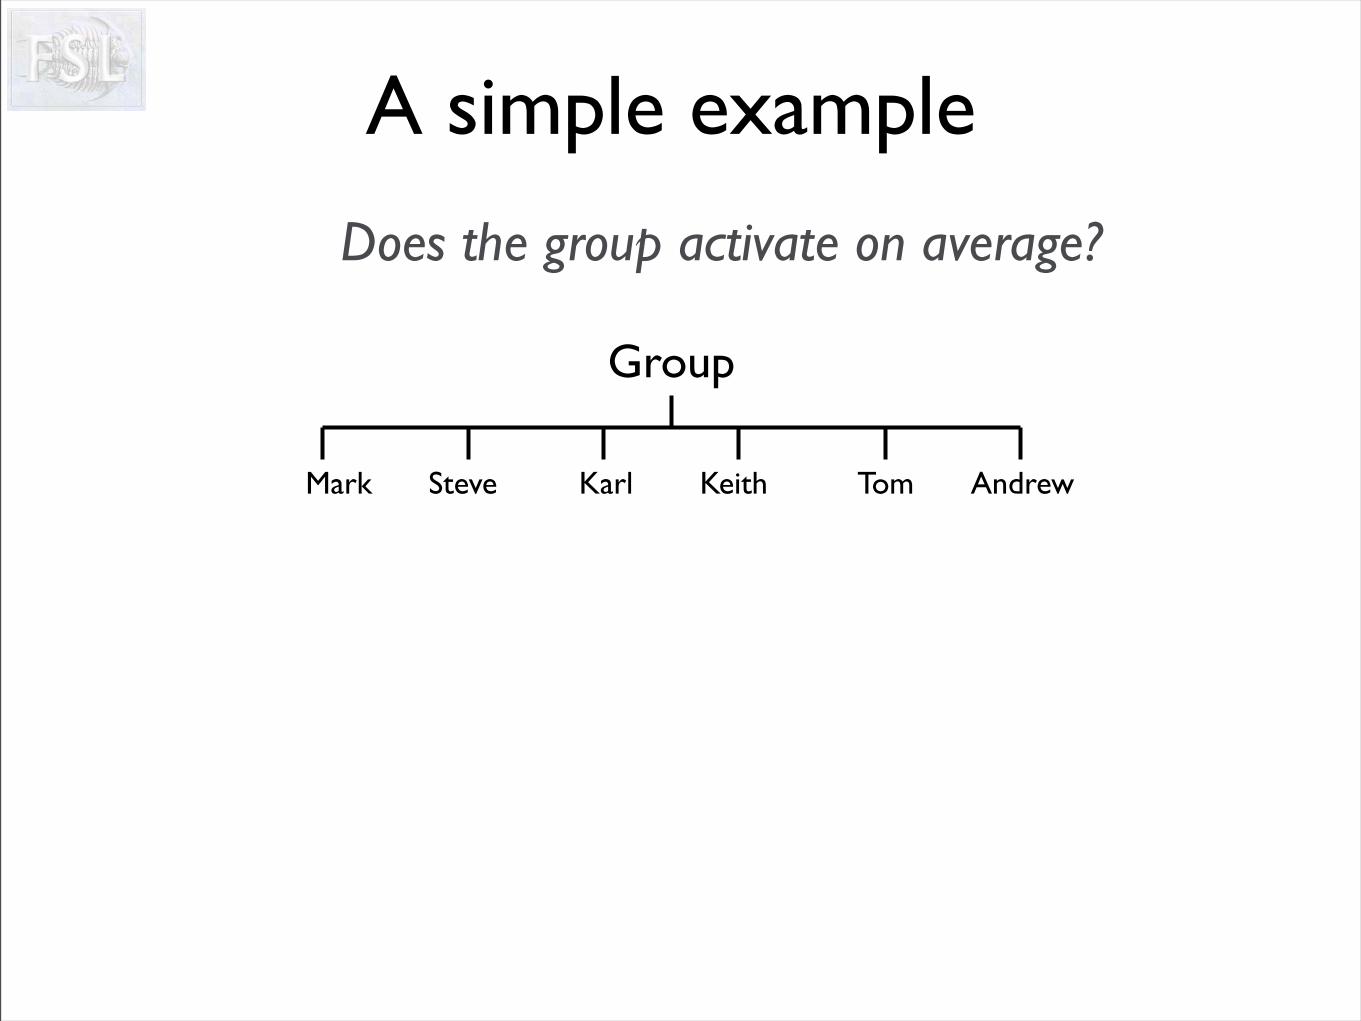
Does the group activate on average?
A simple example
Group
Mark Steve Karl Keith Tom Andrew
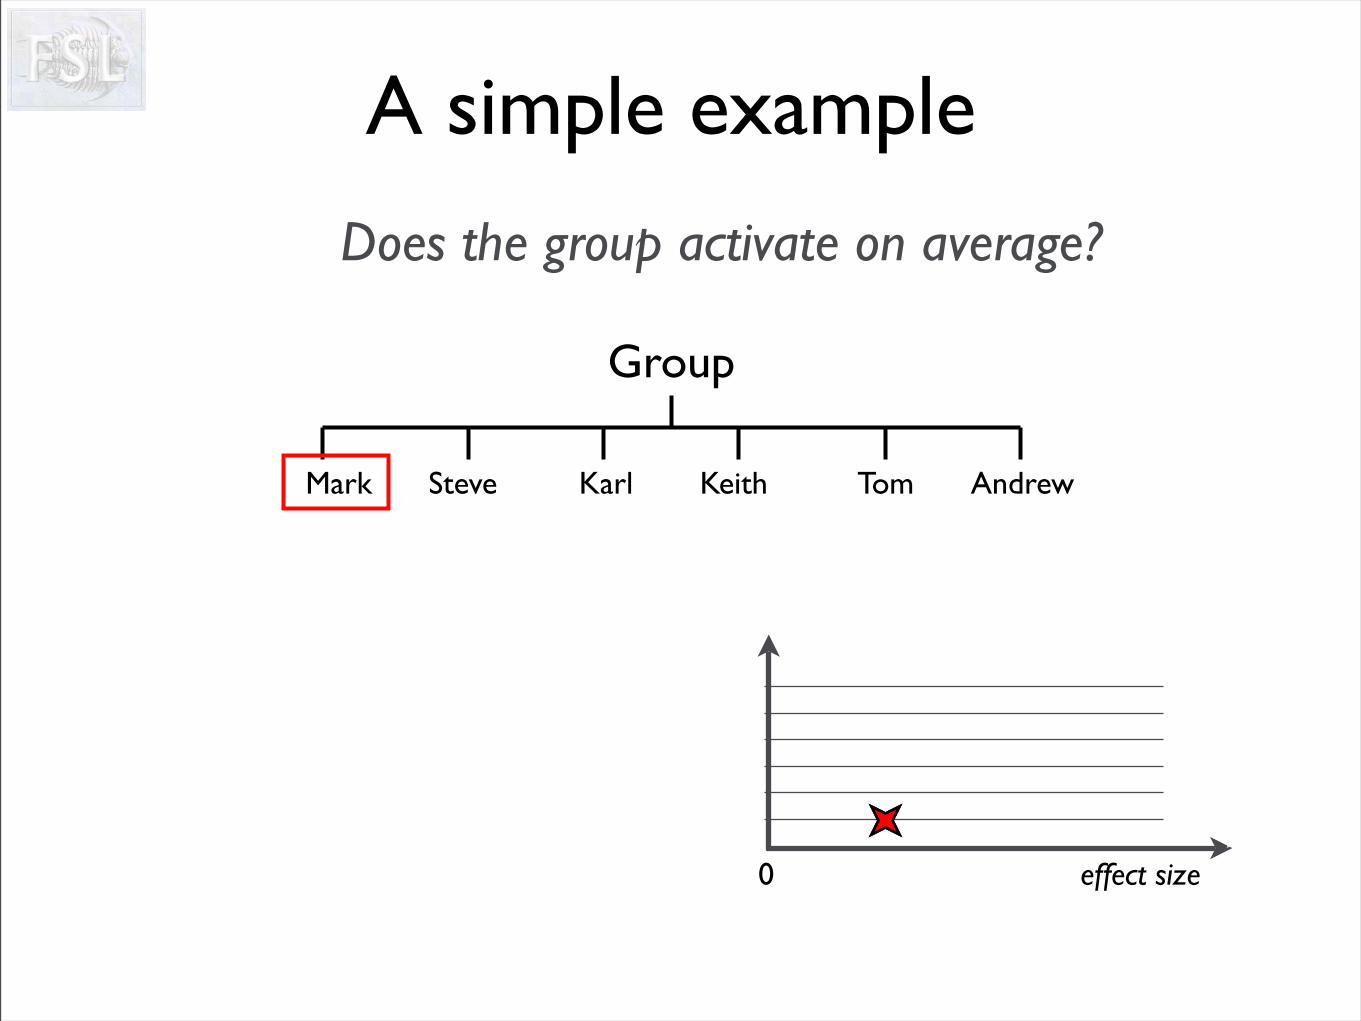
Does the group activate on average?
0 effect size
A simple example
Group
Mark Steve Karl Keith Tom Andrew
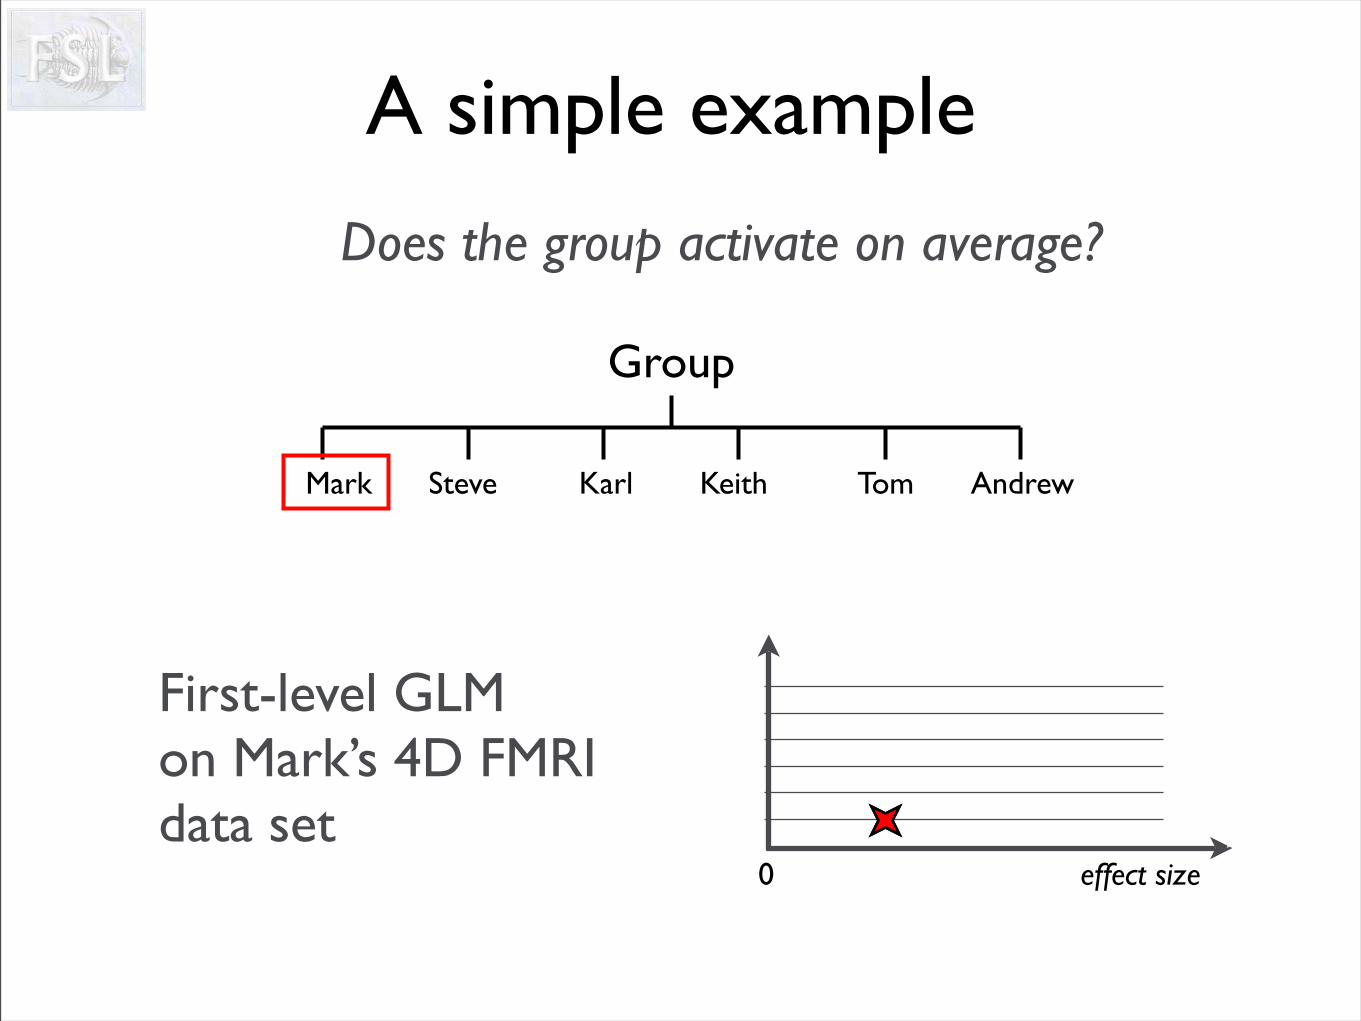
Does the group activate on average?
0 effect size
A simple example
Group
Mark Steve Karl Keith Tom Andrew
First-level GLMon Mark’s 4D FMRIdata set
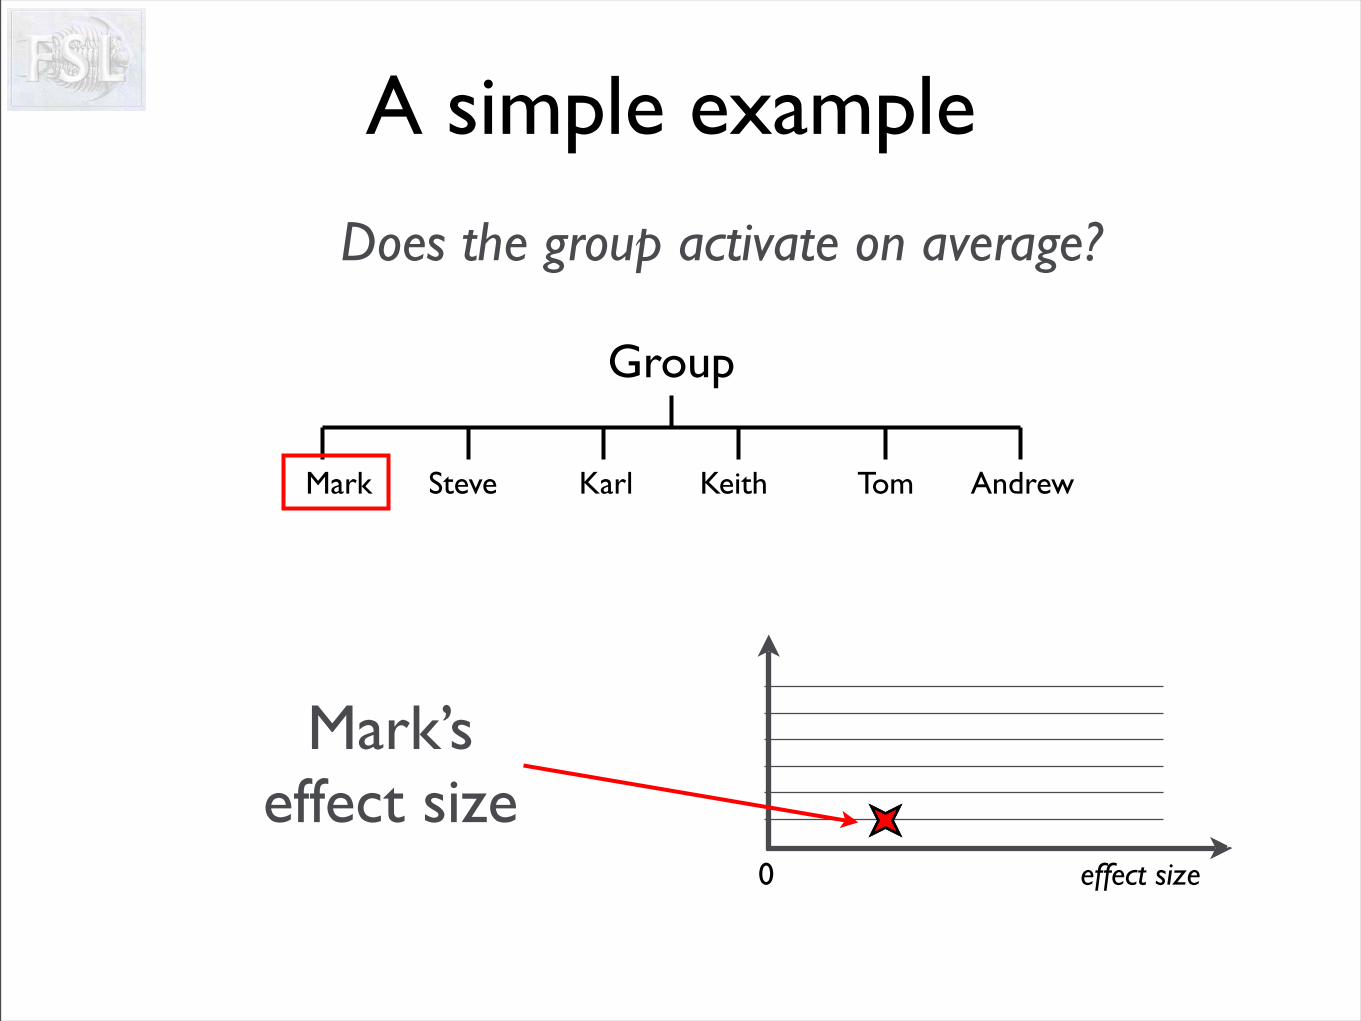
Does the group activate on average?
0 effect size
A simple example
Group
Mark Steve Karl Keith Tom Andrew
Mark’s effect size
Does the group activate on average?
0 effect size
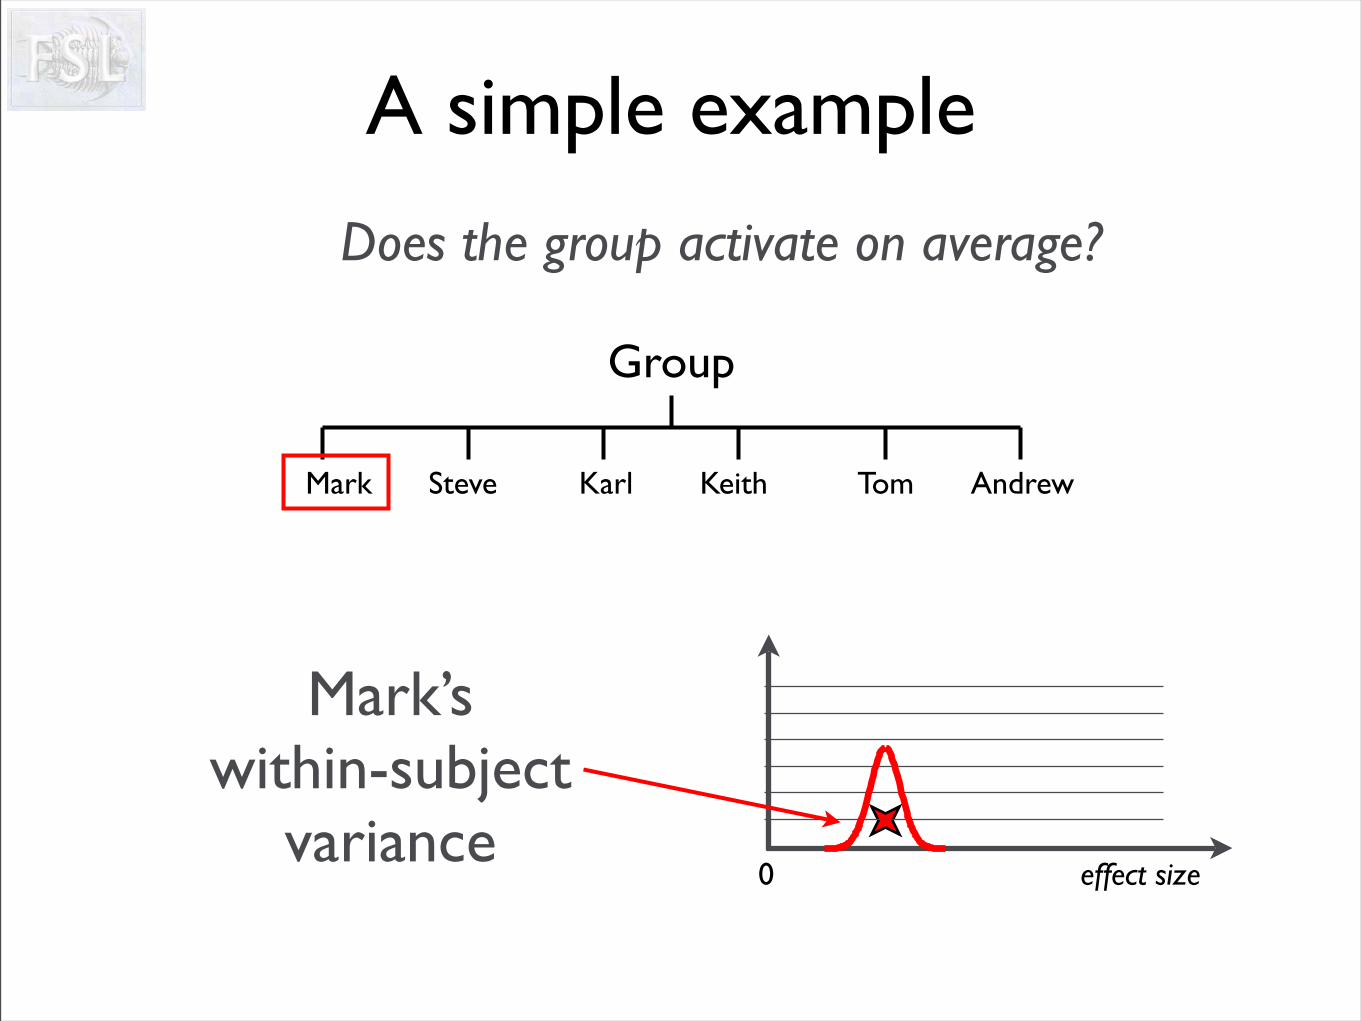
A simple example
Group
Mark Steve Karl Keith Tom Andrew
Mark’s within-subject
variance
Does the group activate on average?
0 effect size
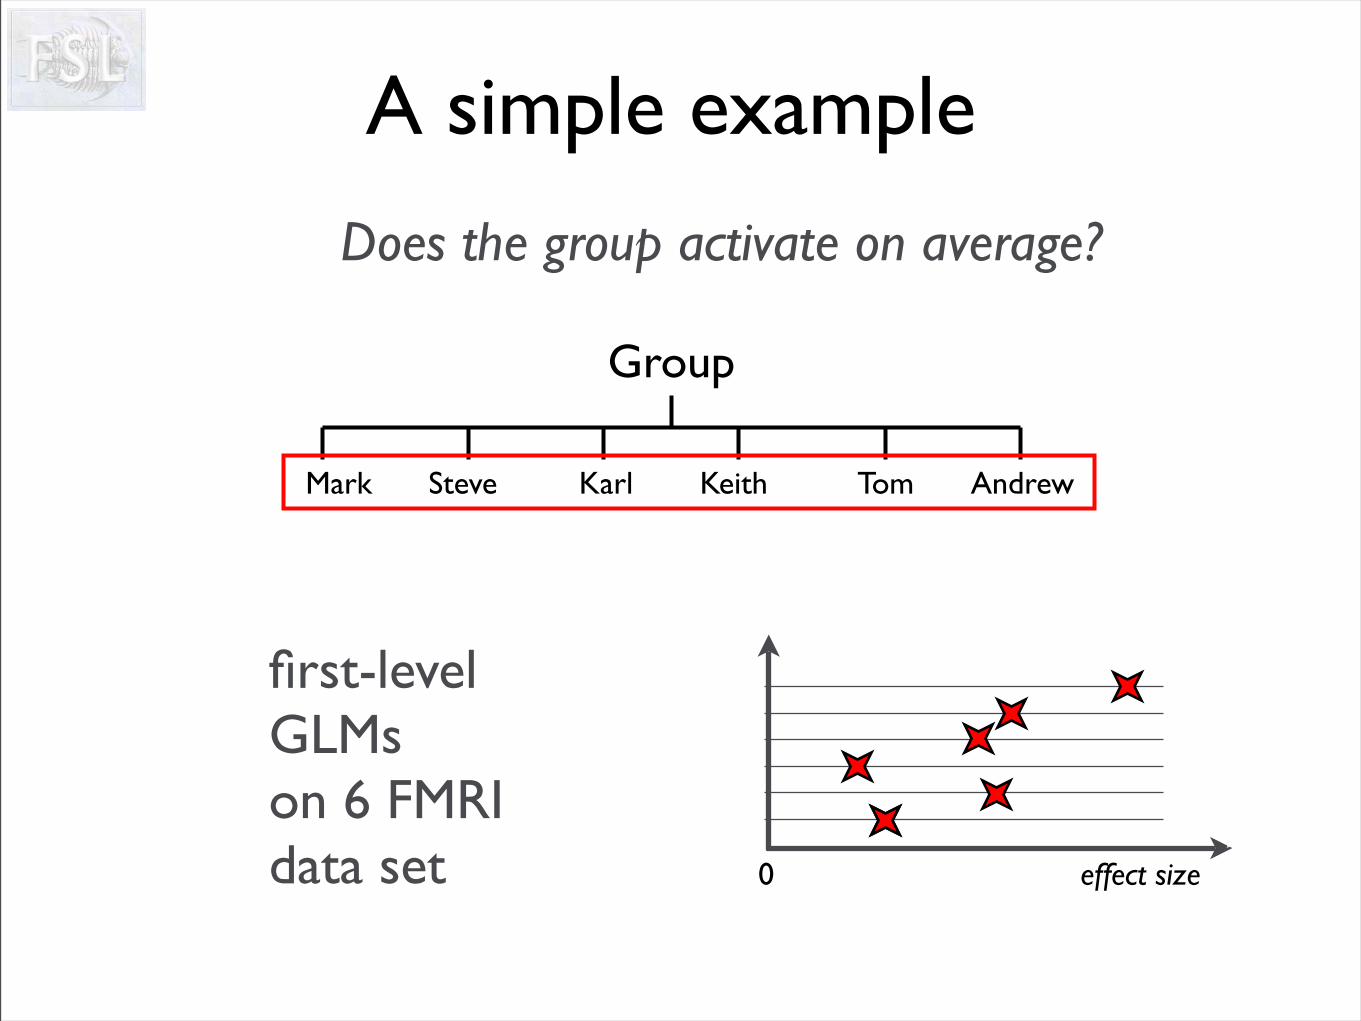
A simple example
Group
Mark Steve Karl Keith Tom Andrew
first-level GLMson 6 FMRI data set
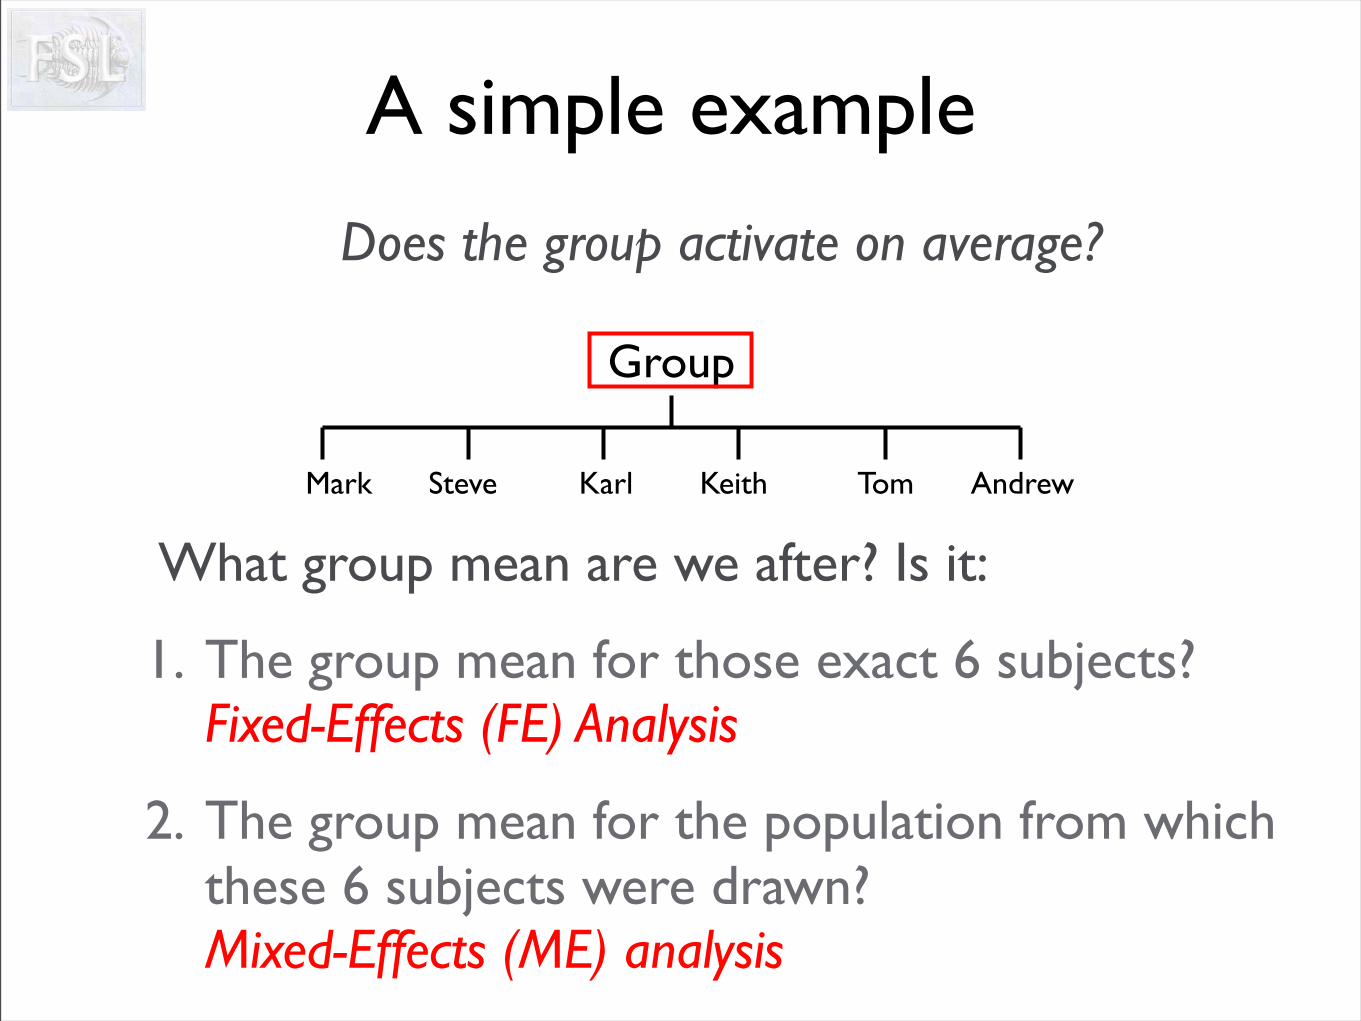
Does the group activate on average?
What group mean are we after? Is it:
1. The group mean for those exact 6 subjects?Fixed-Effects (FE) Analysis
2. The group mean for the population from which these 6 subjects were drawn?Mixed-Effects (ME) analysis
A simple example
Group
Mark Steve Karl Keith Tom Andrew
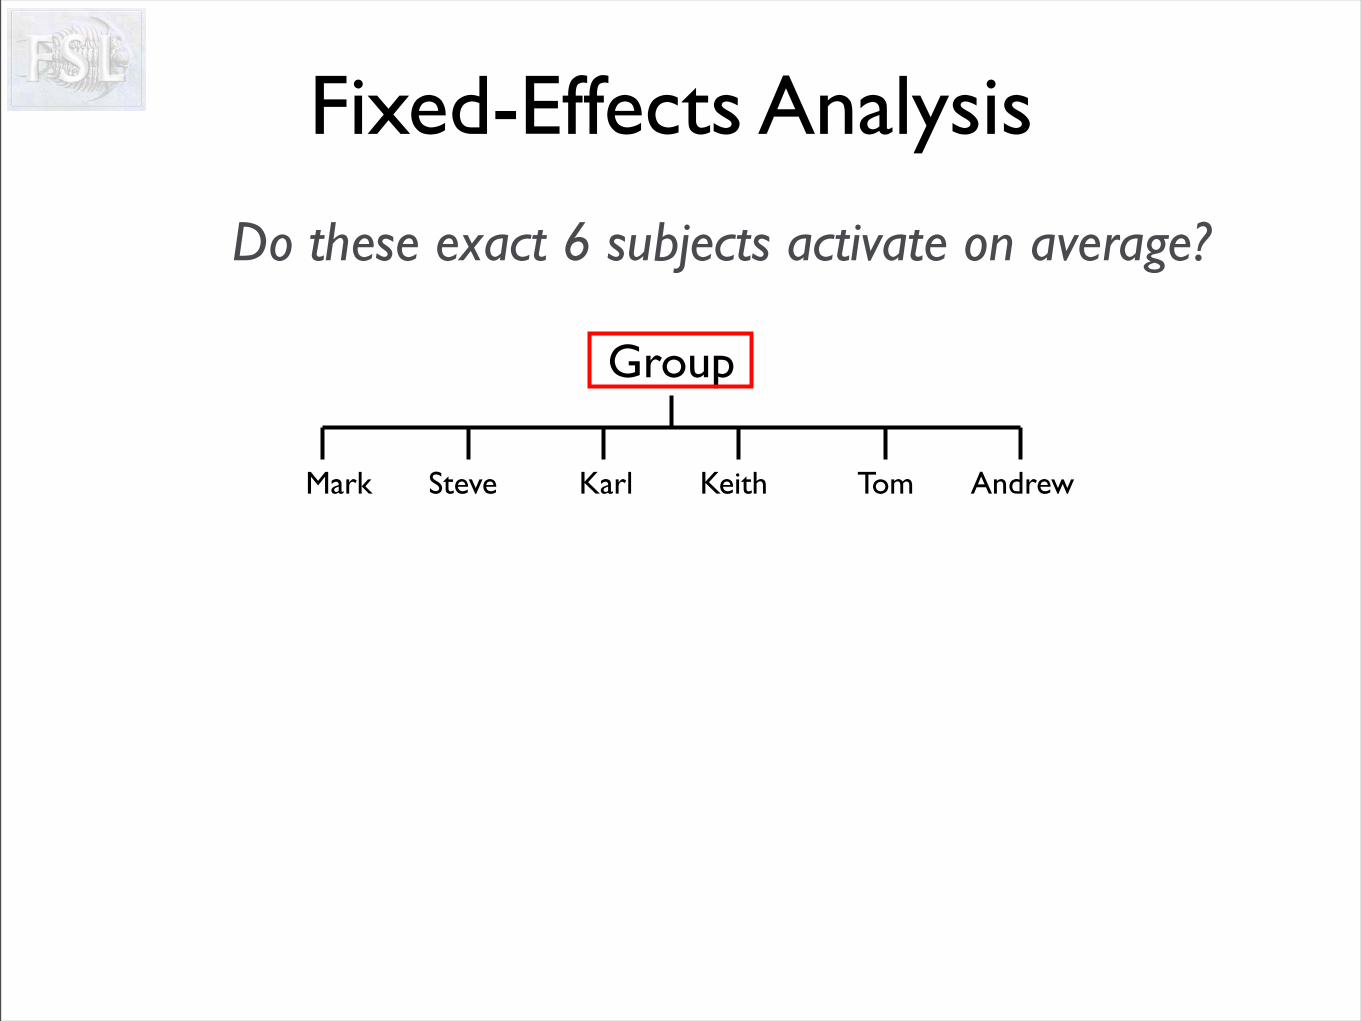
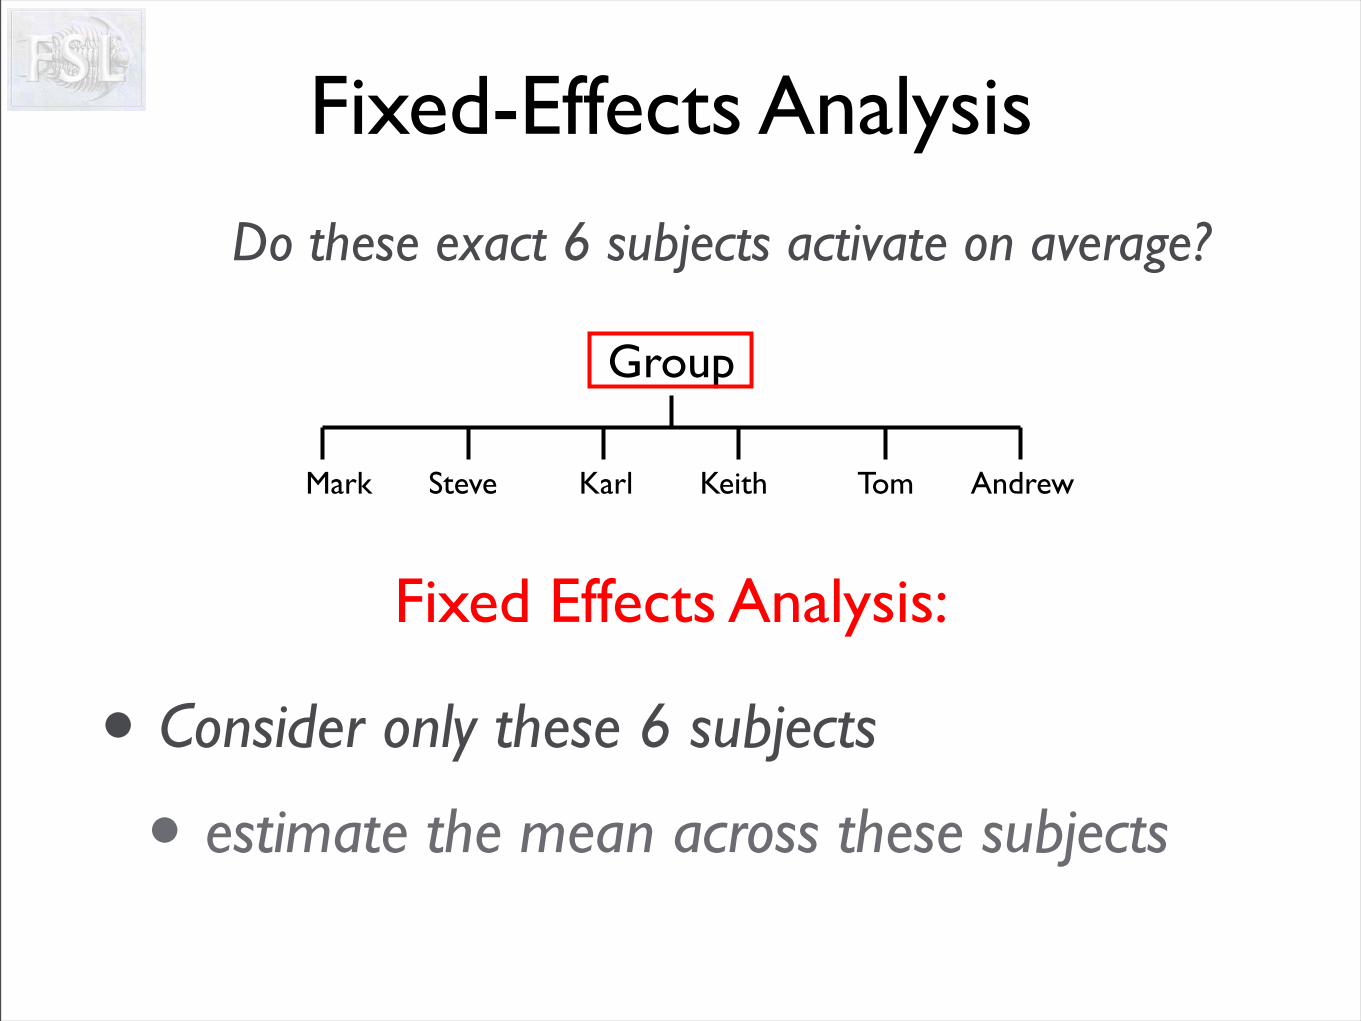
Do these exact 6 subjects activate on average?
Fixed-Effects Analysis
Group
Mark Steve Karl Keith Tom Andrew
Do these exact 6 subjects activate on average?
Fixed-Effects Analysis
Group
Mark Steve Karl Keith Tom Andrew
0 effect size
estimate group effect size as straight-forward mean
across lower-level estimates
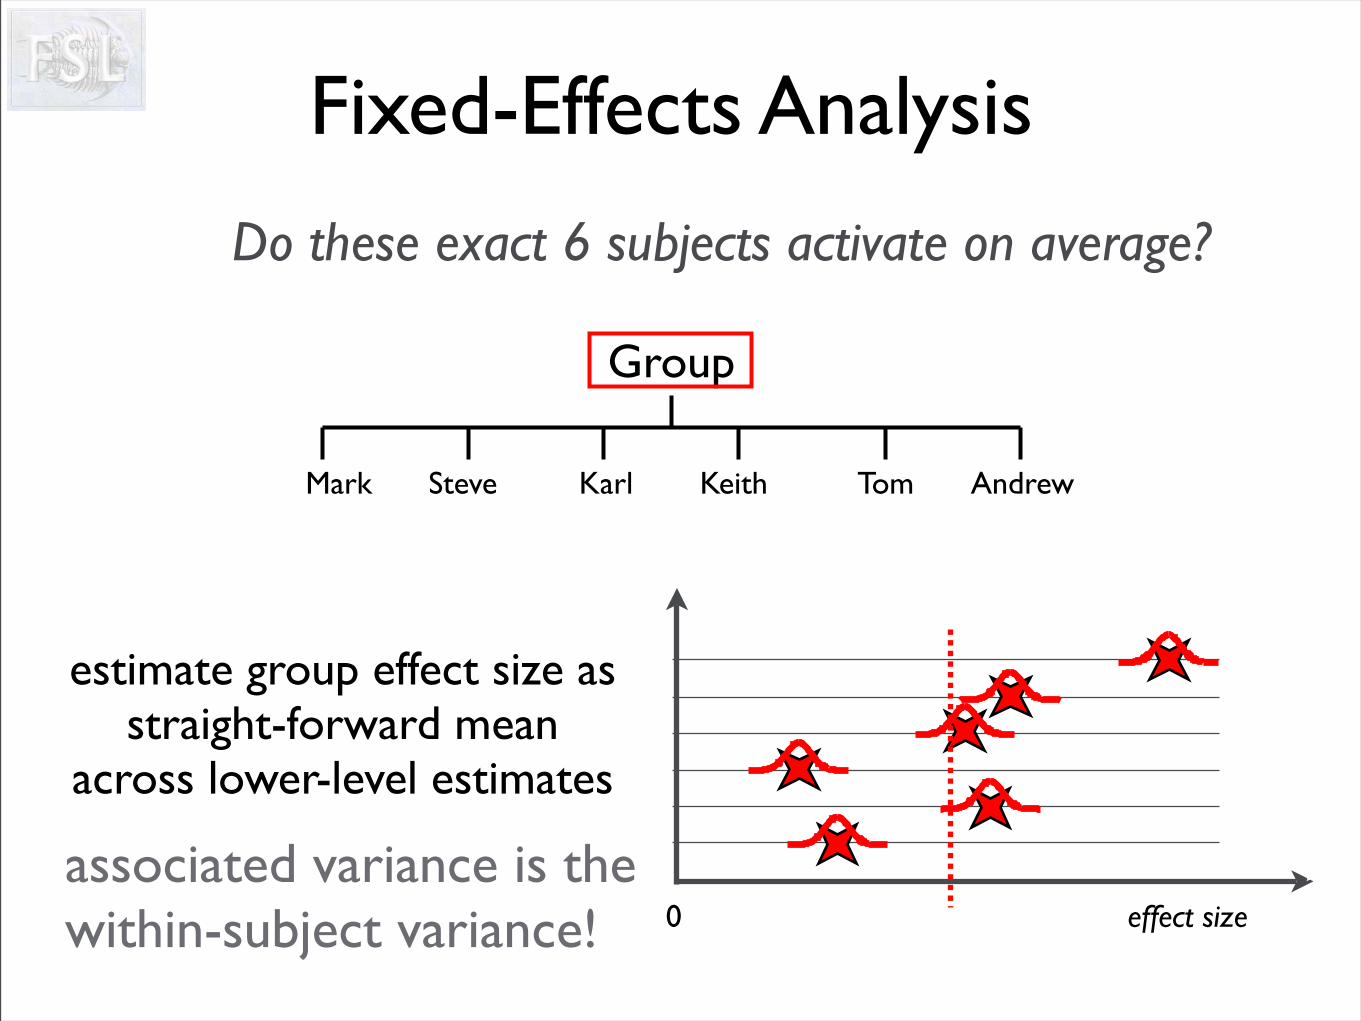
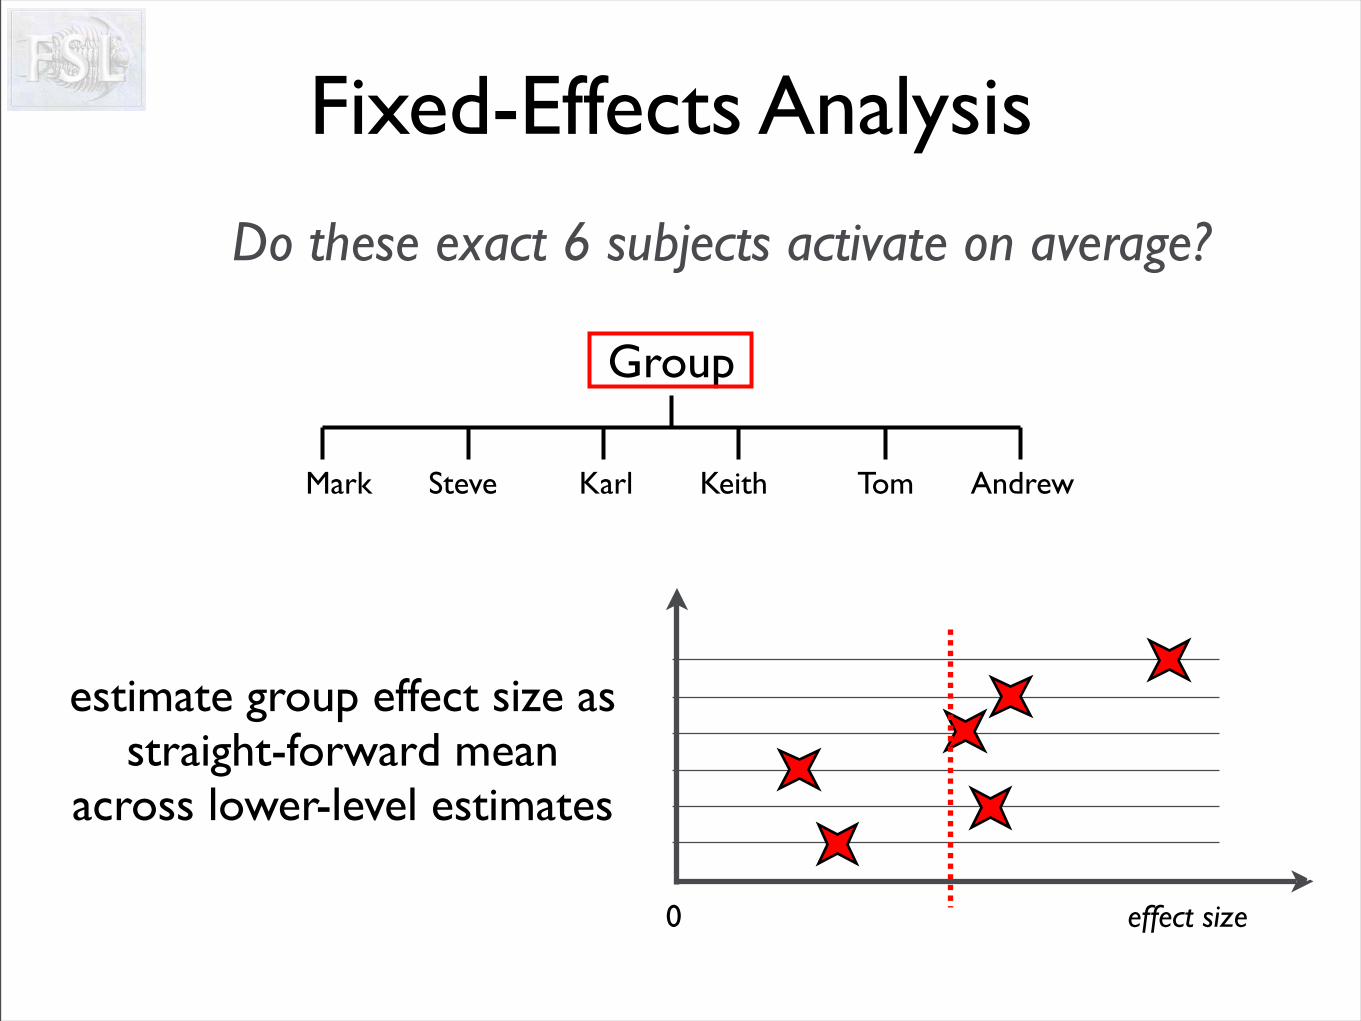
Do these exact 6 subjects activate on average?
Fixed-Effects Analysis
Group
Mark Steve Karl Keith Tom Andrew
0 effect size
estimate group effect size as straight-forward mean
across lower-level estimates
associated variance is the within-subject variance!
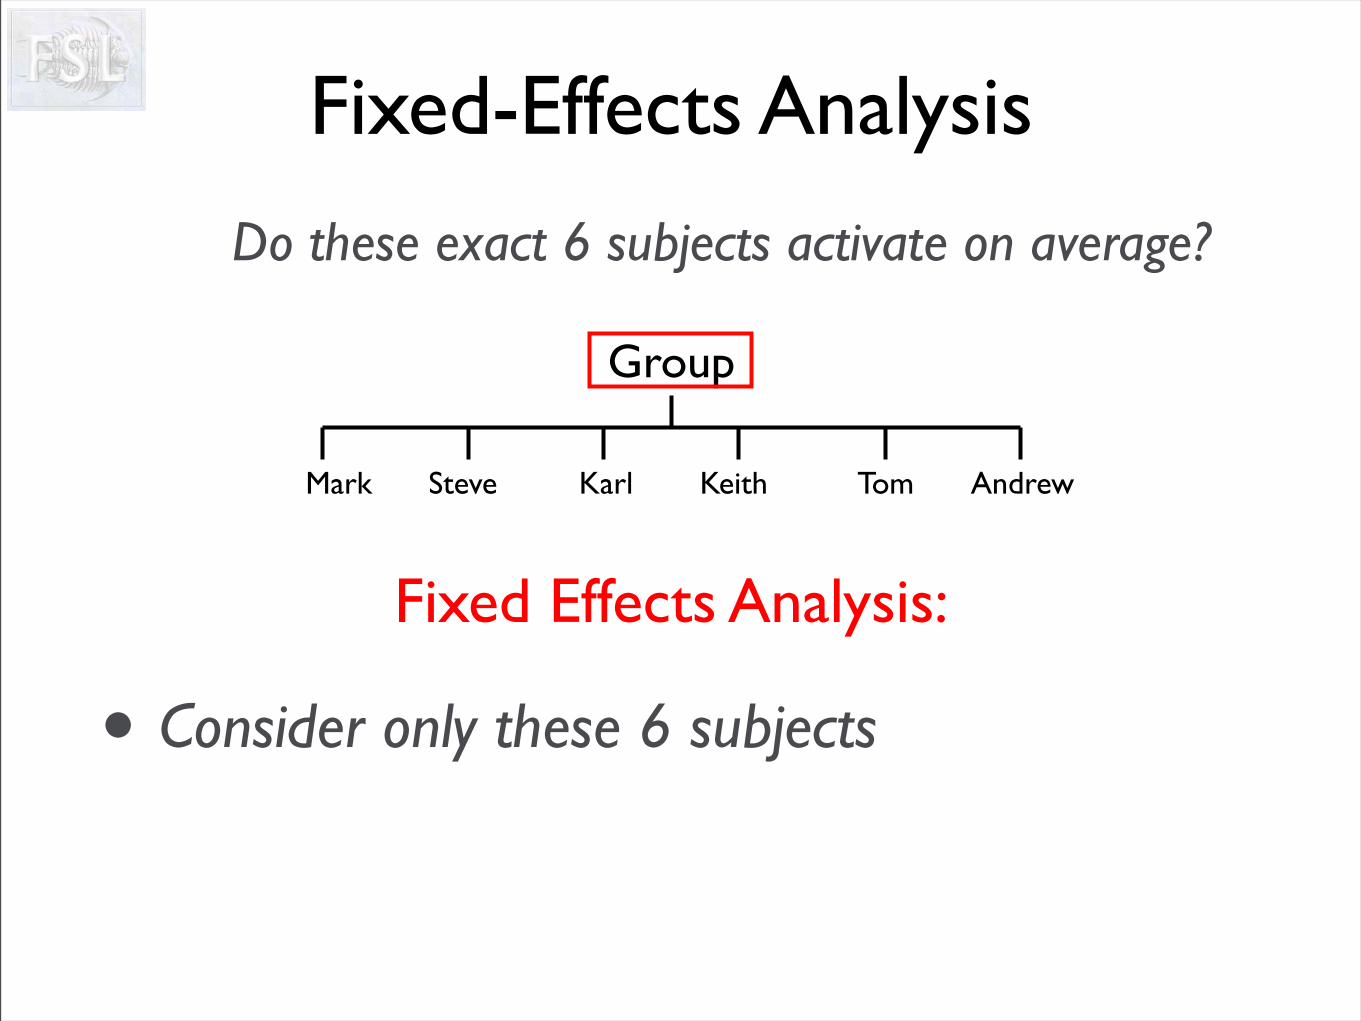
Do these exact 6 subjects activate on average?
• Consider only these 6 subjects
Fixed-Effects Analysis
Group
Mark Steve Karl Keith Tom Andrew
Fixed Effects Analysis:
Do these exact 6 subjects activate on average?
• Consider only these 6 subjects
• estimate the mean across these subjects
Fixed-Effects Analysis
Group
Mark Steve Karl Keith Tom Andrew
Fixed Effects Analysis:
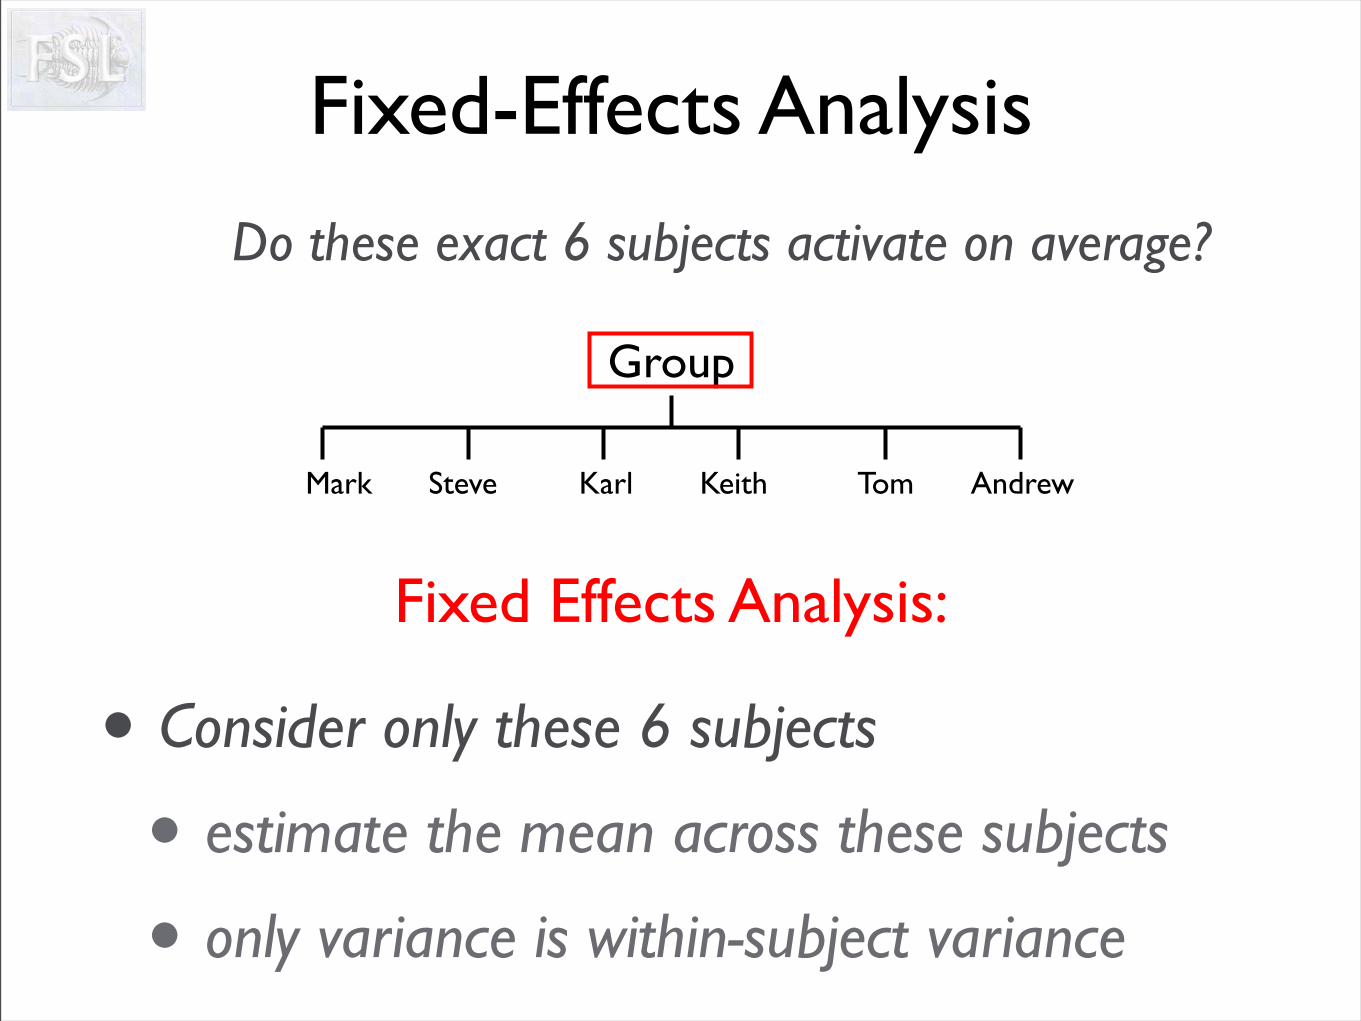
Do these exact 6 subjects activate on average?
• Consider only these 6 subjects
• estimate the mean across these subjects
• only variance is within-subject variance
Fixed-Effects Analysis
Group
Mark Steve Karl Keith Tom Andrew
Fixed Effects Analysis:

Does the group activate on average?
What group mean are we after? Is it:
1. The group mean for those exact 6 subjects?Fixed-Effects (FE) Analysis
2. The group mean for the population from which these 6 subjects were drawn?Mixed-Effects (ME) analysis
A simple example
Group
Mark Steve Karl Keith Tom Andrew
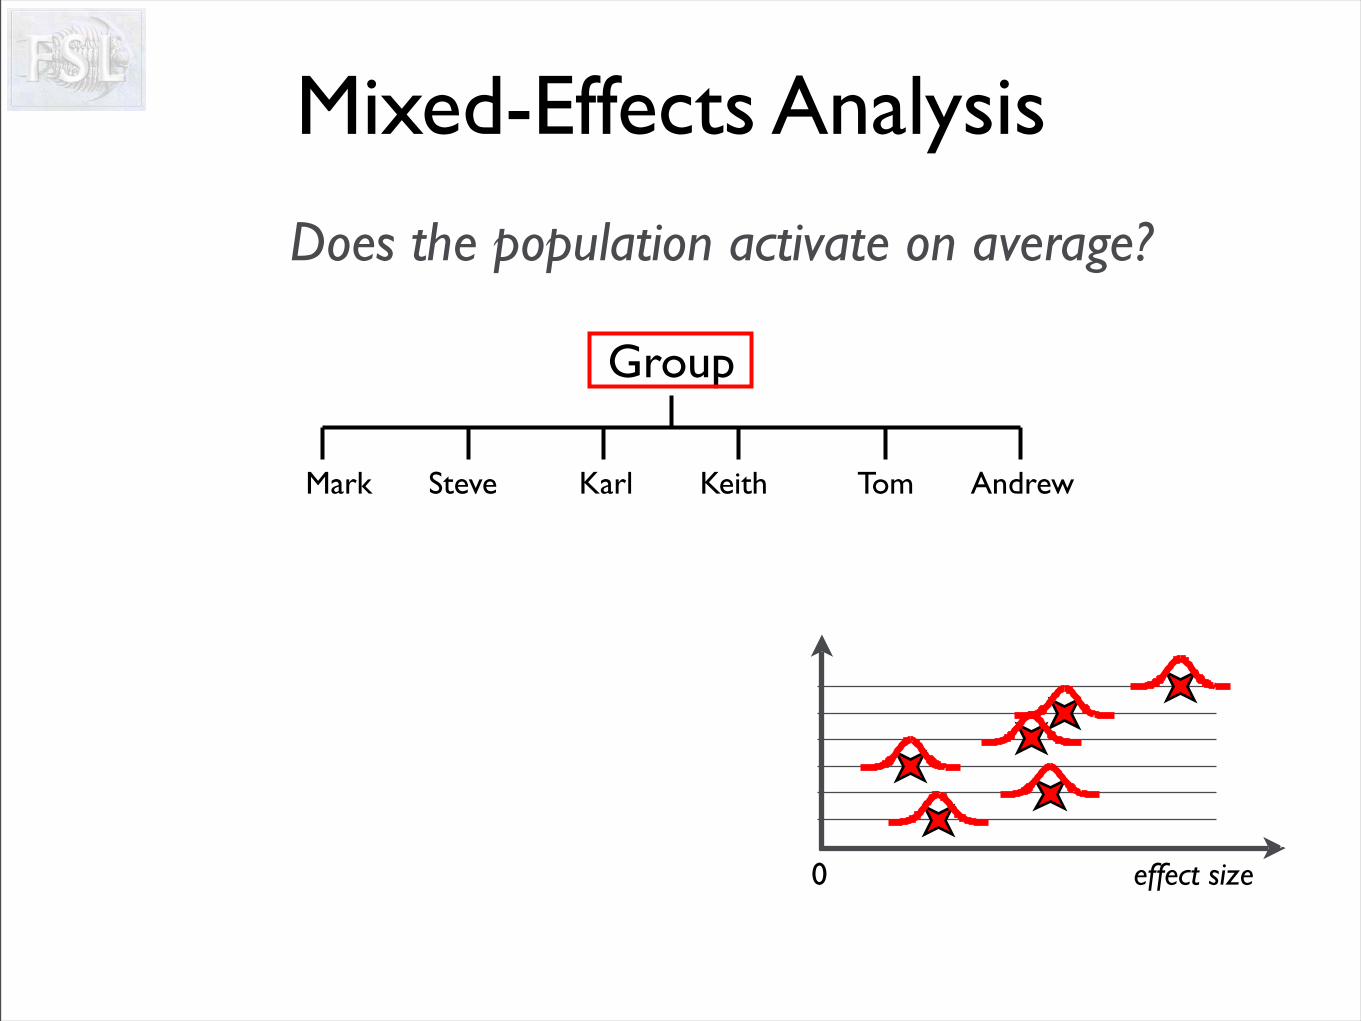
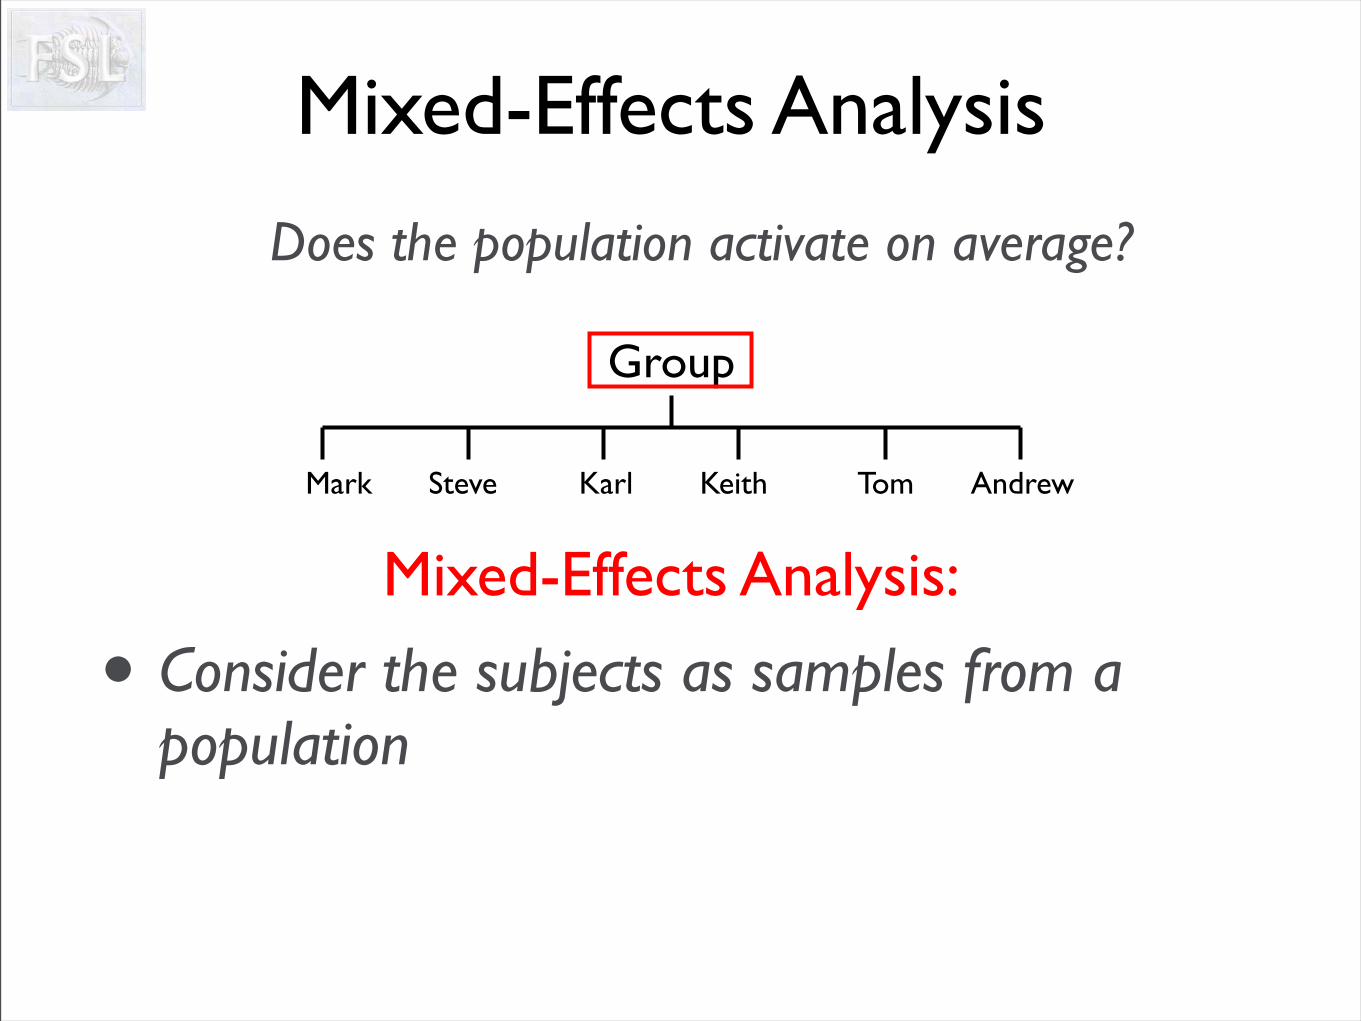
Does the population activate on average?
Mixed-Effects Analysis
Group
Mark Steve Karl Keith Tom Andrew
0 effect size
0 effect size
Does the population activate on average?
Mixed-Effects Analysis
Group
Mark Steve Karl Keith Tom Andrew
0 effect size
Consider the distribution over the population from which our 6 subjects were sampled:
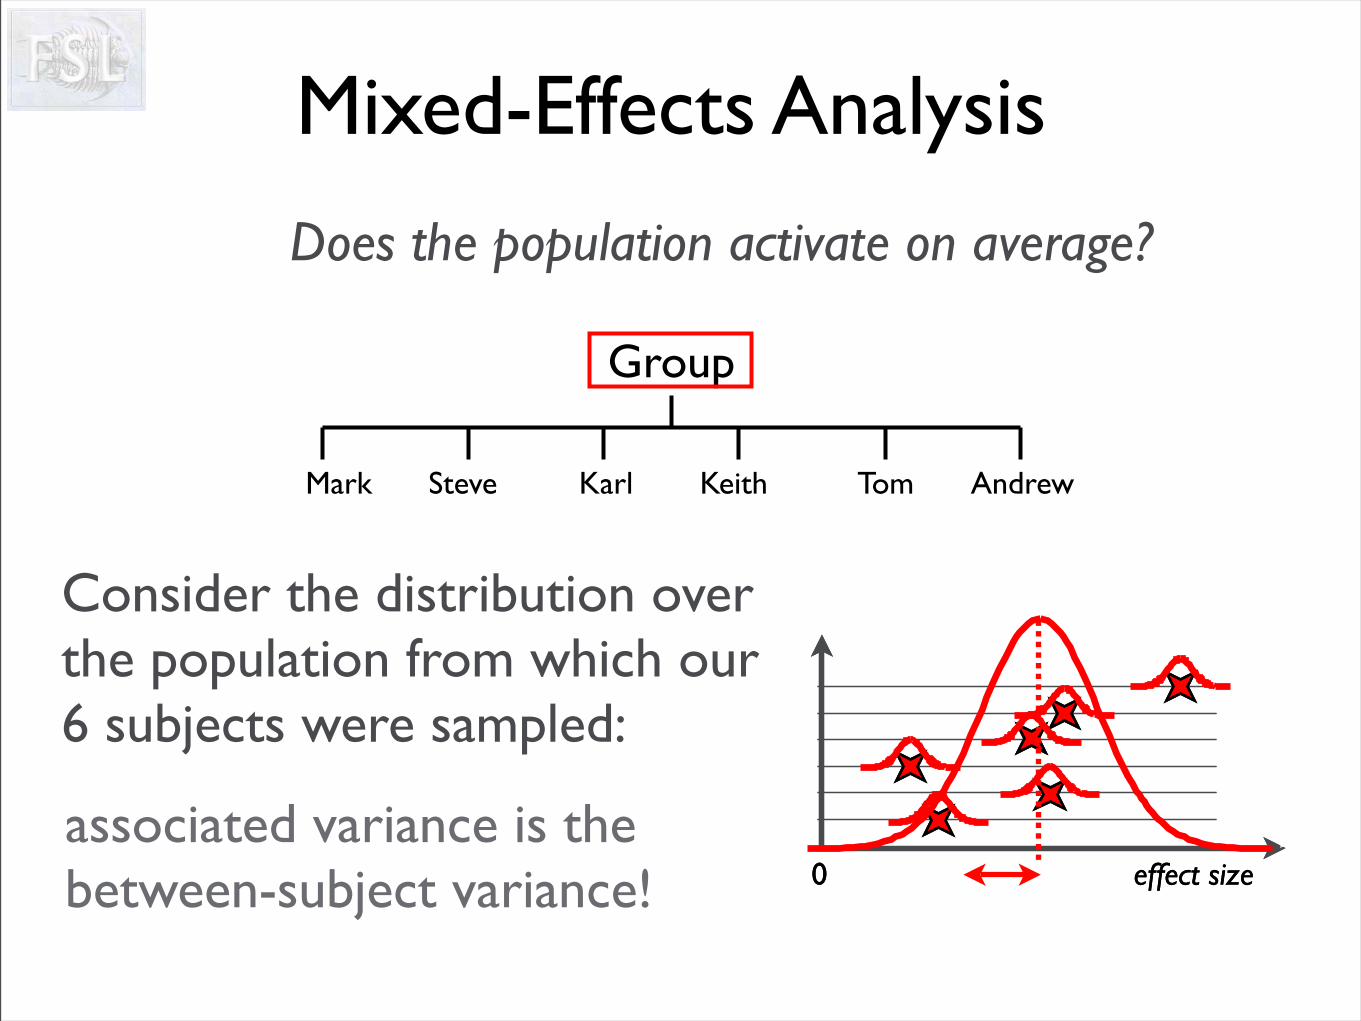
0 effect size
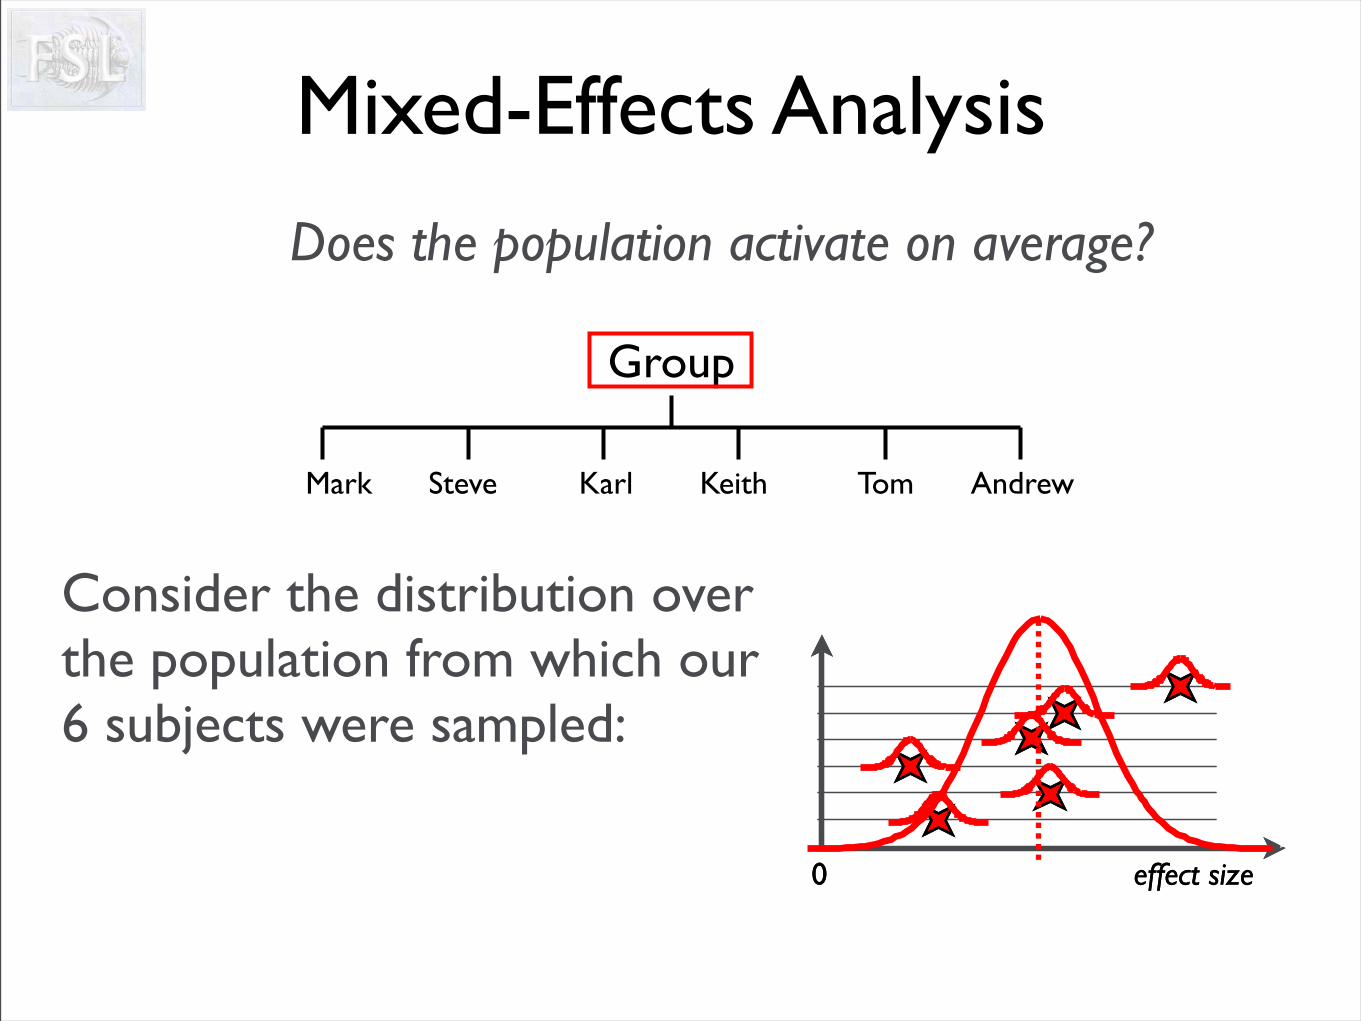
Does the population activate on average?
Mixed-Effects Analysis
Group
Mark Steve Karl Keith Tom Andrew
0 effect size
Consider the distribution over the population from which our 6 subjects were sampled:
associated variance is the between-subject variance!
Does the population activate on average?
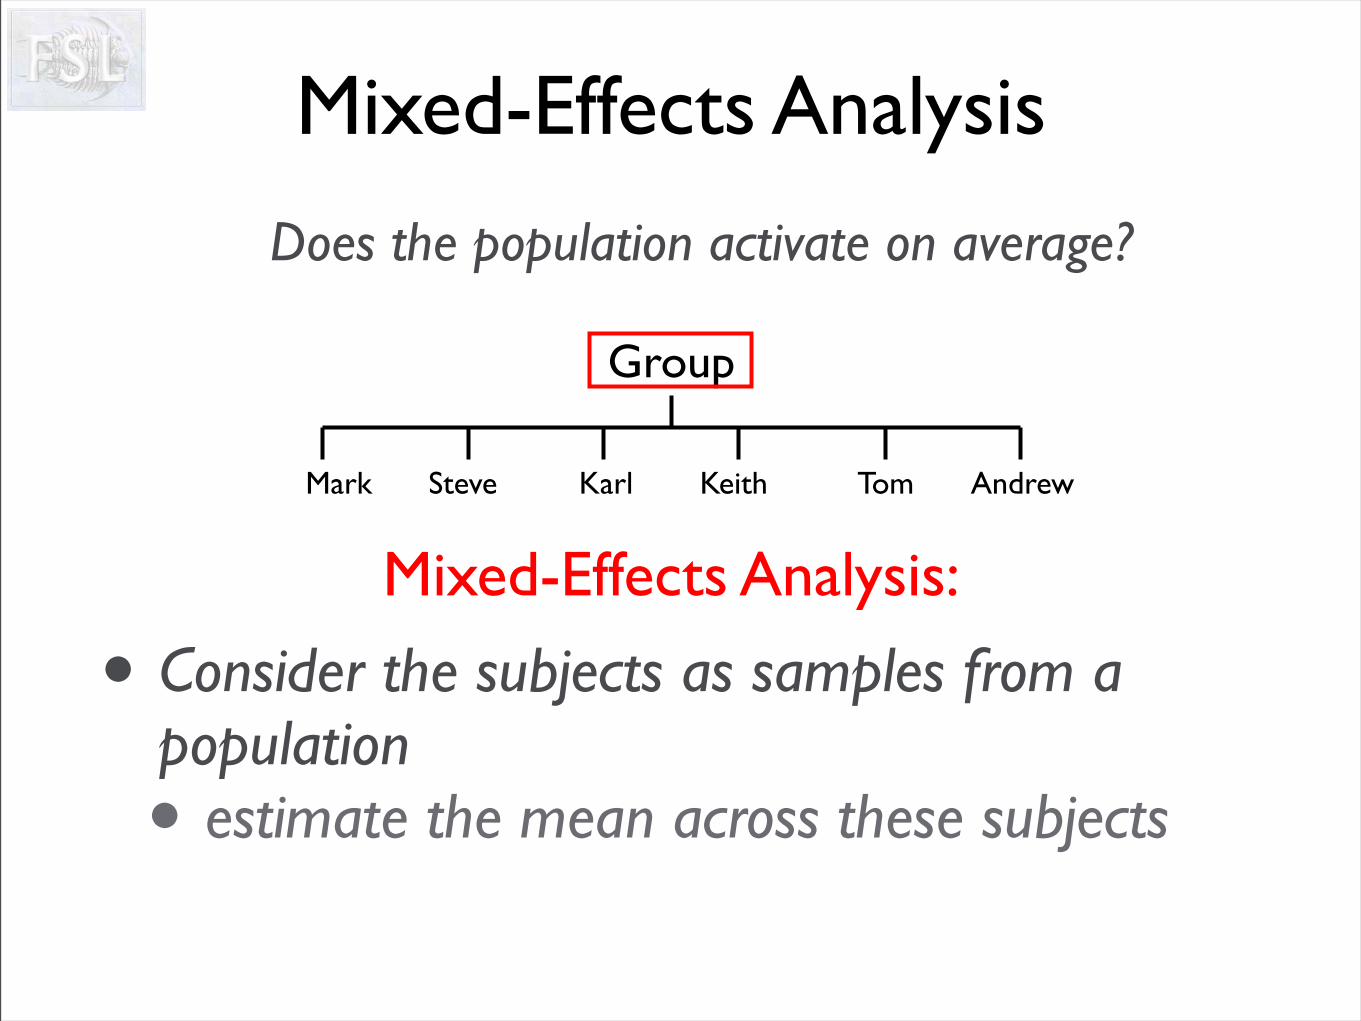
• Consider the subjects as samples from a population
Mixed-Effects Analysis
Group
Mark Steve Karl Keith Tom Andrew
Mixed-Effects Analysis:
Does the population activate on average?
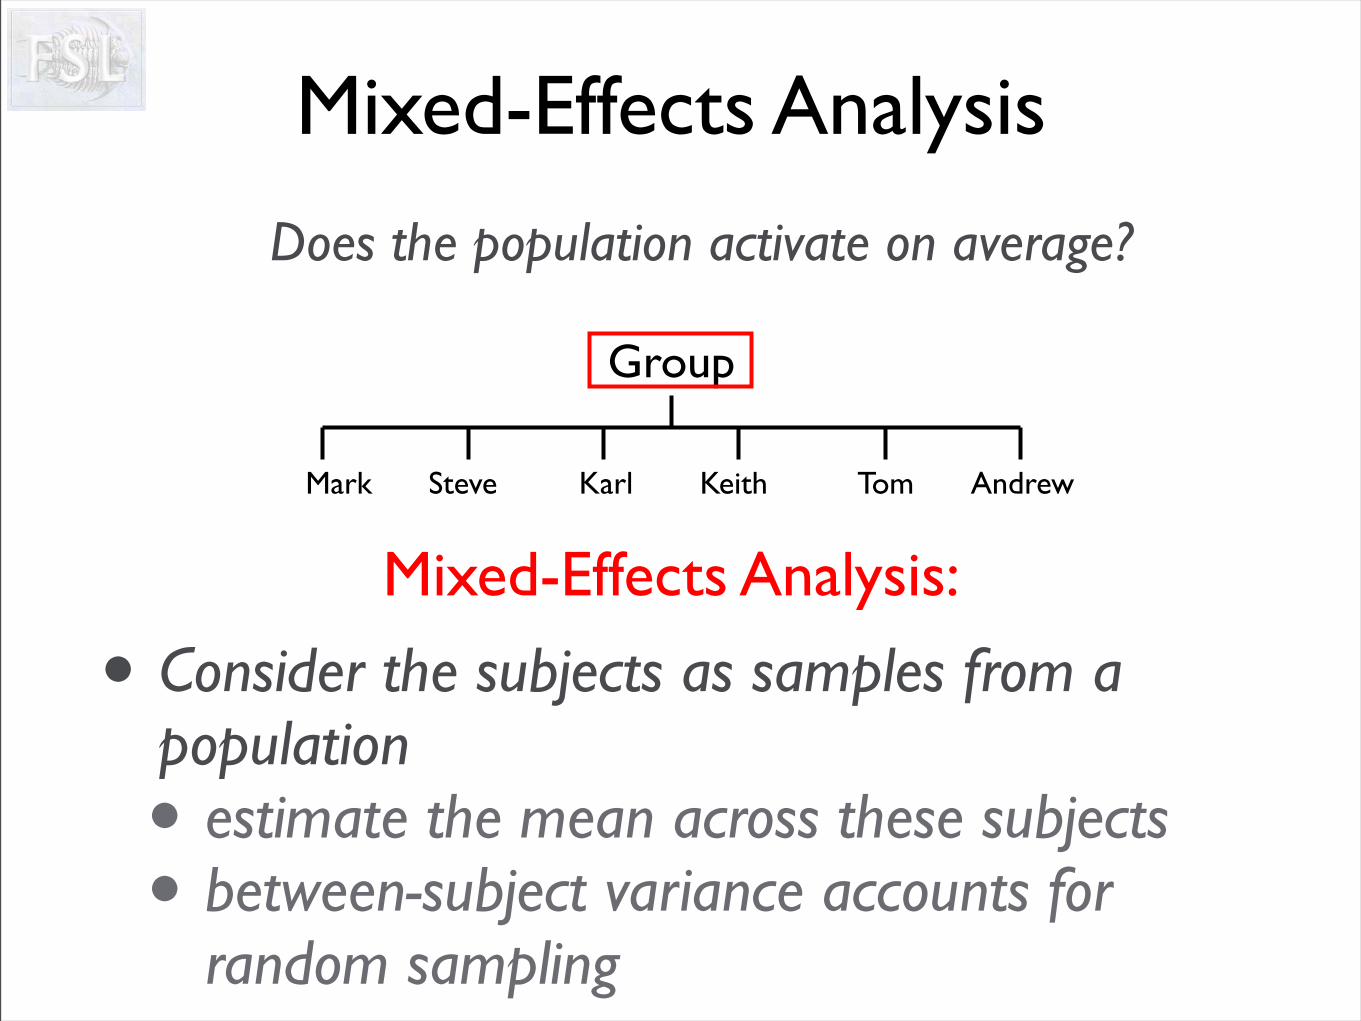
• Consider the subjects as samples from a population• estimate the mean across these subjects
Mixed-Effects Analysis
Group
Mark Steve Karl Keith Tom Andrew
Mixed-Effects Analysis:
Does the population activate on average?
• Consider the subjects as samples from a population• estimate the mean across these subjects• between-subject variance accounts for
random sampling
Mixed-Effects Analysis
Group
Mark Steve Karl Keith Tom Andrew
Mixed-Effects Analysis:
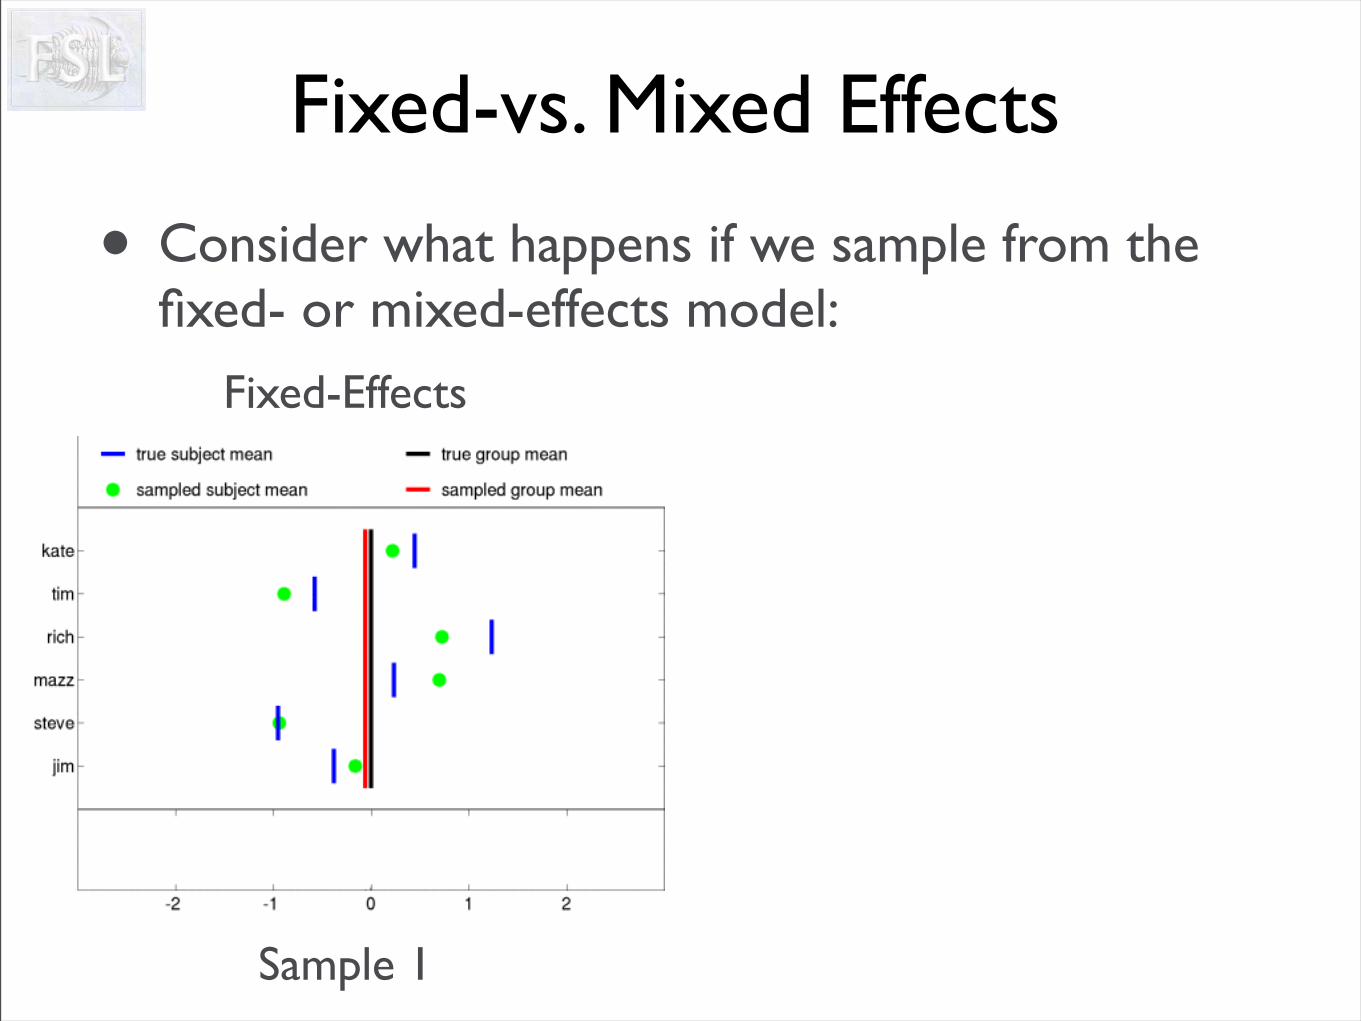
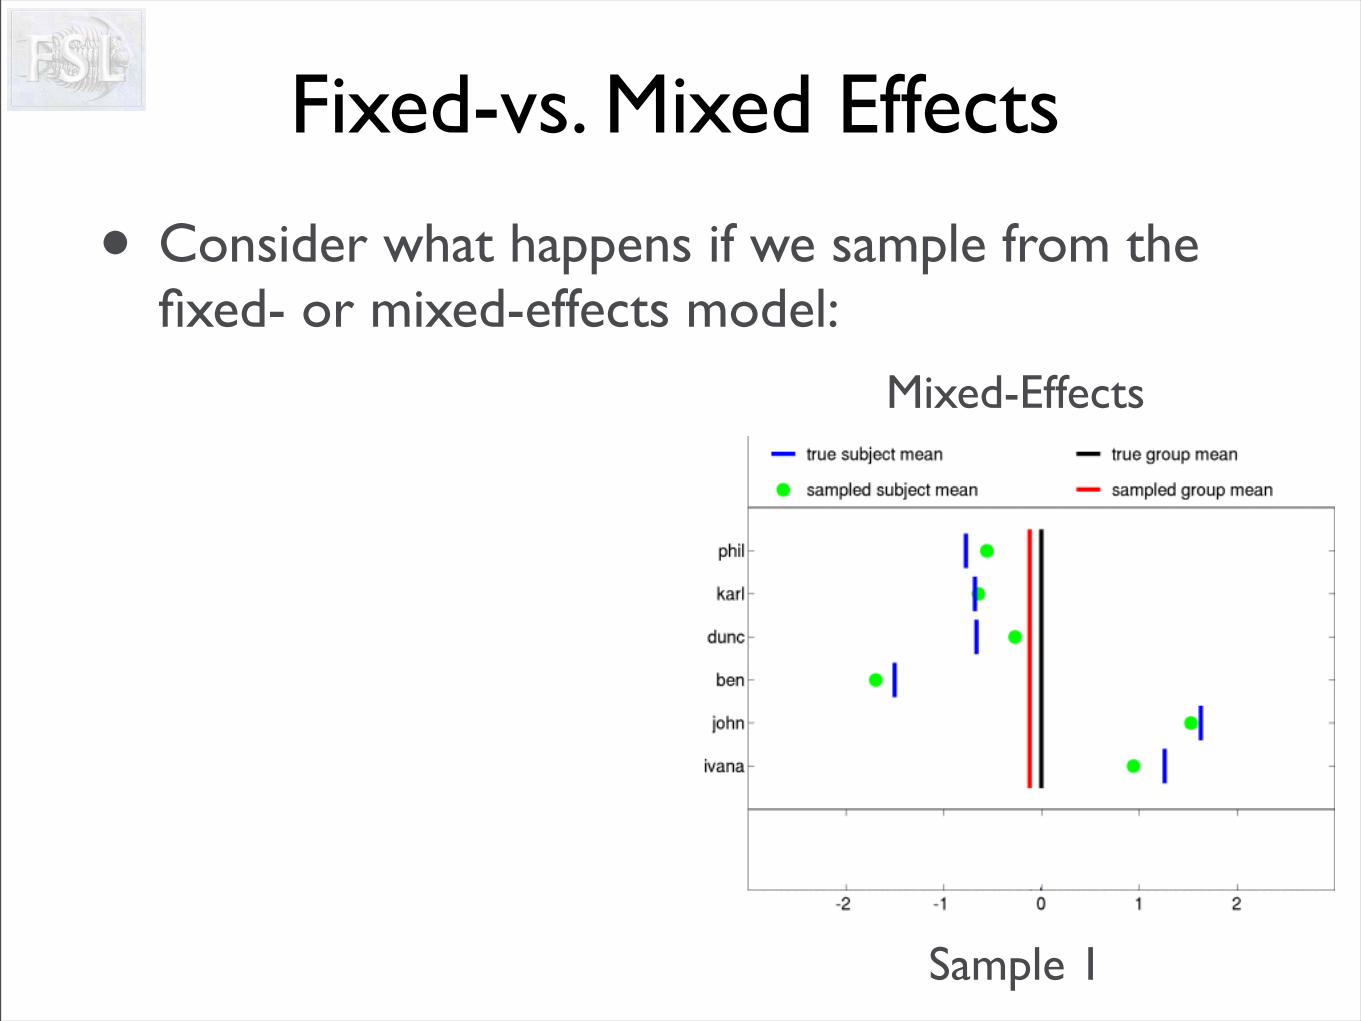
Fixed-vs. Mixed Effects
• Consider what happens if we sample from the fixed- or mixed-effects model:
Fixed-Effects
Sample 1
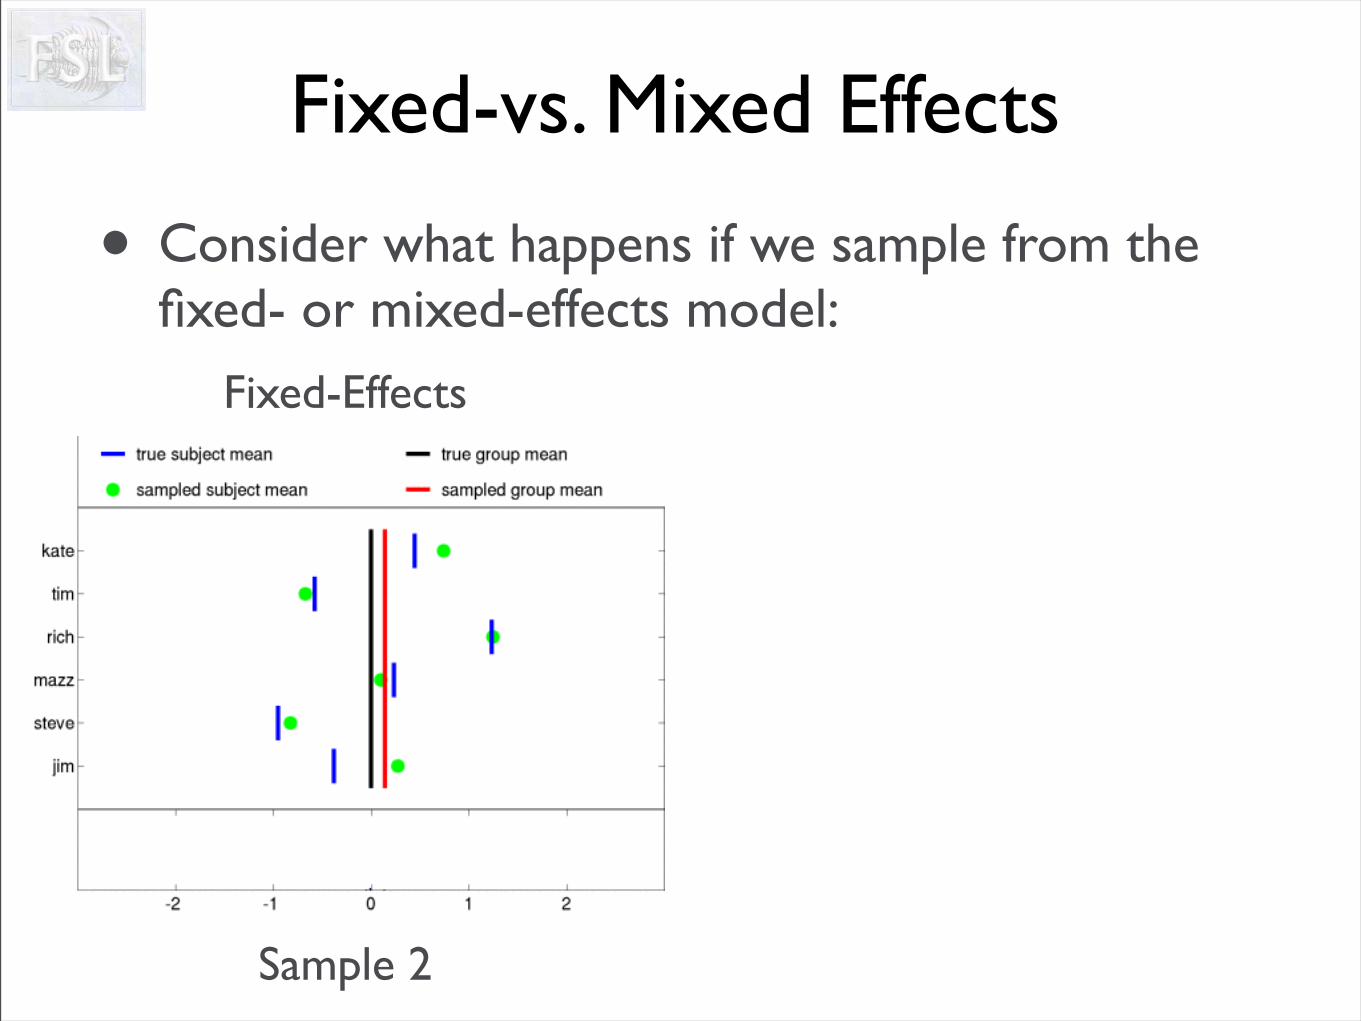
Fixed-vs. Mixed Effects
• Consider what happens if we sample from the fixed- or mixed-effects model:
Fixed-Effects
Sample 2
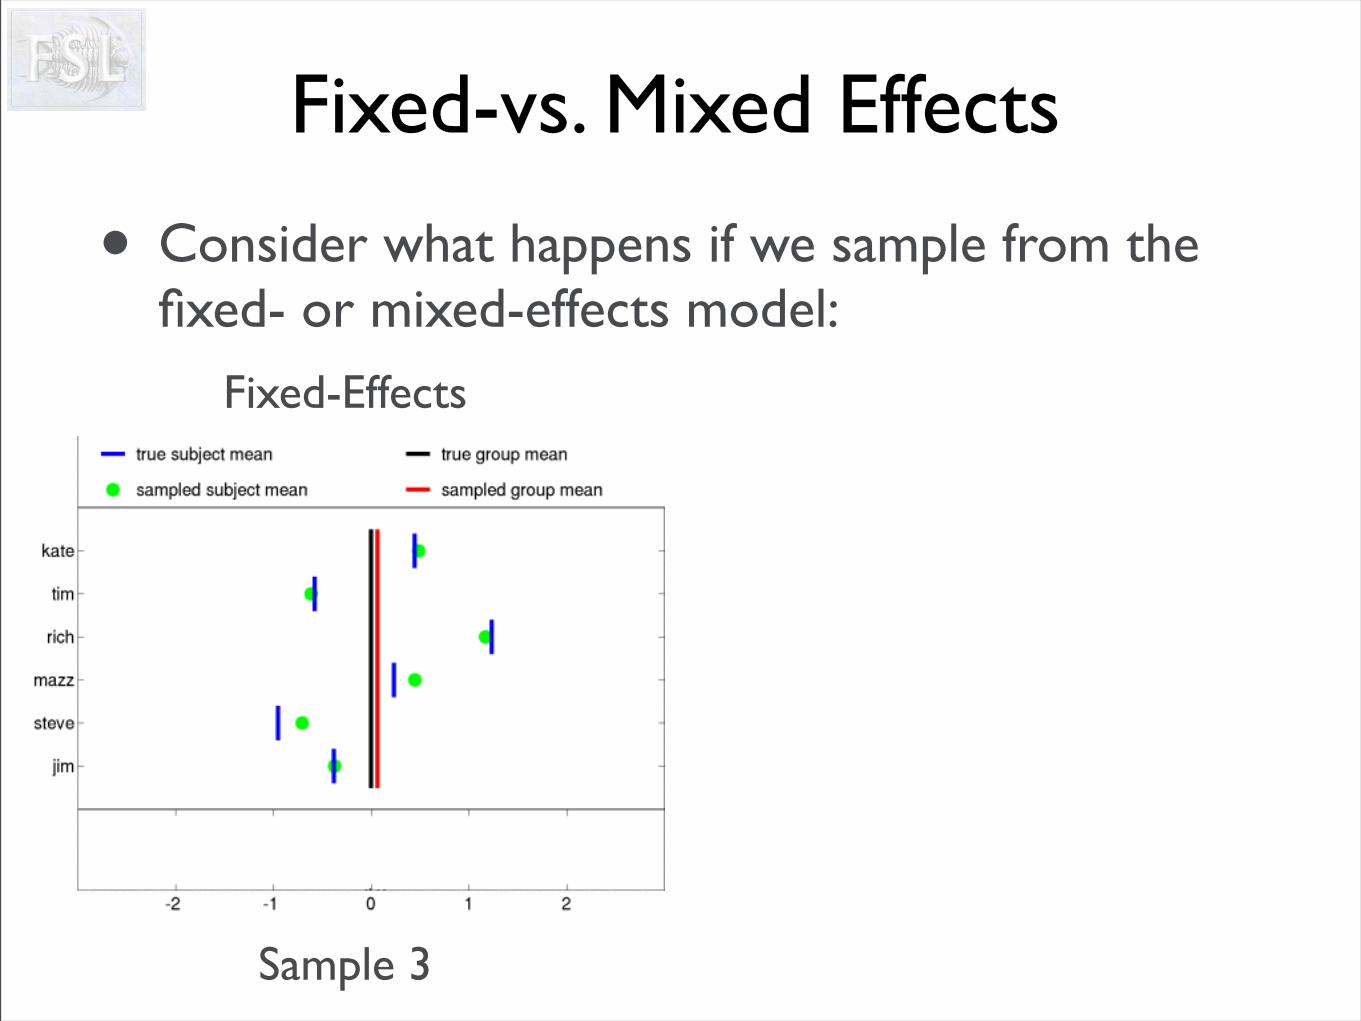
Fixed-vs. Mixed Effects
• Consider what happens if we sample from the fixed- or mixed-effects model:
Fixed-Effects
Sample 3
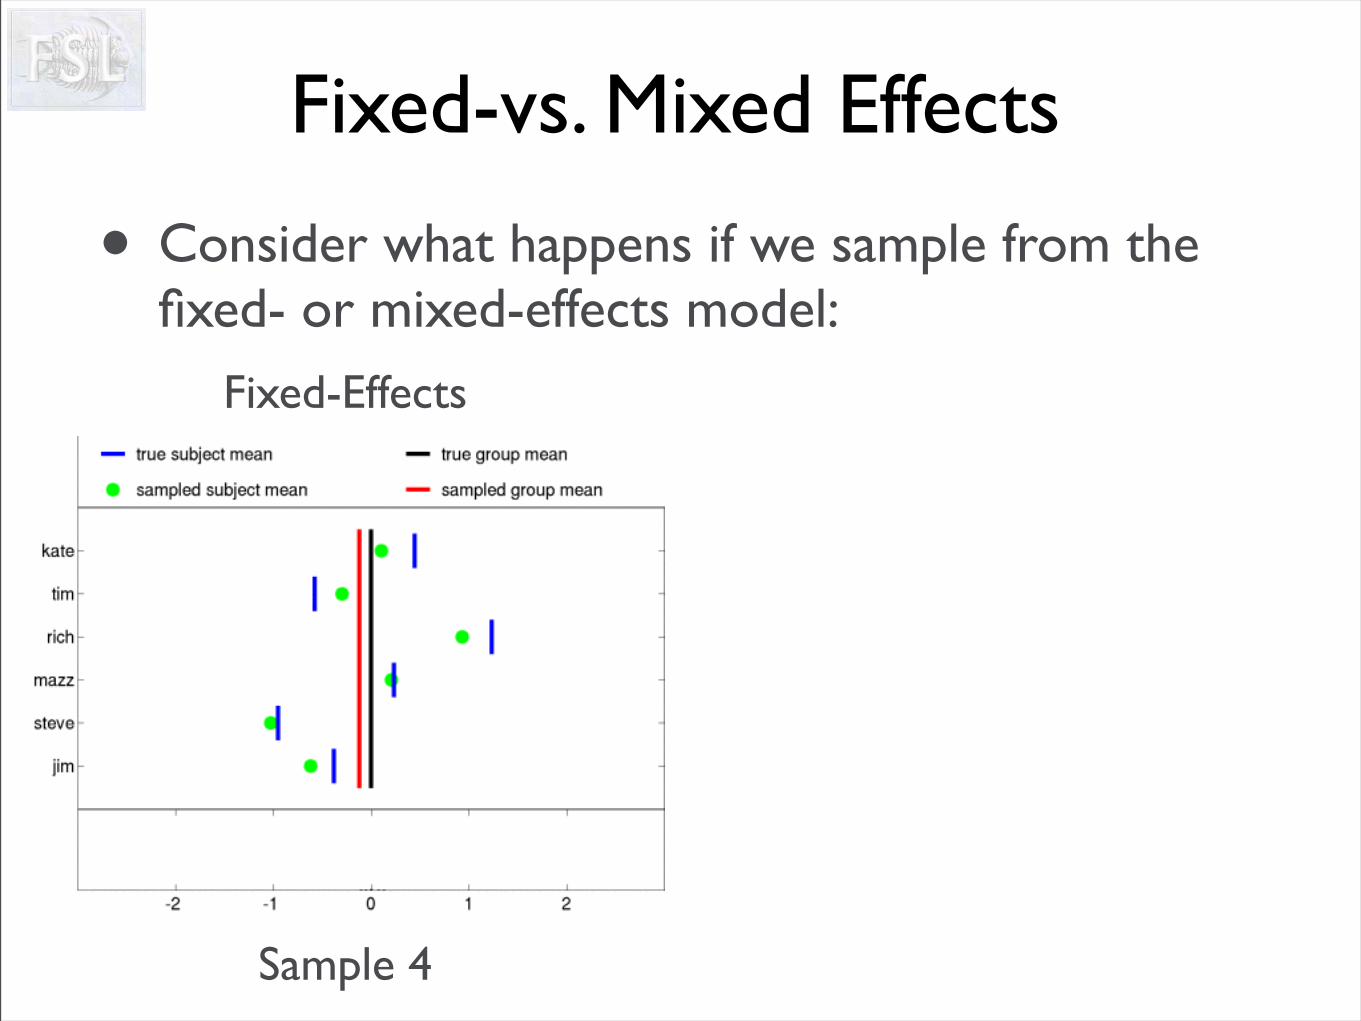
Fixed-vs. Mixed Effects
• Consider what happens if we sample from the fixed- or mixed-effects model:
Fixed-Effects
Sample 4
Fixed-vs. Mixed Effects
• Consider what happens if we sample from the fixed- or mixed-effects model:
Mixed-Effects
Sample 1
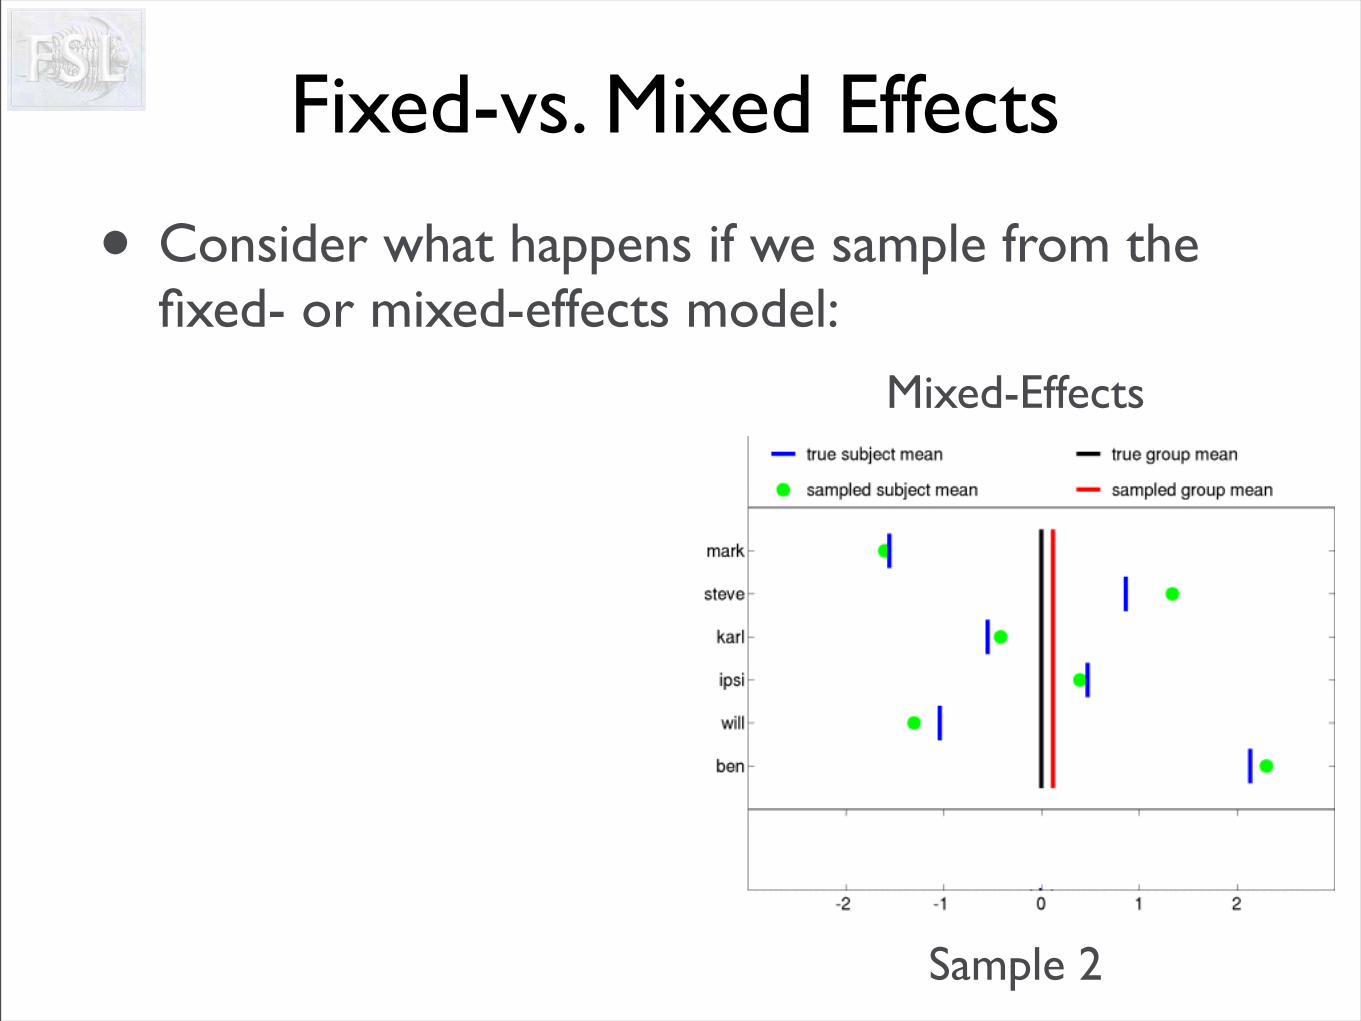
Fixed-vs. Mixed Effects
• Consider what happens if we sample from the fixed- or mixed-effects model:
Mixed-Effects
Sample 2
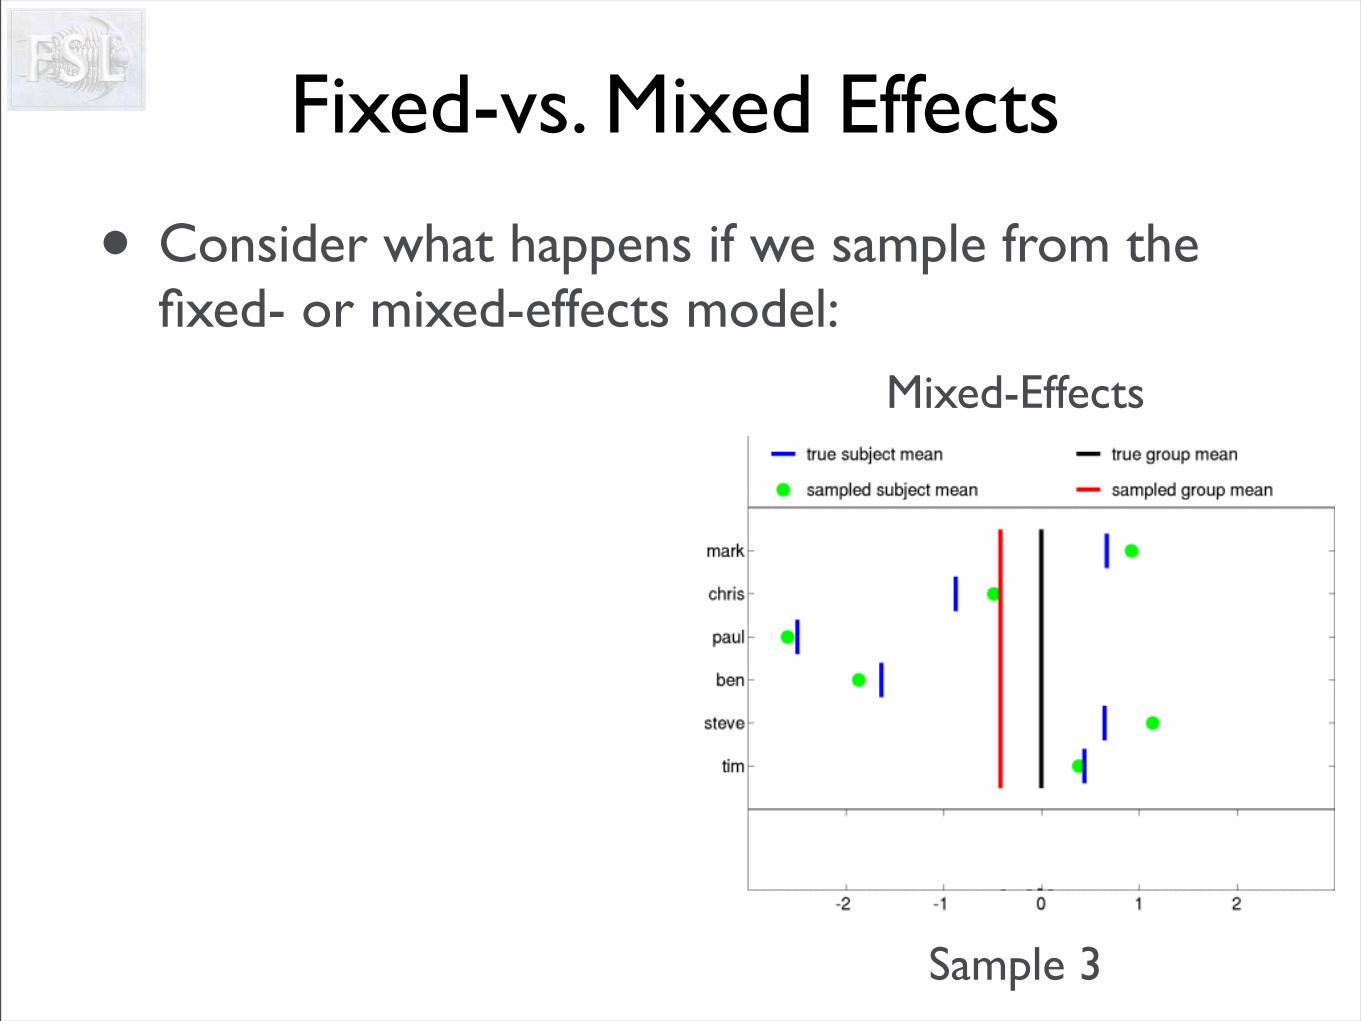
Fixed-vs. Mixed Effects
• Consider what happens if we sample from the fixed- or mixed-effects model:
Mixed-Effects
Sample 3
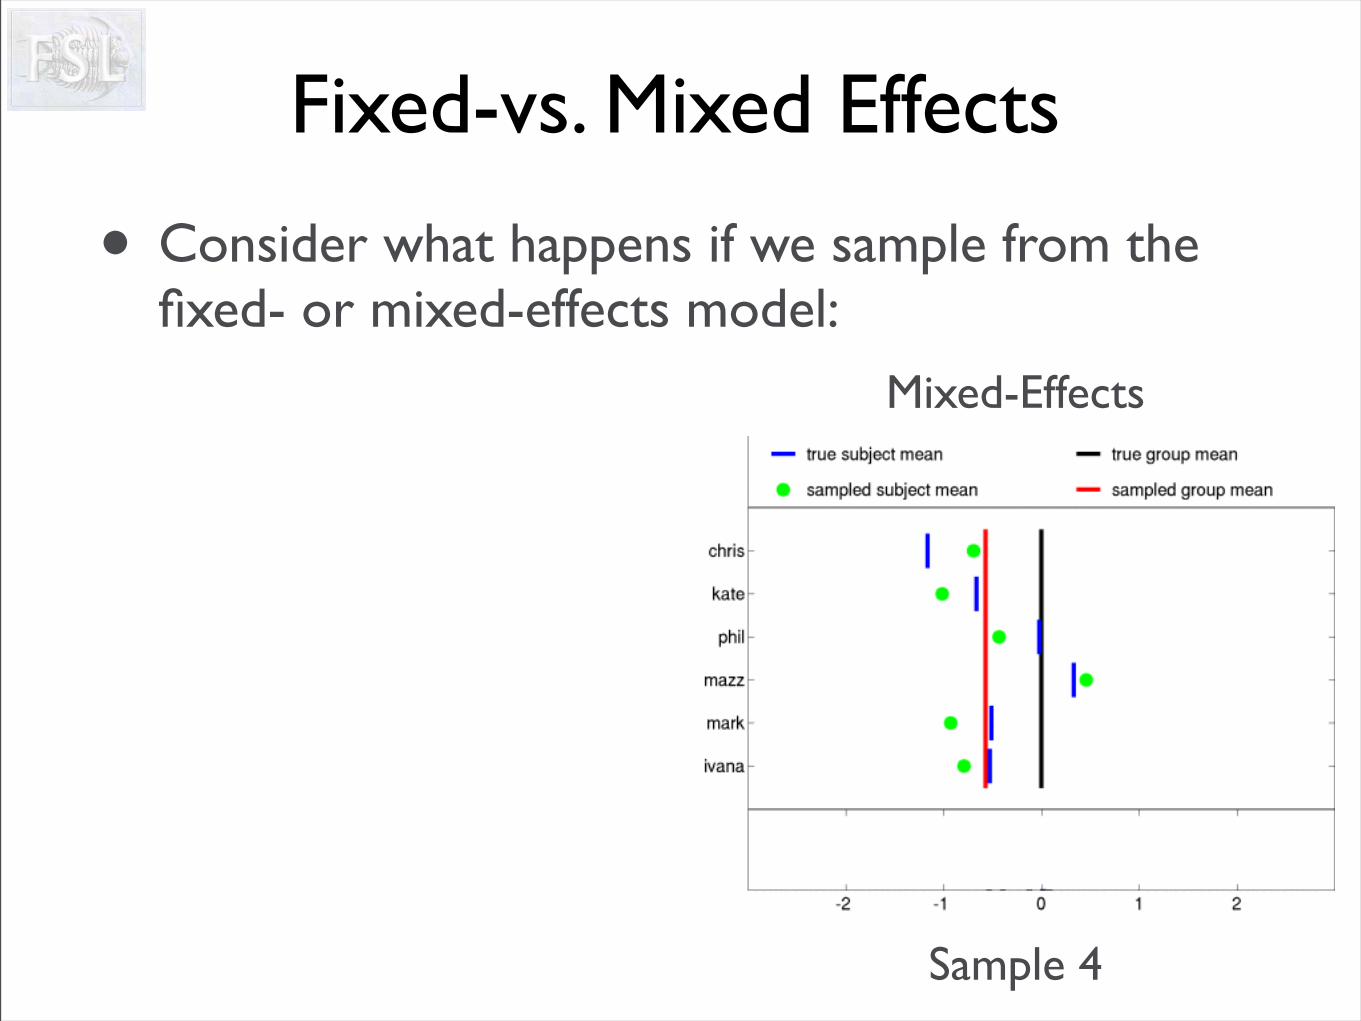
Fixed-vs. Mixed Effects
• Consider what happens if we sample from the fixed- or mixed-effects model:
Mixed-Effects
Sample 4
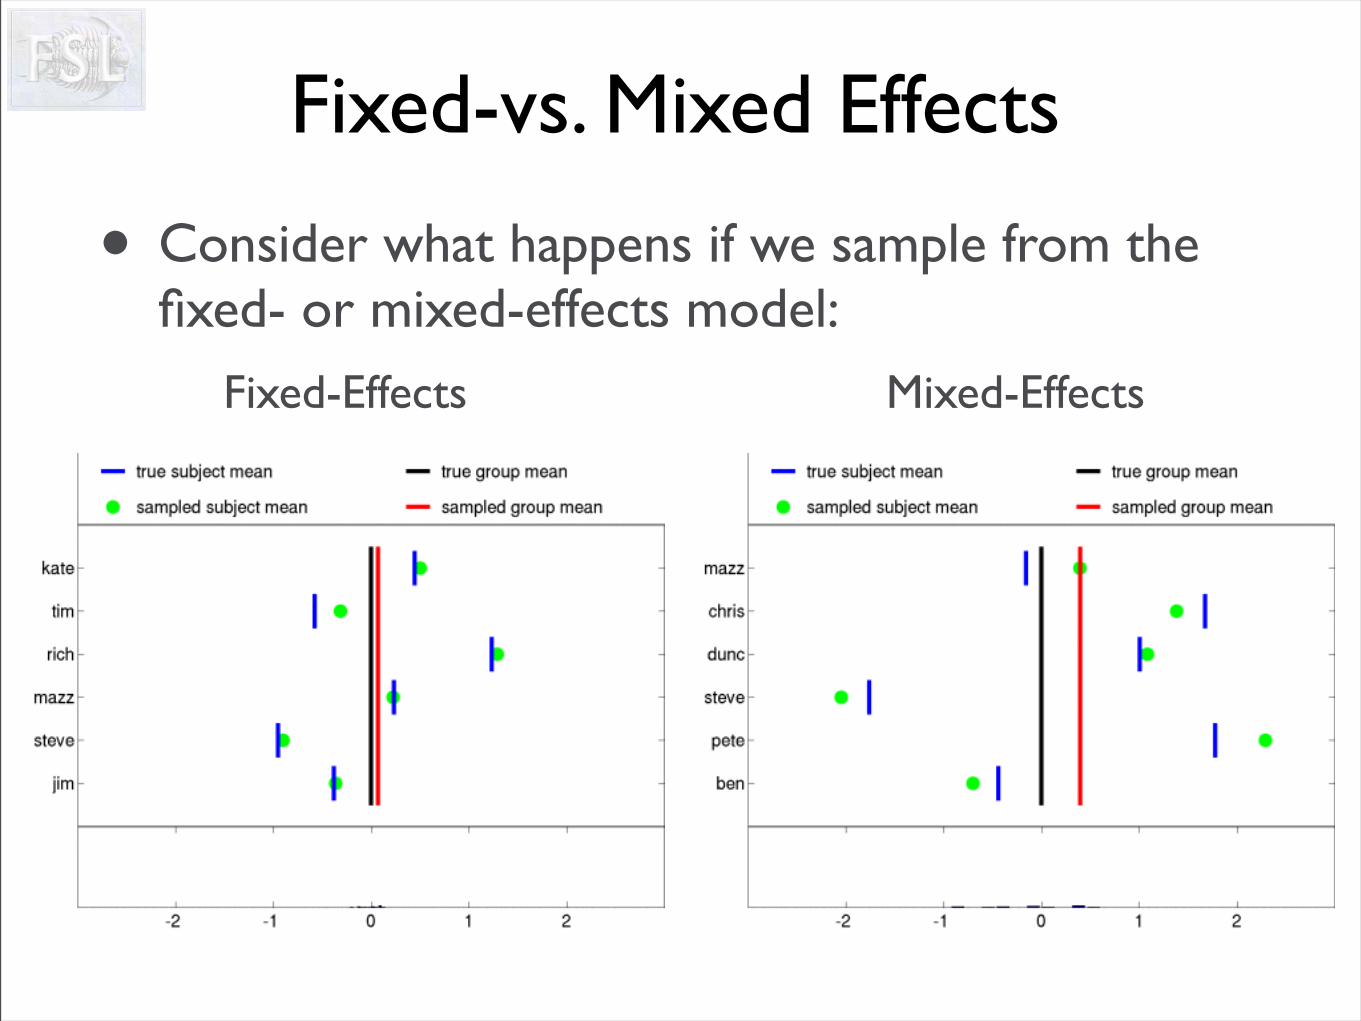
Fixed-vs. Mixed Effects
• Consider what happens if we sample from the fixed- or mixed-effects model:
Mixed-EffectsFixed-Effects
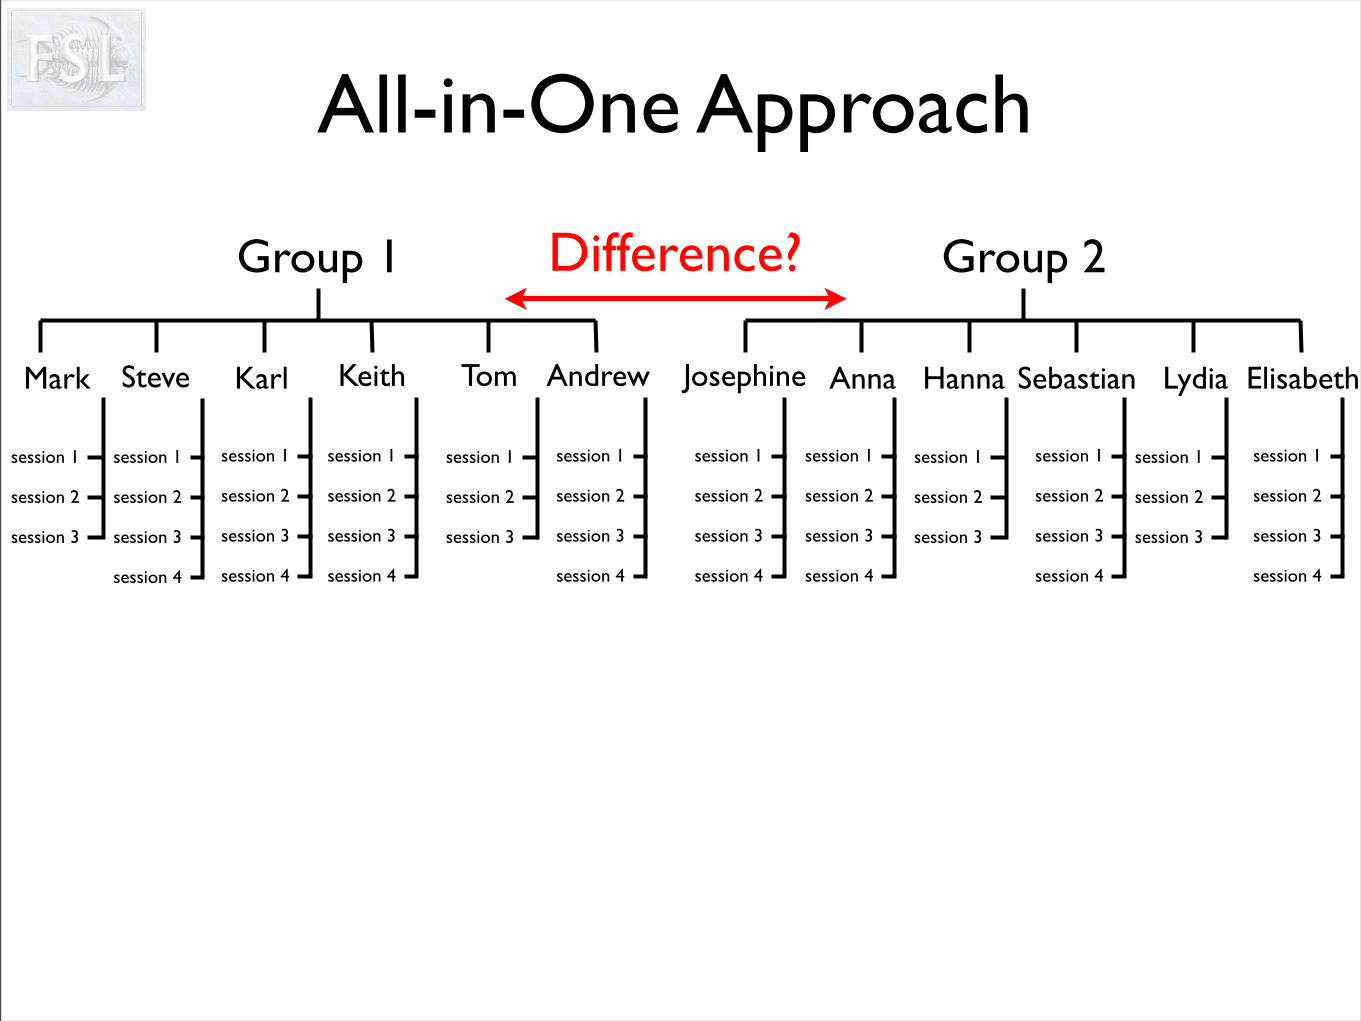
All-in-One Approach
Group 2
HannaJosephine Anna Sebastian Lydia Elisabeth
Group 1
Mark Steve Karl Keith Tom Andrew
session 1
session 2
session 3
session 4
session 1
session 2
session 3
session 1
session 2
session 3
session 4
session 1
session 2
session 3
session 1
session 2
session 3
session 4
session 1
session 2
session 3
session 4
session 1
session 2
session 3
session 4
session 1
session 2
session 3
session 1
session 2
session 3
session 4
session 1
session 2
session 3
session 1
session 2
session 3
session 4
session 1
session 2
session 3
session 4
Difference?
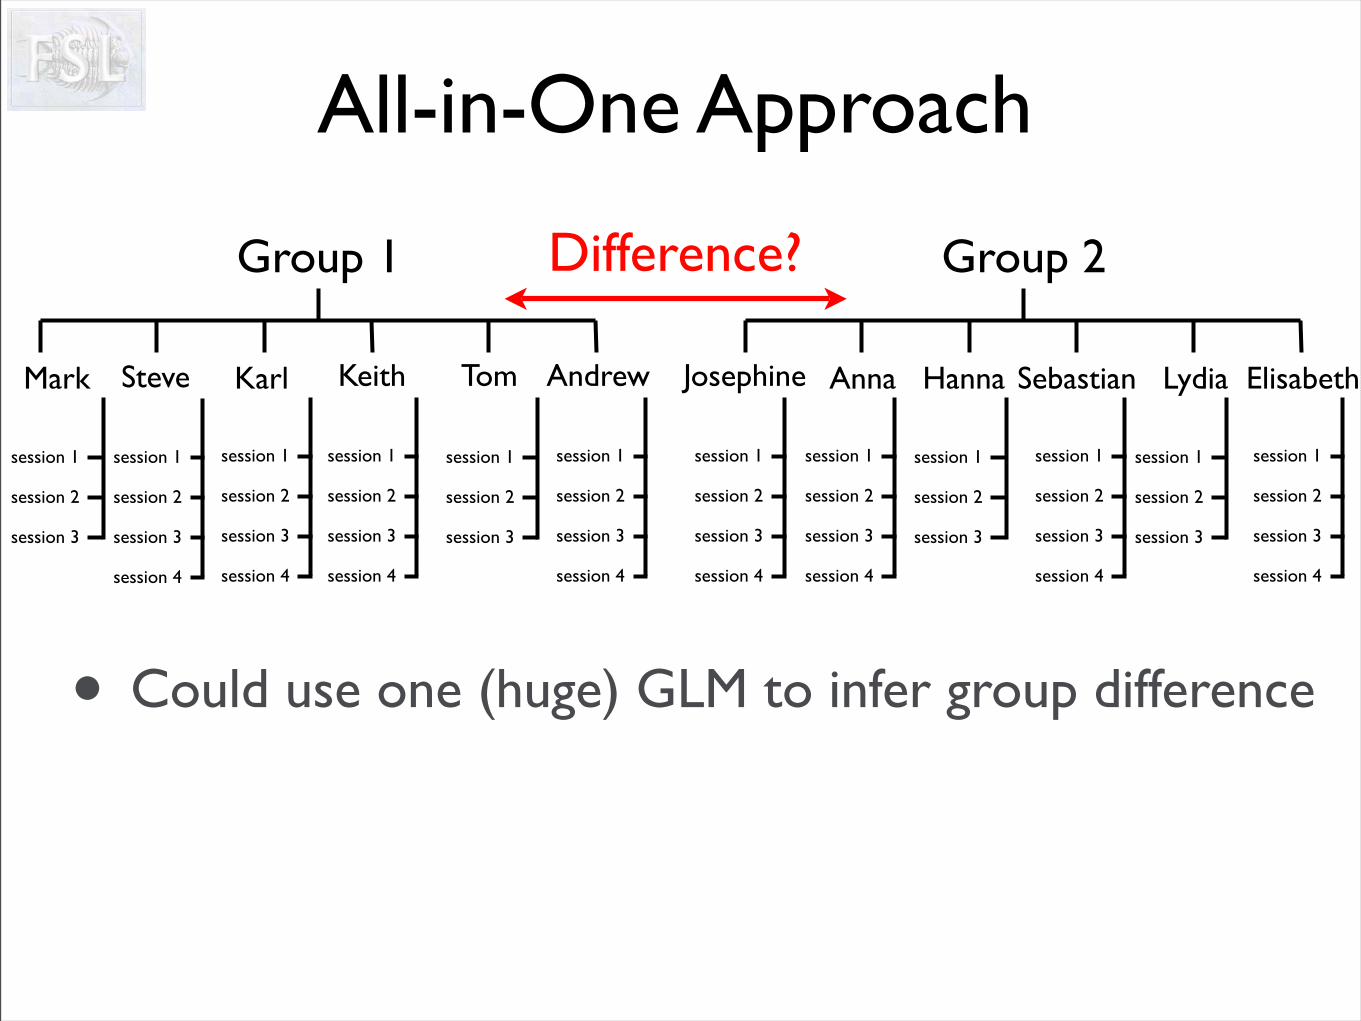
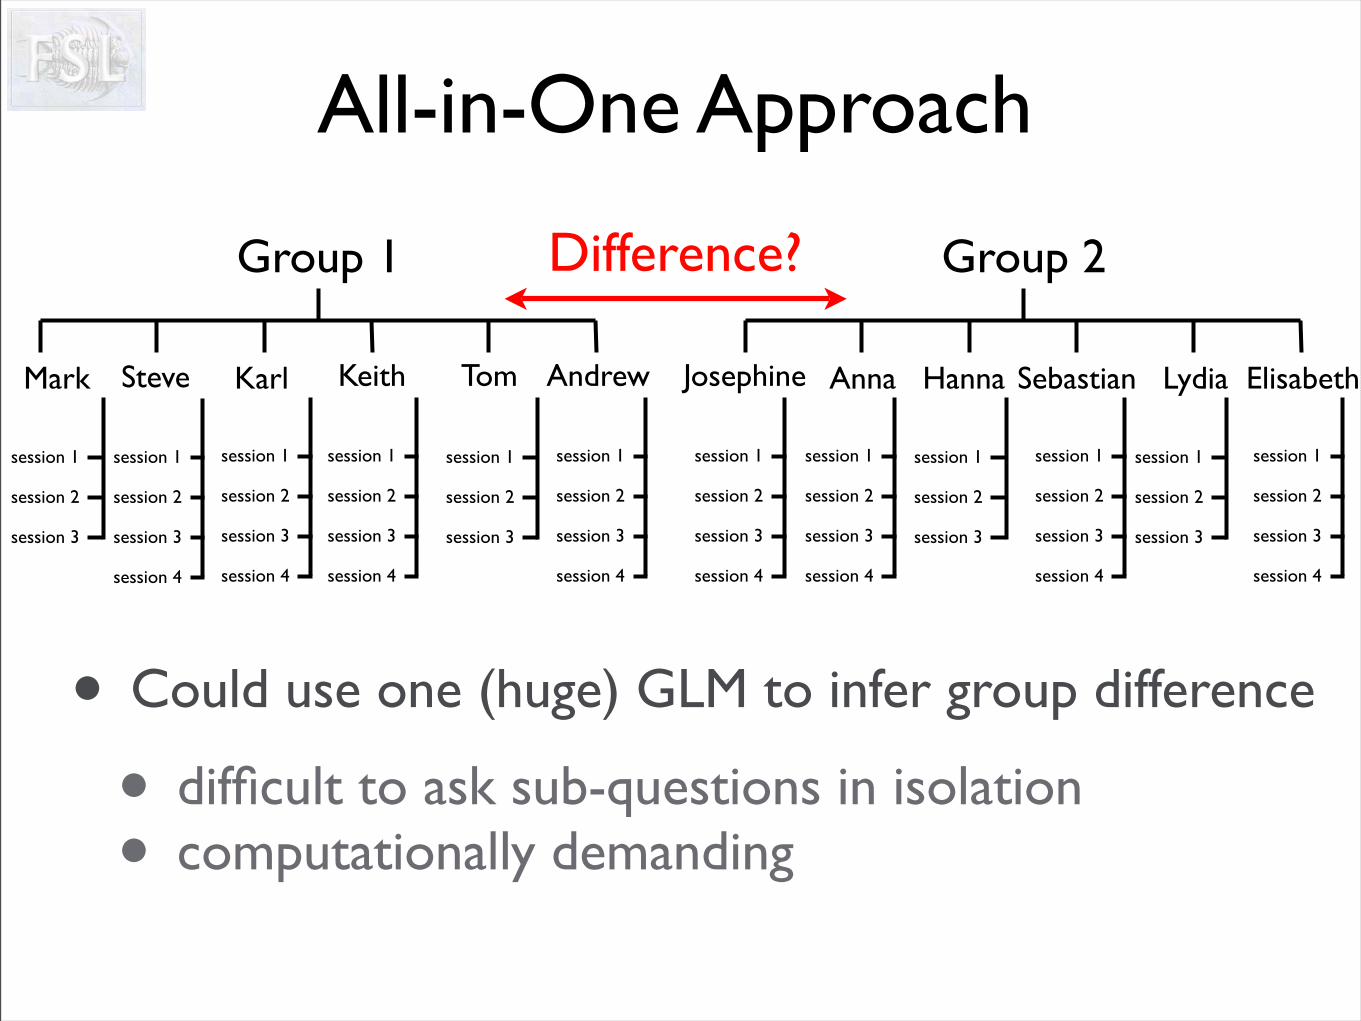
All-in-One Approach
• Could use one (huge) GLM to infer group difference
Group 2
HannaJosephine Anna Sebastian Lydia Elisabeth
Group 1
Mark Steve Karl Keith Tom Andrew
session 1
session 2
session 3
session 4
session 1
session 2
session 3
session 1
session 2
session 3
session 4
session 1
session 2
session 3
session 1
session 2
session 3
session 4
session 1
session 2
session 3
session 4
session 1
session 2
session 3
session 4
session 1
session 2
session 3
session 1
session 2
session 3
session 4
session 1
session 2
session 3
session 1
session 2
session 3
session 4
session 1
session 2
session 3
session 4
Difference?
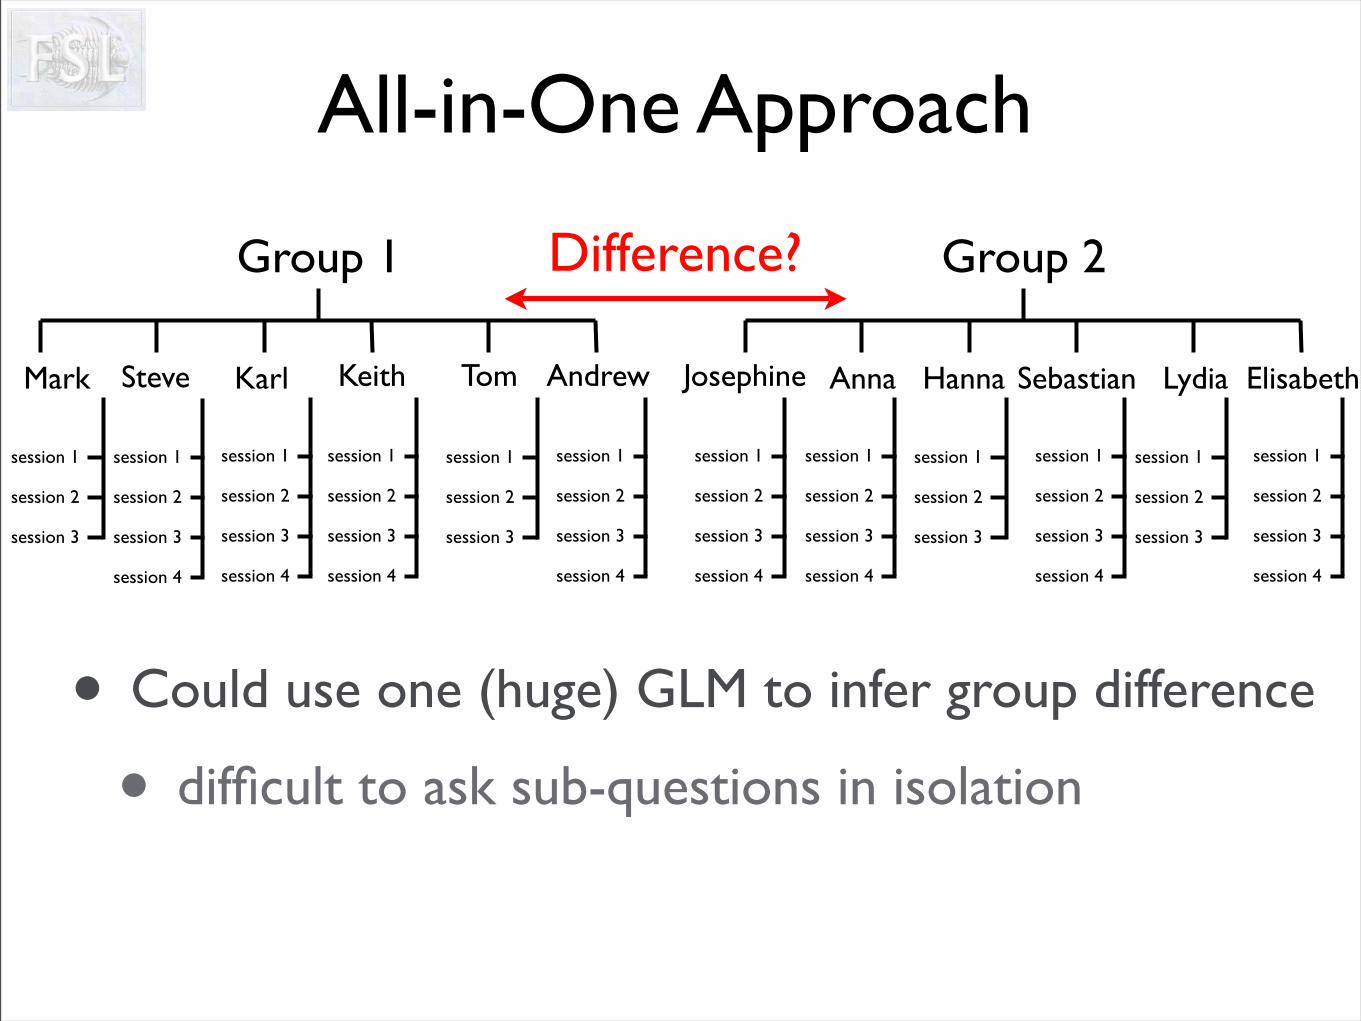
All-in-One Approach
• Could use one (huge) GLM to infer group difference
• difficult to ask sub-questions in isolation
Group 2
HannaJosephine Anna Sebastian Lydia Elisabeth
Group 1
Mark Steve Karl Keith Tom Andrew
session 1
session 2
session 3
session 4
session 1
session 2
session 3
session 1
session 2
session 3
session 4
session 1
session 2
session 3
session 1
session 2
session 3
session 4
session 1
session 2
session 3
session 4
session 1
session 2
session 3
session 4
session 1
session 2
session 3
session 1
session 2
session 3
session 4
session 1
session 2
session 3
session 1
session 2
session 3
session 4
session 1
session 2
session 3
session 4
Difference?
All-in-One Approach
• Could use one (huge) GLM to infer group difference
• difficult to ask sub-questions in isolation• computationally demanding
Group 2
HannaJosephine Anna Sebastian Lydia Elisabeth
Group 1
Mark Steve Karl Keith Tom Andrew
session 1
session 2
session 3
session 4
session 1
session 2
session 3
session 1
session 2
session 3
session 4
session 1
session 2
session 3
session 1
session 2
session 3
session 4
session 1
session 2
session 3
session 4
session 1
session 2
session 3
session 4
session 1
session 2
session 3
session 1
session 2
session 3
session 4
session 1
session 2
session 3
session 1
session 2
session 3
session 4
session 1
session 2
session 3
session 4
Difference?
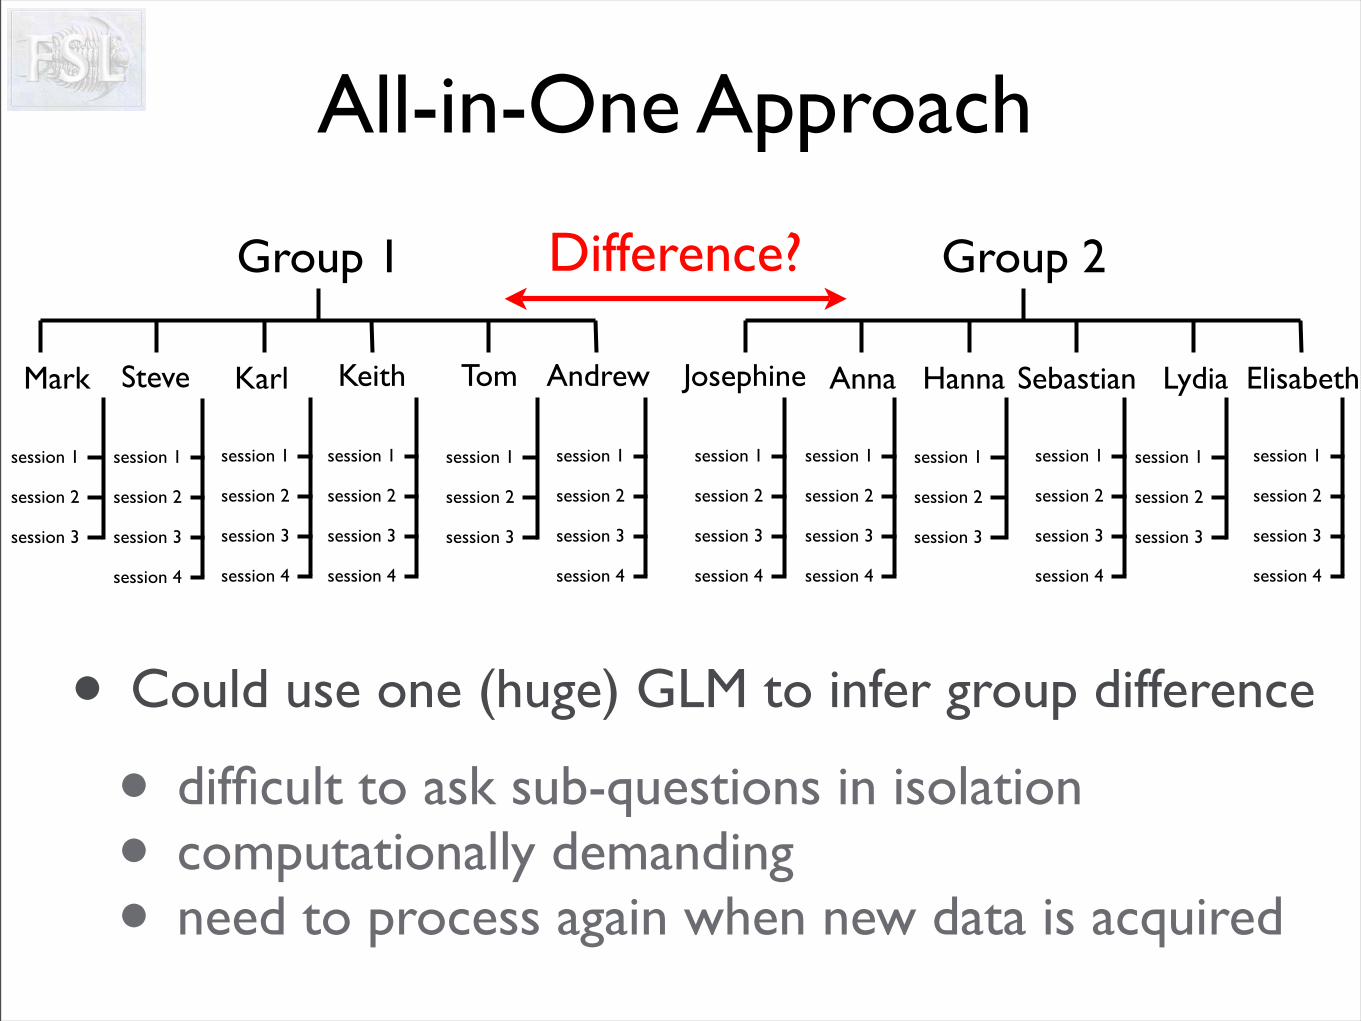
All-in-One Approach
• Could use one (huge) GLM to infer group difference
• difficult to ask sub-questions in isolation• computationally demanding• need to process again when new data is acquired
Group 2
HannaJosephine Anna Sebastian Lydia Elisabeth
Group 1
Mark Steve Karl Keith Tom Andrew
session 1
session 2
session 3
session 4
session 1
session 2
session 3
session 1
session 2
session 3
session 4
session 1
session 2
session 3
session 1
session 2
session 3
session 4
session 1
session 2
session 3
session 4
session 1
session 2
session 3
session 4
session 1
session 2
session 3
session 1
session 2
session 3
session 4
session 1
session 2
session 3
session 1
session 2
session 3
session 4
session 1
session 2
session 3
session 4
Difference?
Summary Statistics Approach
In FEAT estimate levels one stage at a time
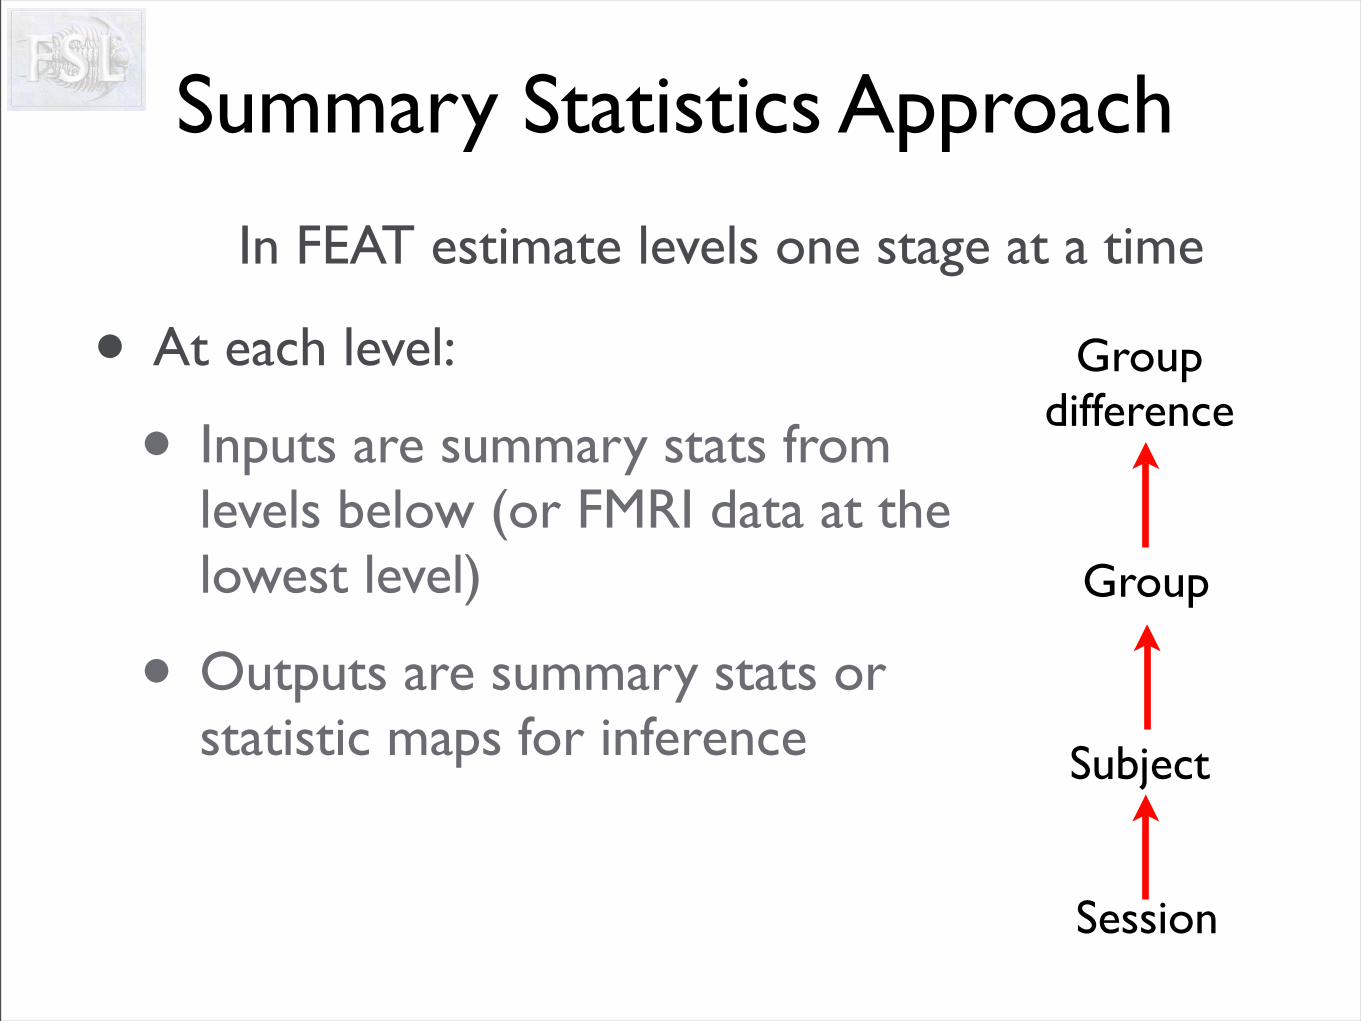
Summary Statistics Approach
• At each level:
• Inputs are summary stats from levels below (or FMRI data at the lowest level)
• Outputs are summary stats or statistic maps for inference
In FEAT estimate levels one stage at a time
Group
Subject
Session
Groupdifference
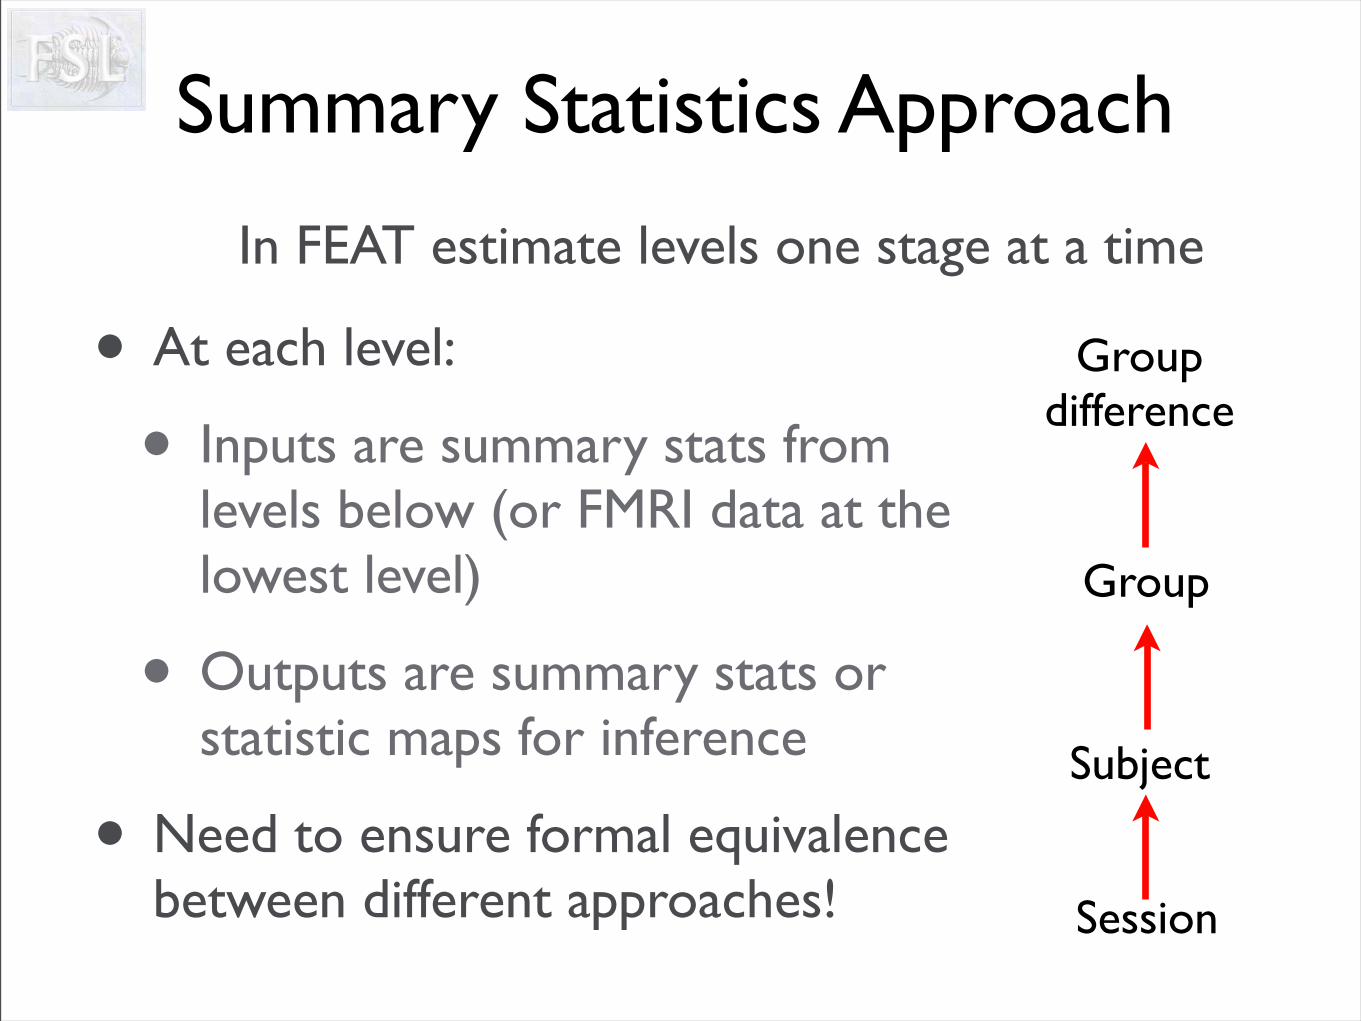
Summary Statistics Approach
• At each level:
• Inputs are summary stats from levels below (or FMRI data at the lowest level)
• Outputs are summary stats or statistic maps for inference
• Need to ensure formal equivalence between different approaches!
In FEAT estimate levels one stage at a time
Group
Subject
Session
Groupdifference
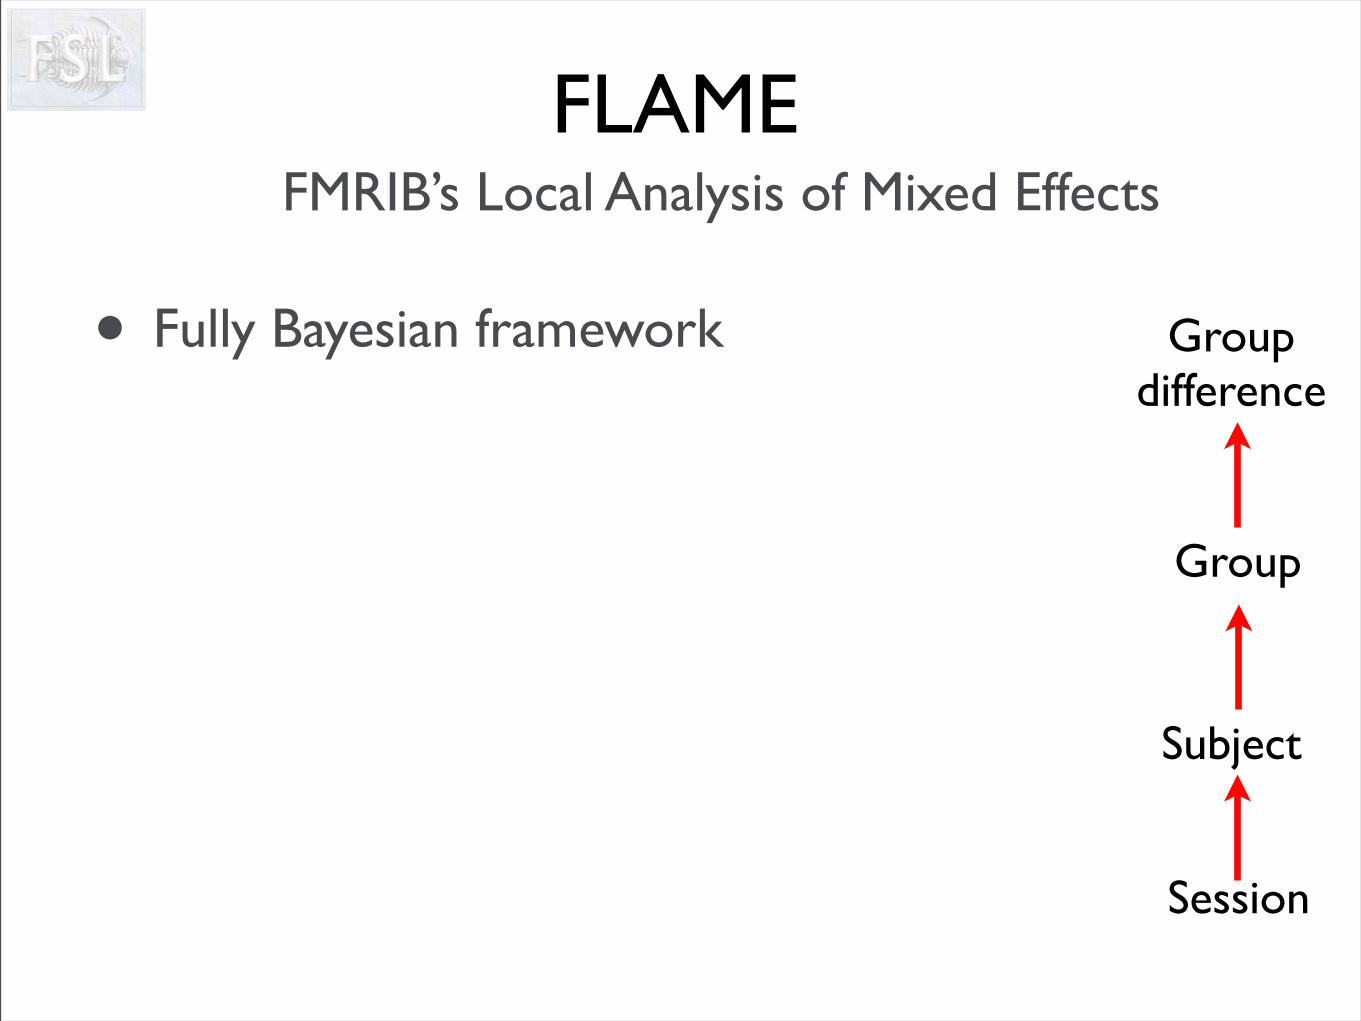
FLAME
• Fully Bayesian framework
FMRIB’s Local Analysis of Mixed Effects
Group
Subject
Session
Groupdifference
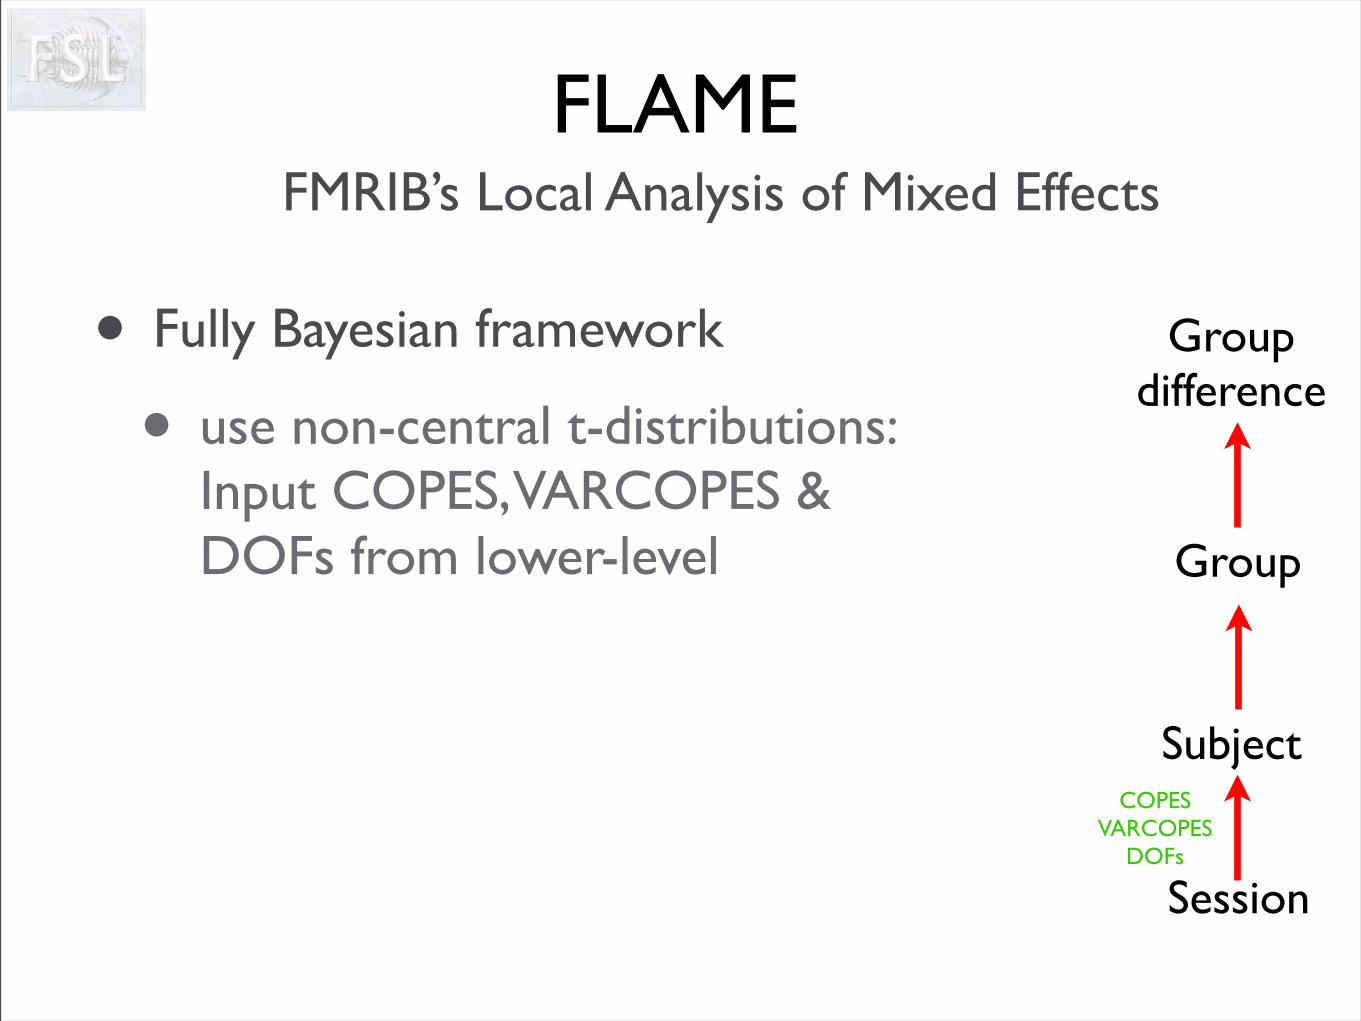
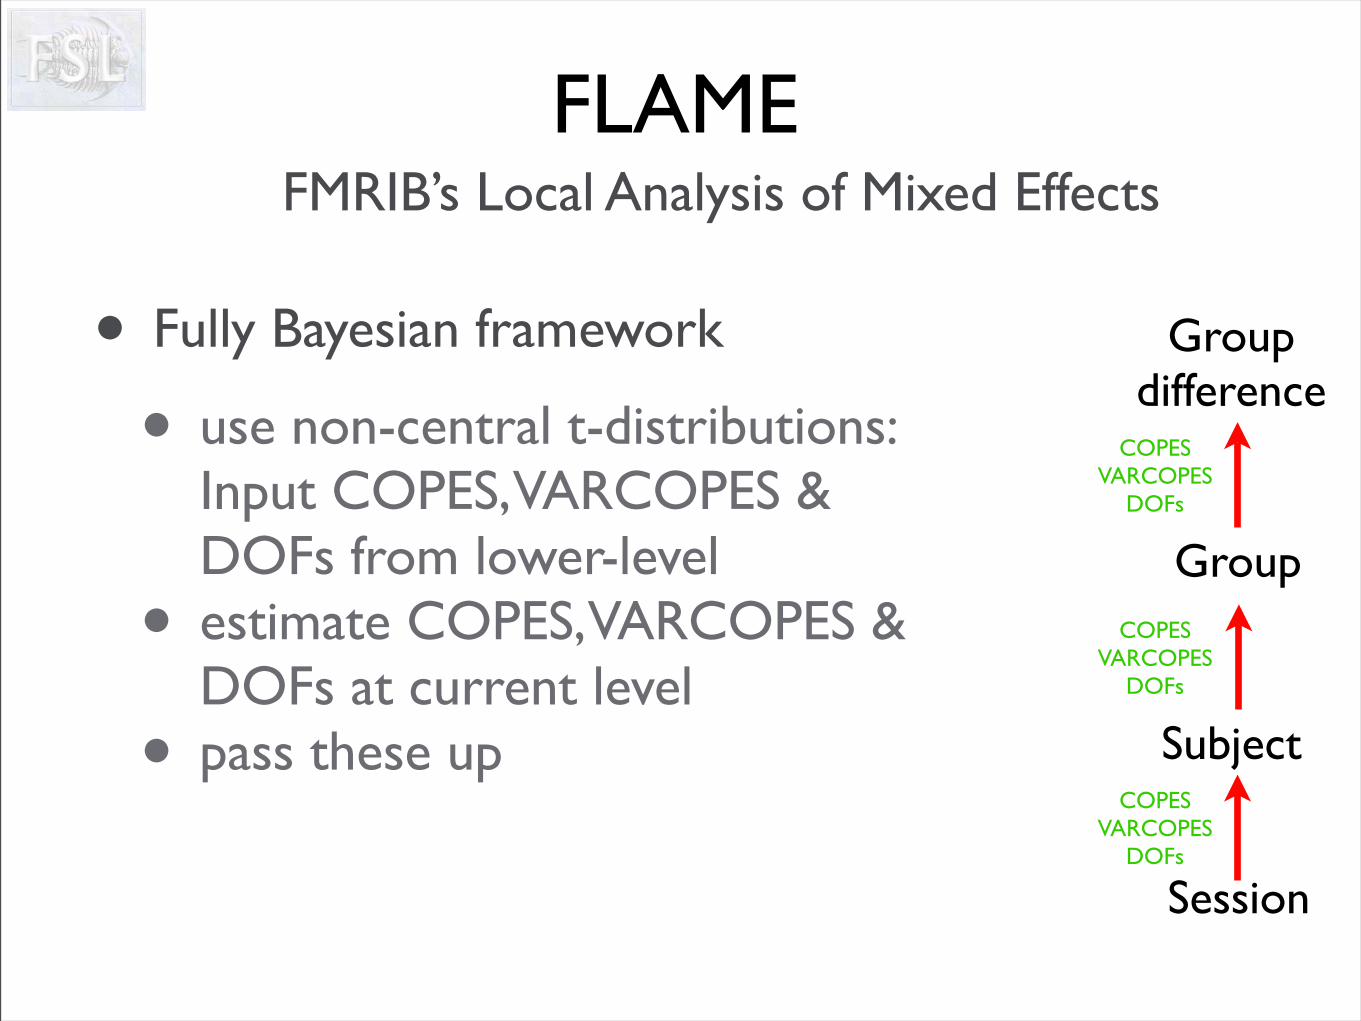
FLAME
• Fully Bayesian framework
• use non-central t-distributions: Input COPES, VARCOPES & DOFs from lower-level
FMRIB’s Local Analysis of Mixed Effects
Group
Subject
Session
Groupdifference
COPESVARCOPES
DOFs
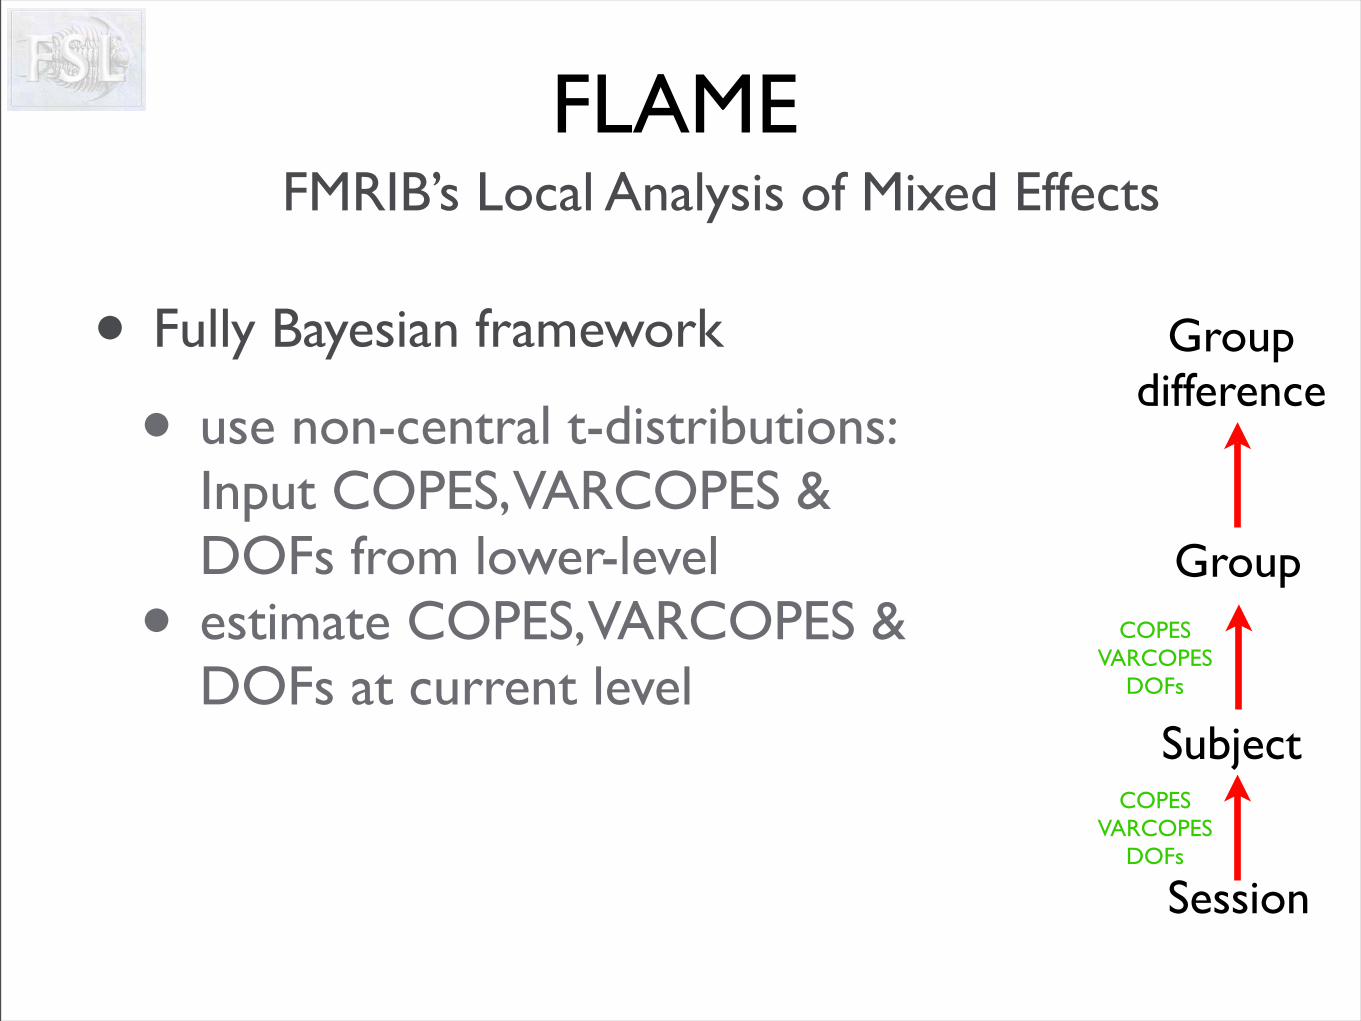
FLAME
• Fully Bayesian framework
• use non-central t-distributions: Input COPES, VARCOPES & DOFs from lower-level
• estimate COPES, VARCOPES & DOFs at current level
FMRIB’s Local Analysis of Mixed Effects
Group
Subject
Session
Groupdifference
COPESVARCOPES
DOFs
COPESVARCOPES
DOFs
FLAME
• Fully Bayesian framework
• use non-central t-distributions: Input COPES, VARCOPES & DOFs from lower-level
• estimate COPES, VARCOPES & DOFs at current level
• pass these up
FMRIB’s Local Analysis of Mixed Effects
Group
Subject
Session
Groupdifference
COPESVARCOPES
DOFs
COPESVARCOPES
DOFs
COPESVARCOPES
DOFs
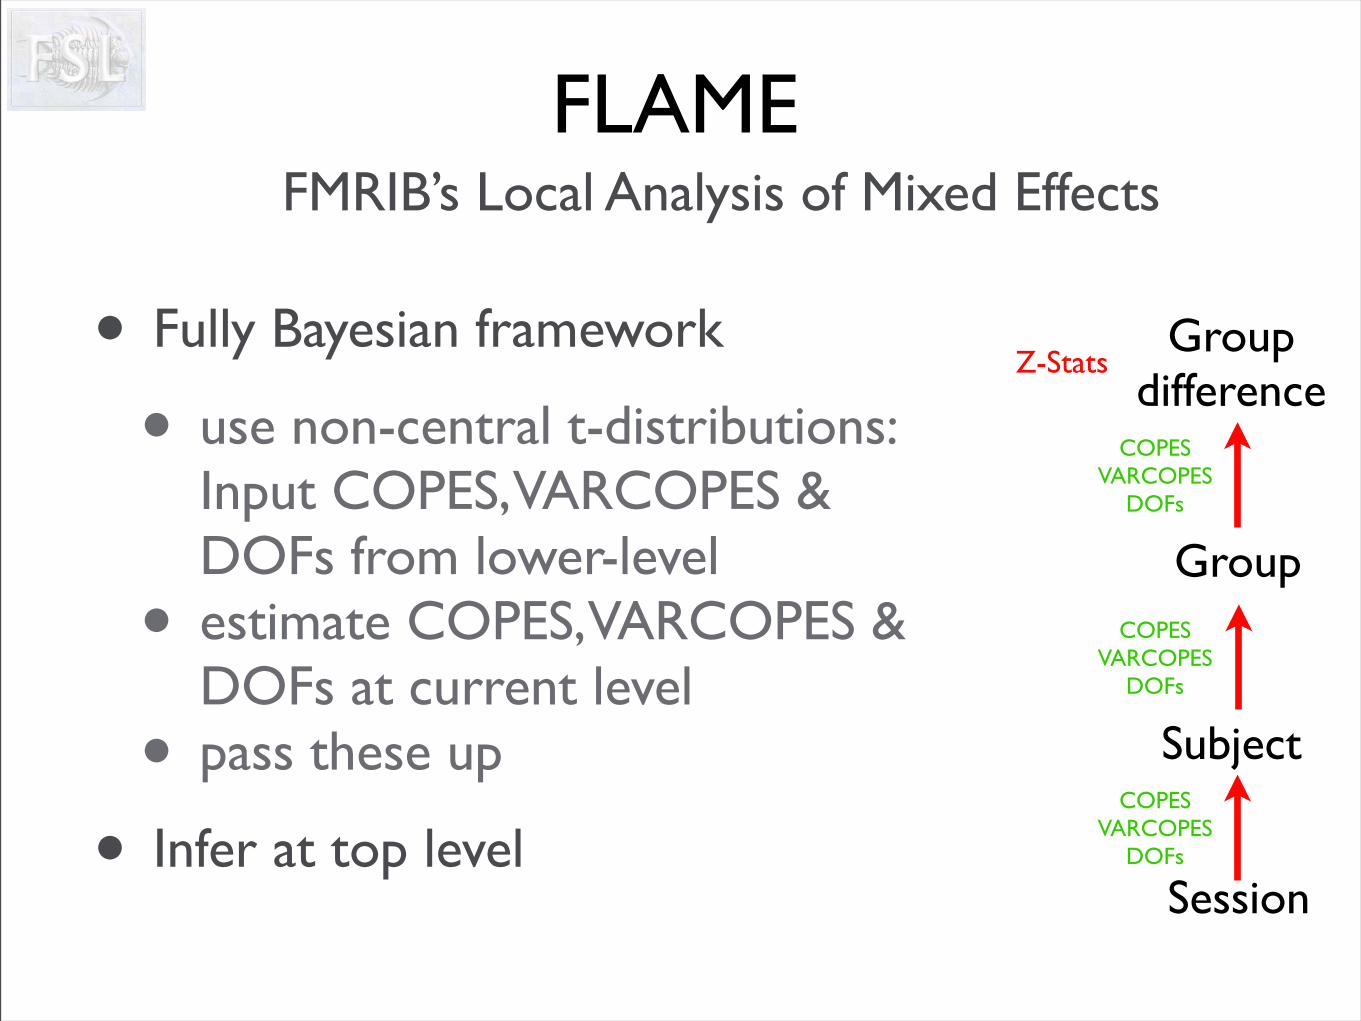
FLAME
• Fully Bayesian framework
• use non-central t-distributions: Input COPES, VARCOPES & DOFs from lower-level
• estimate COPES, VARCOPES & DOFs at current level
• pass these up
• Infer at top level
FMRIB’s Local Analysis of Mixed Effects
Group
Subject
Session
Groupdifference
COPESVARCOPES
DOFs
Z-Stats
COPESVARCOPES
DOFs
COPESVARCOPES
DOFs
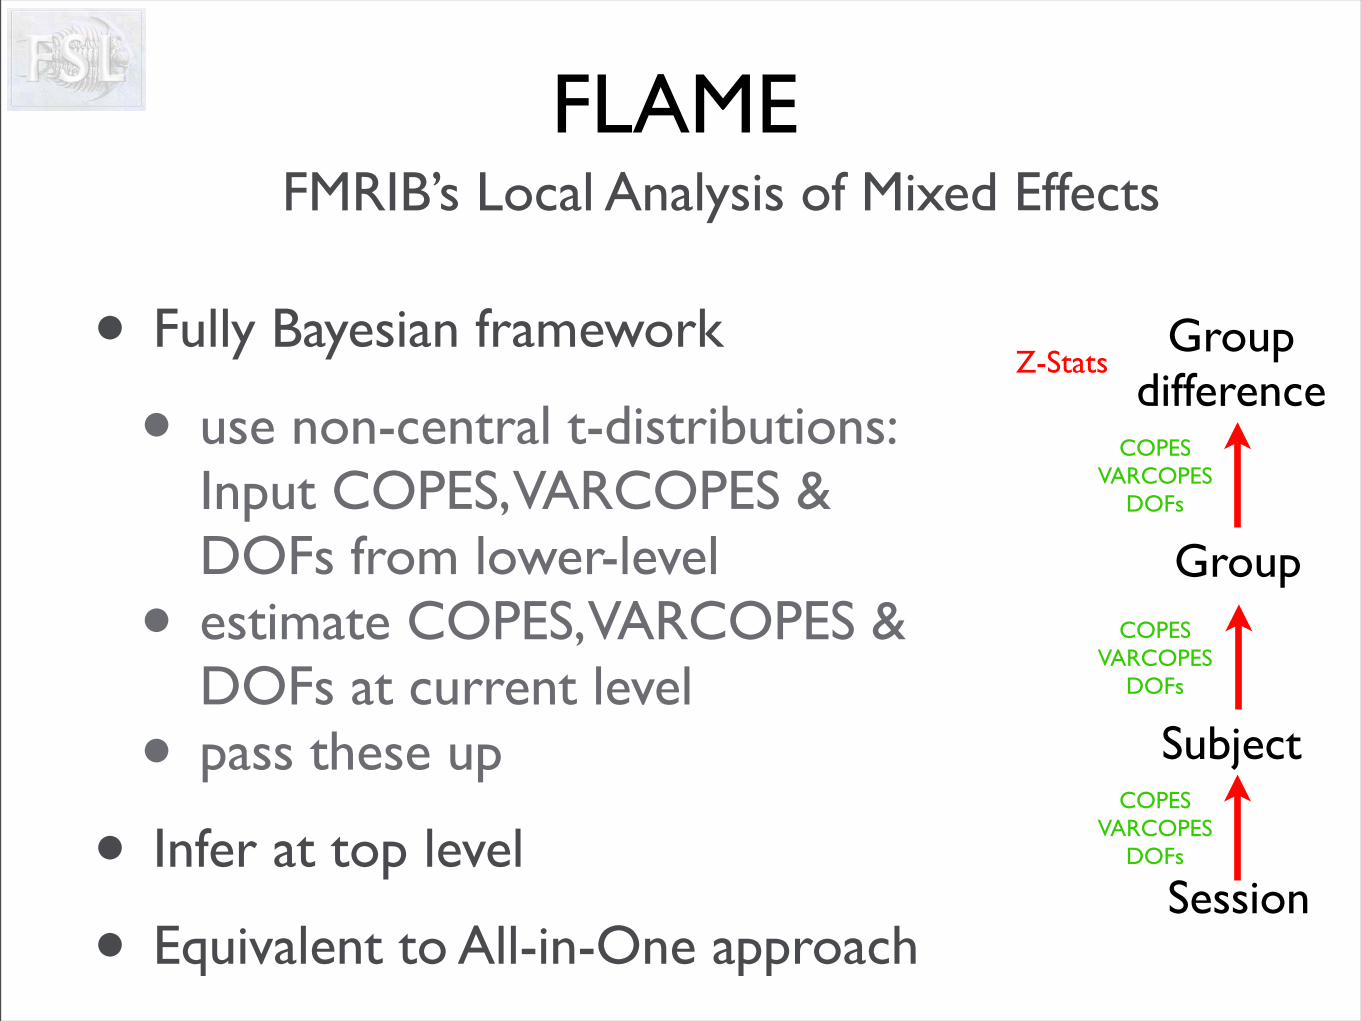
FLAME
• Fully Bayesian framework
• use non-central t-distributions: Input COPES, VARCOPES & DOFs from lower-level
• estimate COPES, VARCOPES & DOFs at current level
• pass these up
• Infer at top level
• Equivalent to All-in-One approach
FMRIB’s Local Analysis of Mixed Effects
Group
Subject
Session
Groupdifference
COPESVARCOPES
DOFs
Z-Stats
COPESVARCOPES
DOFs
COPESVARCOPES
DOFs
FLAME Inference
• uses 2-stage approach:
FLAME Inference
• uses 2-stage approach:
1. fast approximation for all voxels (using marginal variance MAP estimates)
FLAME Inference
• uses 2-stage approach:
1. fast approximation for all voxels (using marginal variance MAP estimates)
2. more accurate (but slower) MCMC sampling technique, followed by parametric approximation (BIDET)
jacklancaster
Sticky Note
MCMC - Markov Chain Monte Carlo
jacklancaster
Sticky Note
Baysian Inference with Distribution Estimation
FLAME Inference
• uses 2-stage approach:
1. fast approximation for all voxels (using marginal variance MAP estimates)
2. more accurate (but slower) MCMC sampling technique, followed by parametric approximation (BIDET)
• stage 1 at intermediate levels of the hierachy
FLAME Inference
• uses 2-stage approach:
1. fast approximation for all voxels (using marginal variance MAP estimates)
2. more accurate (but slower) MCMC sampling technique, followed by parametric approximation (BIDET)
• stage 1 at intermediate levels of the hierachy
• stage 1 & 2 at top level: stage 1 for all voxels, stage 2 for voxels close to threshold
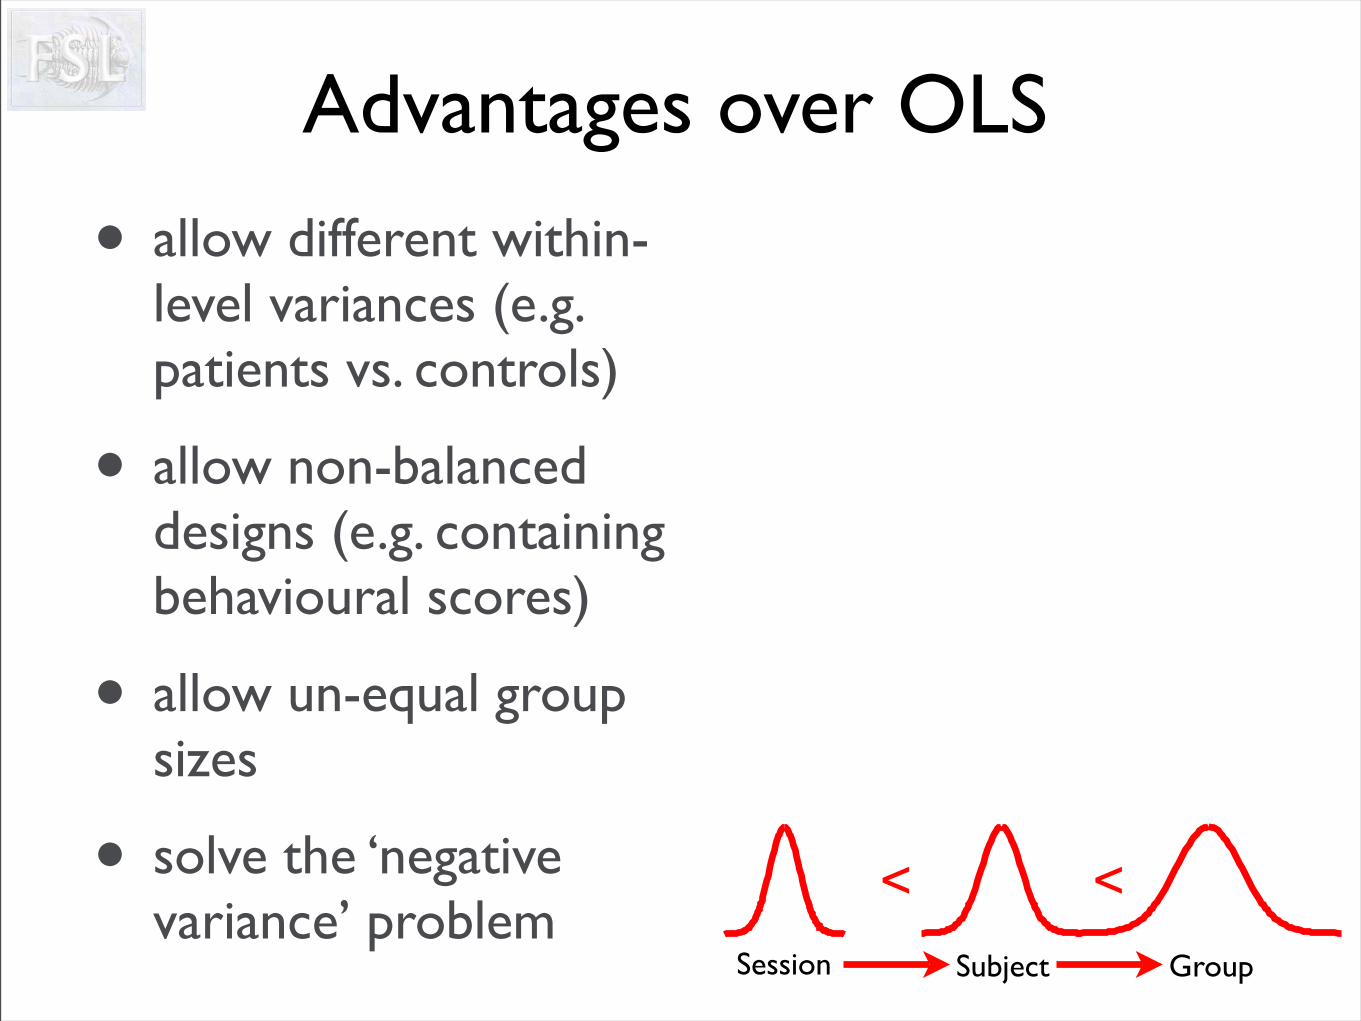
Advantages over OLS
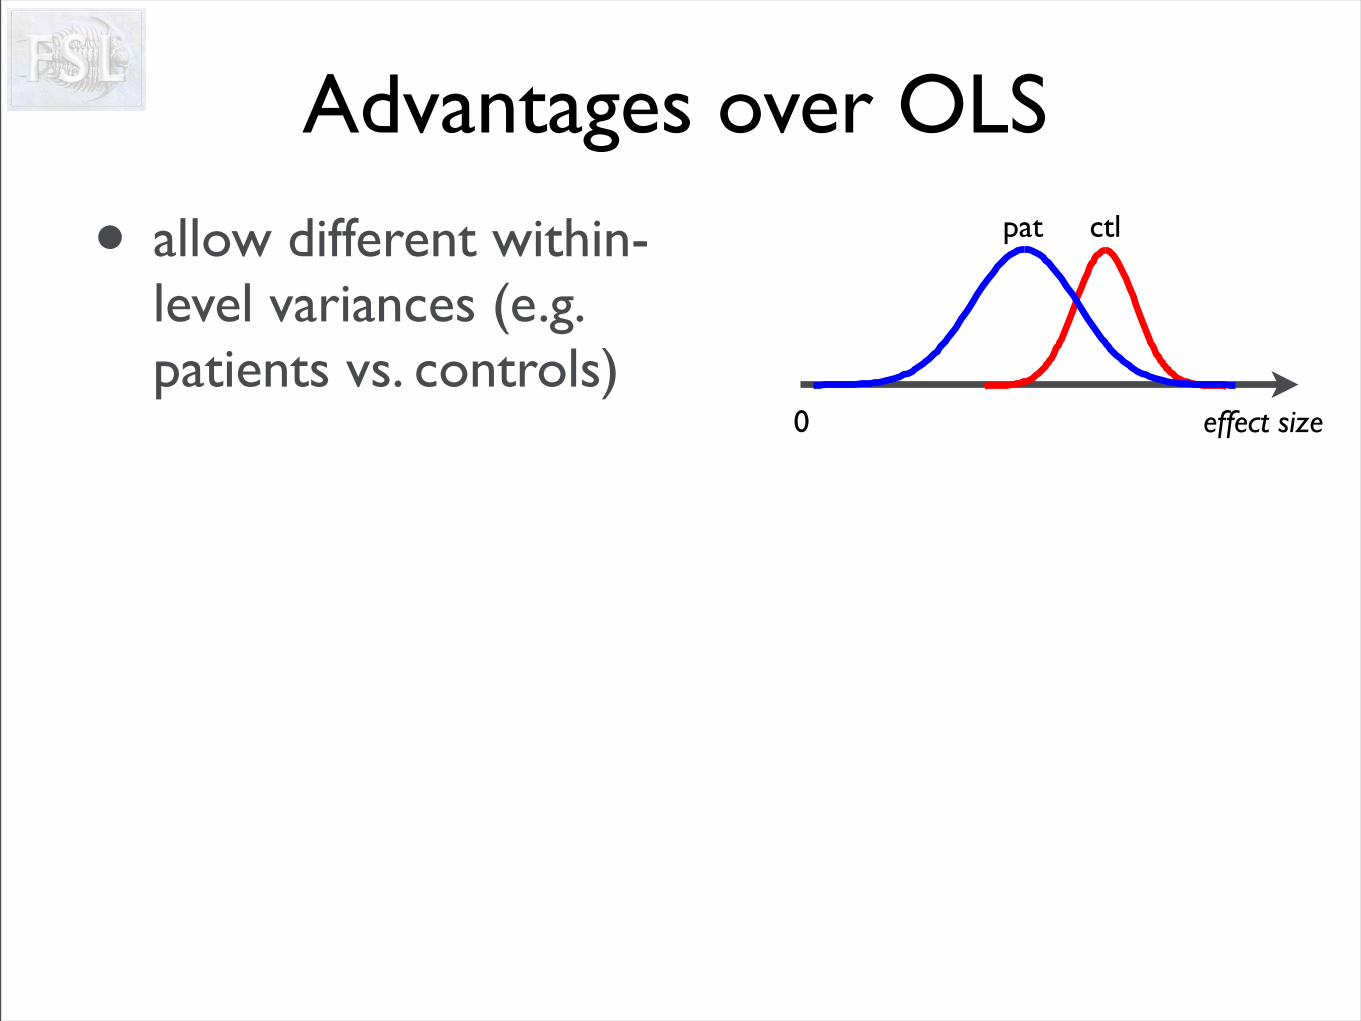
Advantages over OLS
• allow different within-level variances (e.g. patients vs. controls)
0 effect size
pat ctl
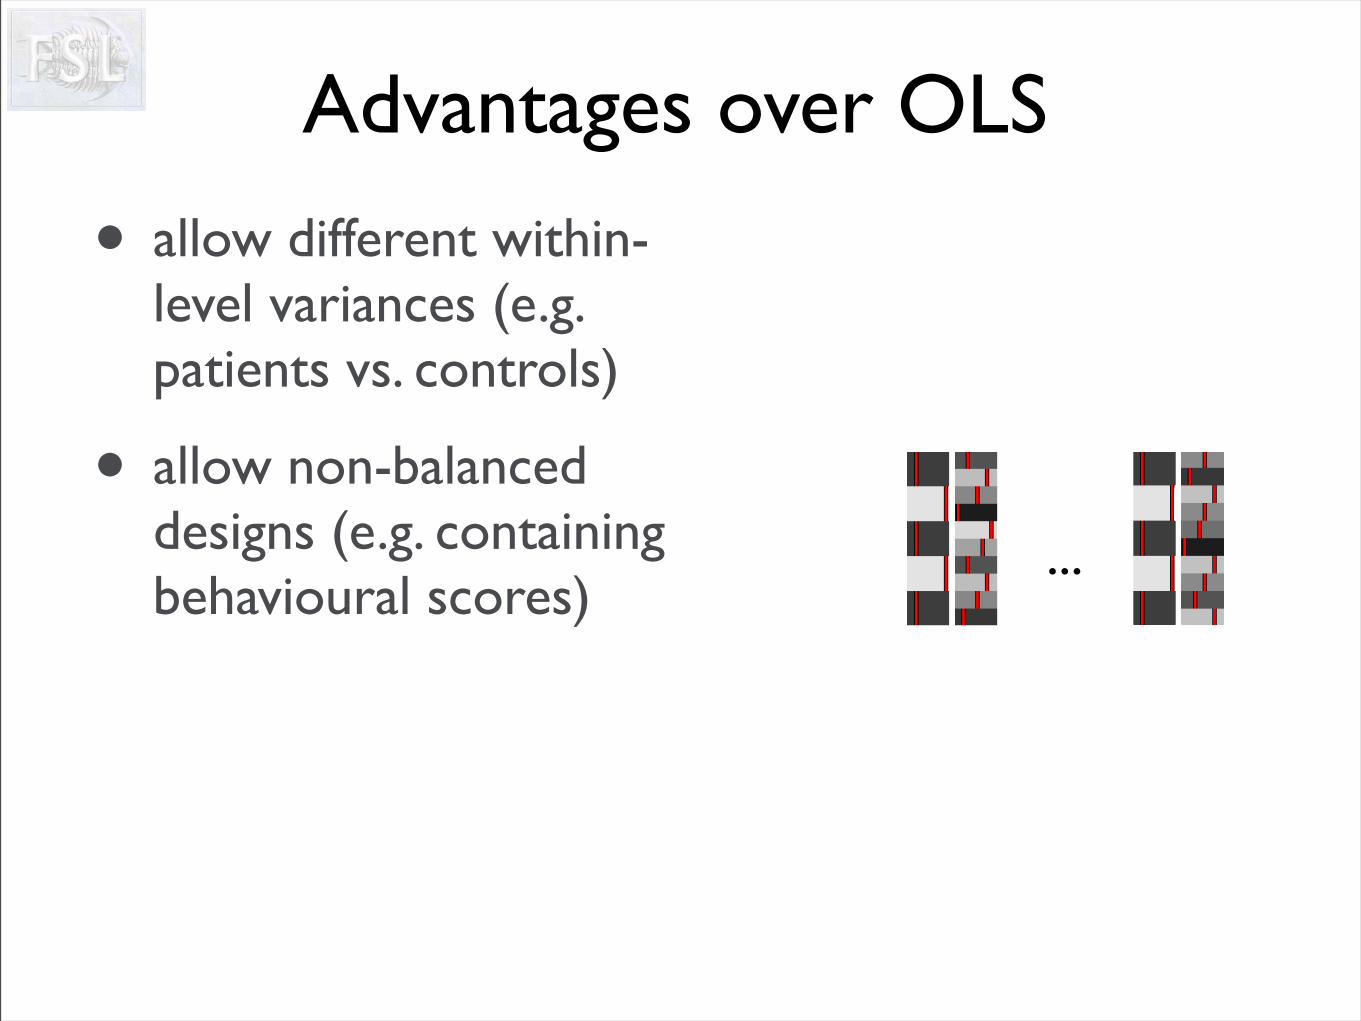
Advantages over OLS
• allow different within-level variances (e.g. patients vs. controls)
• allow non-balanced designs (e.g. containing behavioural scores)
...
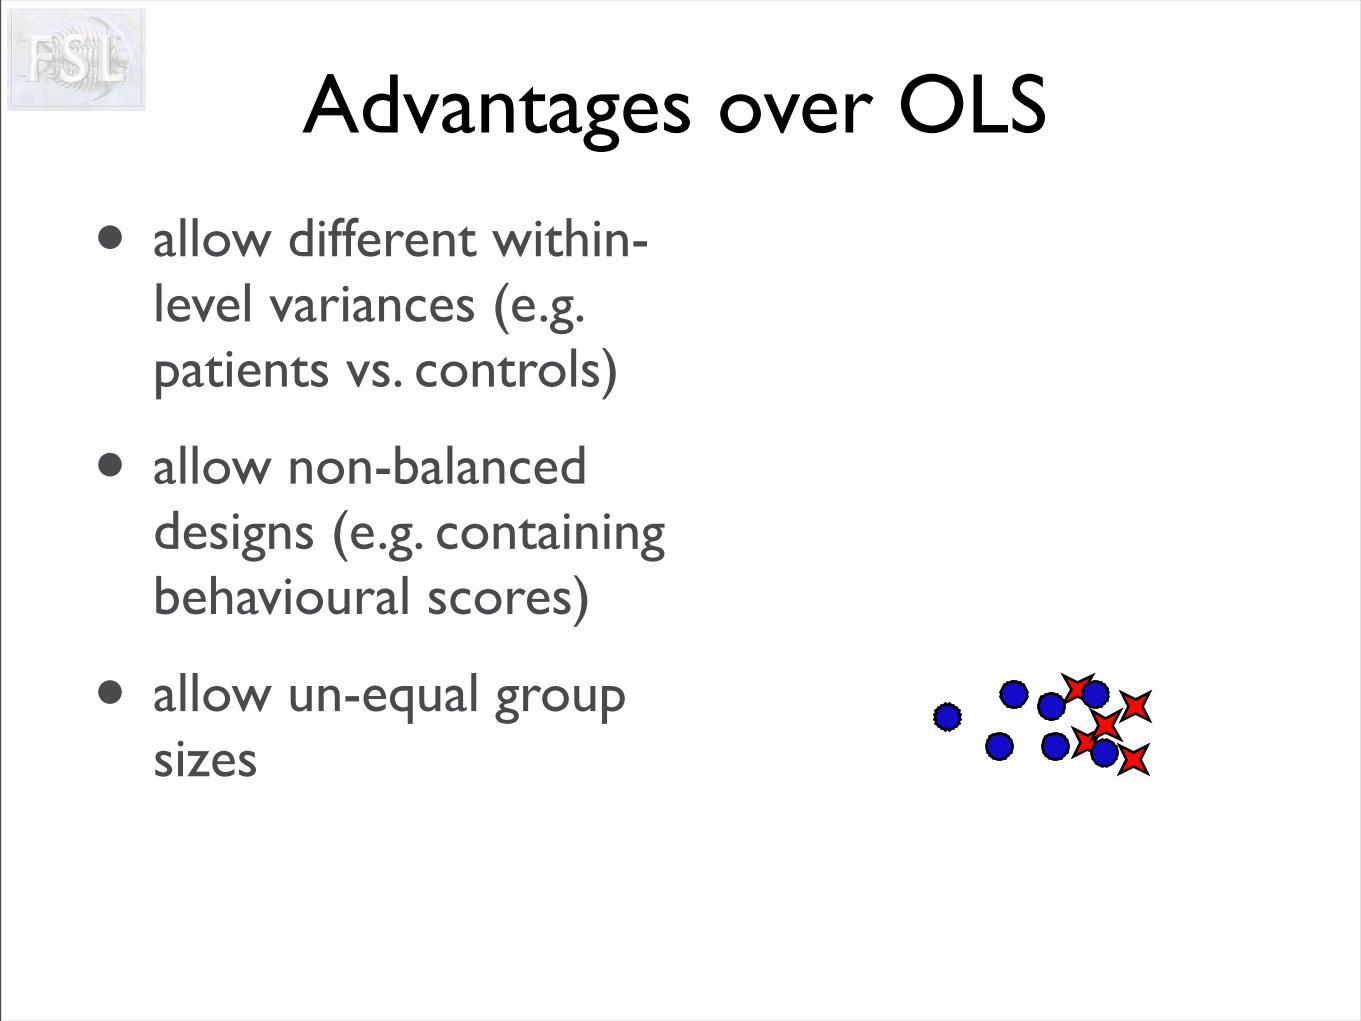
Advantages over OLS
• allow different within-level variances (e.g. patients vs. controls)
• allow non-balanced designs (e.g. containing behavioural scores)
• allow un-equal group sizes
Advantages over OLS
• allow different within-level variances (e.g. patients vs. controls)
• allow non-balanced designs (e.g. containing behavioural scores)
• allow un-equal group sizes
• solve the ‘negative variance’ problem
GroupSubjectSession
< <
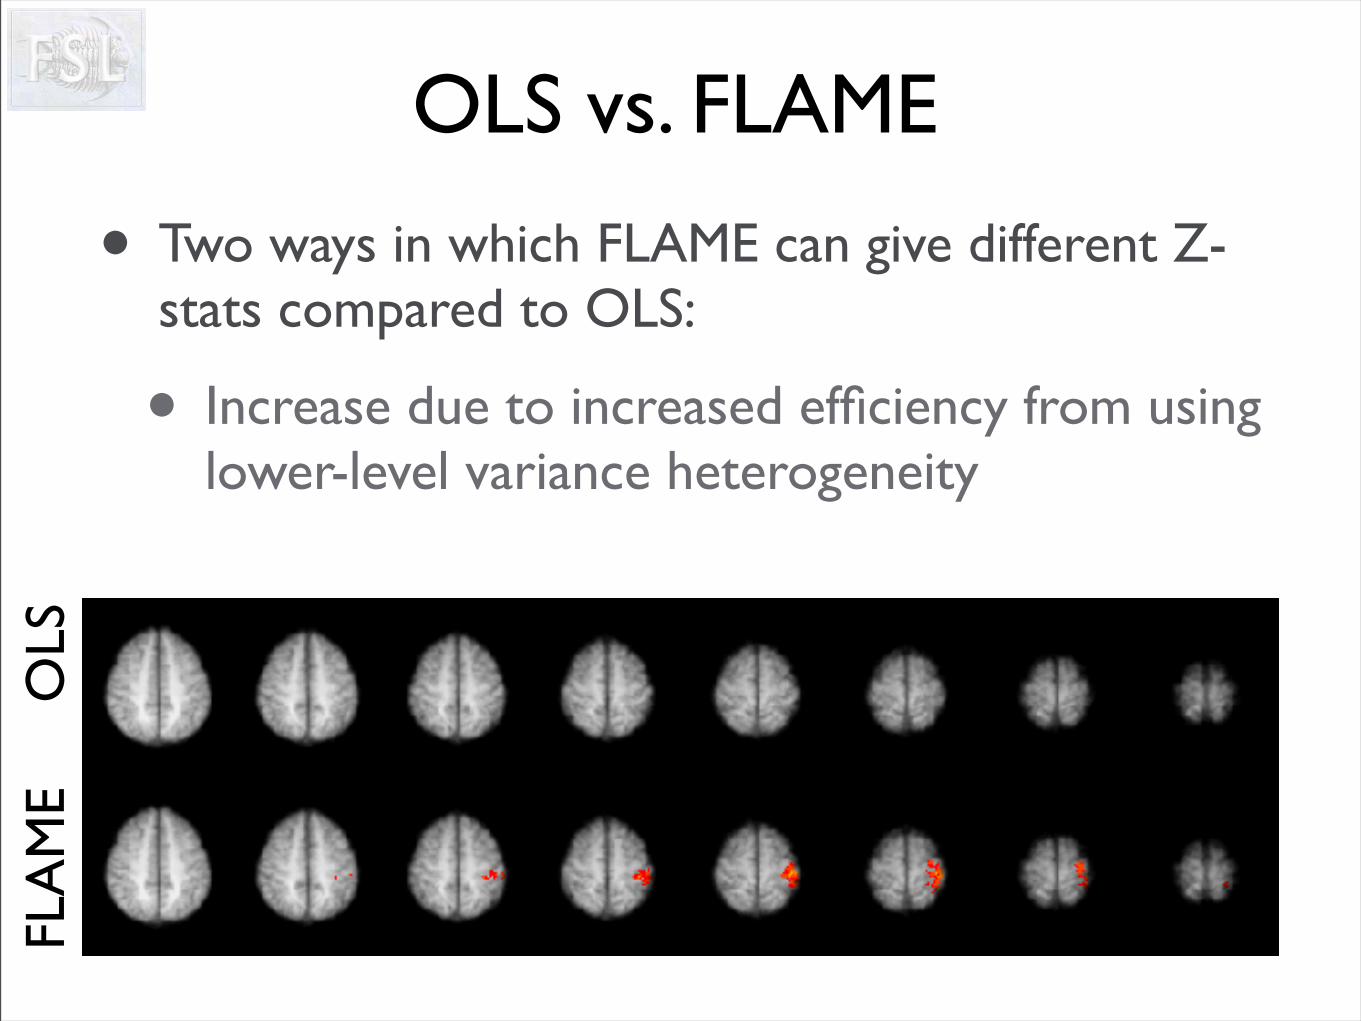
OLS vs. FLAME
• Two ways in which FLAME can give different Z-stats compared to OLS:
• Increase due to increased efficiency from using lower-level variance heterogeneity
OLS
FLA
ME
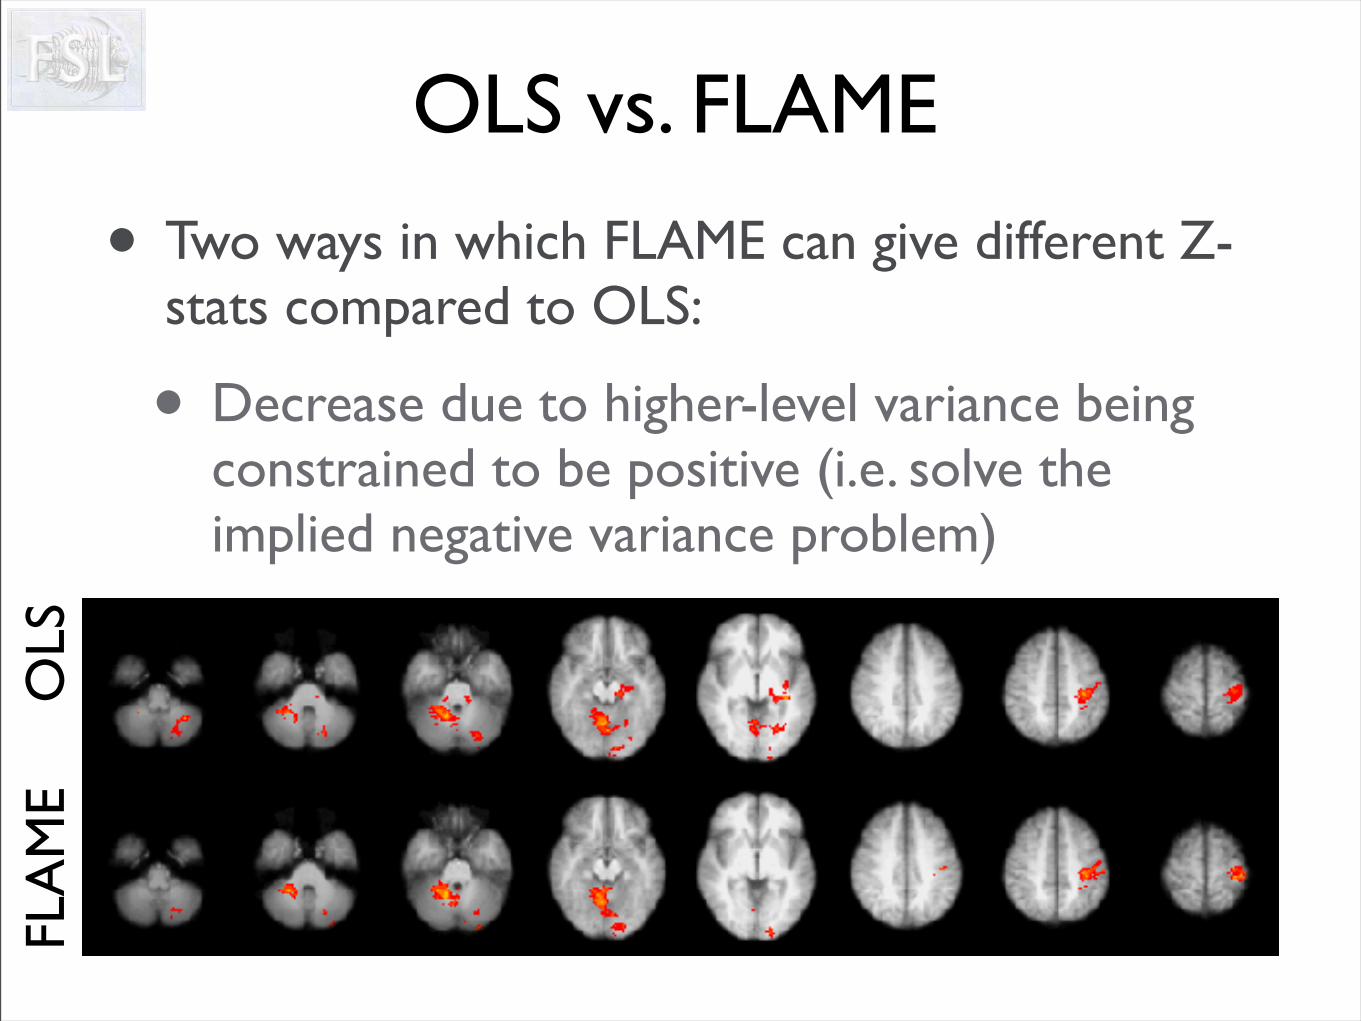
OLS vs. FLAME
• Two ways in which FLAME can give different Z-stats compared to OLS:
• Decrease due to higher-level variance being constrained to be positive (i.e. solve the implied negative variance problem)
OLS
FLA
ME
Multiple Group Variances
Multiple Group Variances
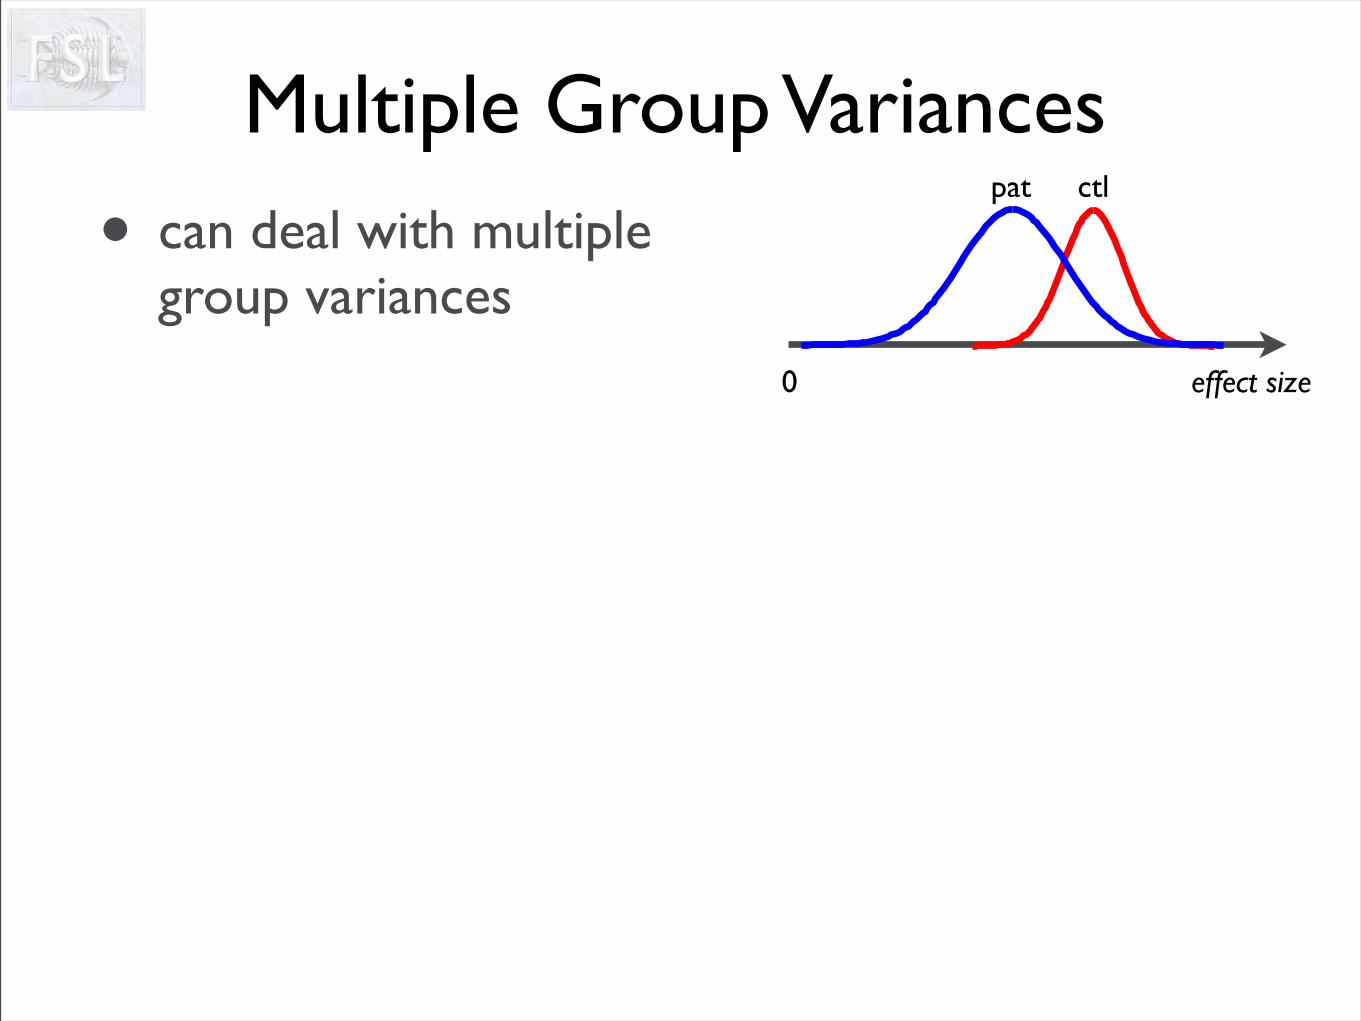
• can deal with multiple group variances
0 effect size
pat ctl
Multiple Group Variances
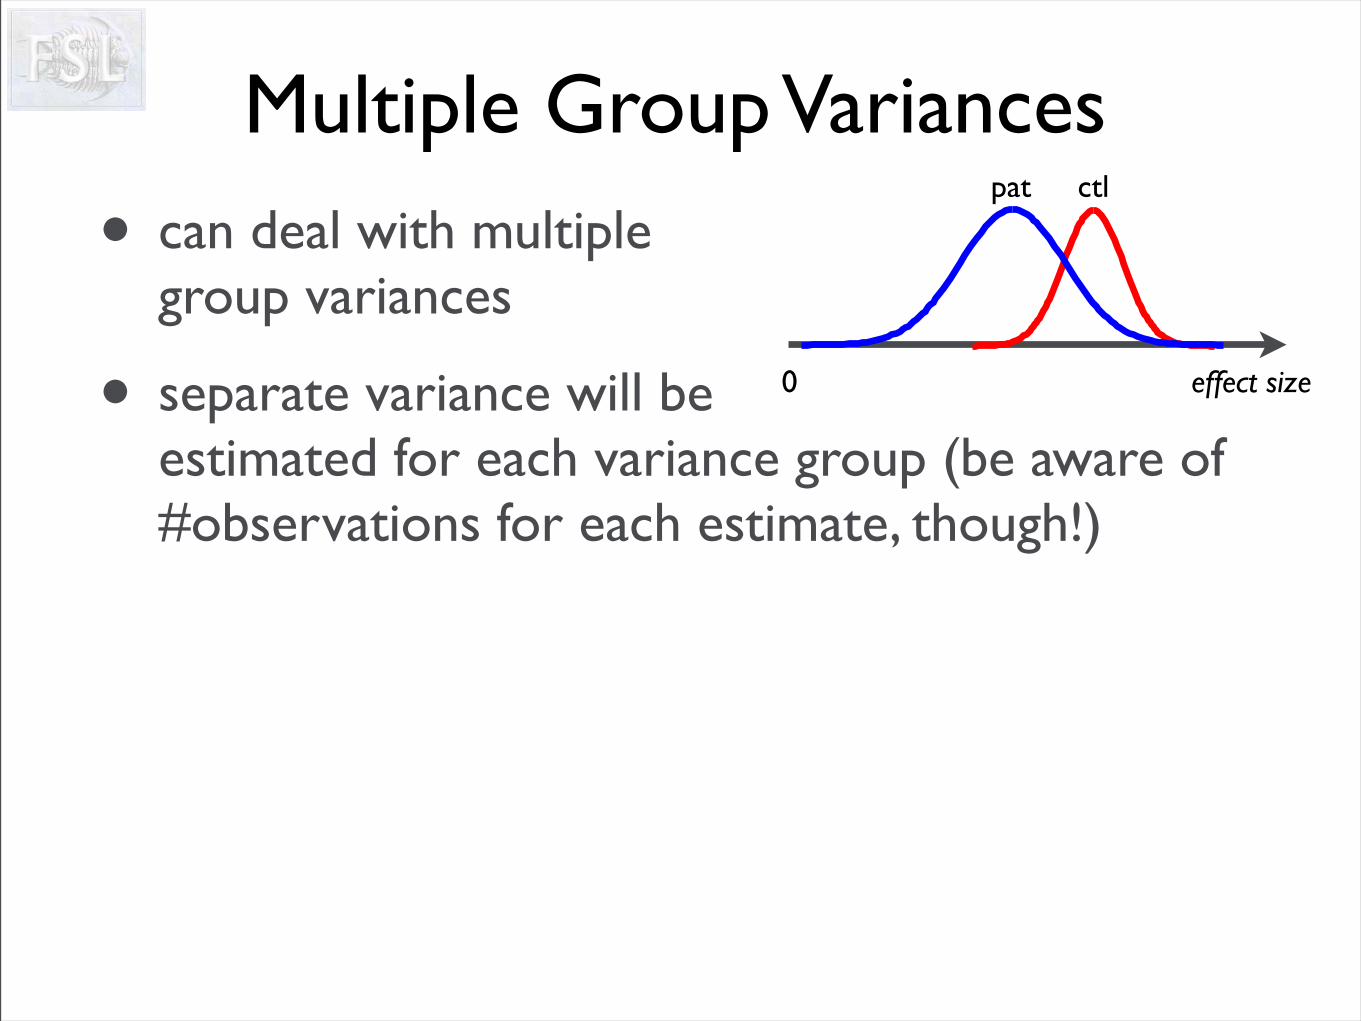
• can deal with multiple group variances
• separate variance will be estimated for each variance group (be aware of #observations for each estimate, though!)
0 effect size
pat ctl
Multiple Group Variances
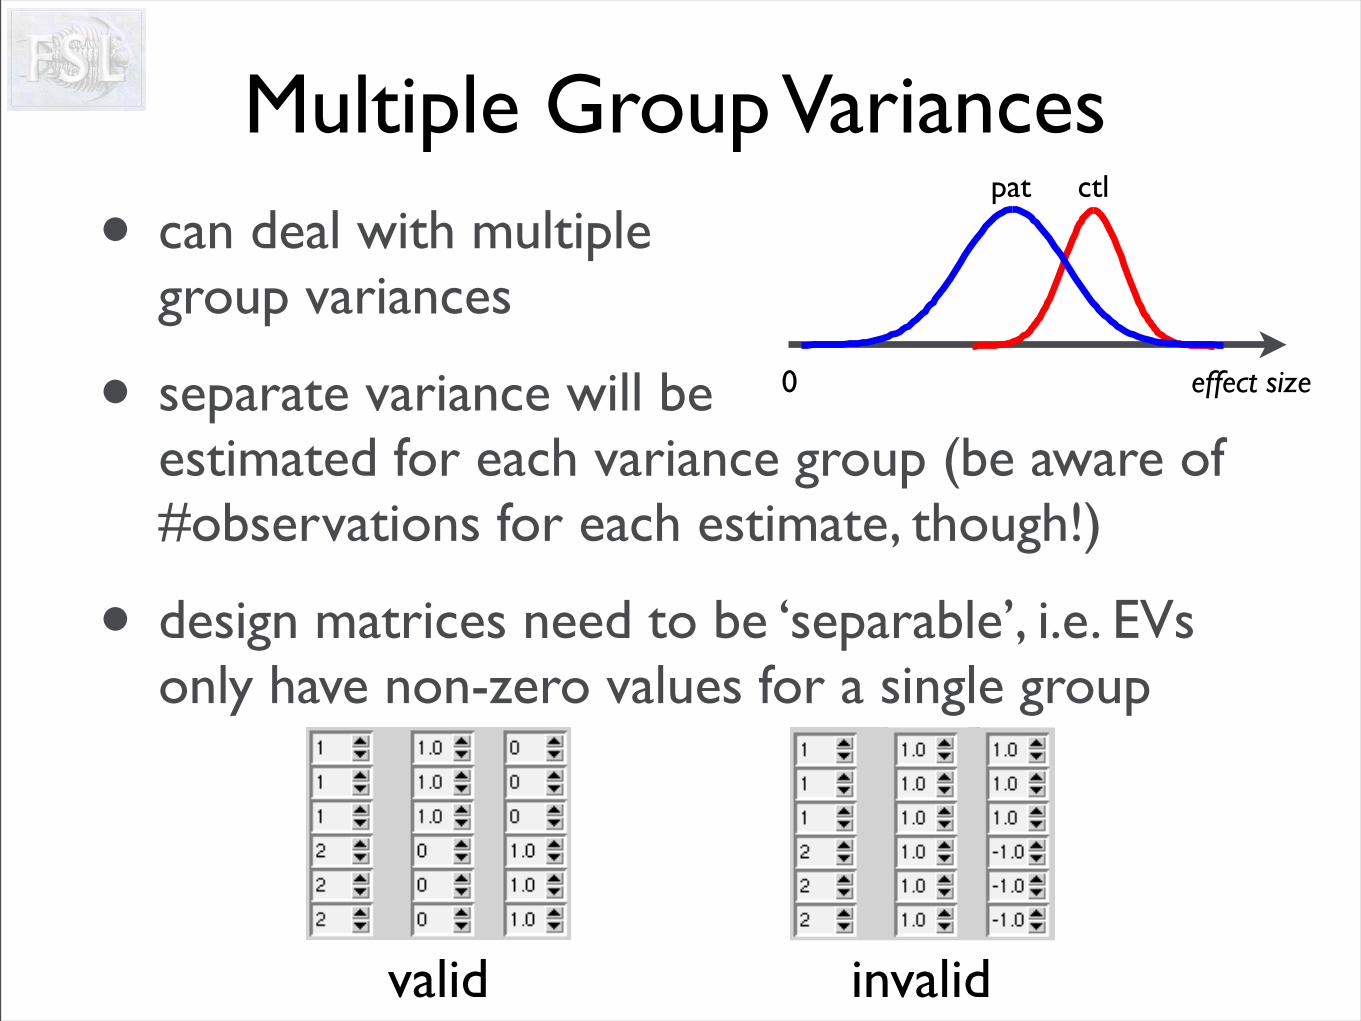
• can deal with multiple group variances
• separate variance will be estimated for each variance group (be aware of #observations for each estimate, though!)
• design matrices need to be ‘separable’, i.e. EVs only have non-zero values for a single group
0 effect size
pat ctl
valid invalid
Outlier Subjects
• Some subject effect sizes can be at odds with the general population
• Possible causes:
• Excessive motion
• Misunderstood task
• Modelling errors
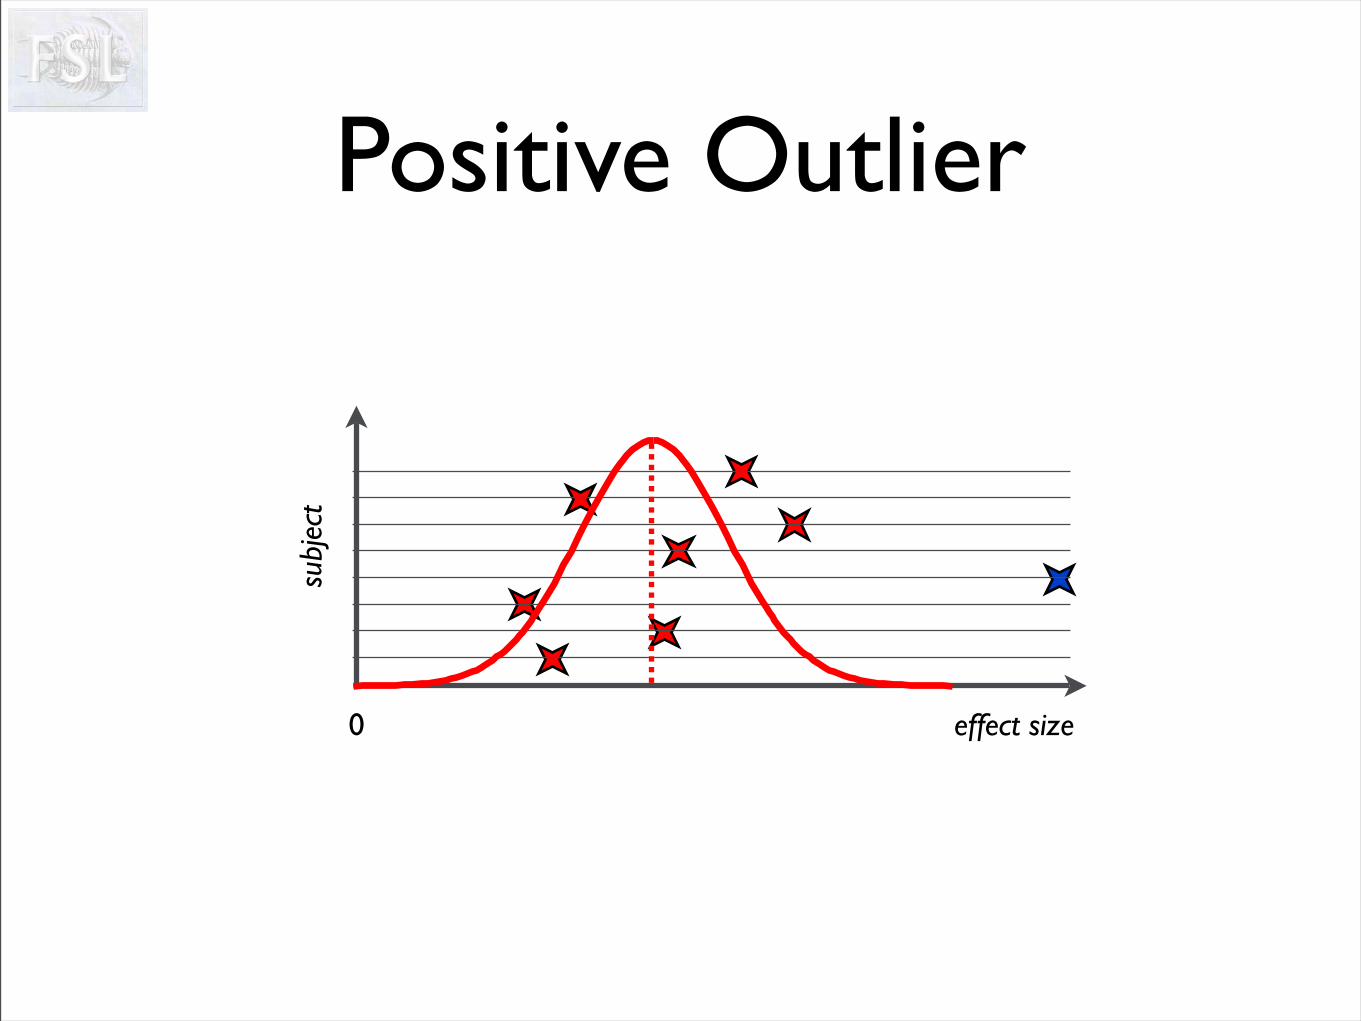
Positive Outlier
0
subj
ect
effect size
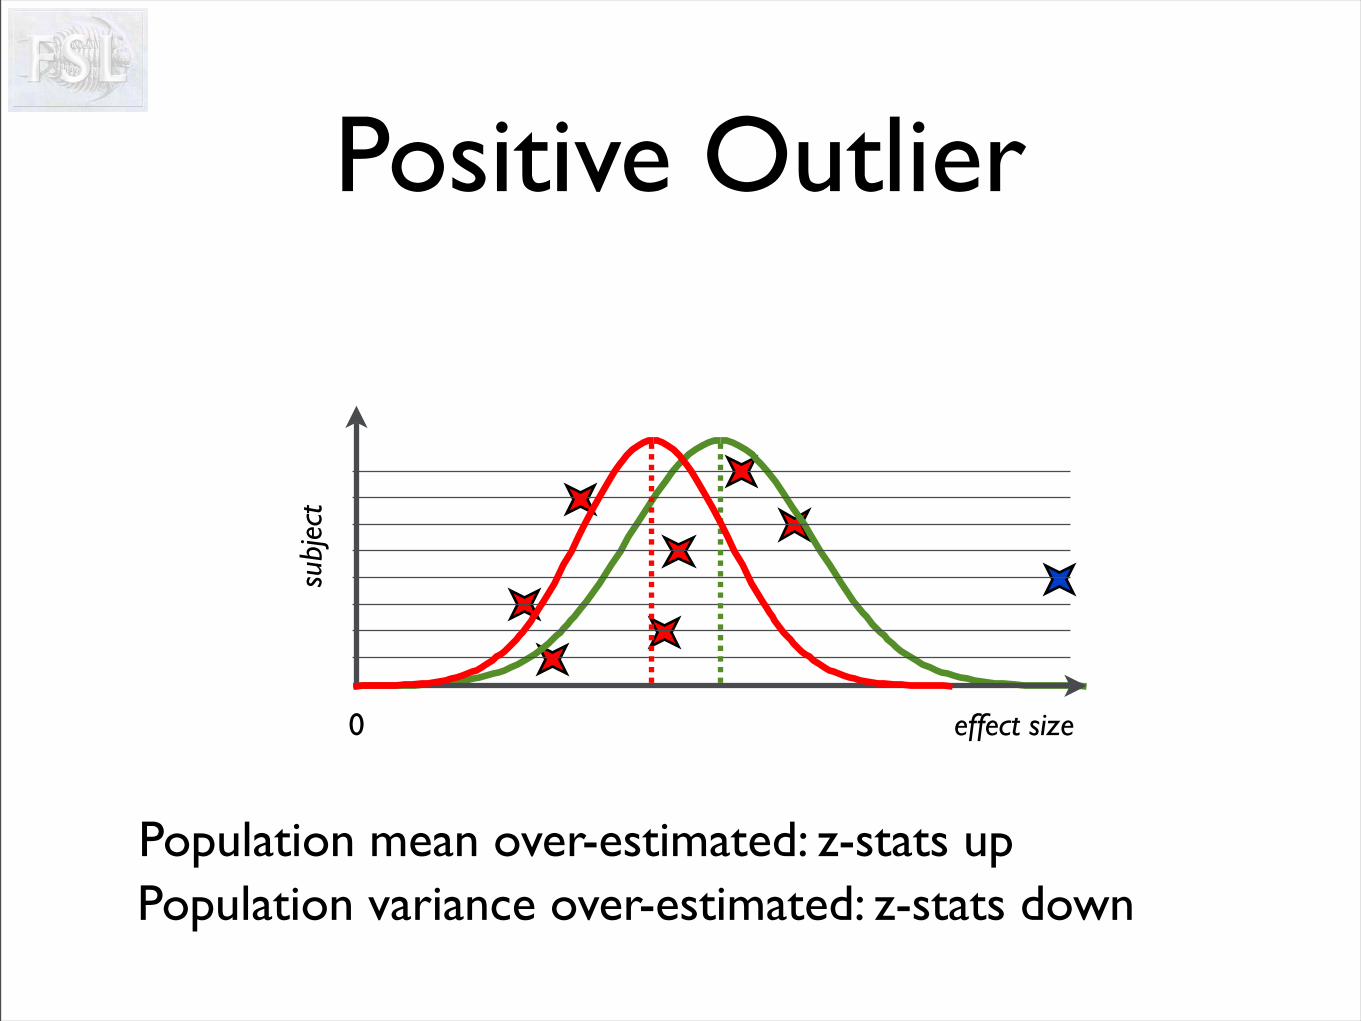
Positive Outlier
0
subj
ect
effect size
Population mean over-estimated: z-stats upPopulation variance over-estimated: z-stats down
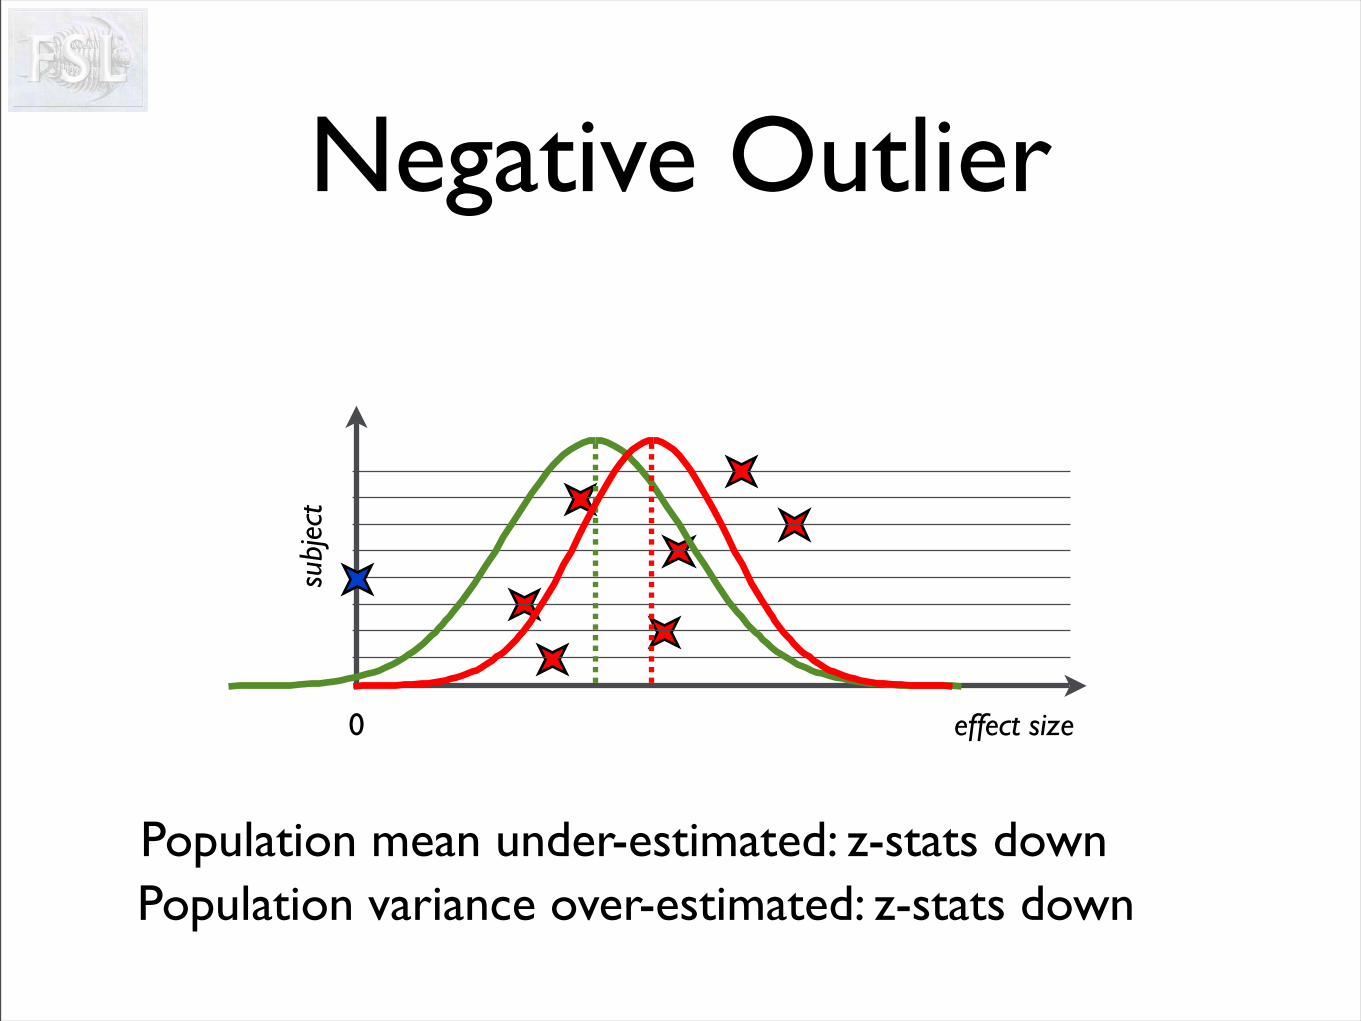
Negative Outlier
0
subj
ect
effect size
Population mean under-estimated: z-stats downPopulation variance over-estimated: z-stats down
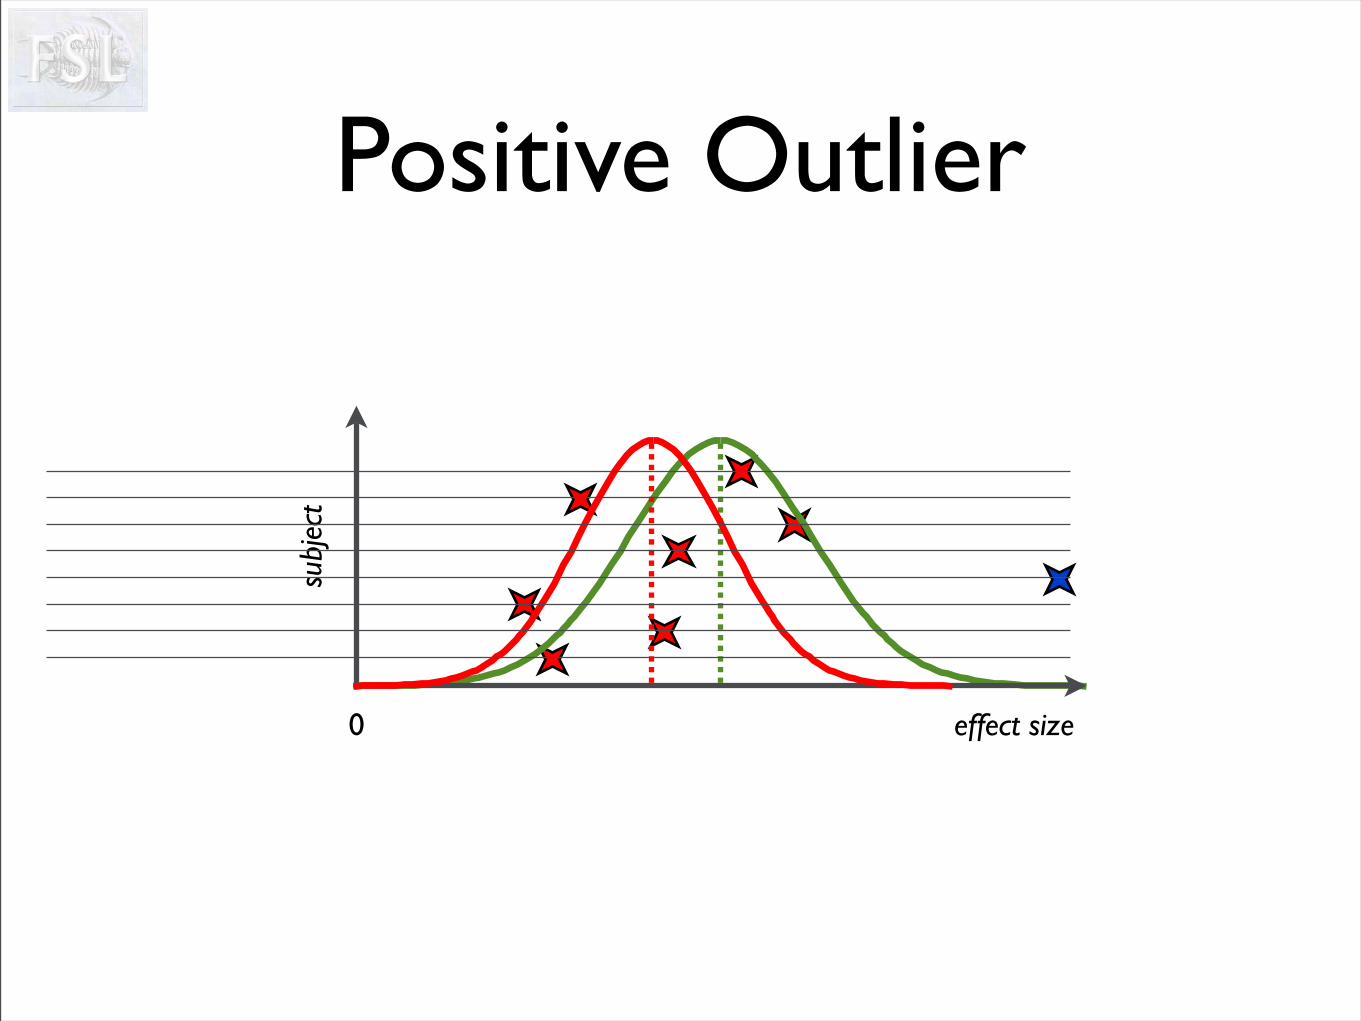
Positive Outlier
0
subj
ect
effect size
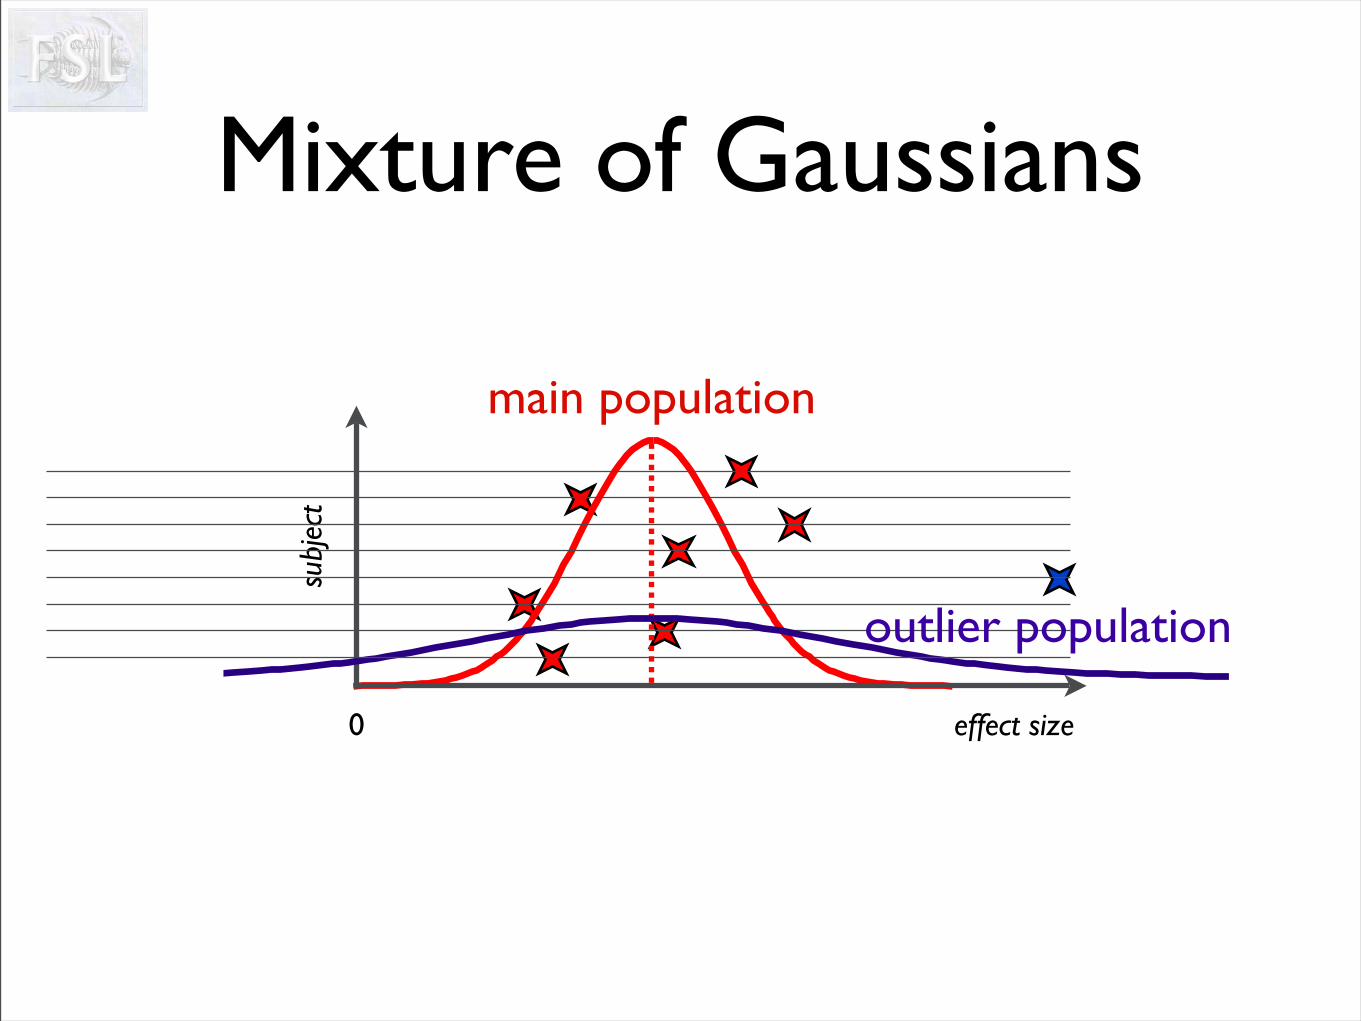
Mixture of Gaussians
0
subj
ect
effect size
main population
outlier population
0
subj
ect
effect size
main population
outlier population
Prob(Outlier)
0 1
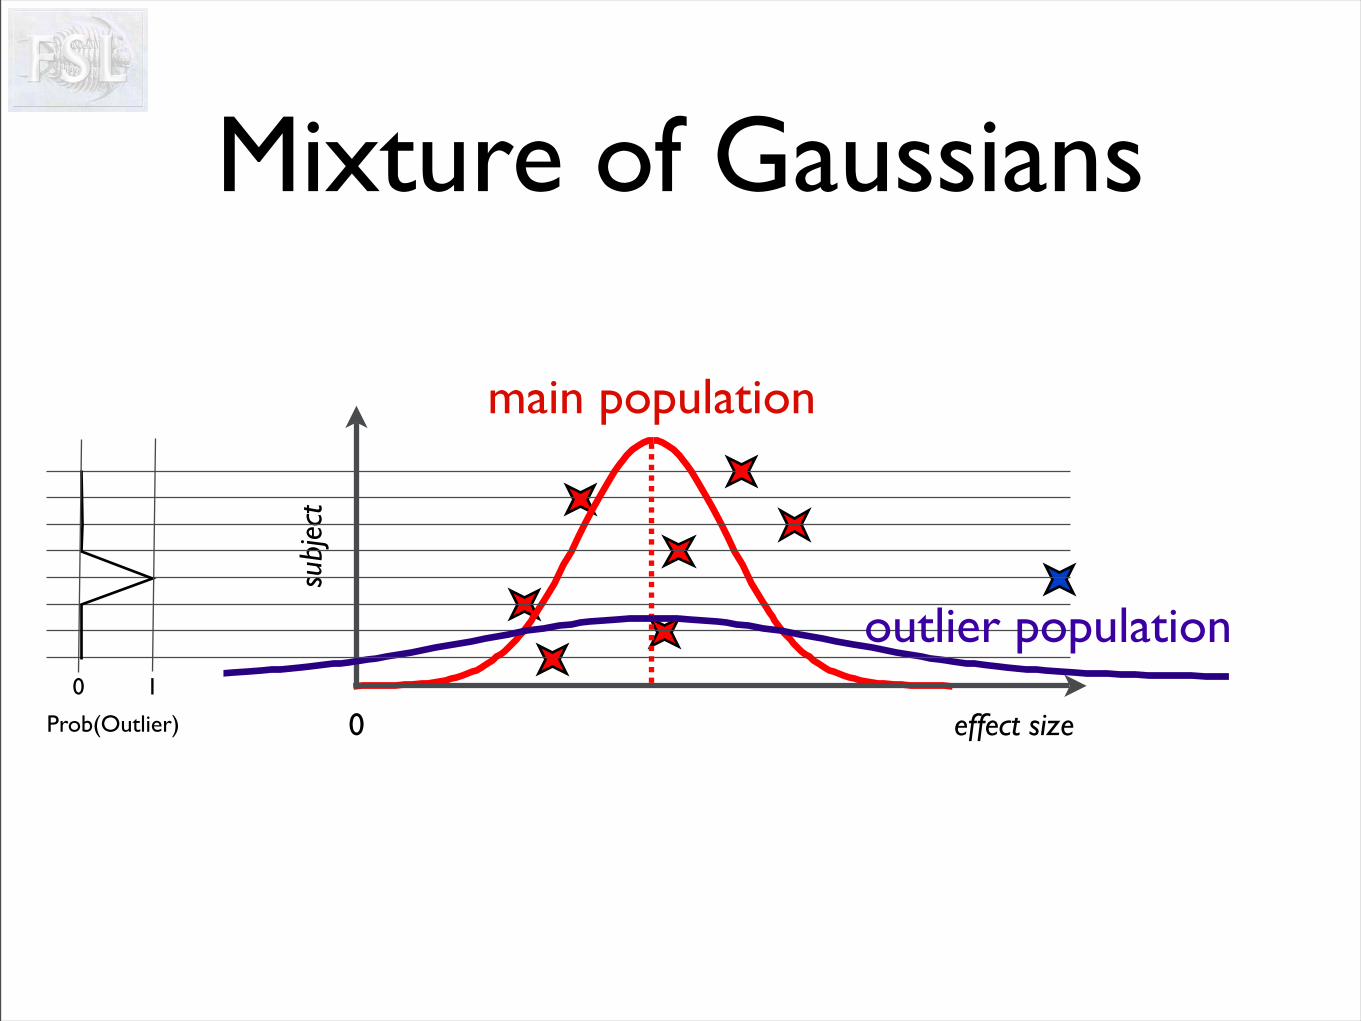
Mixture of Gaussians
0
subj
ect
effect size
main population
outlier population
Prob(Outlier)
0 1
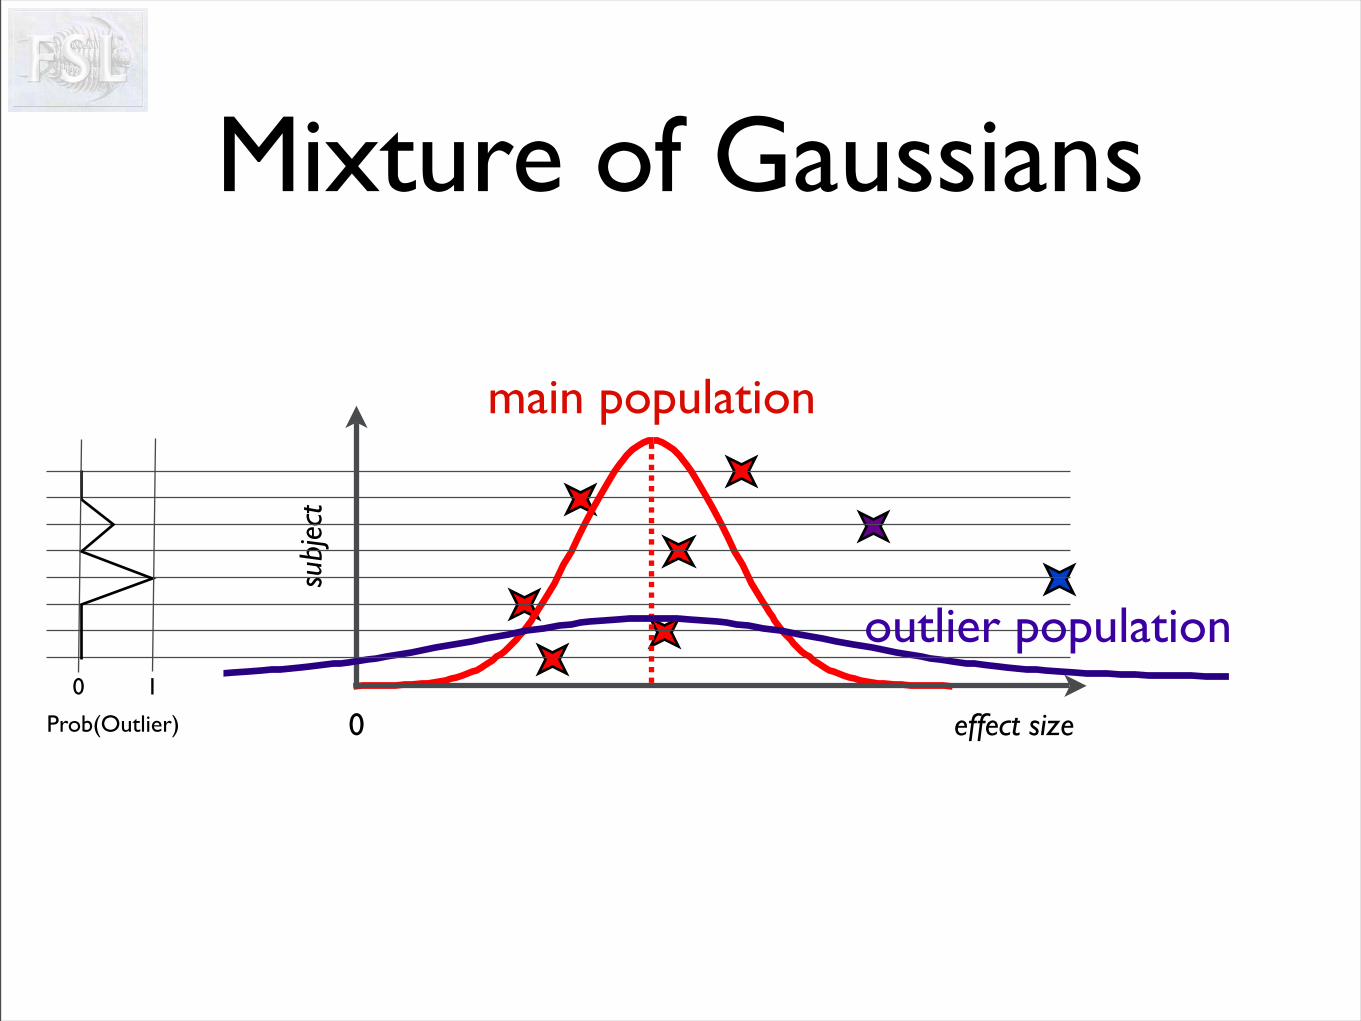
Mixture of Gaussians
0
subj
ect
effect size
main population
outlier population
Prob(Outlier)
0 1
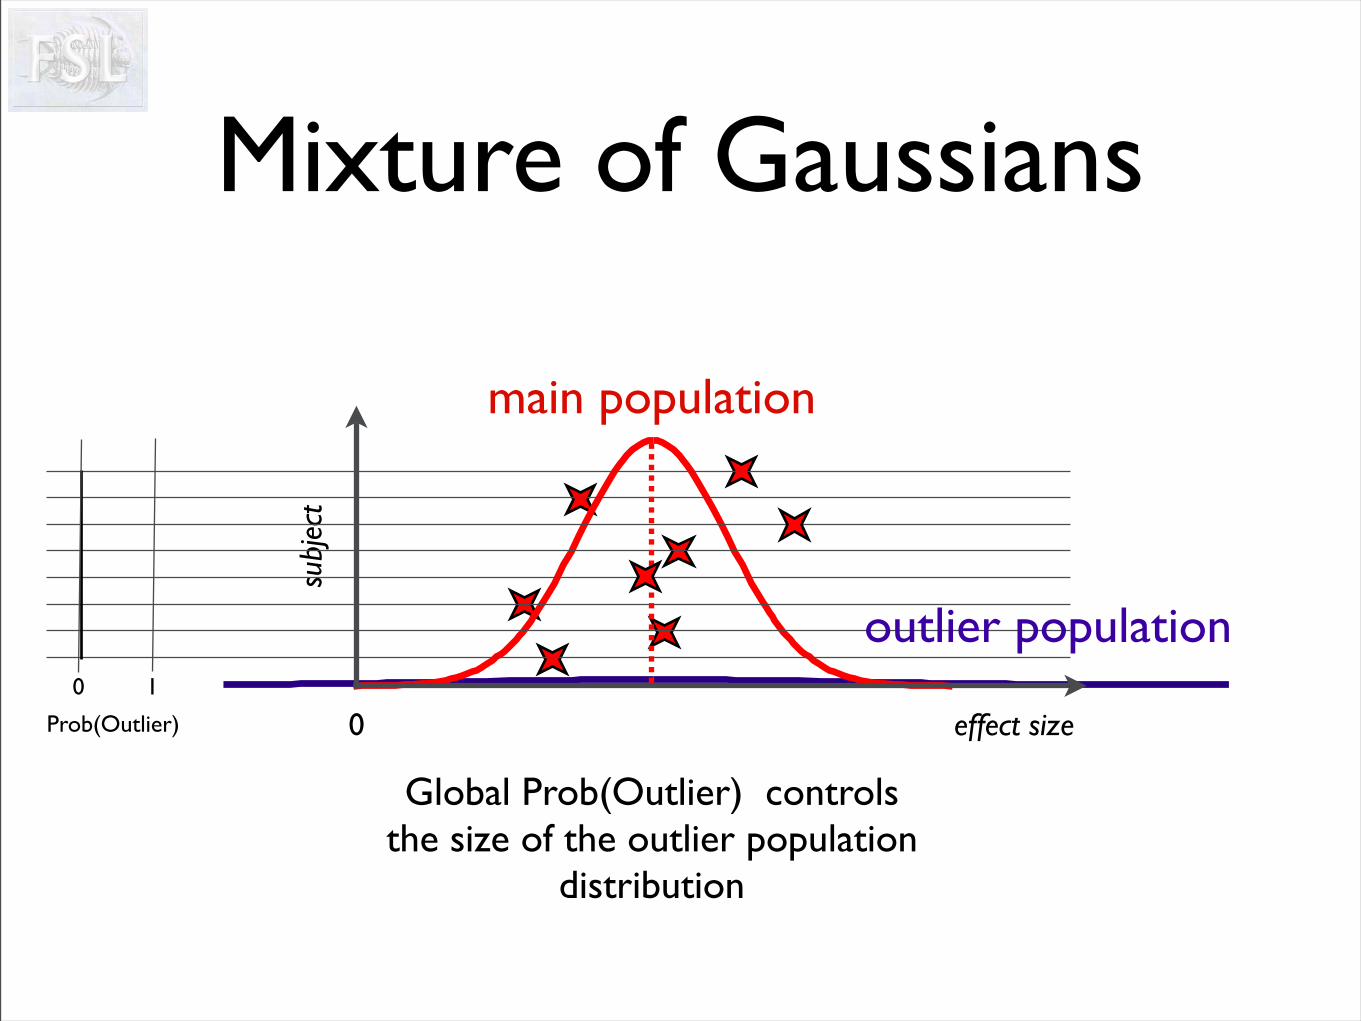
Mixture of Gaussians
Global Prob(Outlier) controls the size of the outlier population
distribution
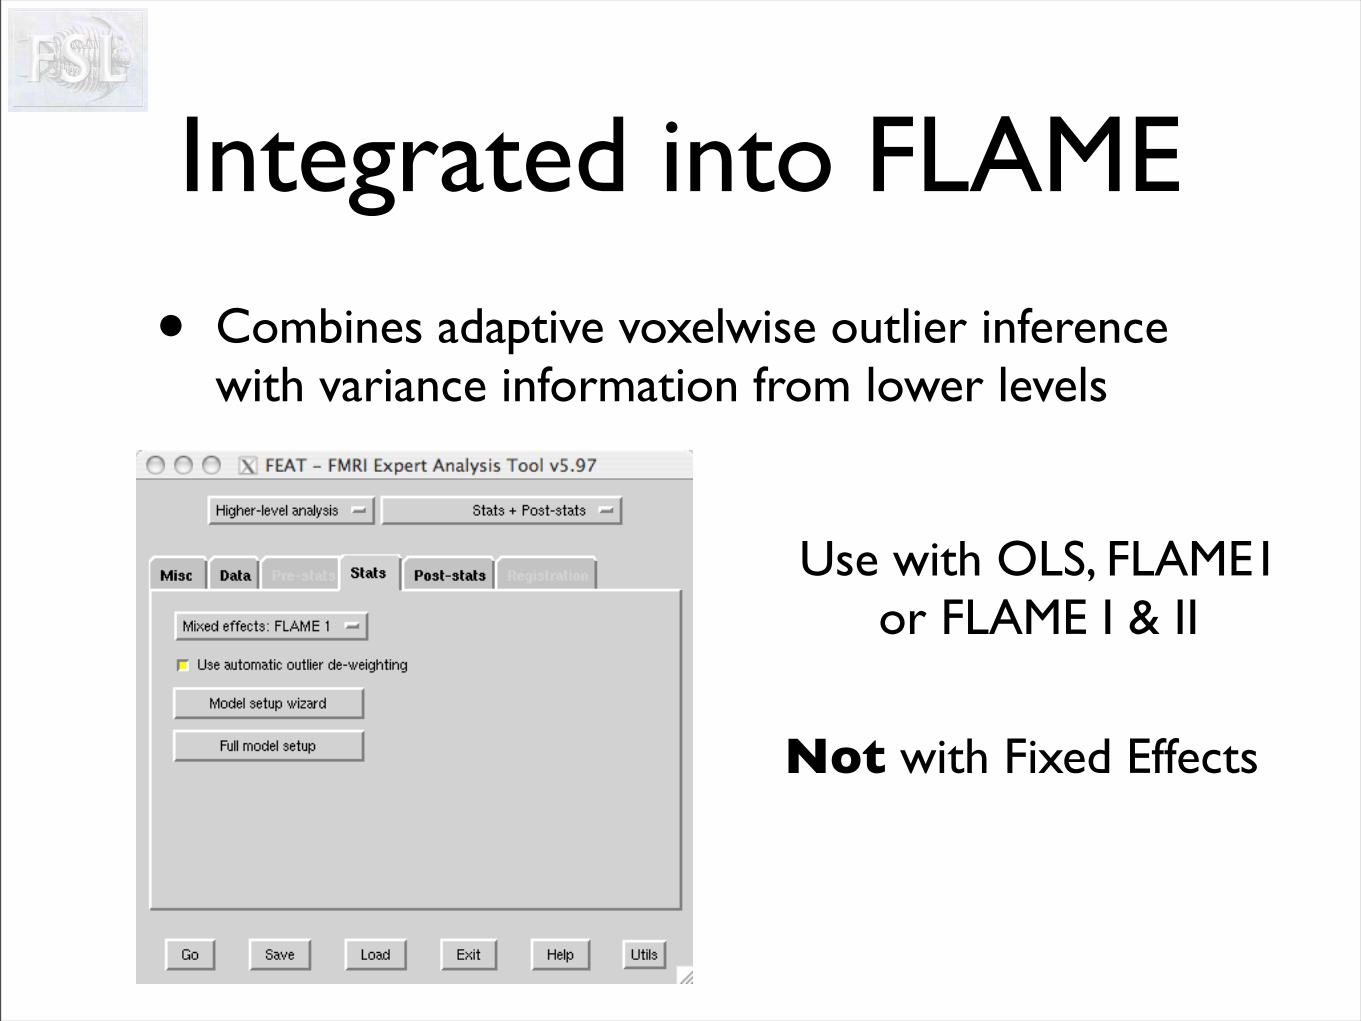
Integrated into FLAME
• Combines adaptive voxelwise outlier inference with variance information from lower levels
Use with OLS, FLAME1or FLAME I & II
Not with Fixed Effects
0
subj
ect
effect size
main population
outlier population
Prob(Outlier)
0 1
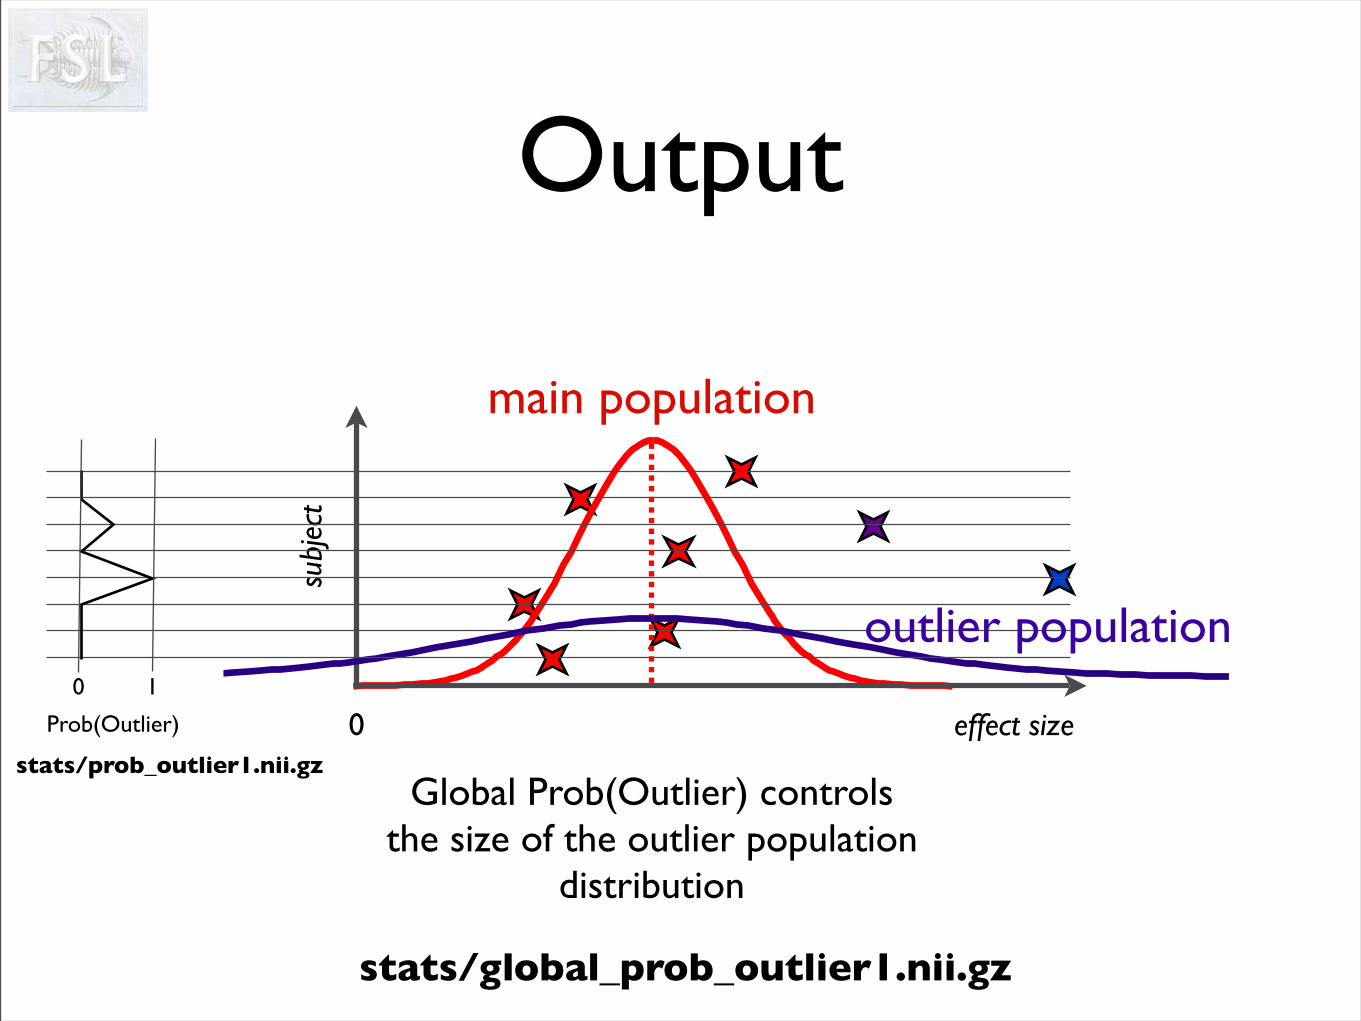
Output
Global Prob(Outlier) controls the size of the outlier population
distribution
stats/prob_outlier1.nii.gz
stats/global_prob_outlier1.nii.gz
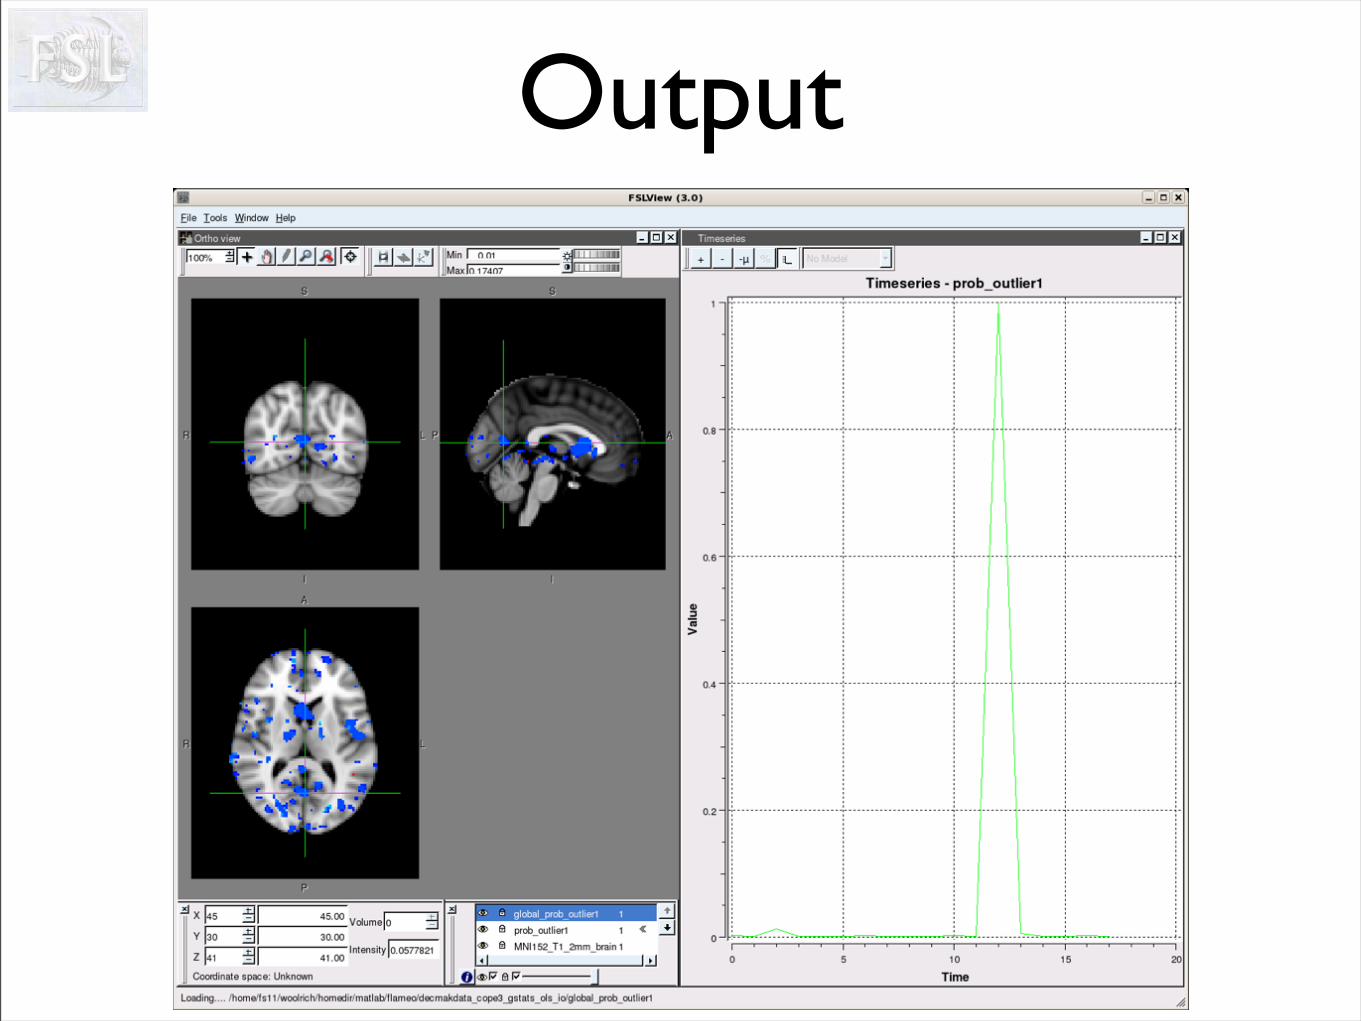
Output
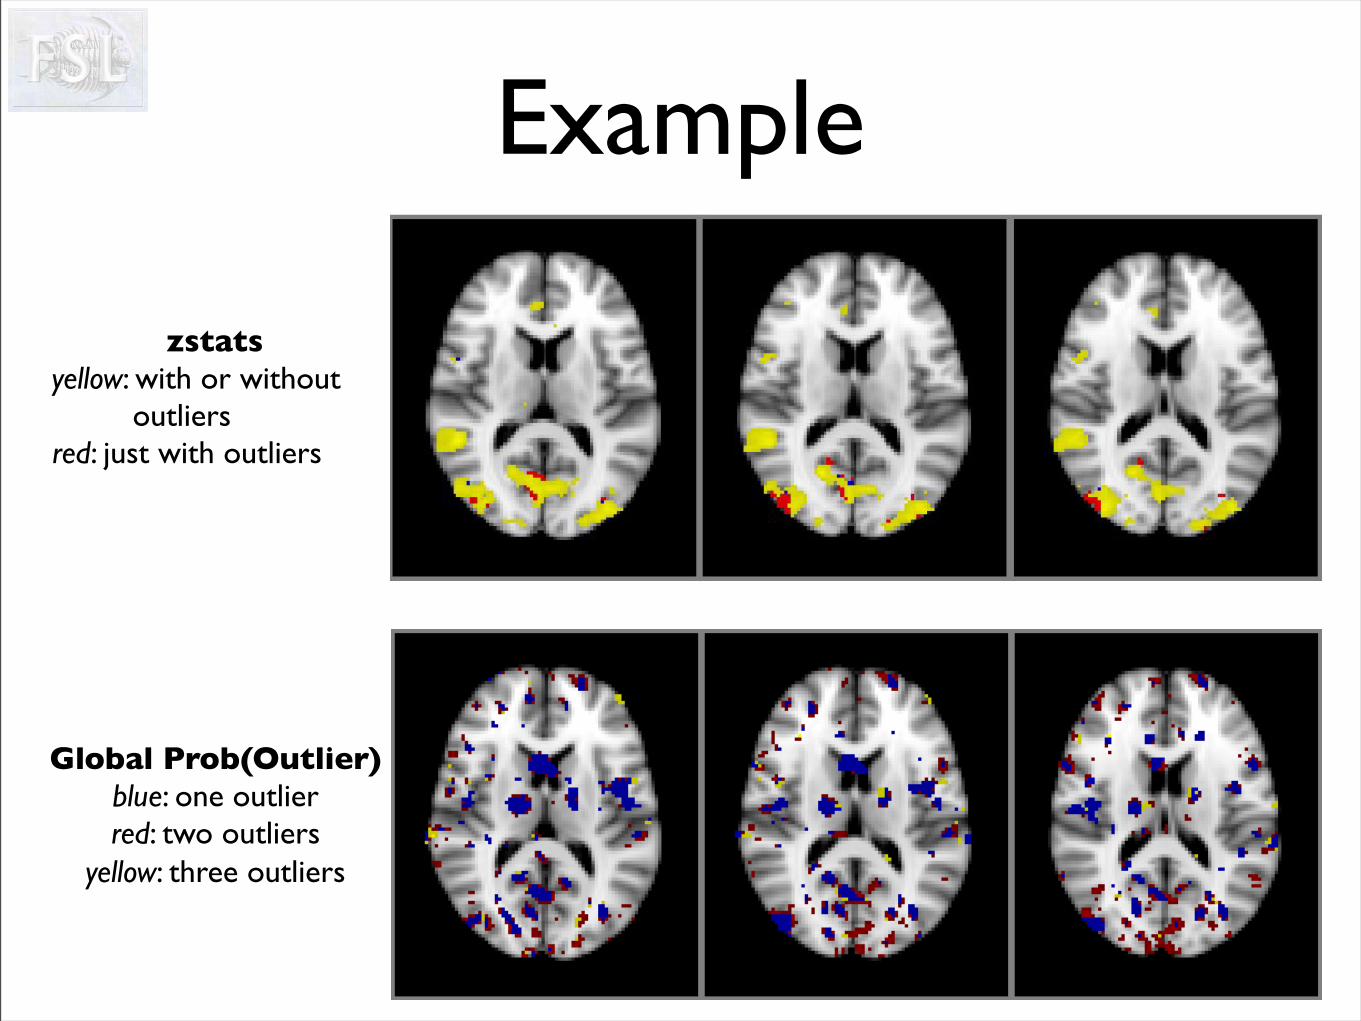
Example
zstatsyellow: with or without
outliersred: just with outliers
Global Prob(Outlier)blue: one outlierred: two outliers
yellow: three outliers
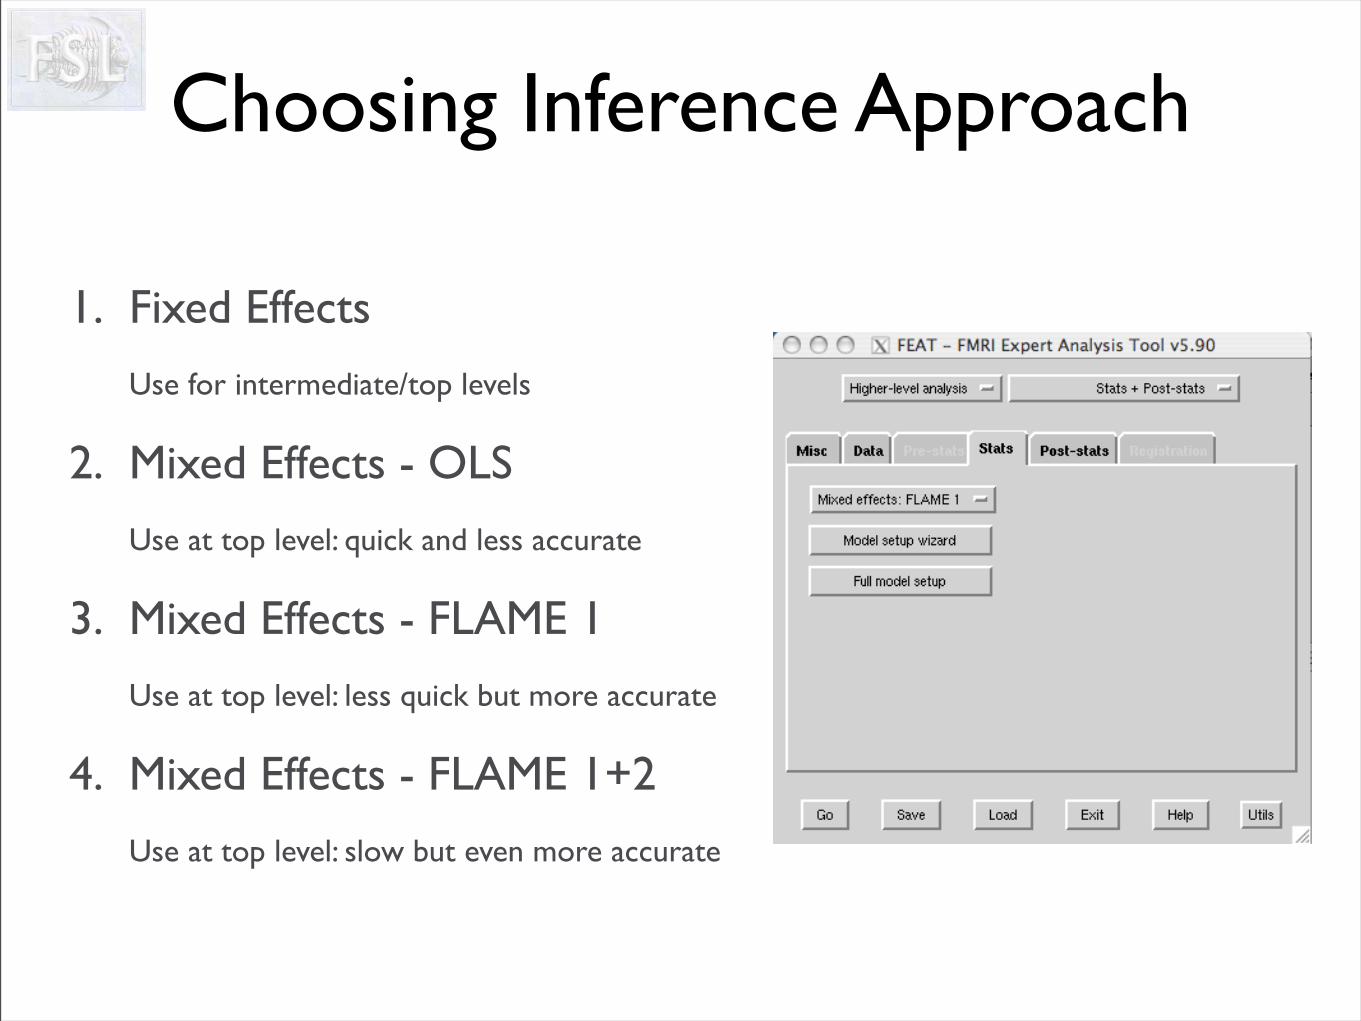
Choosing Inference Approach
1. Fixed Effects
Use for intermediate/top levels
2. Mixed Effects - OLS
Use at top level: quick and less accurate
3. Mixed Effects - FLAME 1
Use at top level: less quick but more accurate
4. Mixed Effects - FLAME 1+2
Use at top level: slow but even more accurate
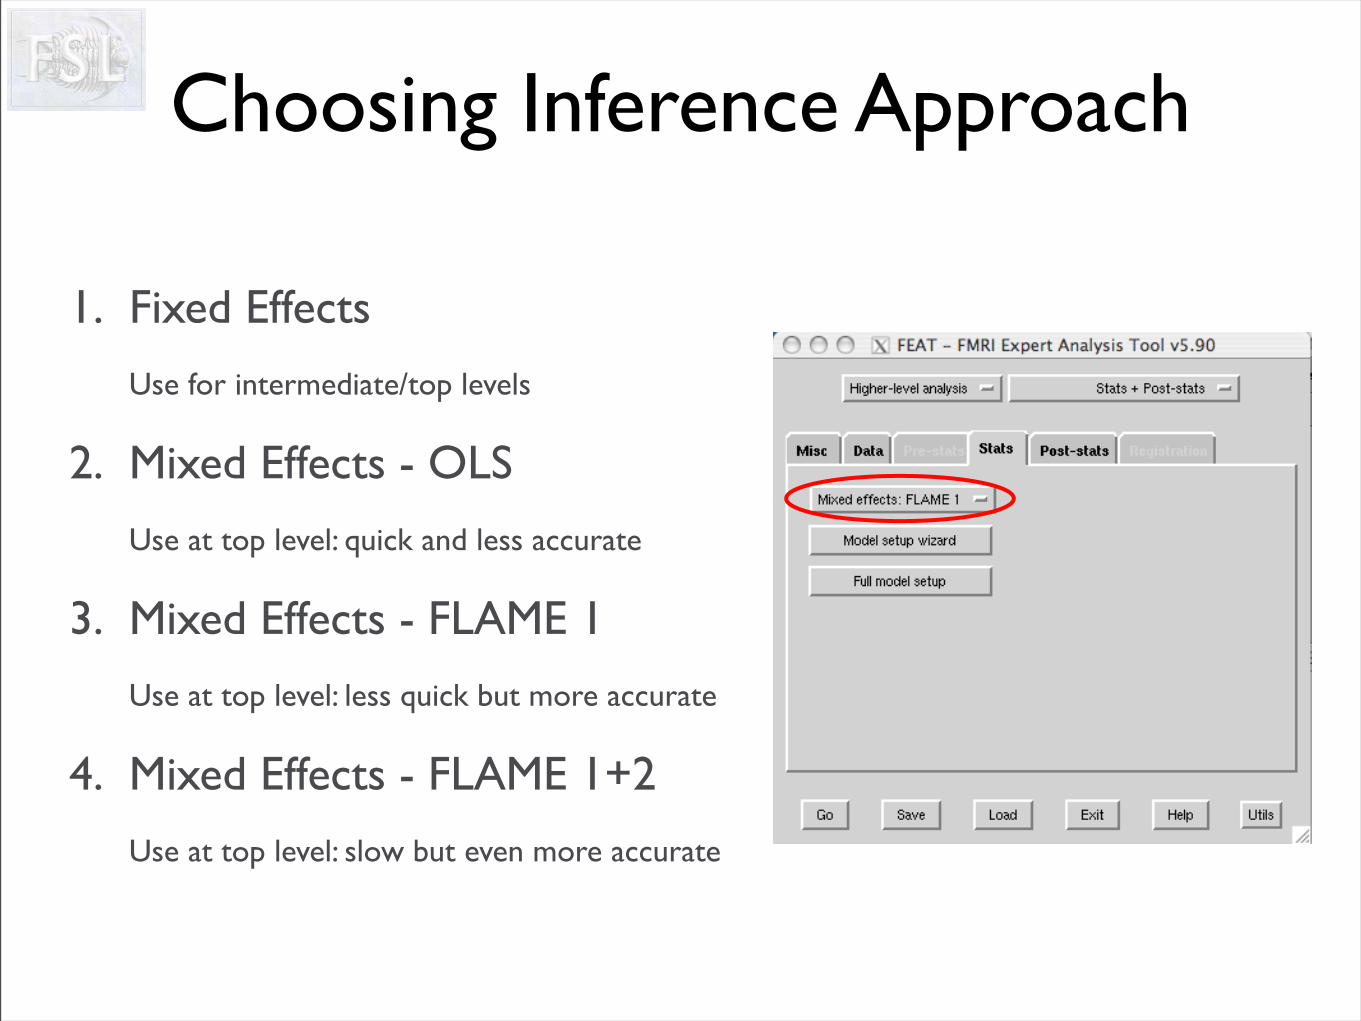
Choosing Inference Approach
1. Fixed Effects
Use for intermediate/top levels
2. Mixed Effects - OLS
Use at top level: quick and less accurate
3. Mixed Effects - FLAME 1
Use at top level: less quick but more accurate
4. Mixed Effects - FLAME 1+2
Use at top level: slow but even more accurate
Examples
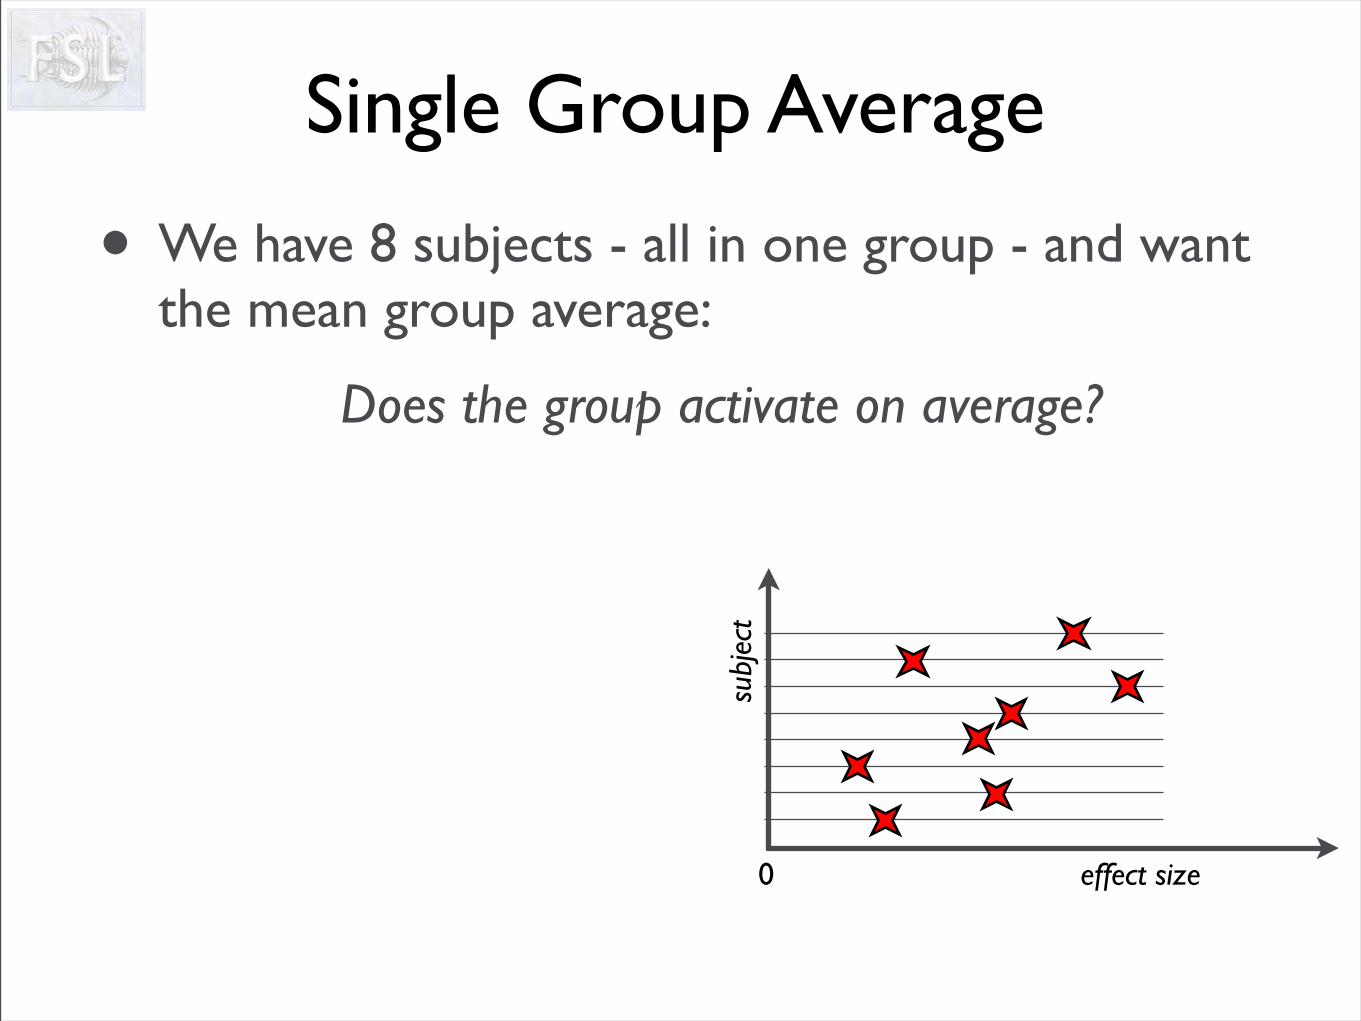
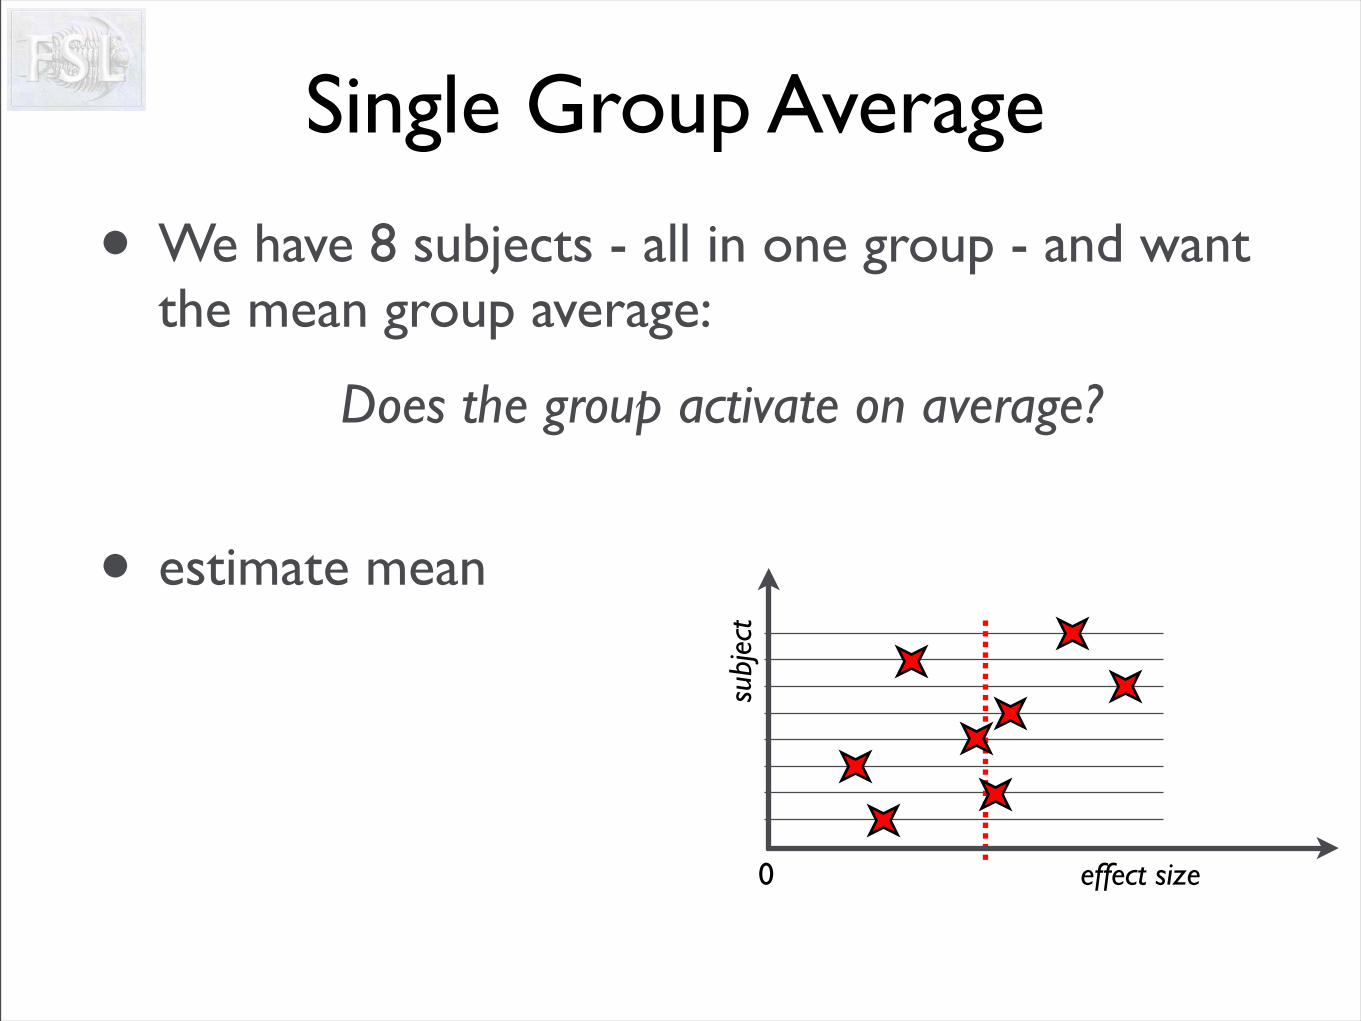
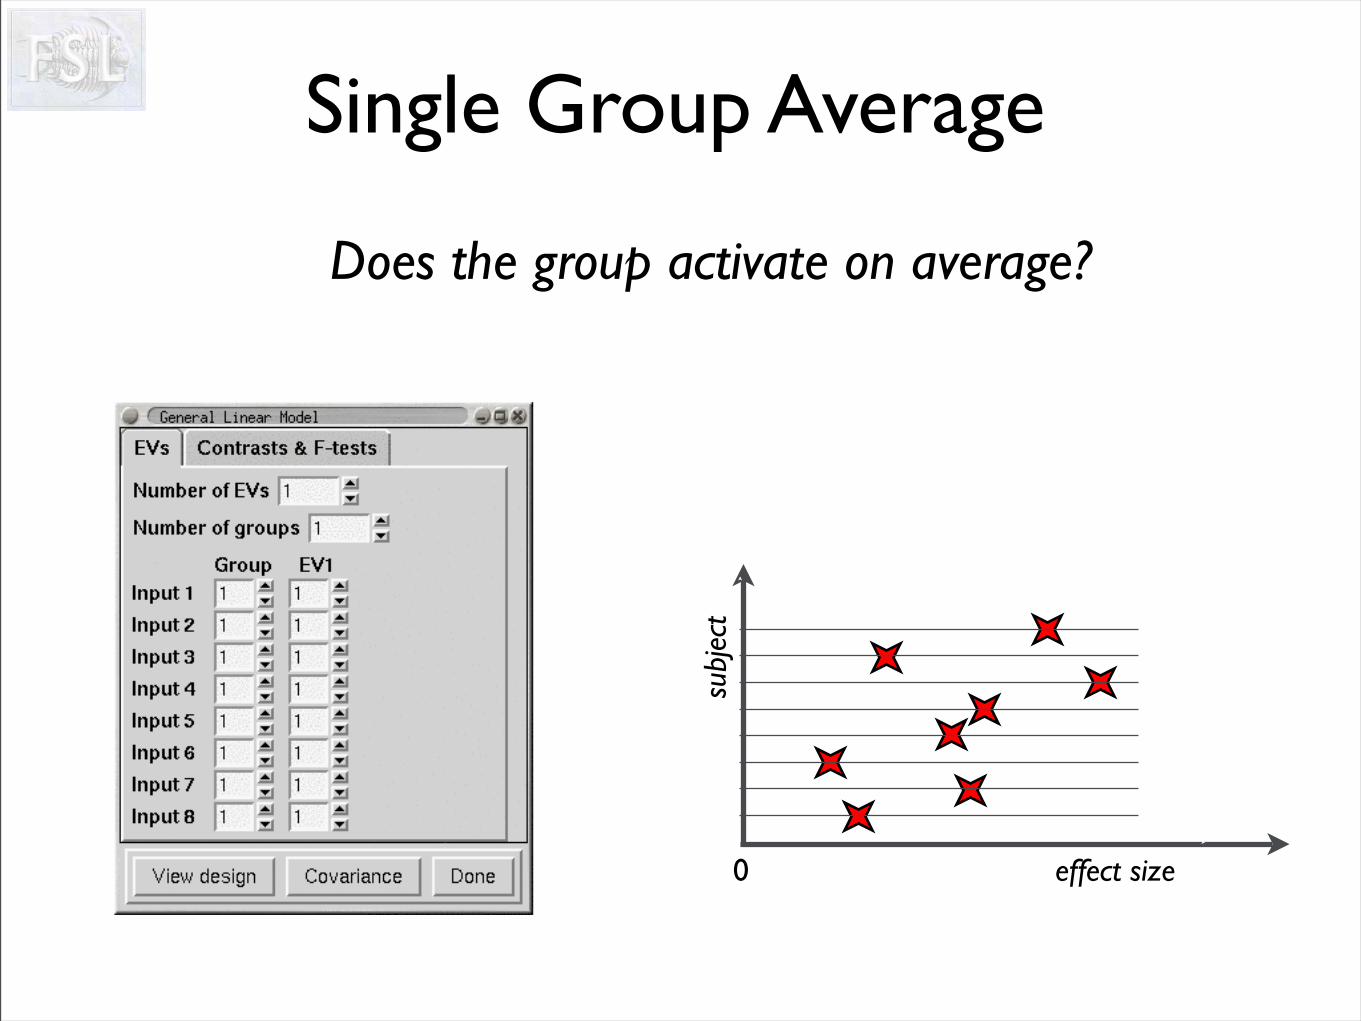
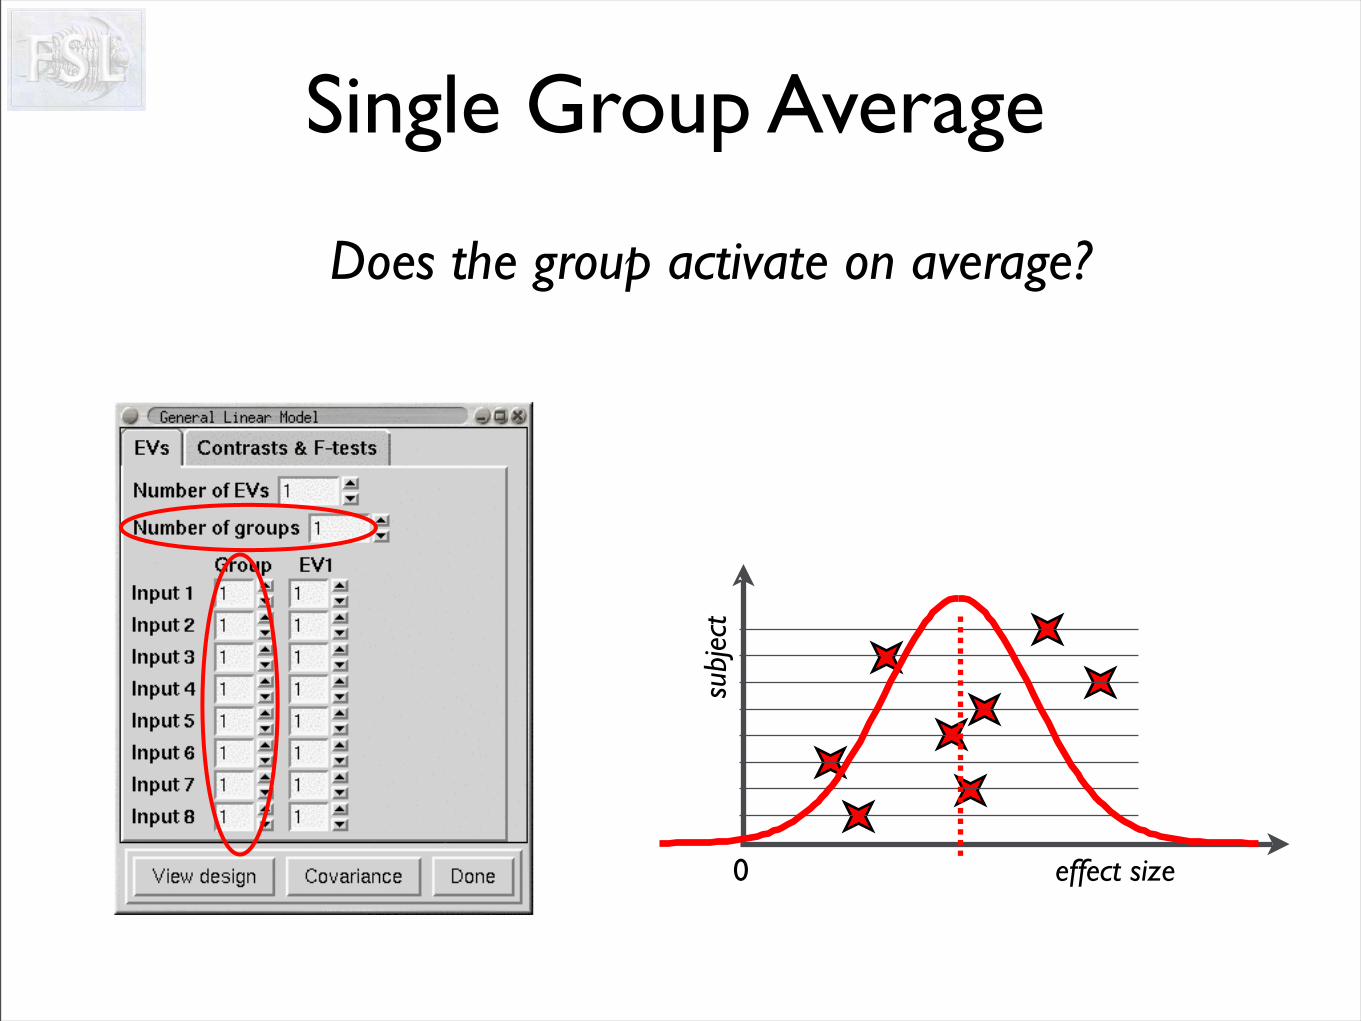
Single Group Average
• We have 8 subjects - all in one group - and want the mean group average:
Does the group activate on average?
0
subj
ect
effect size
Single Group Average
• We have 8 subjects - all in one group - and want the mean group average:
Does the group activate on average?
• estimate mean
0
subj
ect
effect size
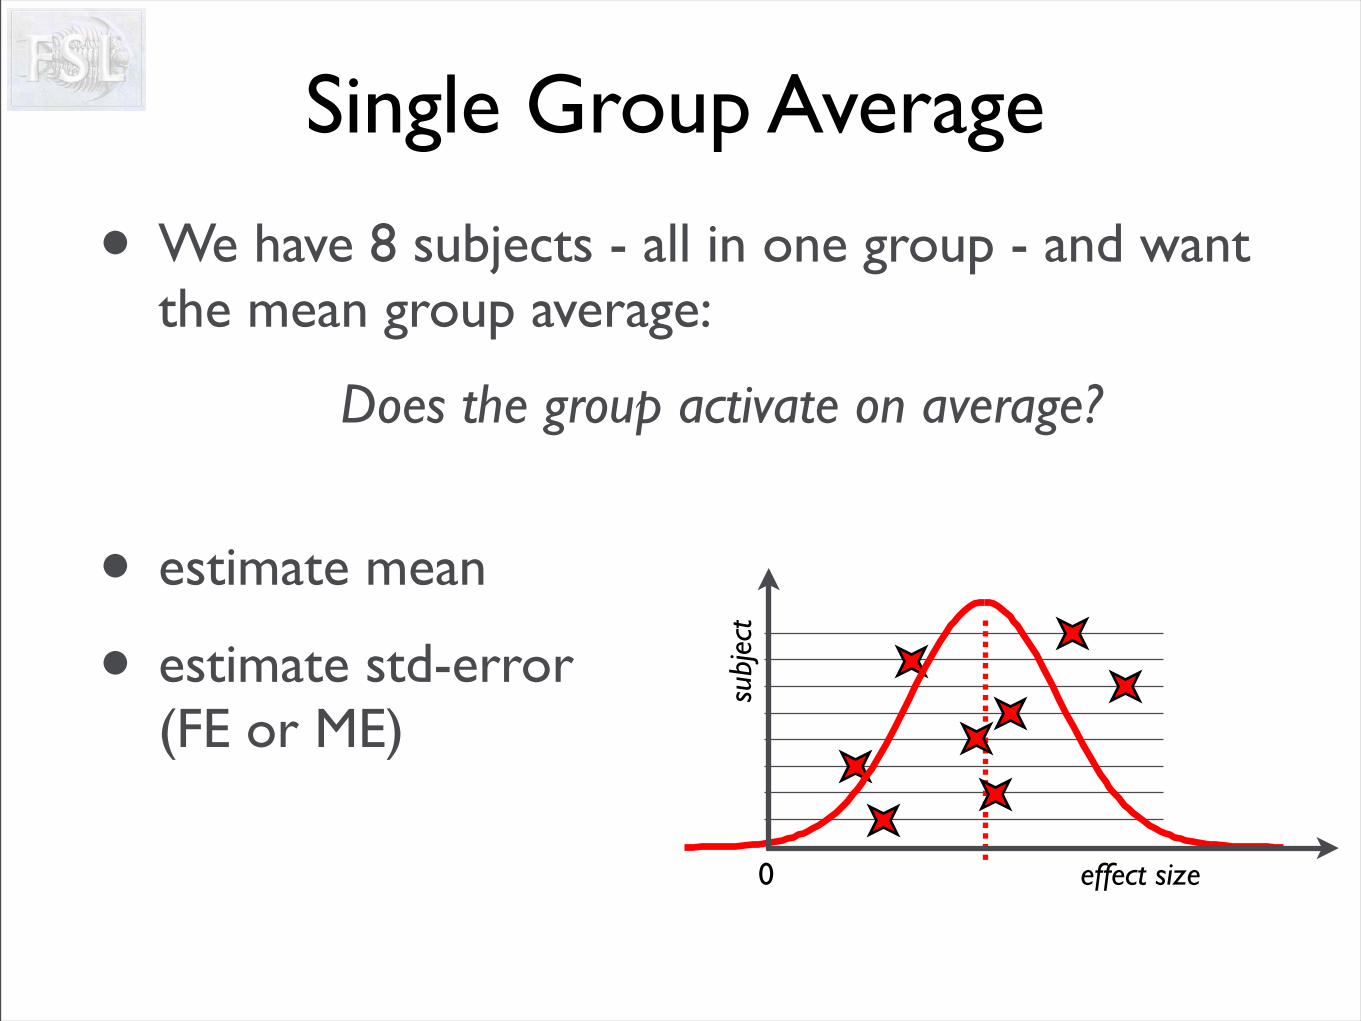
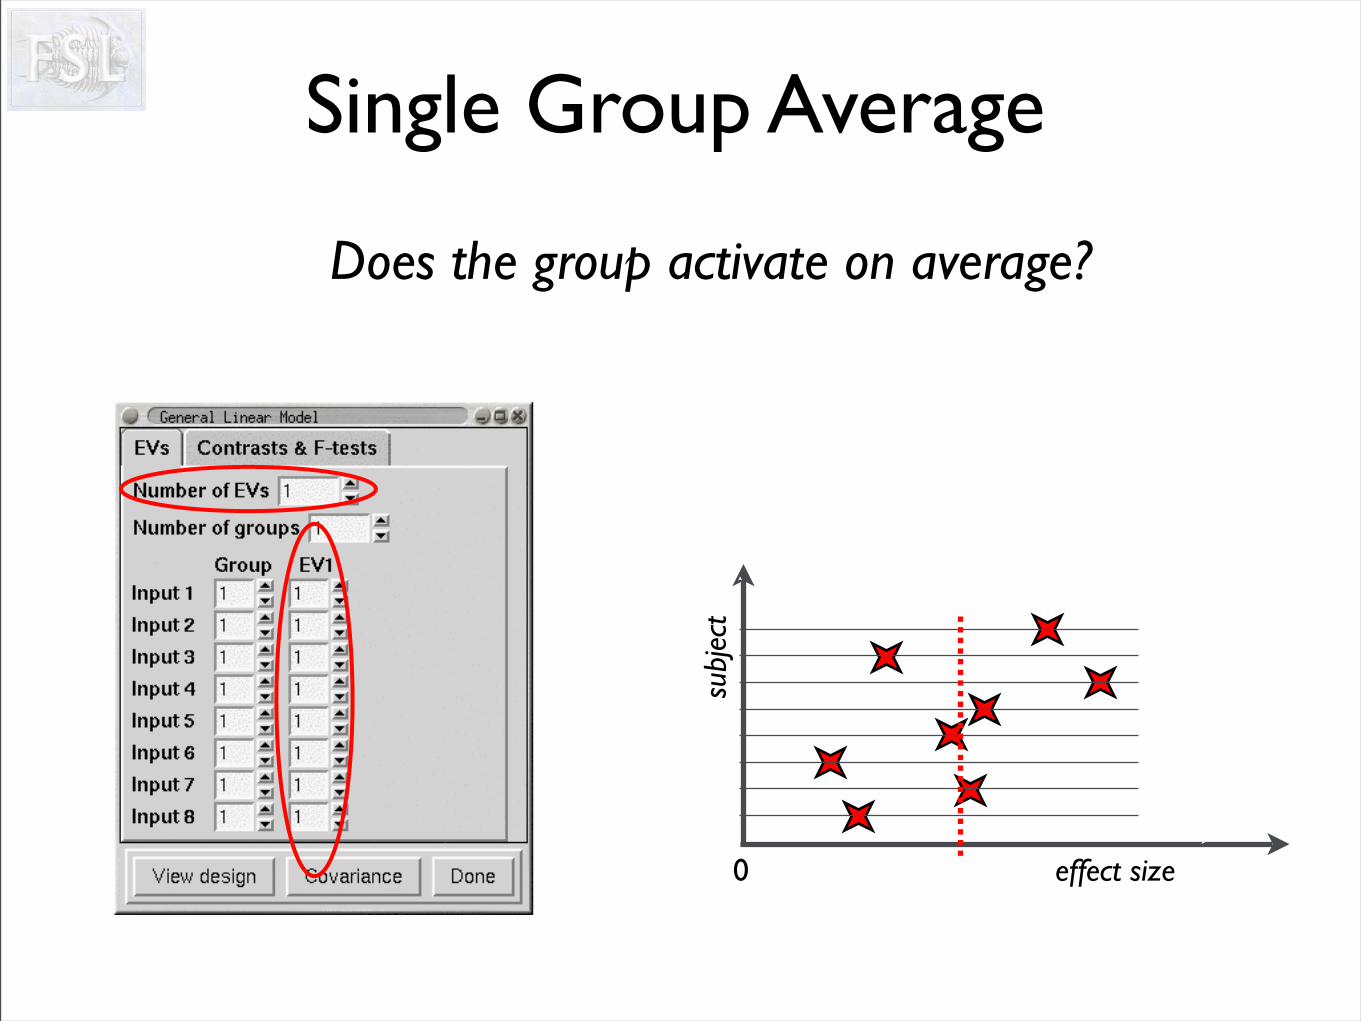
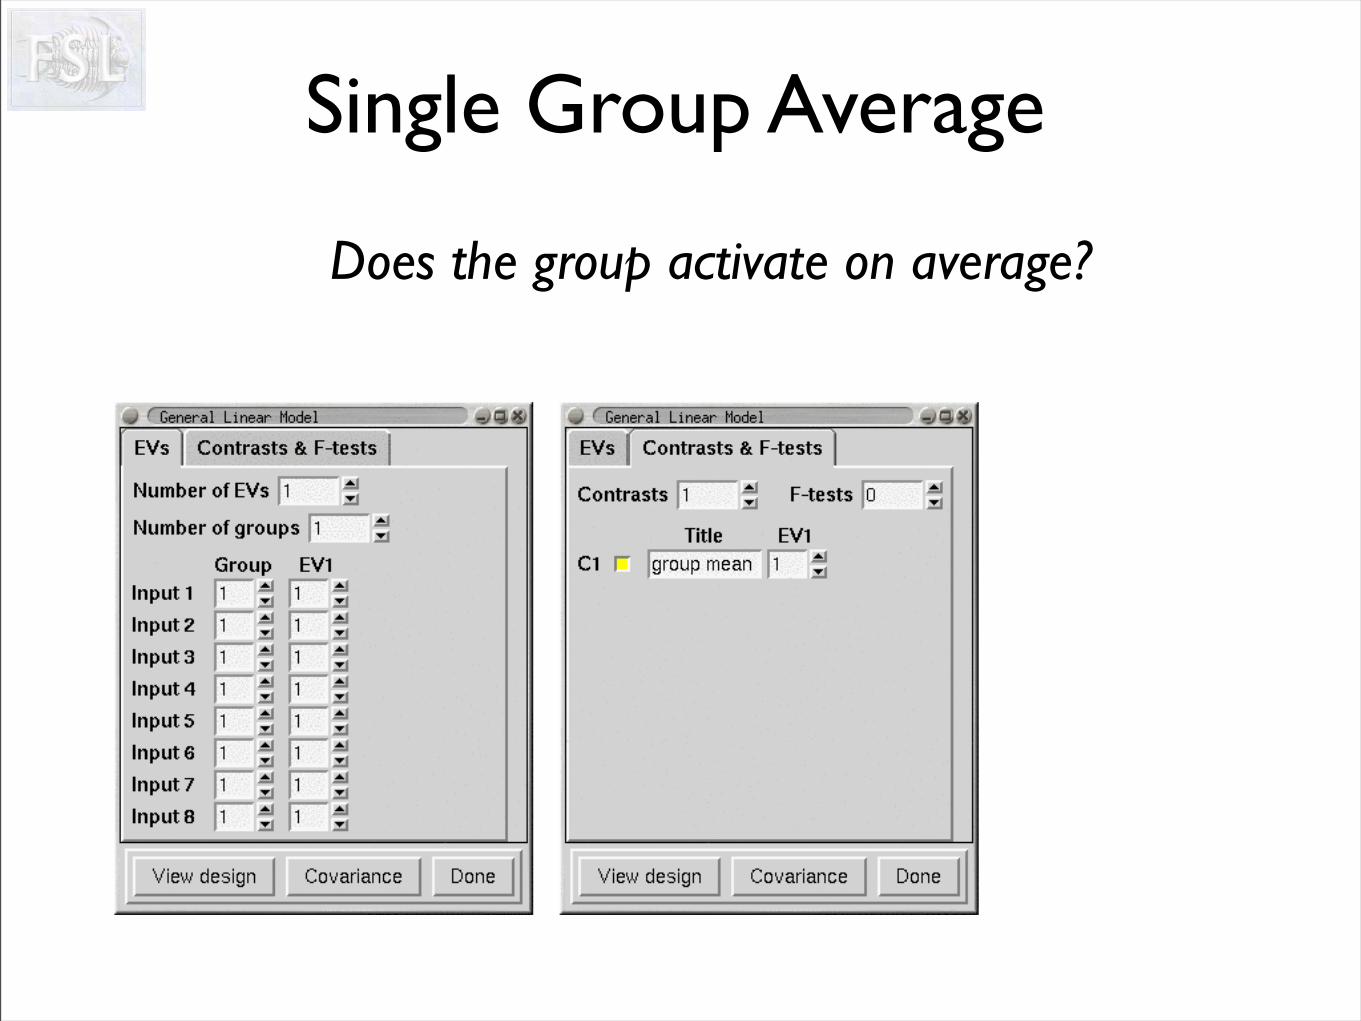
Single Group Average
• We have 8 subjects - all in one group - and want the mean group average:
Does the group activate on average?
• estimate mean
• estimate std-error(FE or ME)
0
subj
ect
effect size
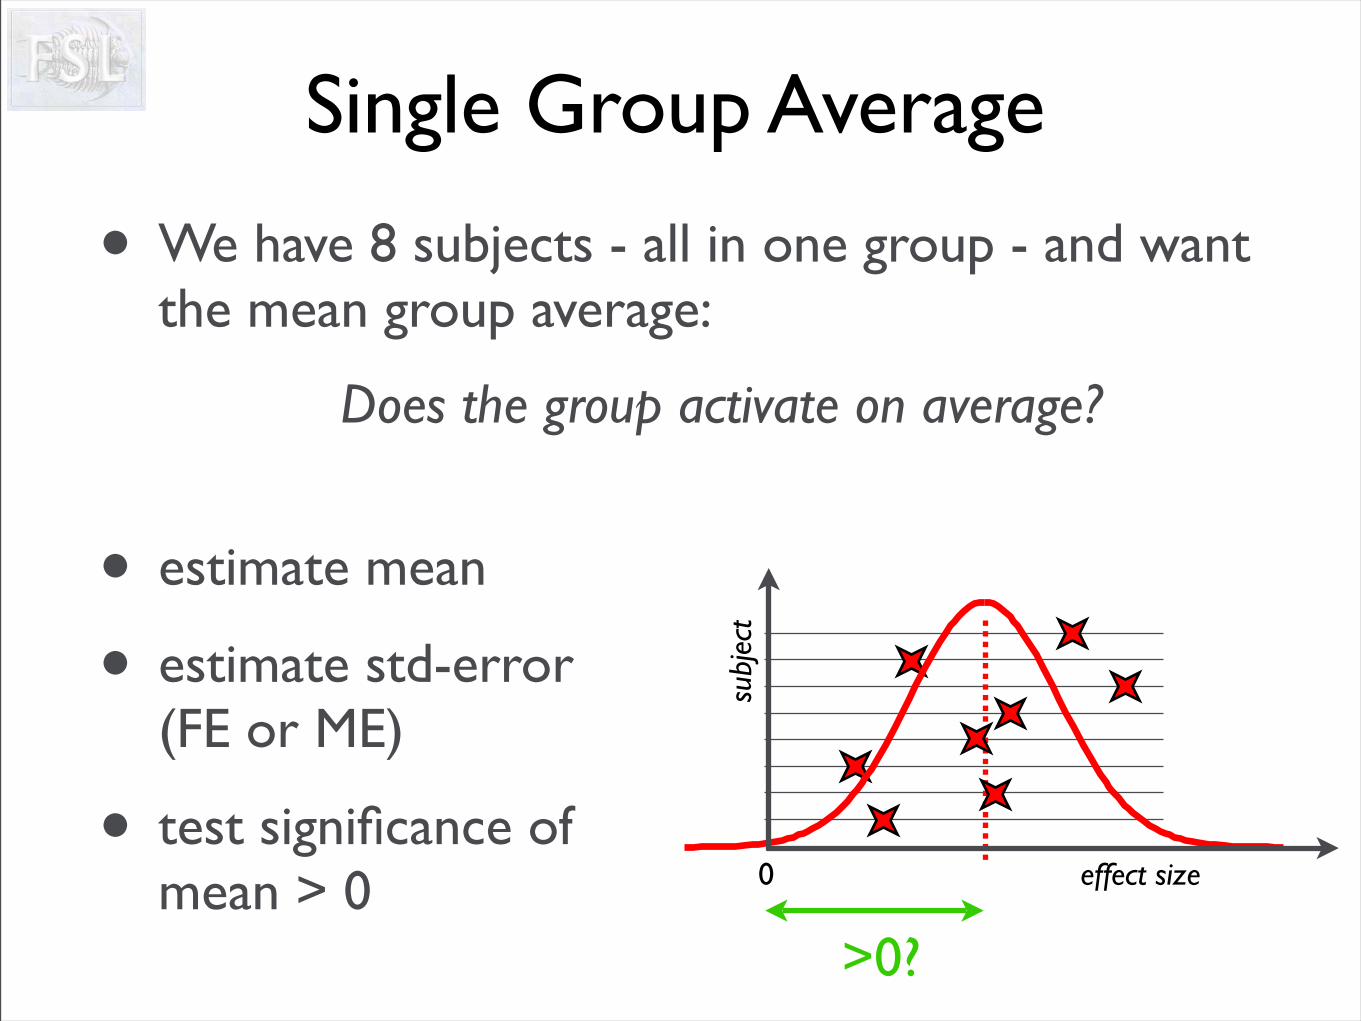
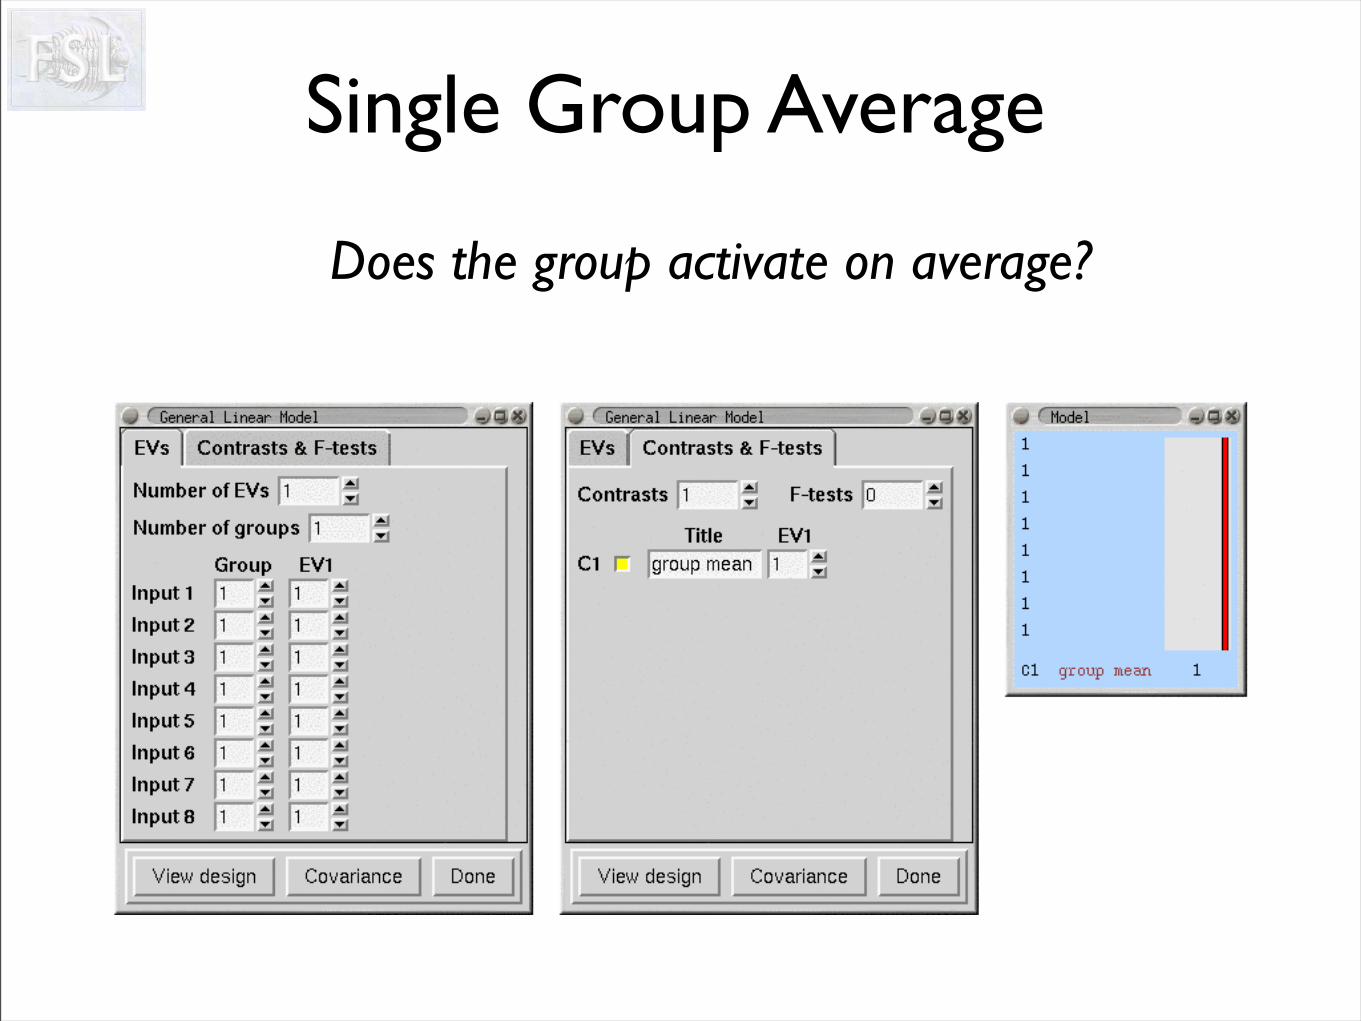
Single Group Average
• We have 8 subjects - all in one group - and want the mean group average:
Does the group activate on average?
• estimate mean
• estimate std-error(FE or ME)
• test significance of mean > 0
>0?
0
subj
ect
effect size
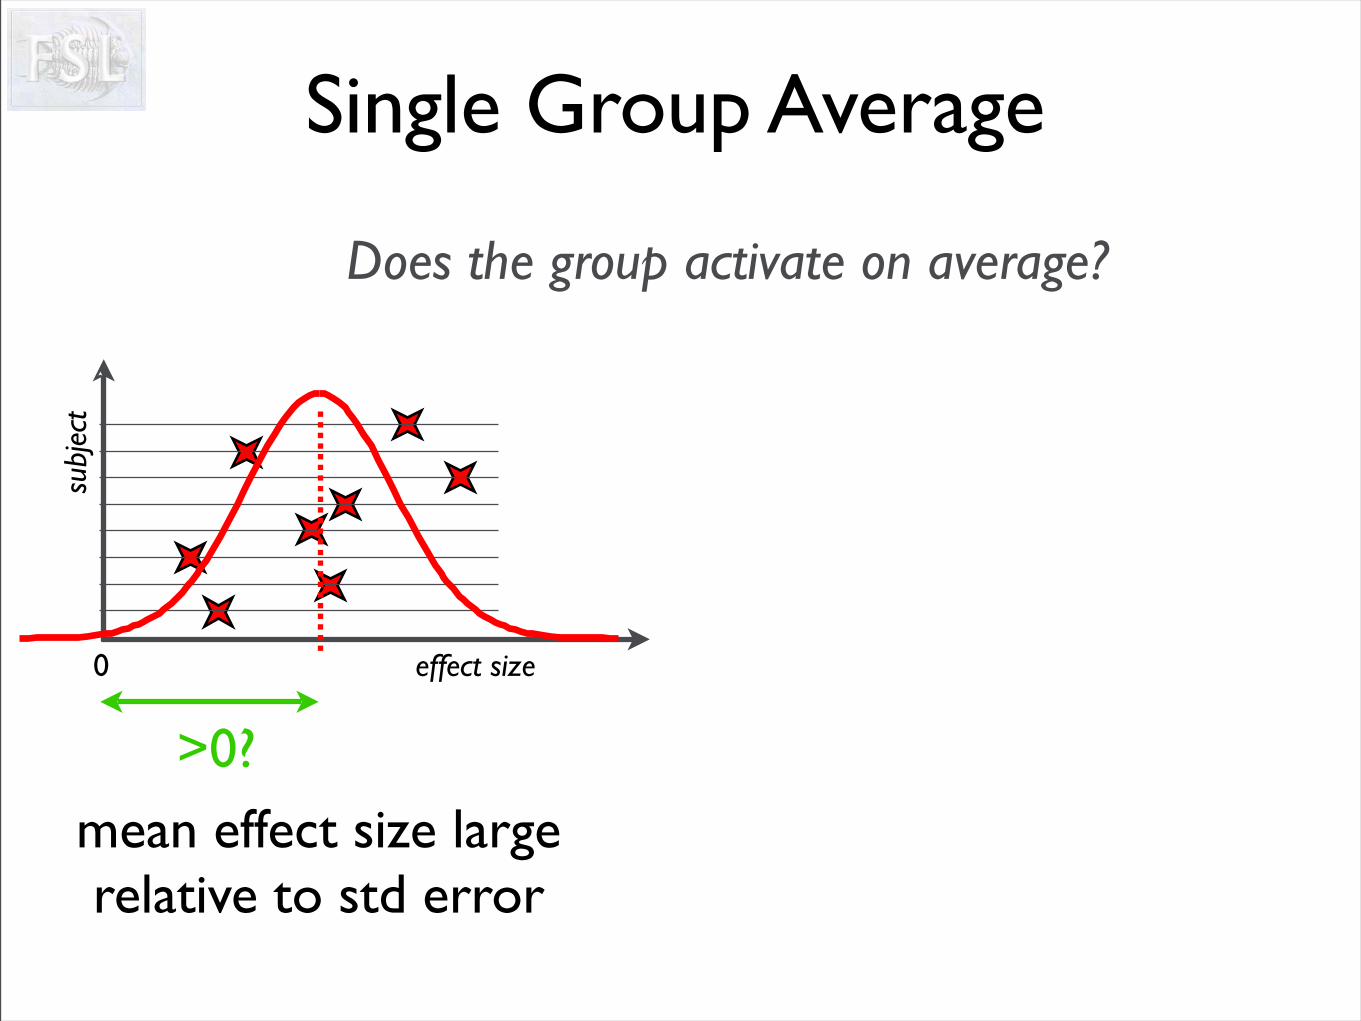
Single Group Average
Does the group activate on average?
mean effect size largerelative to std error
0
subj
ect
effect size
>0?
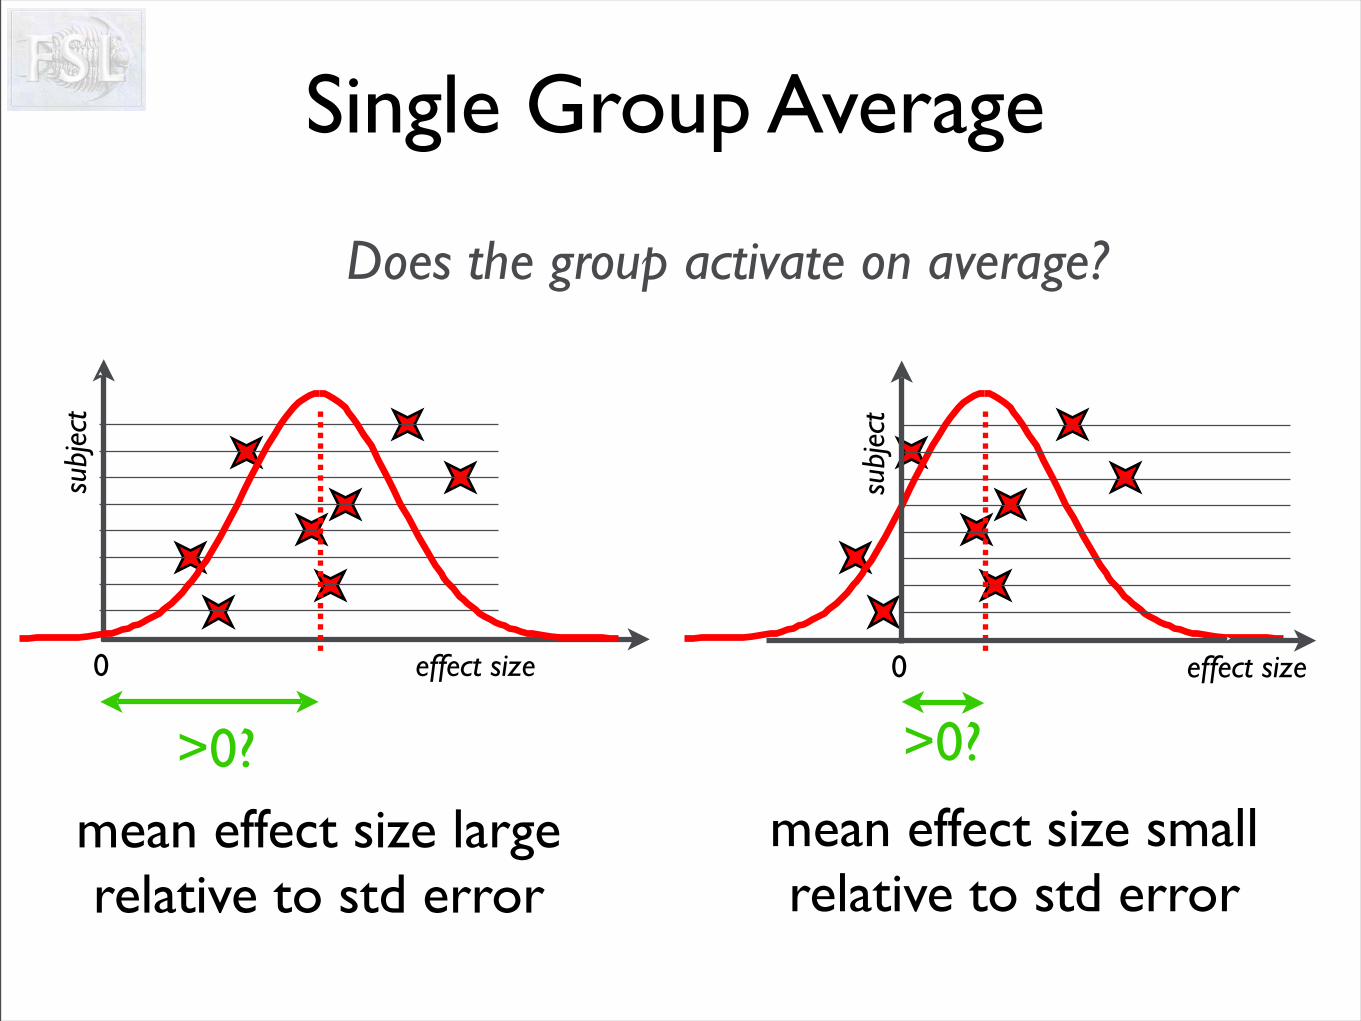
Single Group Average
Does the group activate on average?
mean effect size smallrelative to std error
mean effect size largerelative to std error
0
subj
ect
effect size
>0?
0
subj
ect
effect size
>0?
mean effect size largerelative to std error
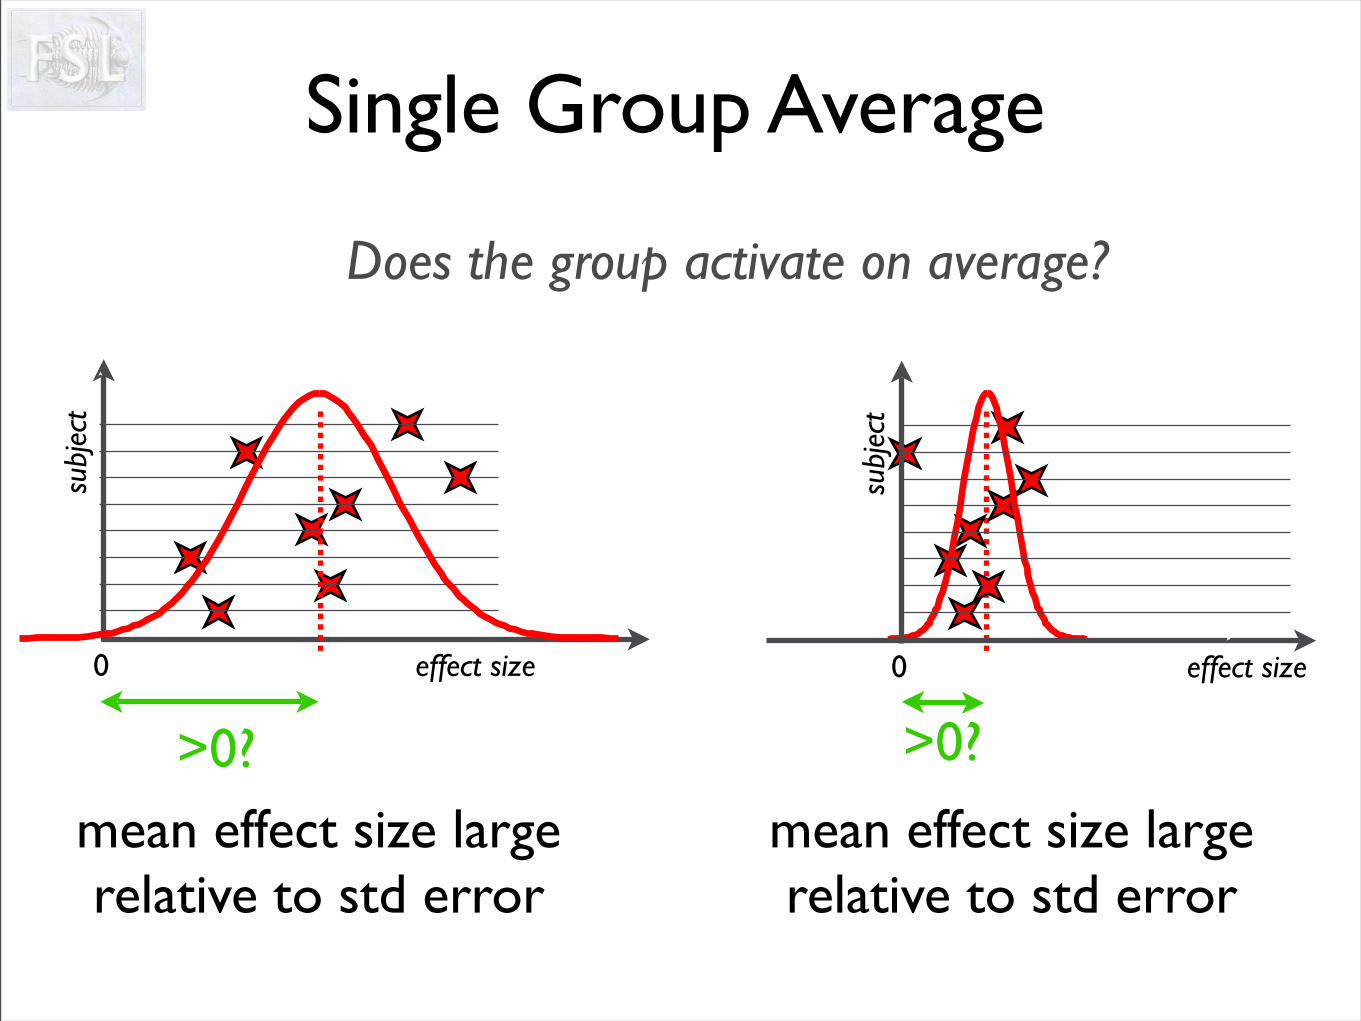
Single Group Average
Does the group activate on average?
mean effect size largerelative to std error
0
subj
ect
effect size
>0?
0
subj
ect
effect size
>0?
Single Group Average
Does the group activate on average?
0
subj
ect
effect size
Single Group Average
Does the group activate on average?
0
subj
ect
effect size
Single Group Average
Does the group activate on average?
0
subj
ect
effect size
Single Group Average
Does the group activate on average?
Single Group Average
Does the group activate on average?
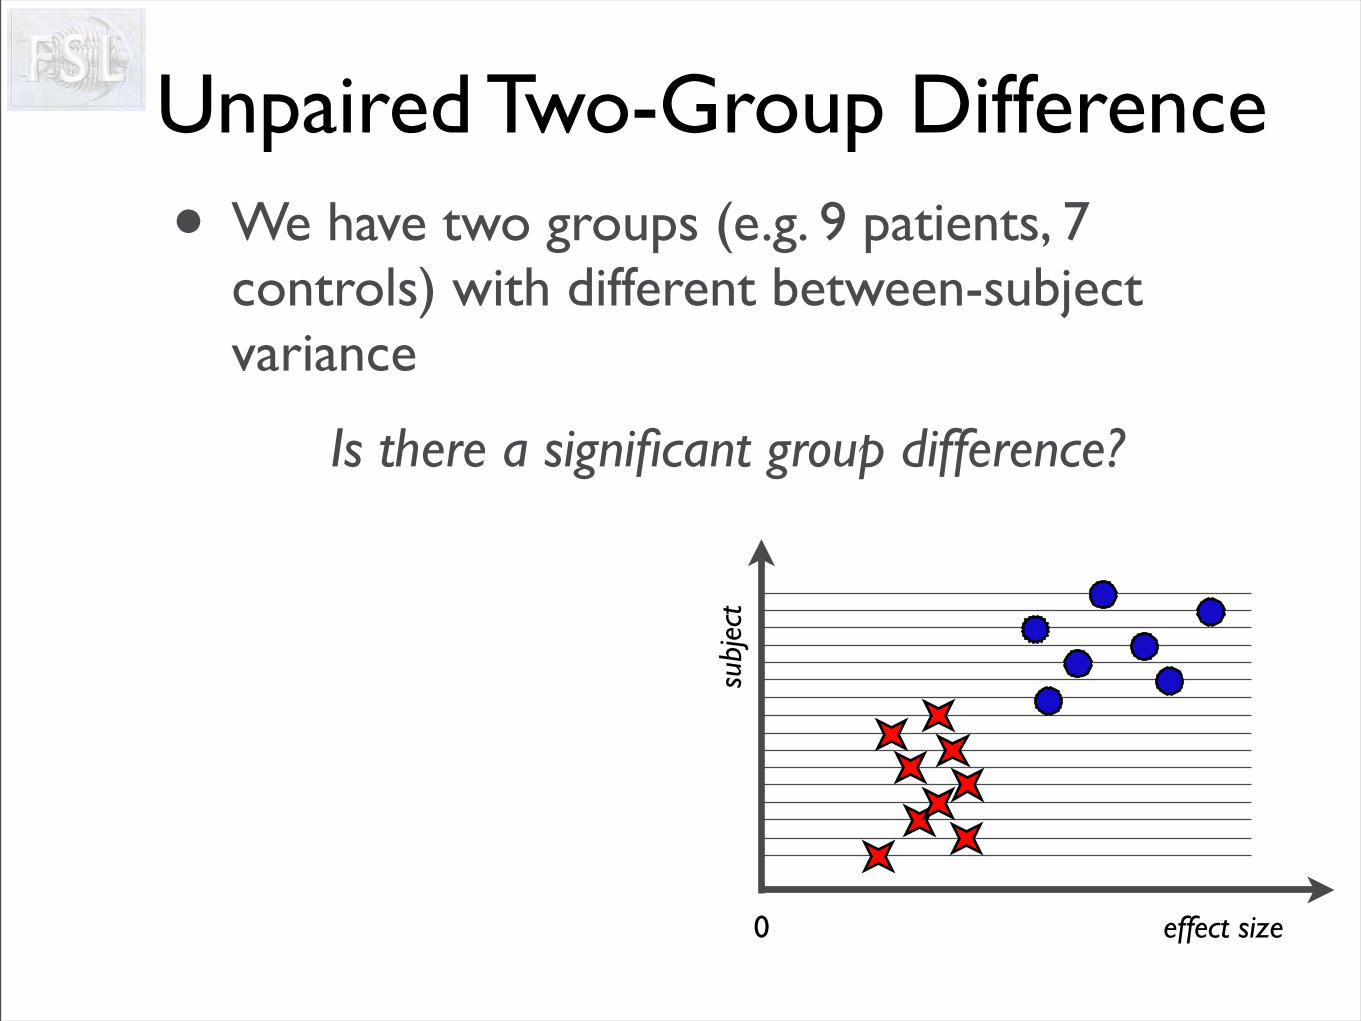
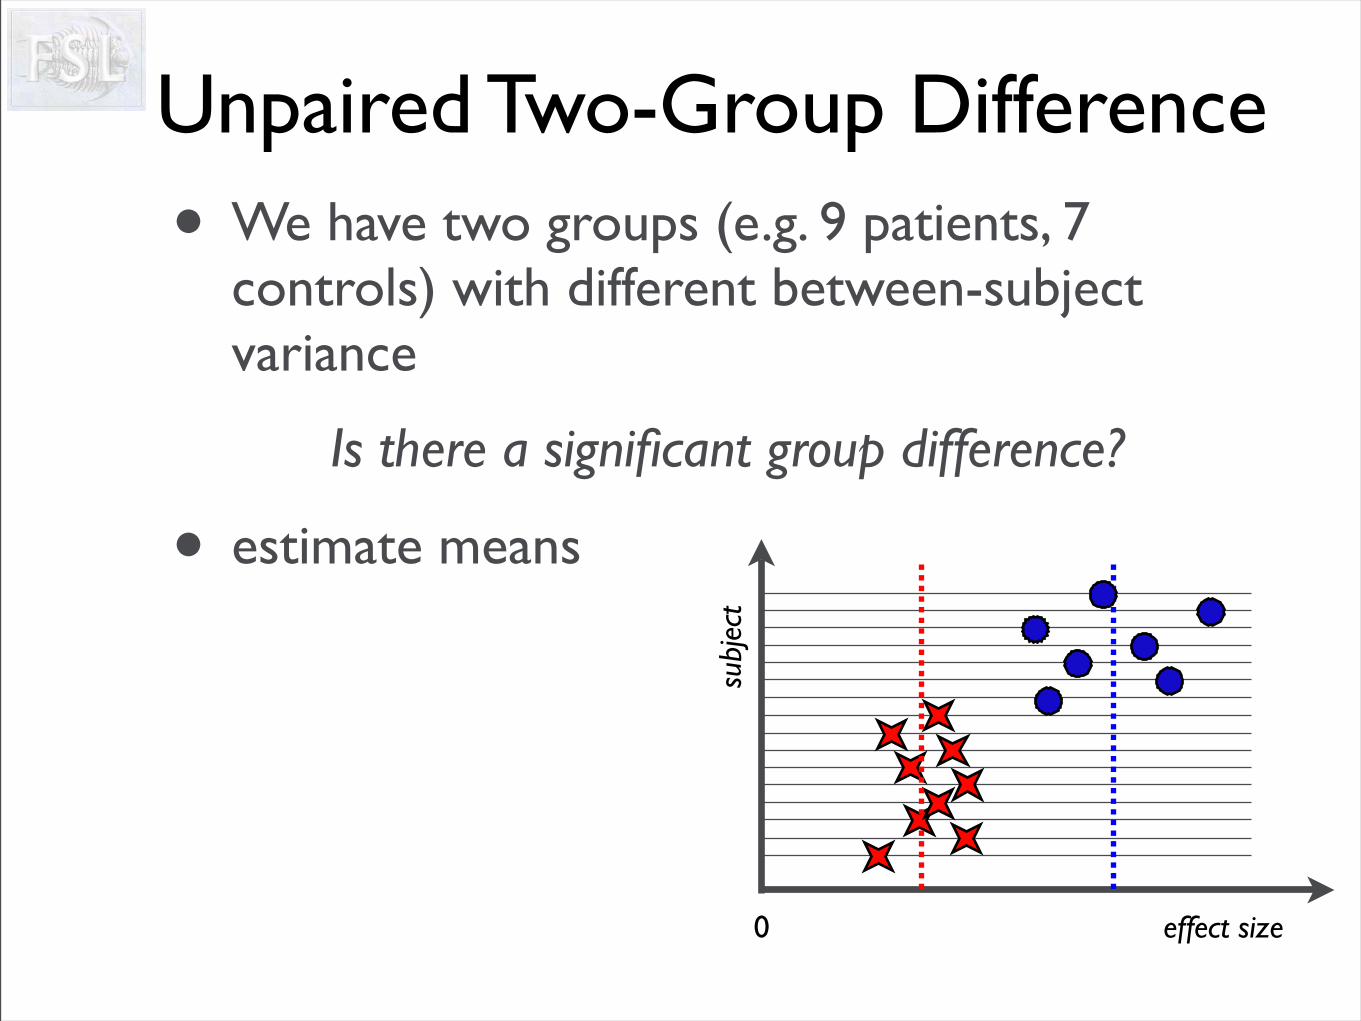
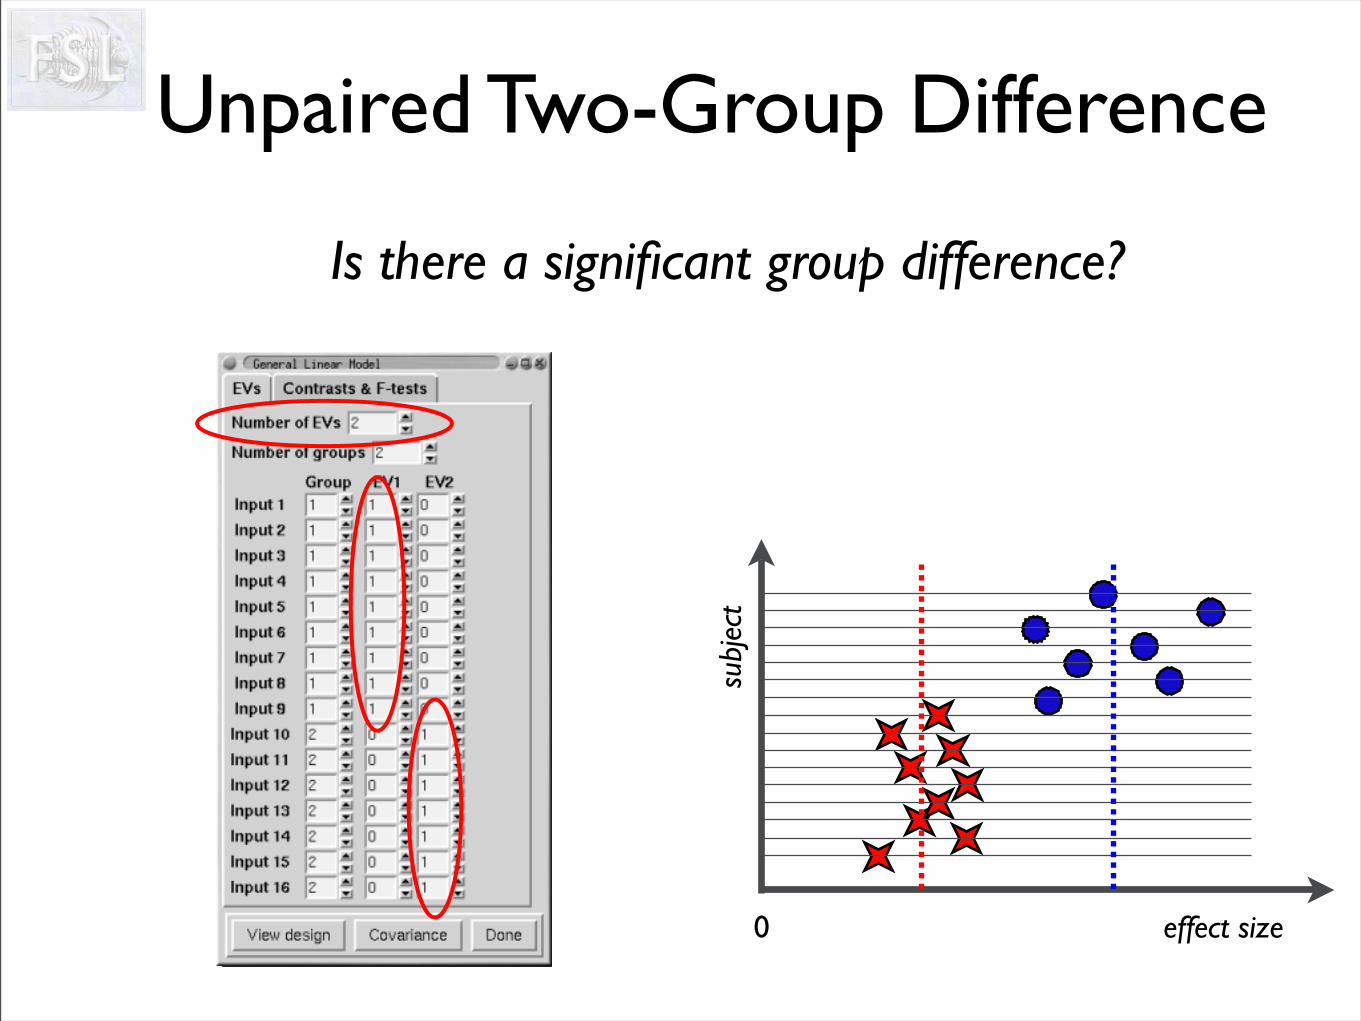
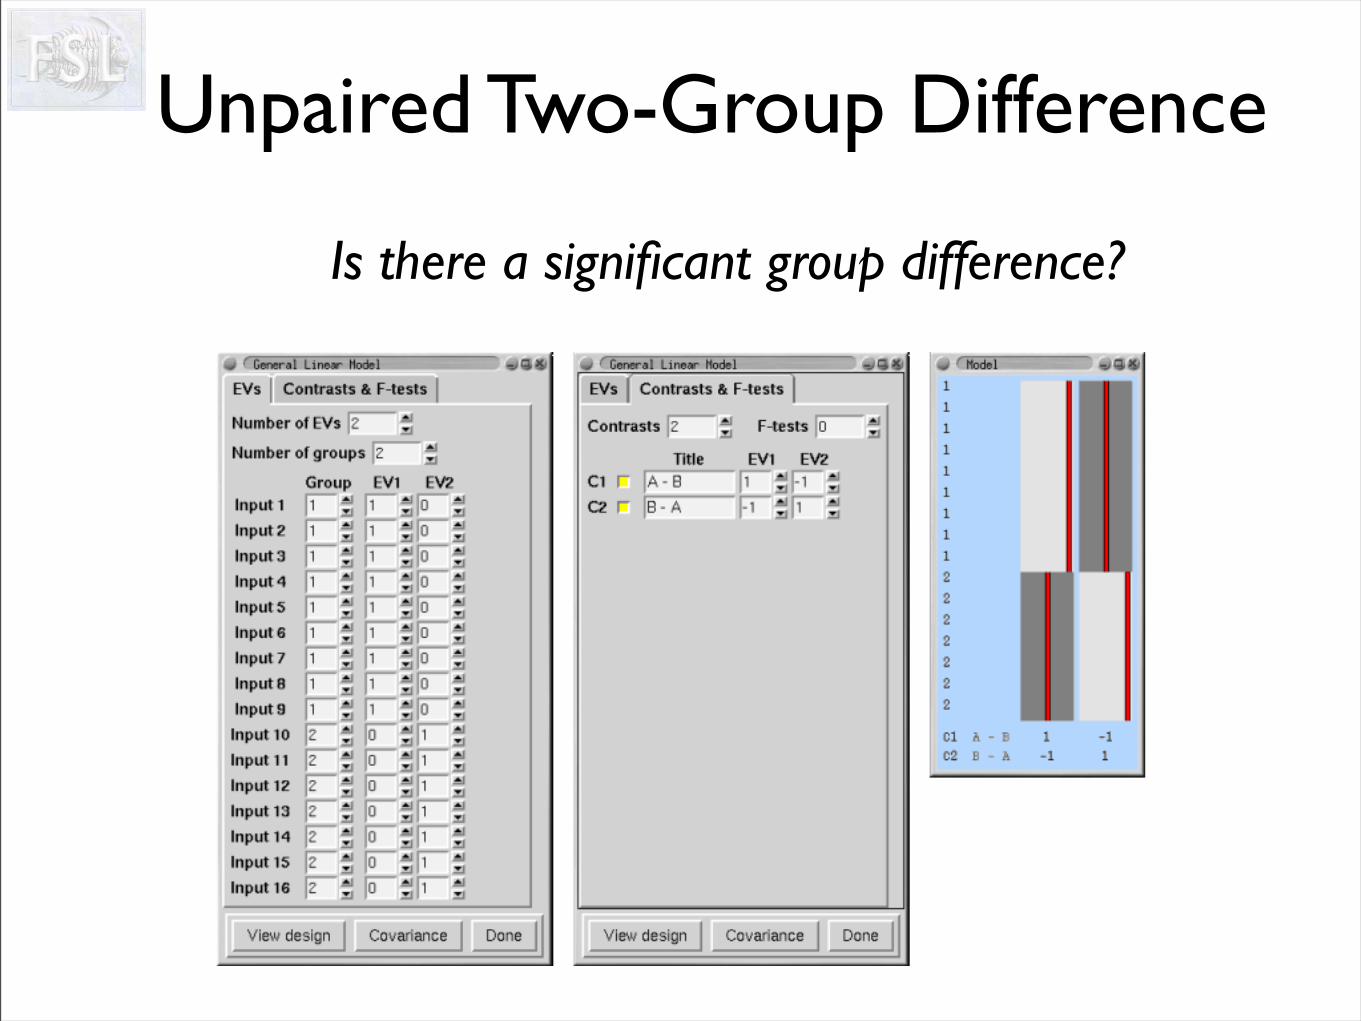
Unpaired Two-Group Difference• We have two groups (e.g. 9 patients, 7
controls) with different between-subject variance
Is there a significant group difference?
0
subj
ect
effect size
Unpaired Two-Group Difference• We have two groups (e.g. 9 patients, 7
controls) with different between-subject variance
Is there a significant group difference?
• estimate means
0
subj
ect
effect size
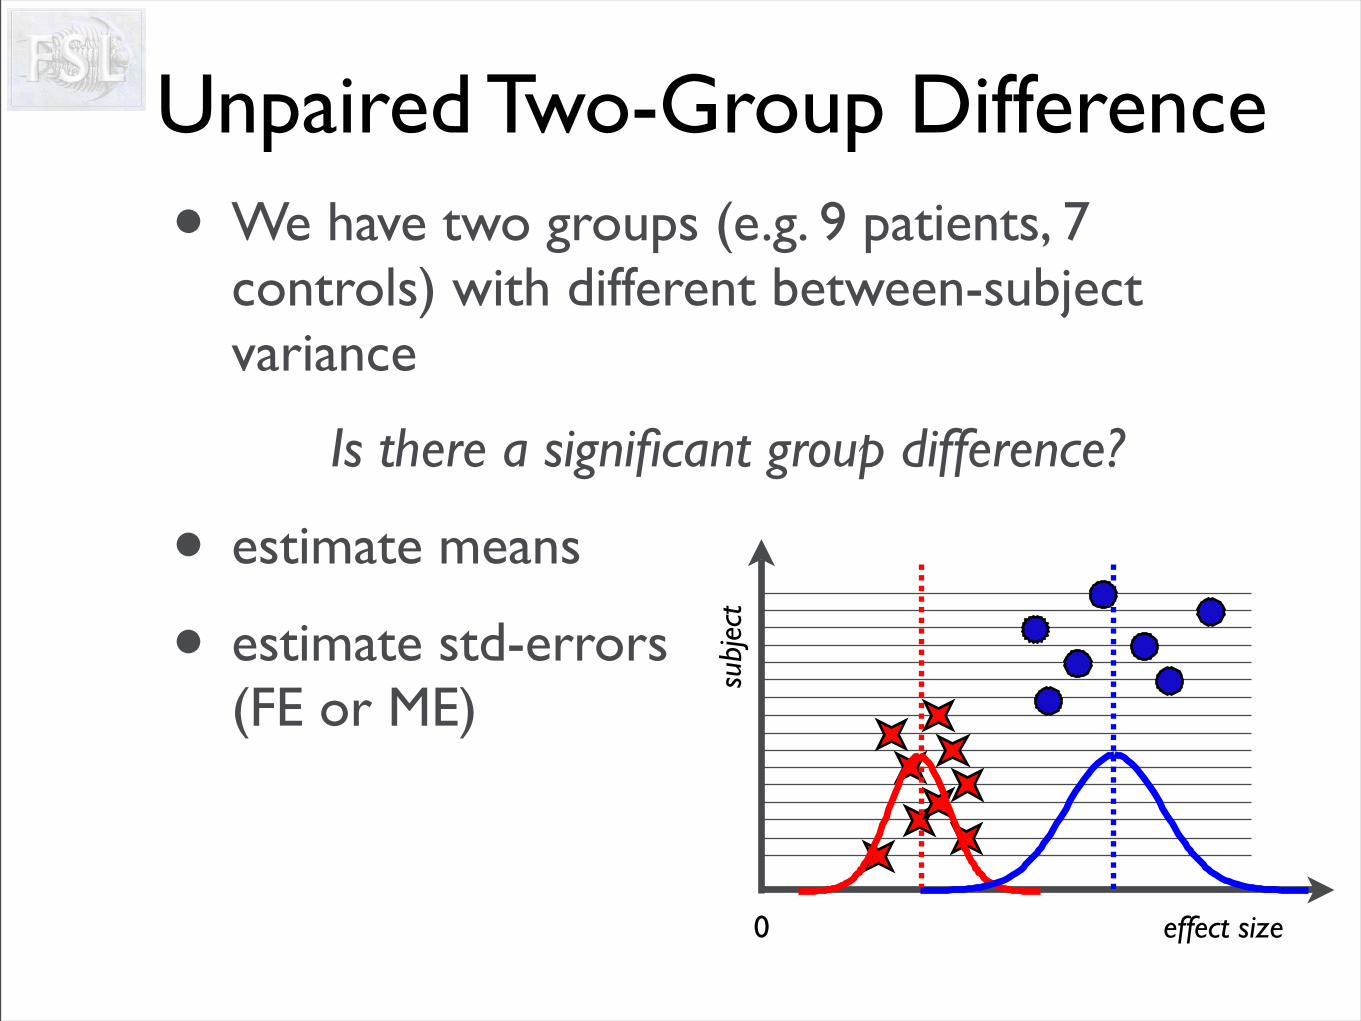
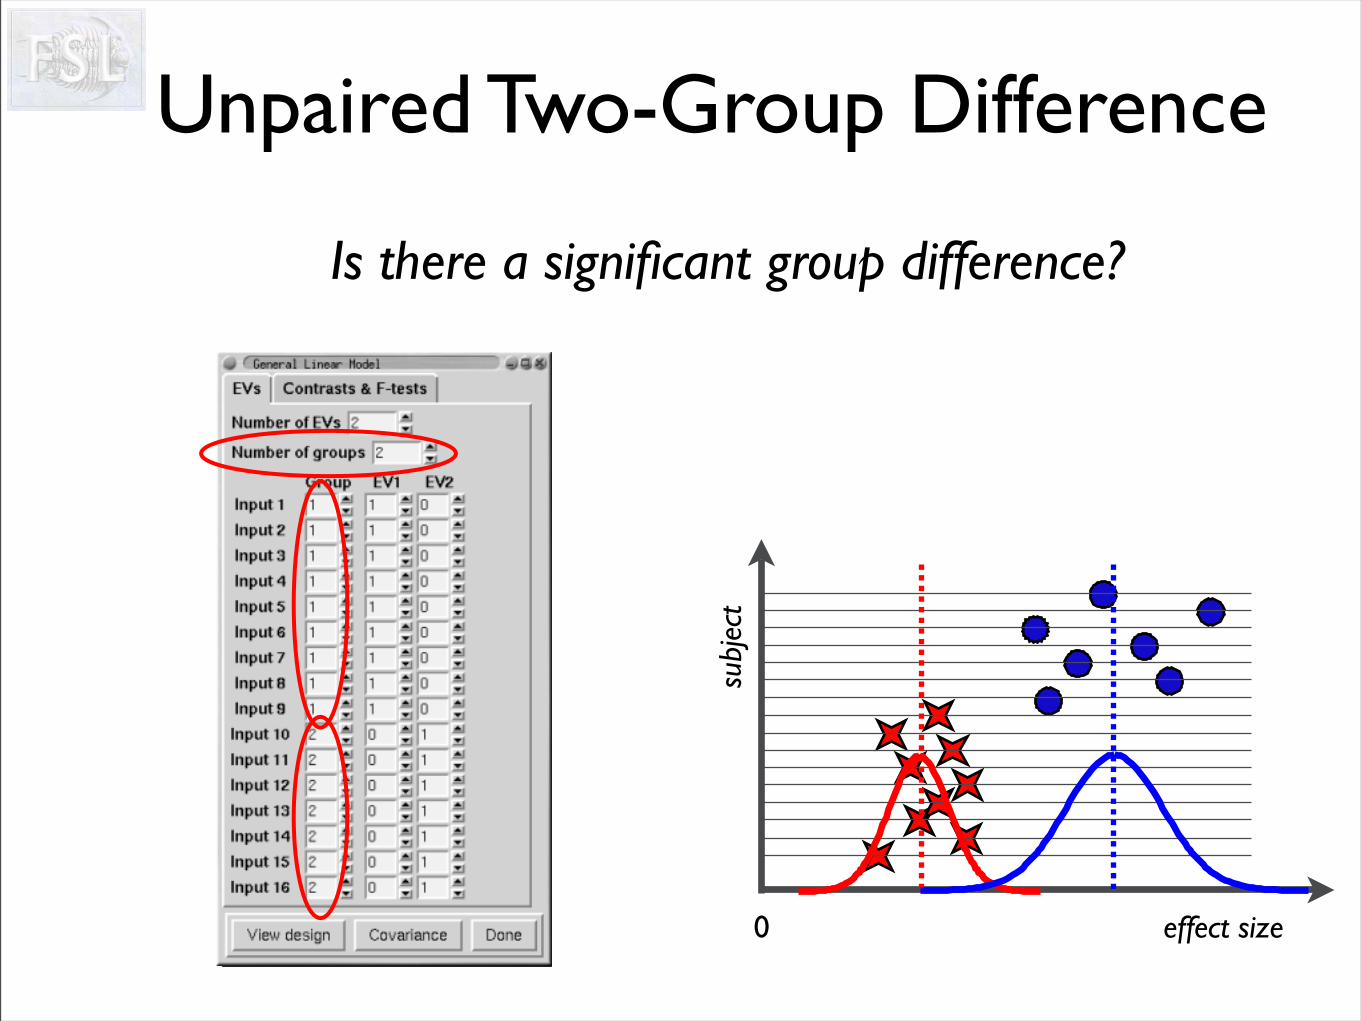
Unpaired Two-Group Difference• We have two groups (e.g. 9 patients, 7
controls) with different between-subject variance
Is there a significant group difference?
• estimate means
• estimate std-errors(FE or ME)
0
subj
ect
effect size
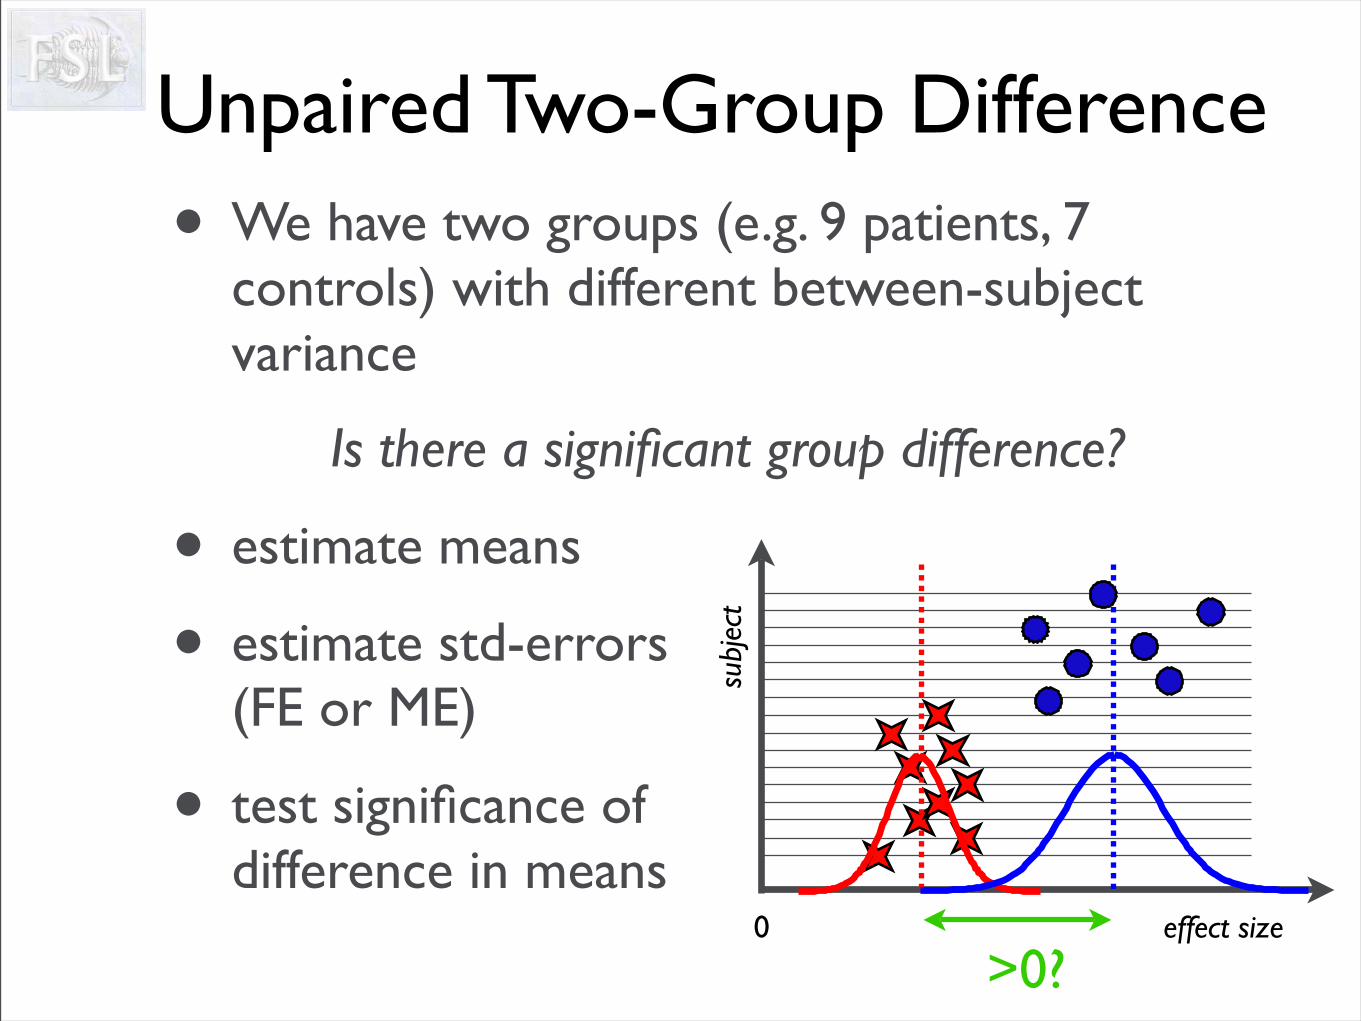
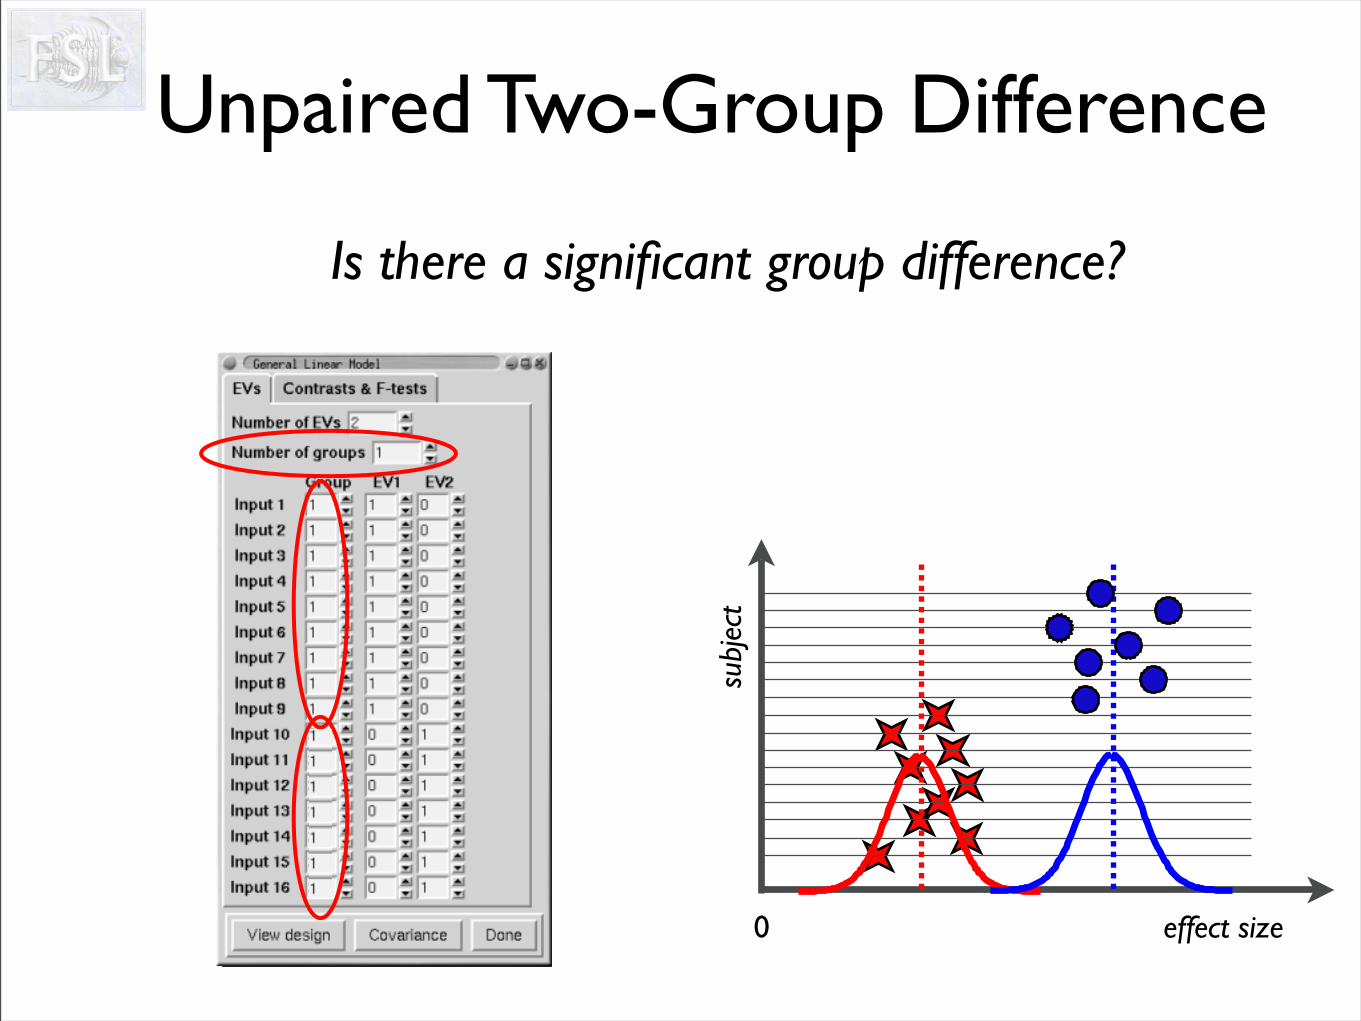
Unpaired Two-Group Difference• We have two groups (e.g. 9 patients, 7
controls) with different between-subject variance
Is there a significant group difference?
• estimate means
• estimate std-errors(FE or ME)
• test significance of difference in means
>0?0
subj
ect
effect size
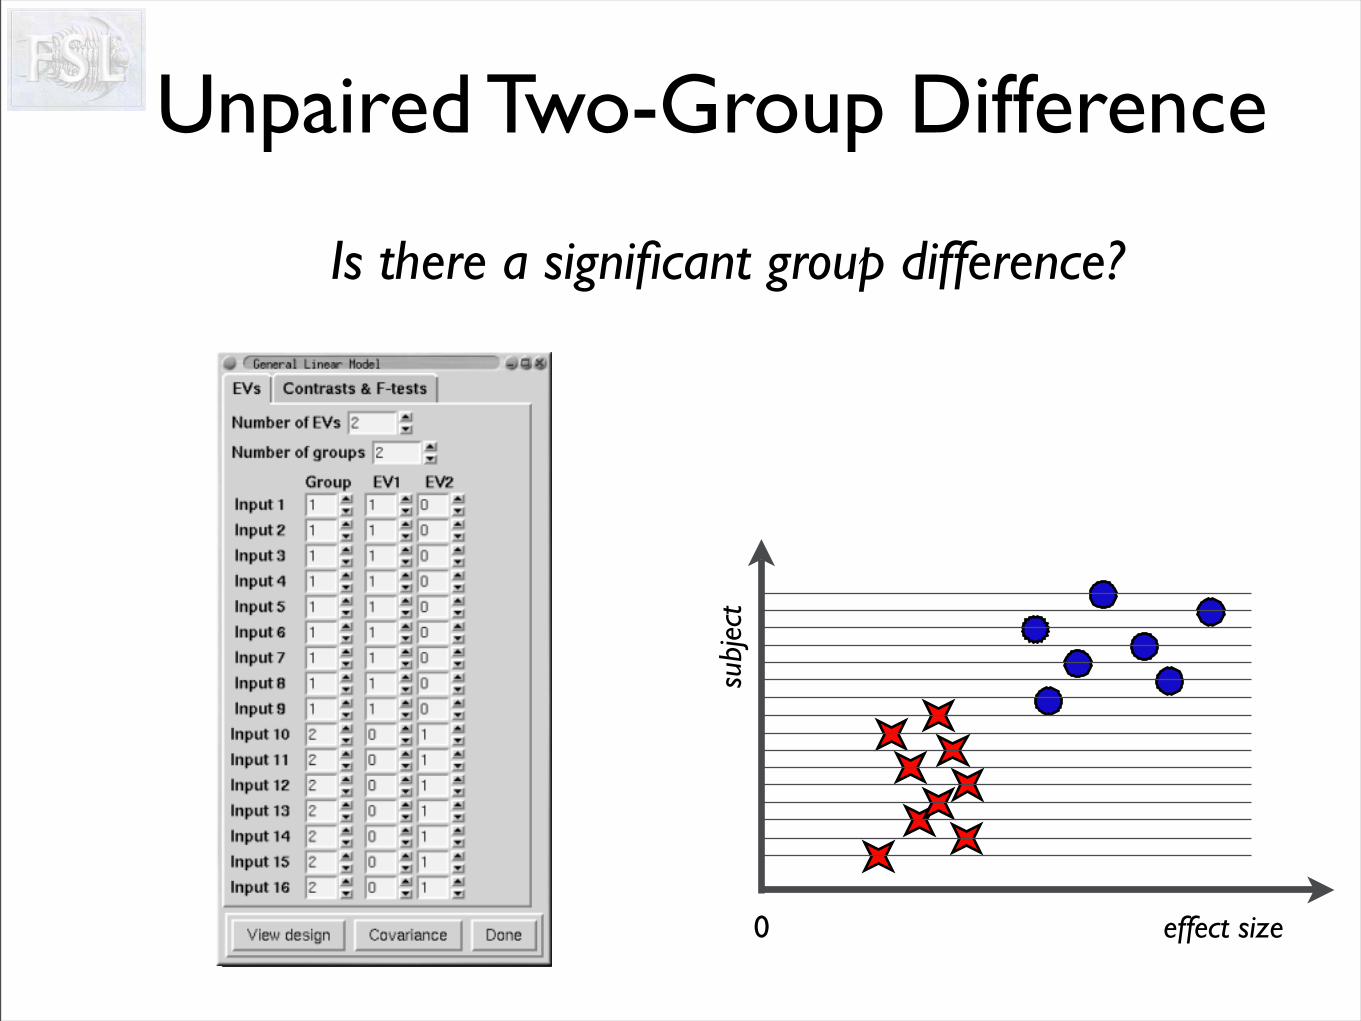
Unpaired Two-Group Difference
Is there a significant group difference?
0
subj
ect
effect size
Unpaired Two-Group Difference
Is there a significant group difference?
0
subj
ect
effect size
Unpaired Two-Group Difference
Is there a significant group difference?
0
subj
ect
effect size
Unpaired Two-Group Difference
Is there a significant group difference?
0
subj
ect
effect size
Unpaired Two-Group Difference
Is there a significant group difference?
Unpaired Two-Group Difference
Is there a significant group difference?
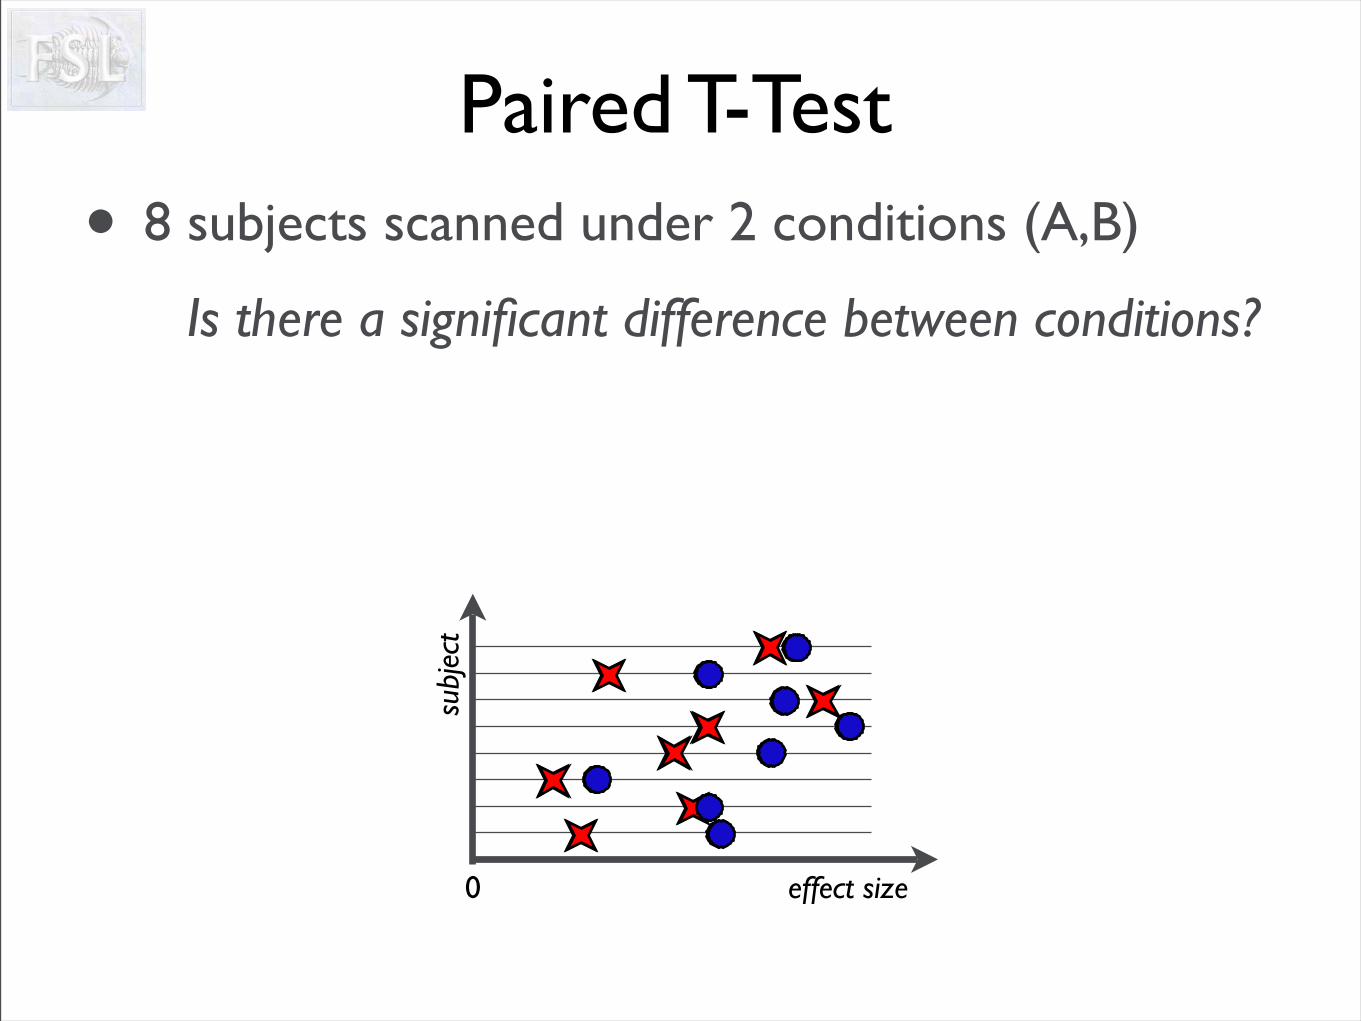
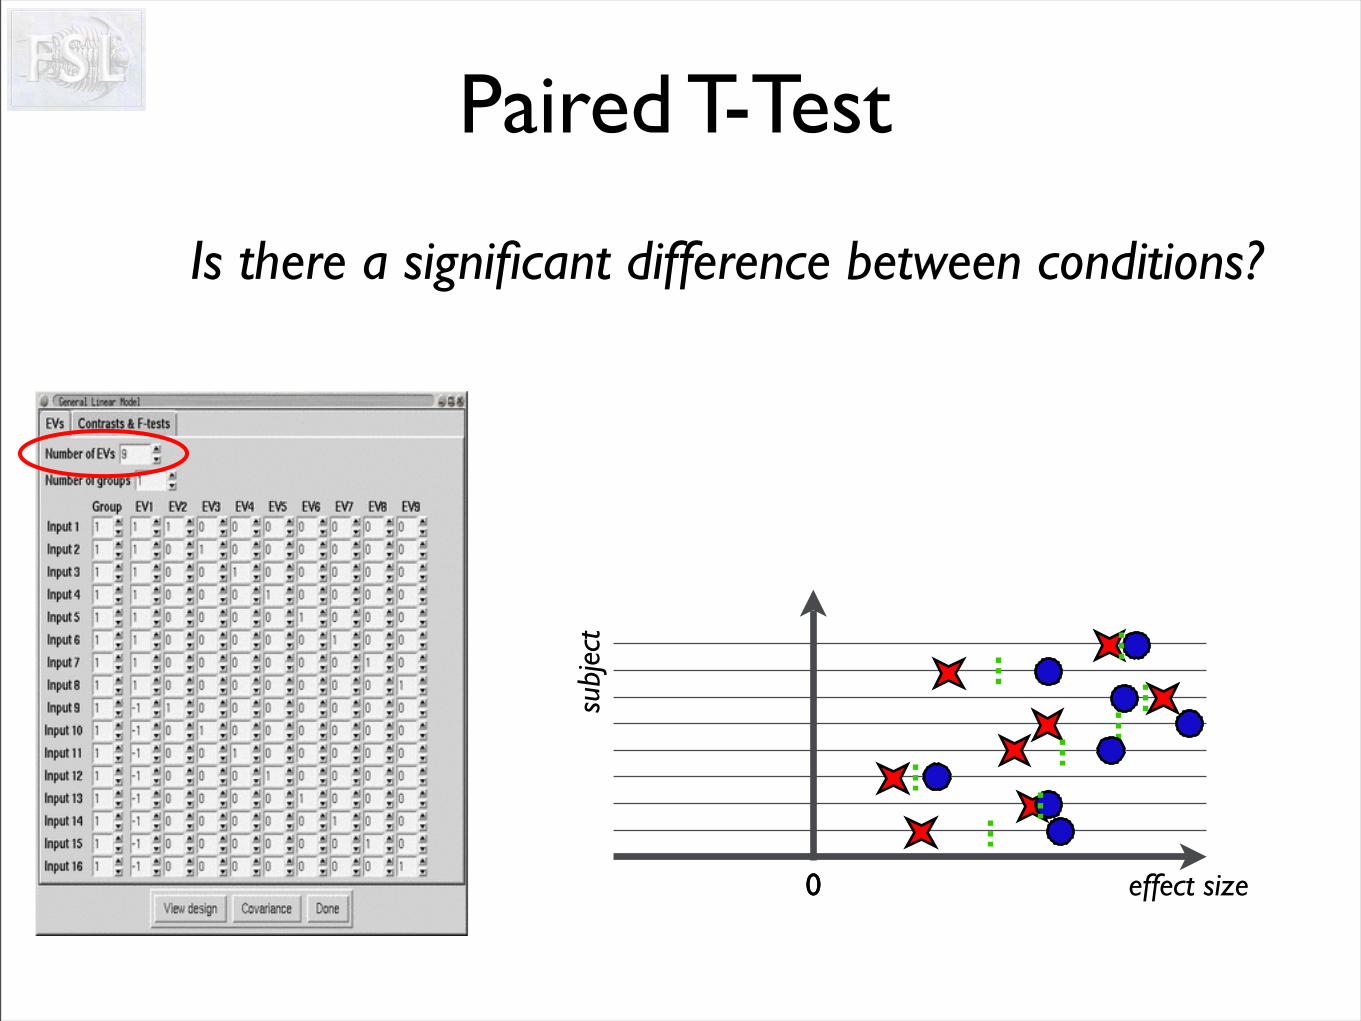
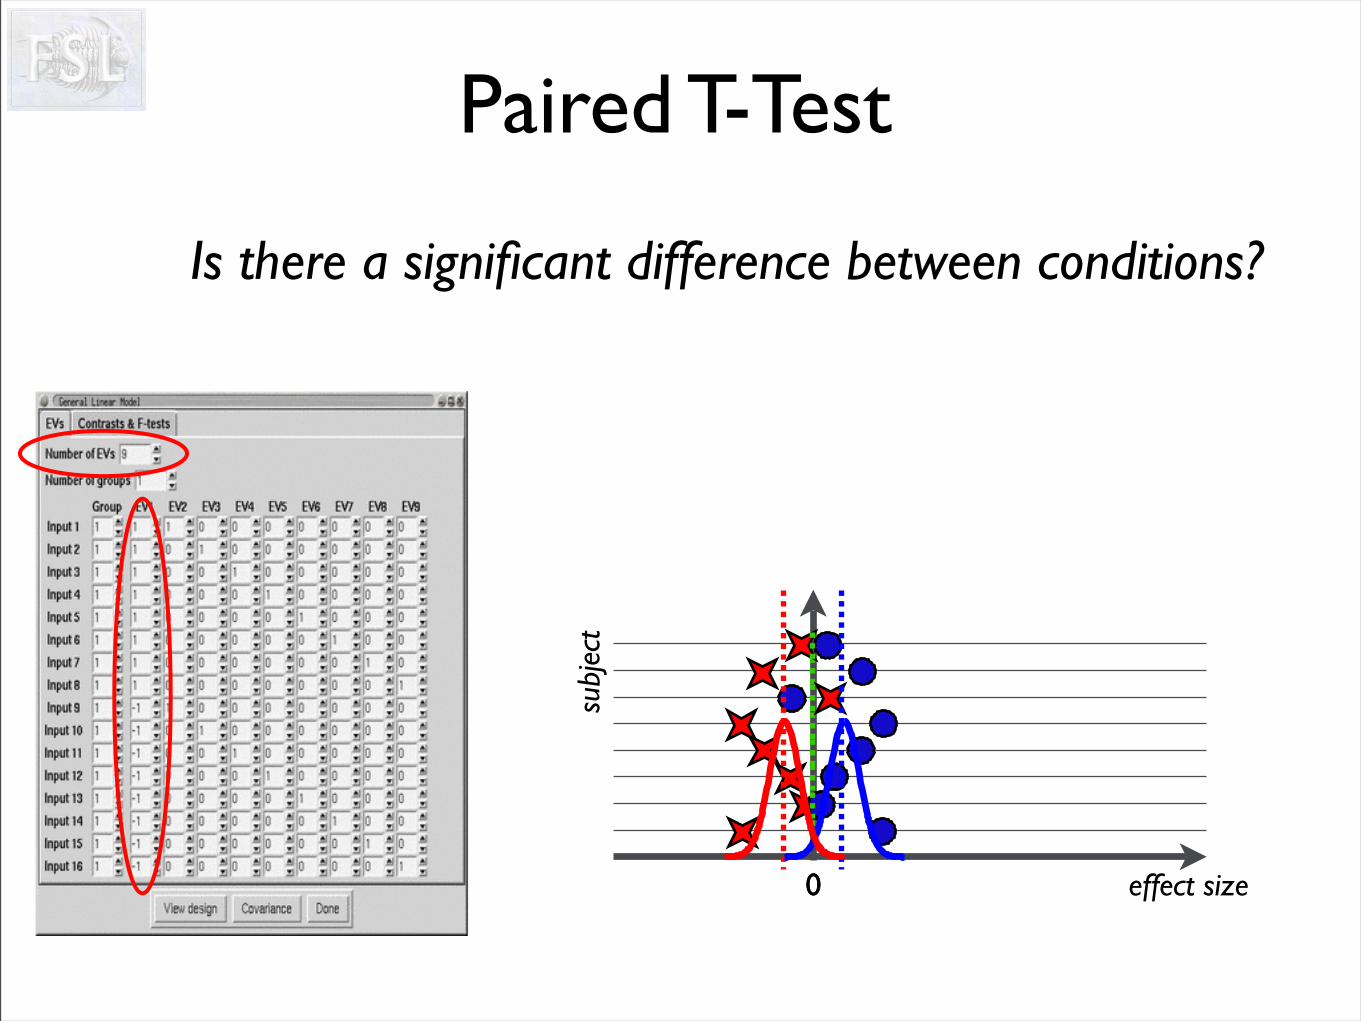
Paired T-Test• 8 subjects scanned under 2 conditions (A,B)
Is there a significant difference between conditions?
0
subj
ect
effect size

Paired T-Test• 8 subjects scanned under 2 conditions (A,B)
Is there a significant difference between conditions?
0
subj
ect
effect size
>0?
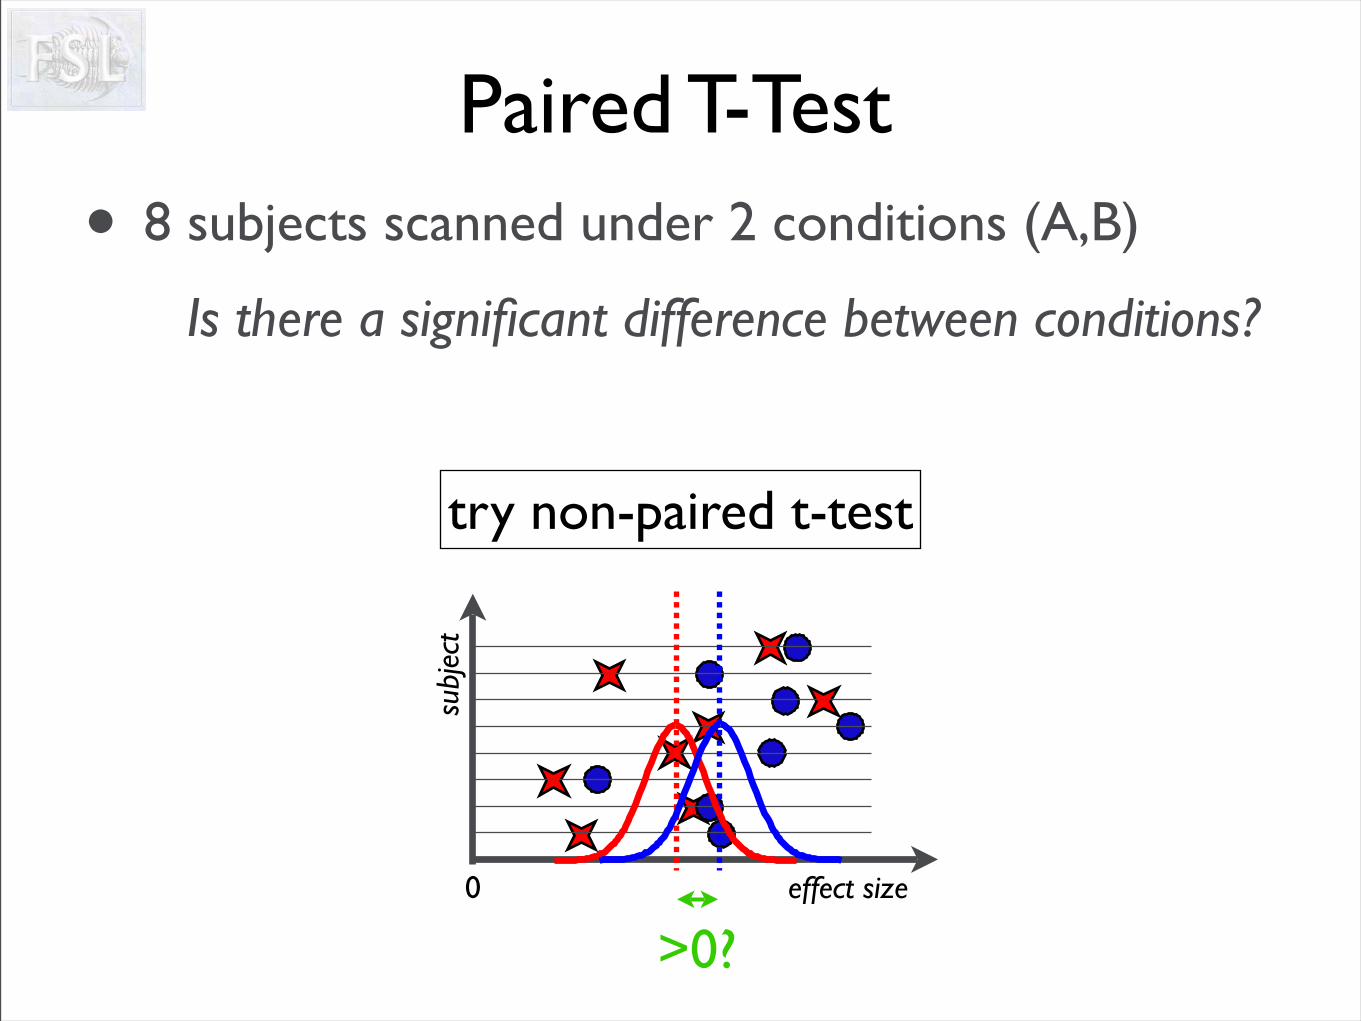
Paired T-Test• 8 subjects scanned under 2 conditions (A,B)
Is there a significant difference between conditions?
0
subj
ect
effect size
try non-paired t-test
• 8 subjects scanned under 2 conditions (A,B)
Is there a significant difference between conditions?
data
0
subj
ect
effect size
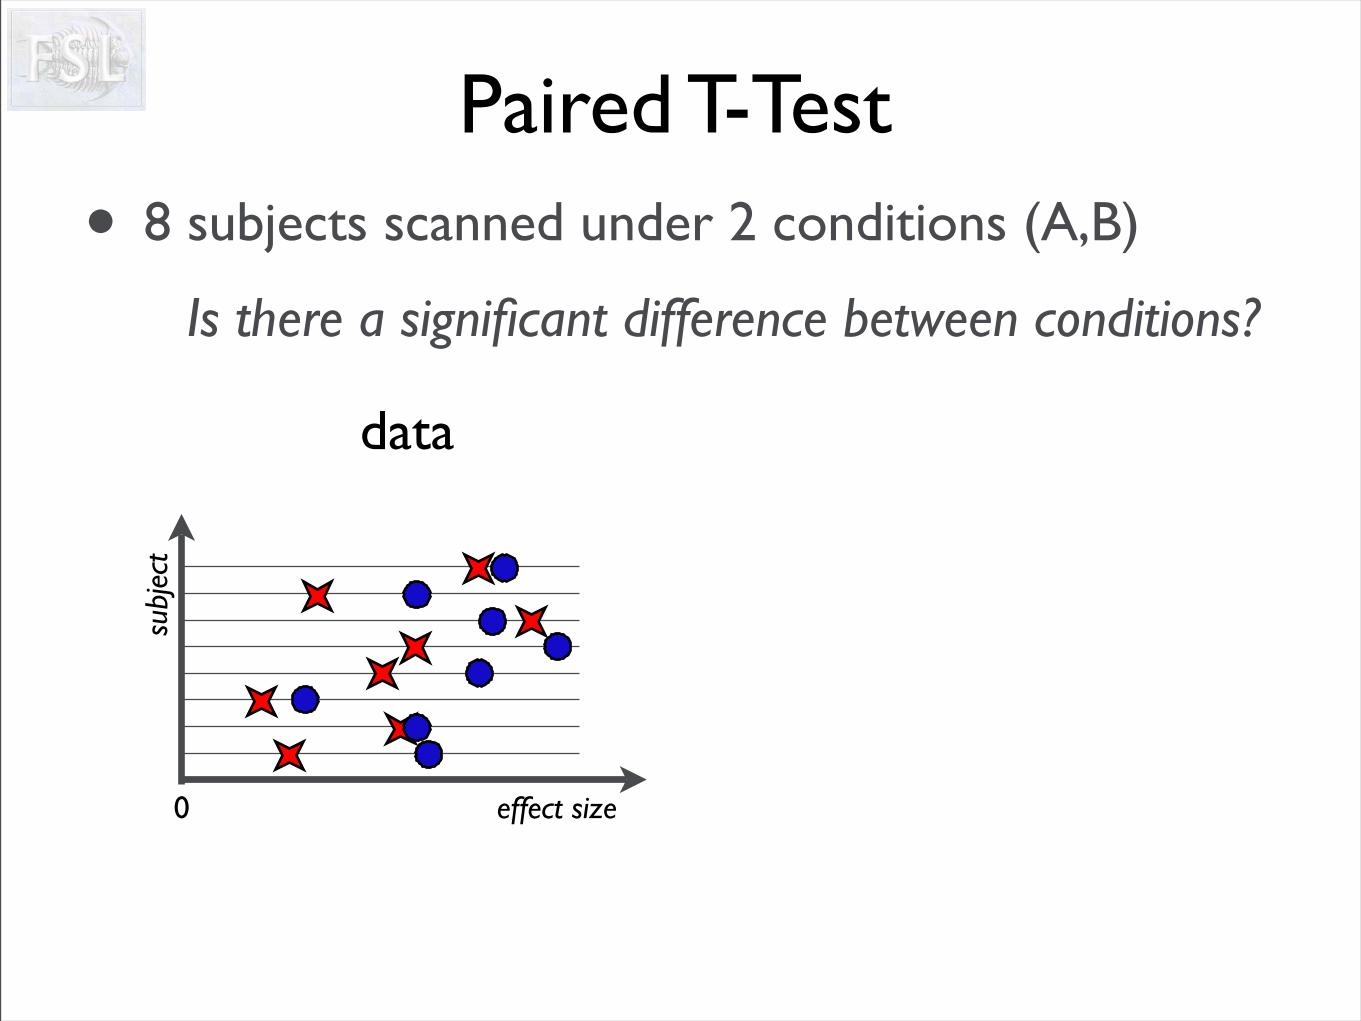
Paired T-Test
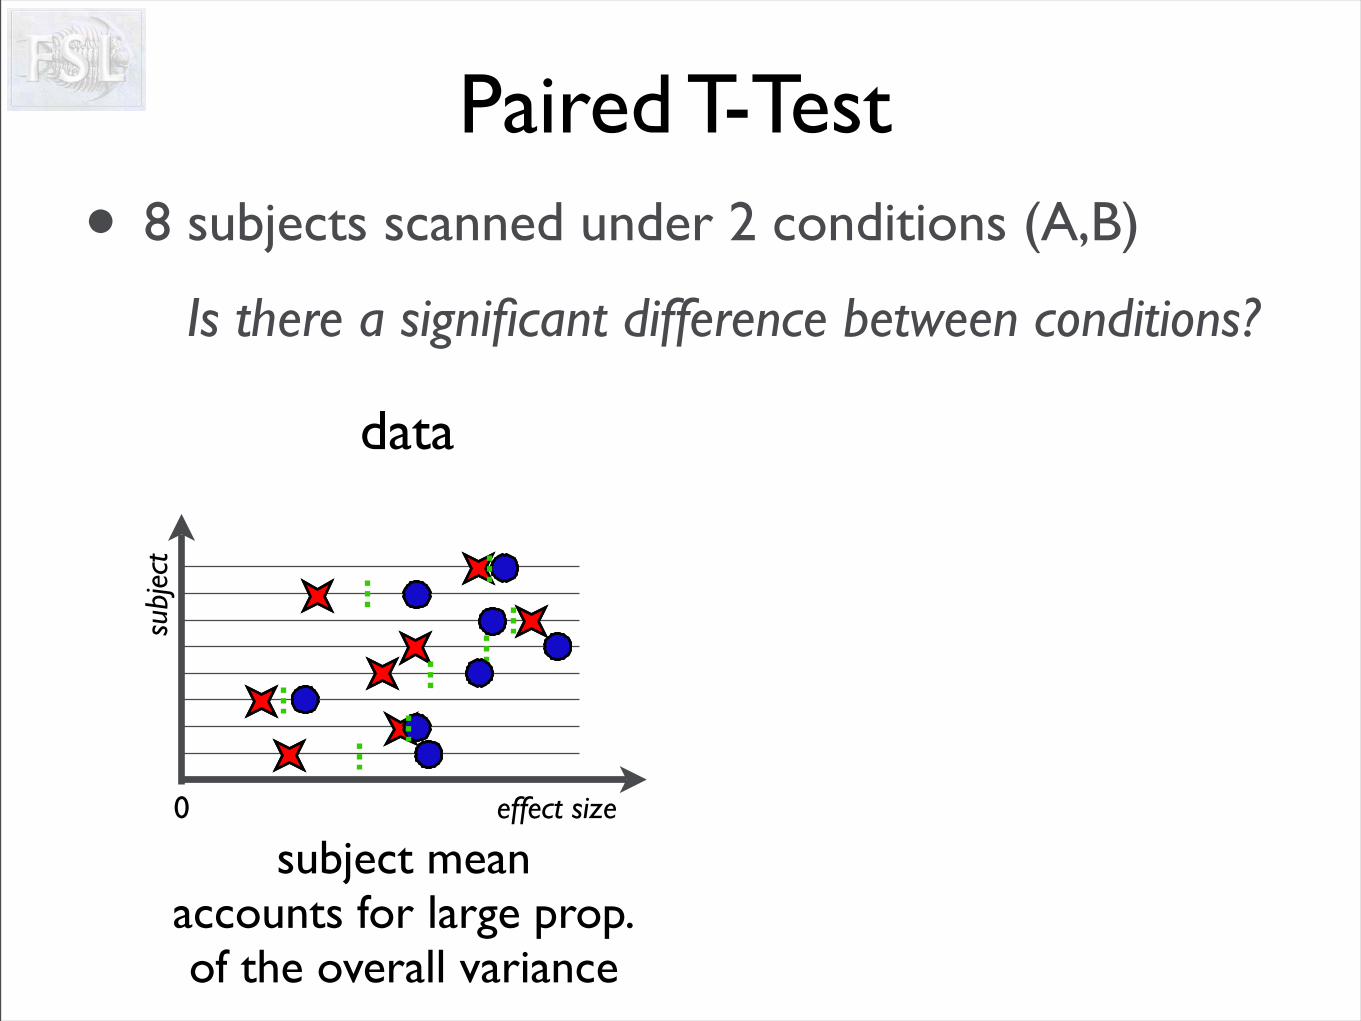
• 8 subjects scanned under 2 conditions (A,B)
Is there a significant difference between conditions?
data
0
subj
ect
effect size
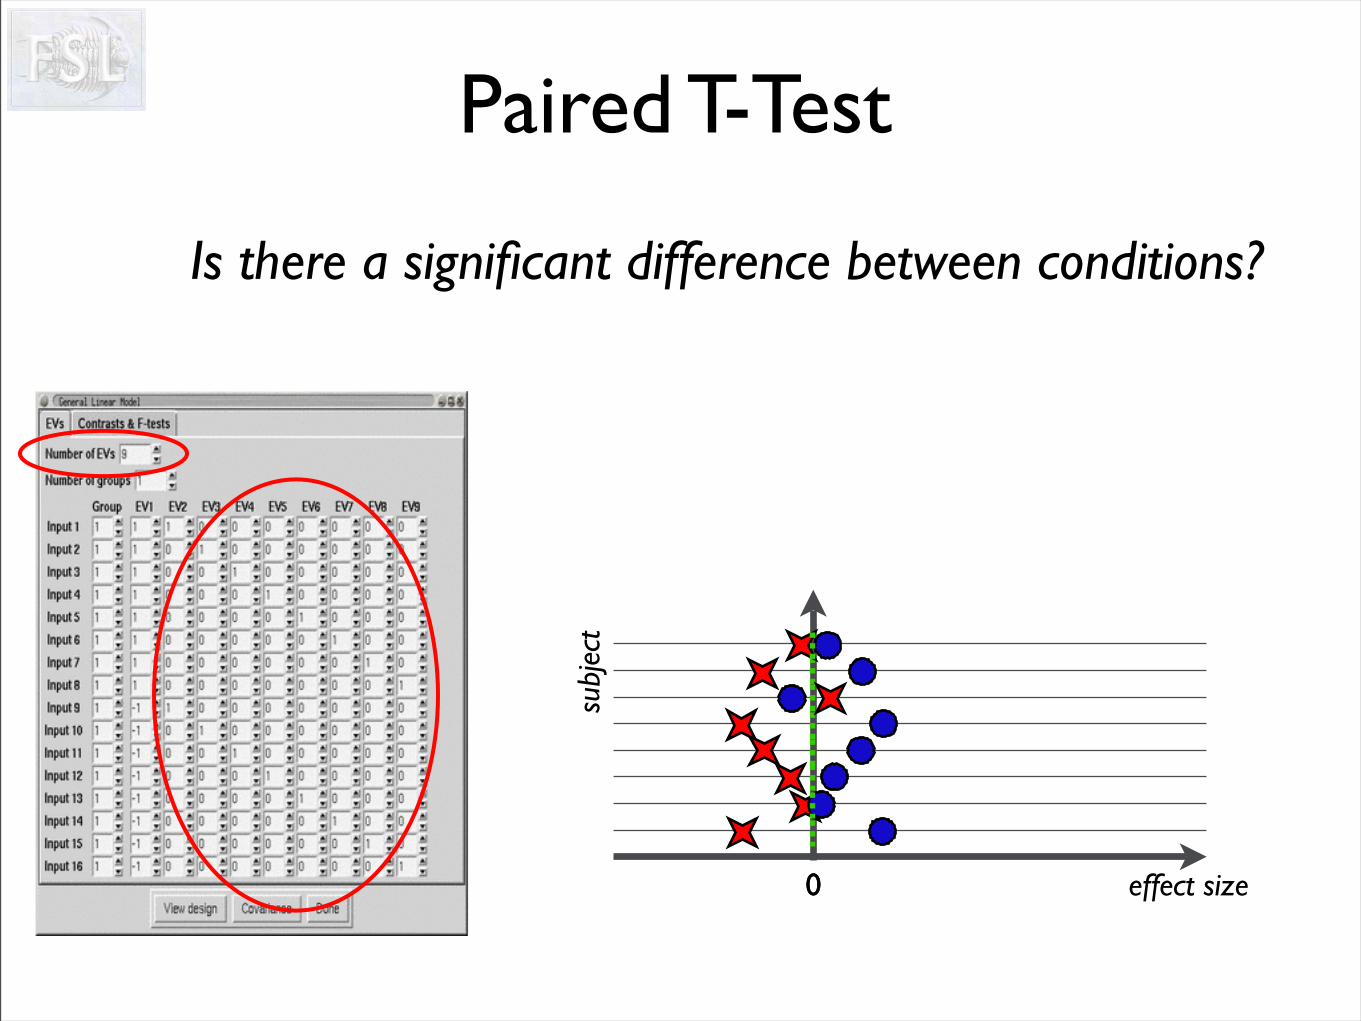
Paired T-Test
subject mean accounts for large prop.of the overall variance
• 8 subjects scanned under 2 conditions (A,B)
Is there a significant difference between conditions?
de-meaned data
0su
bjec
teffect size
data
0
subj
ect
effect size
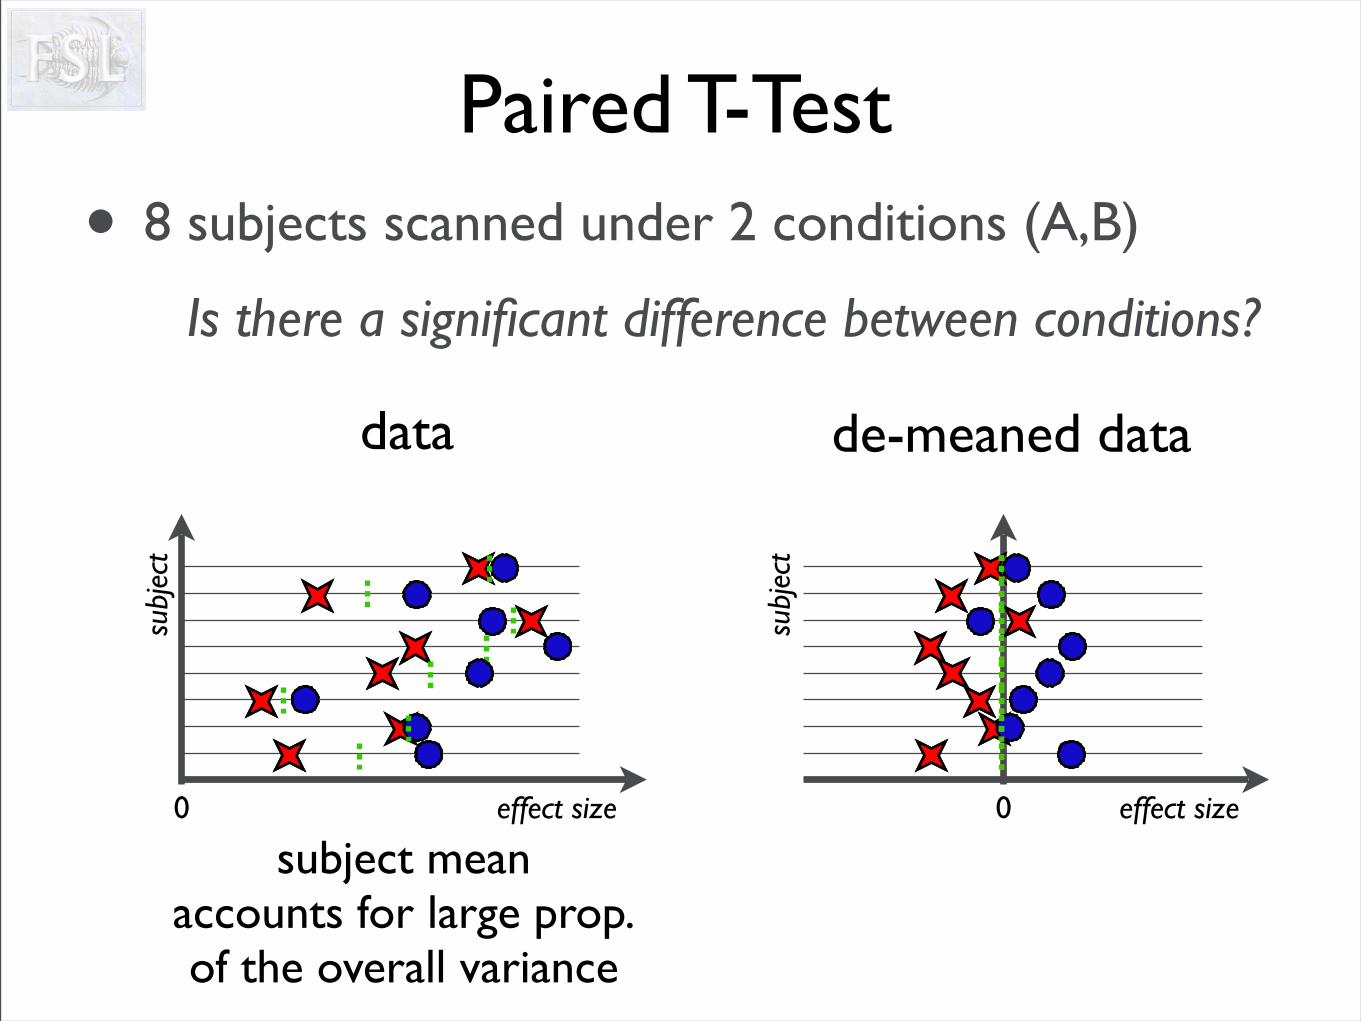
Paired T-Test
subject mean accounts for large prop.of the overall variance
• 8 subjects scanned under 2 conditions (A,B)
Is there a significant difference between conditions?
de-meaned data
0su
bjec
teffect size
data
0
subj
ect
effect size
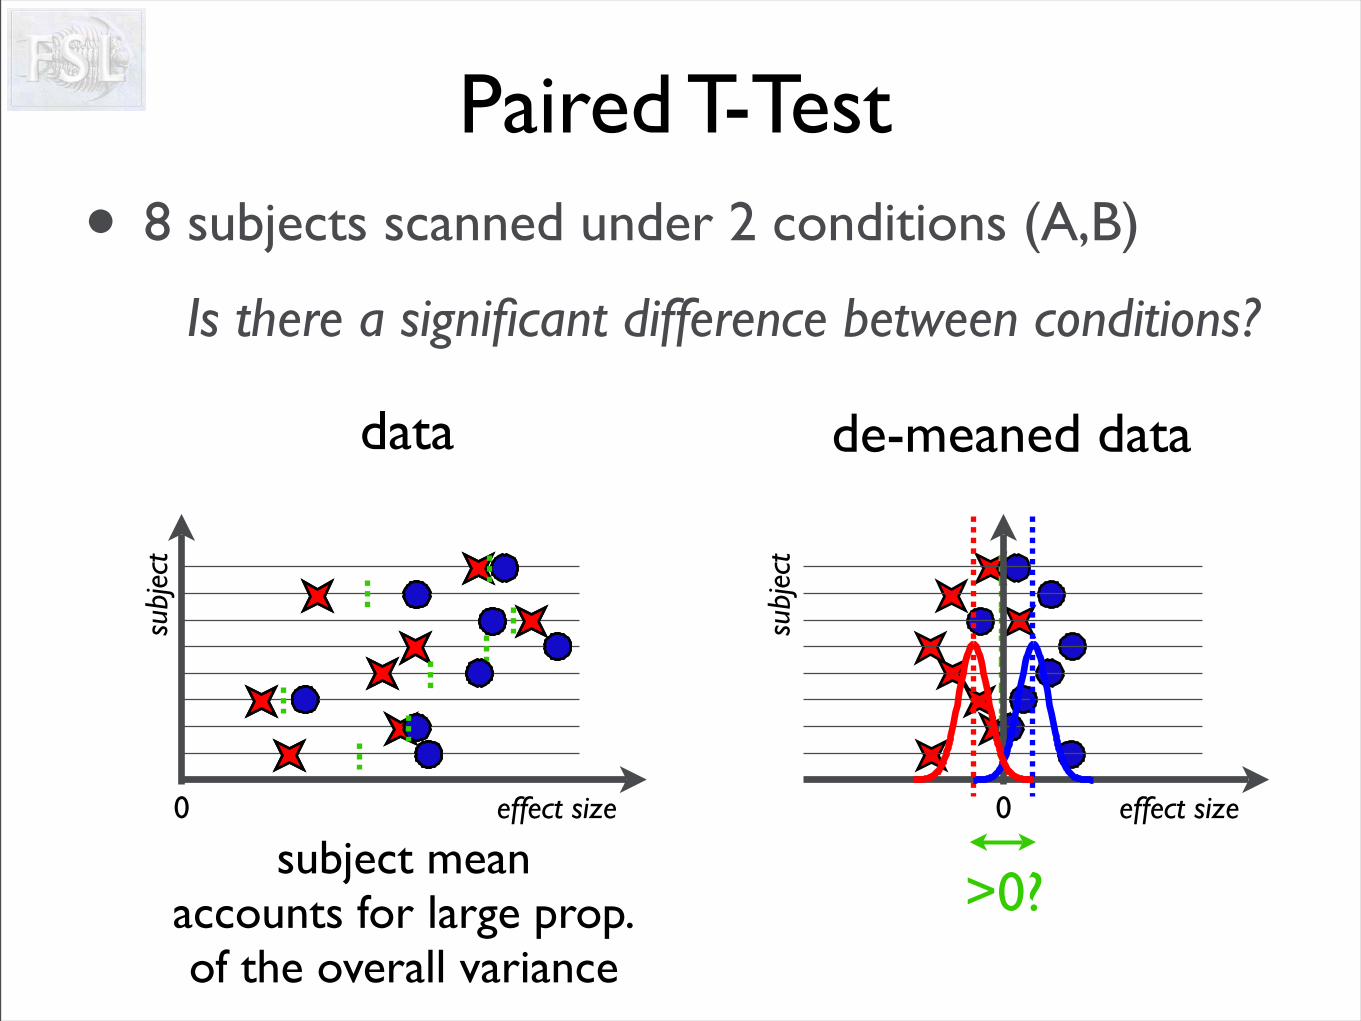
Paired T-Test
>0?subject mean
accounts for large prop.of the overall variance
subj
ect
effect size00
Paired T-Test
Is there a significant difference between conditions?
subj
ect
effect size00
Paired T-Test
Is there a significant difference between conditions?
subj
ect
effect size00
Paired T-Test
Is there a significant difference between conditions?
subj
ect
effect size00
Paired T-Test
Is there a significant difference between conditions?
subj
ect
effect size00
Paired T-Test
Is there a significant difference between conditions?
subj
ect
effect size00
Paired T-Test
Is there a significant difference between conditions?
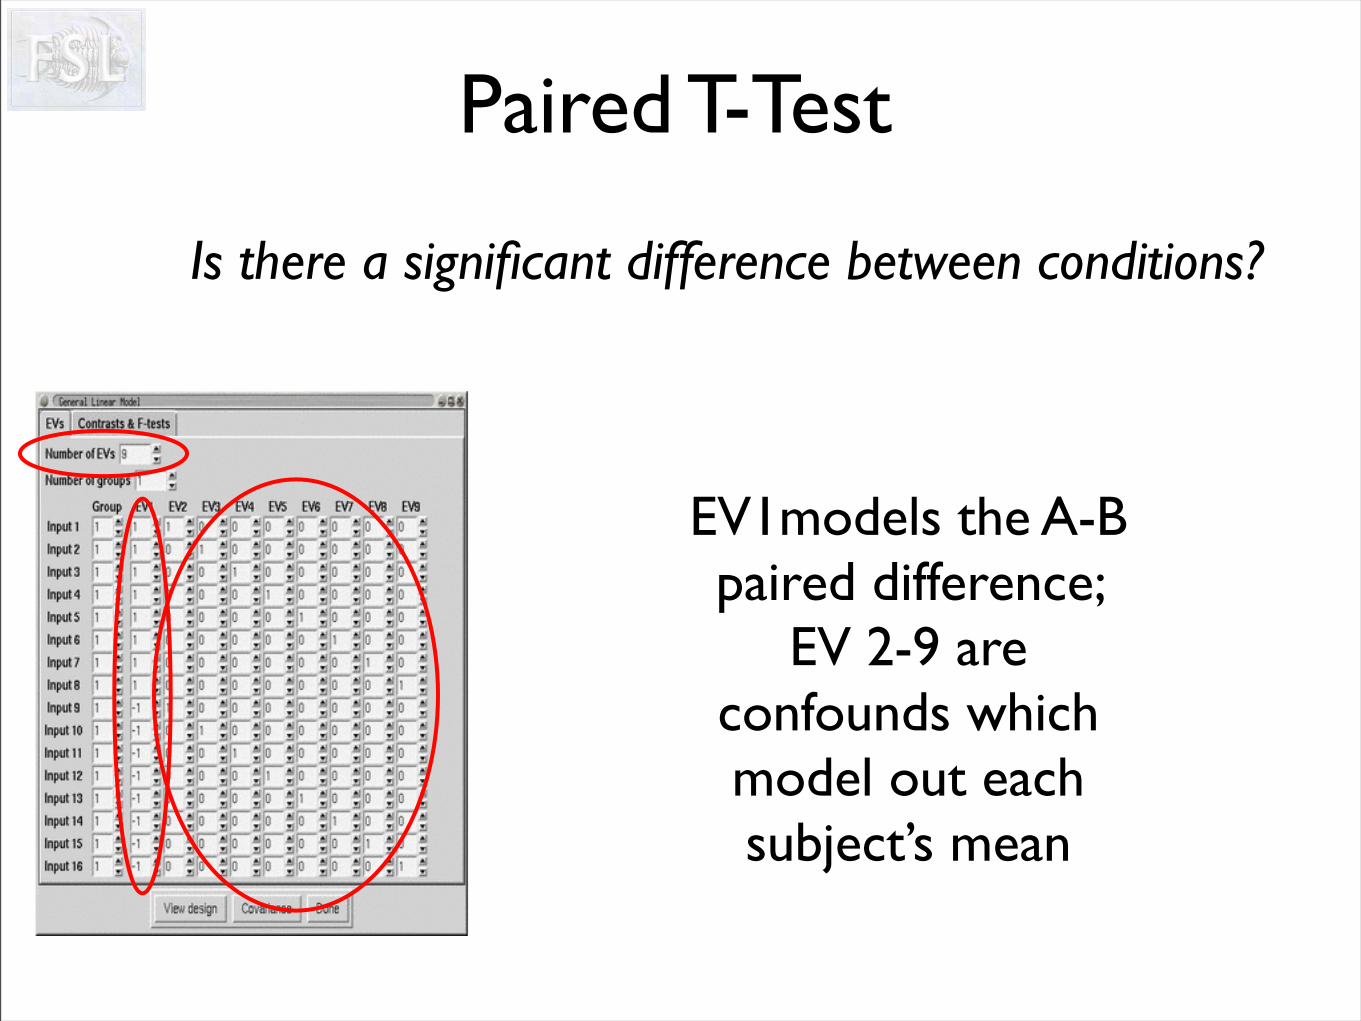
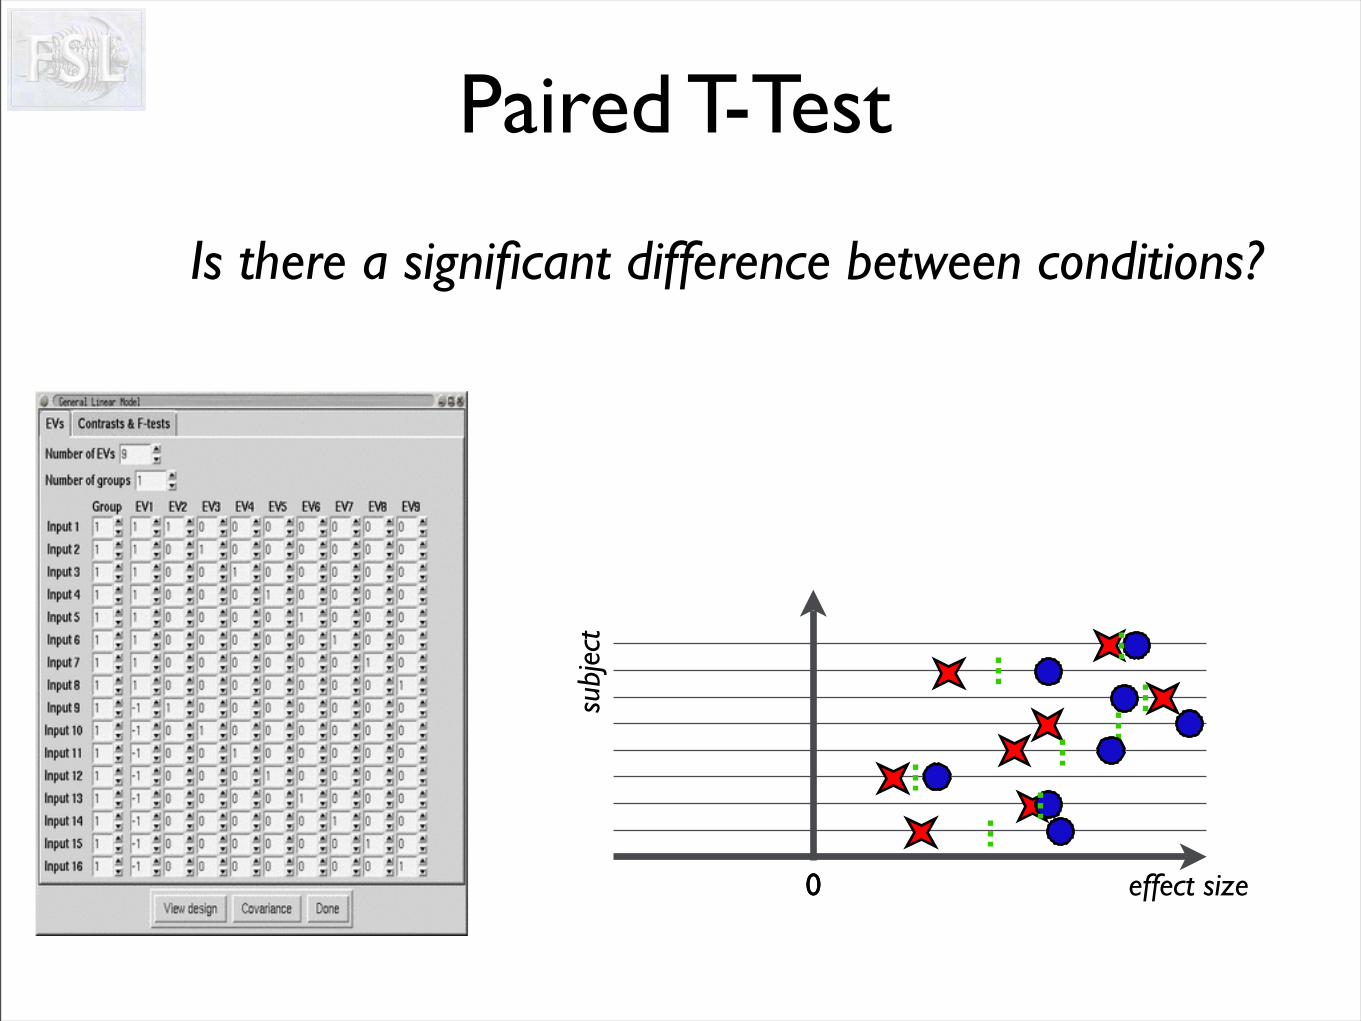
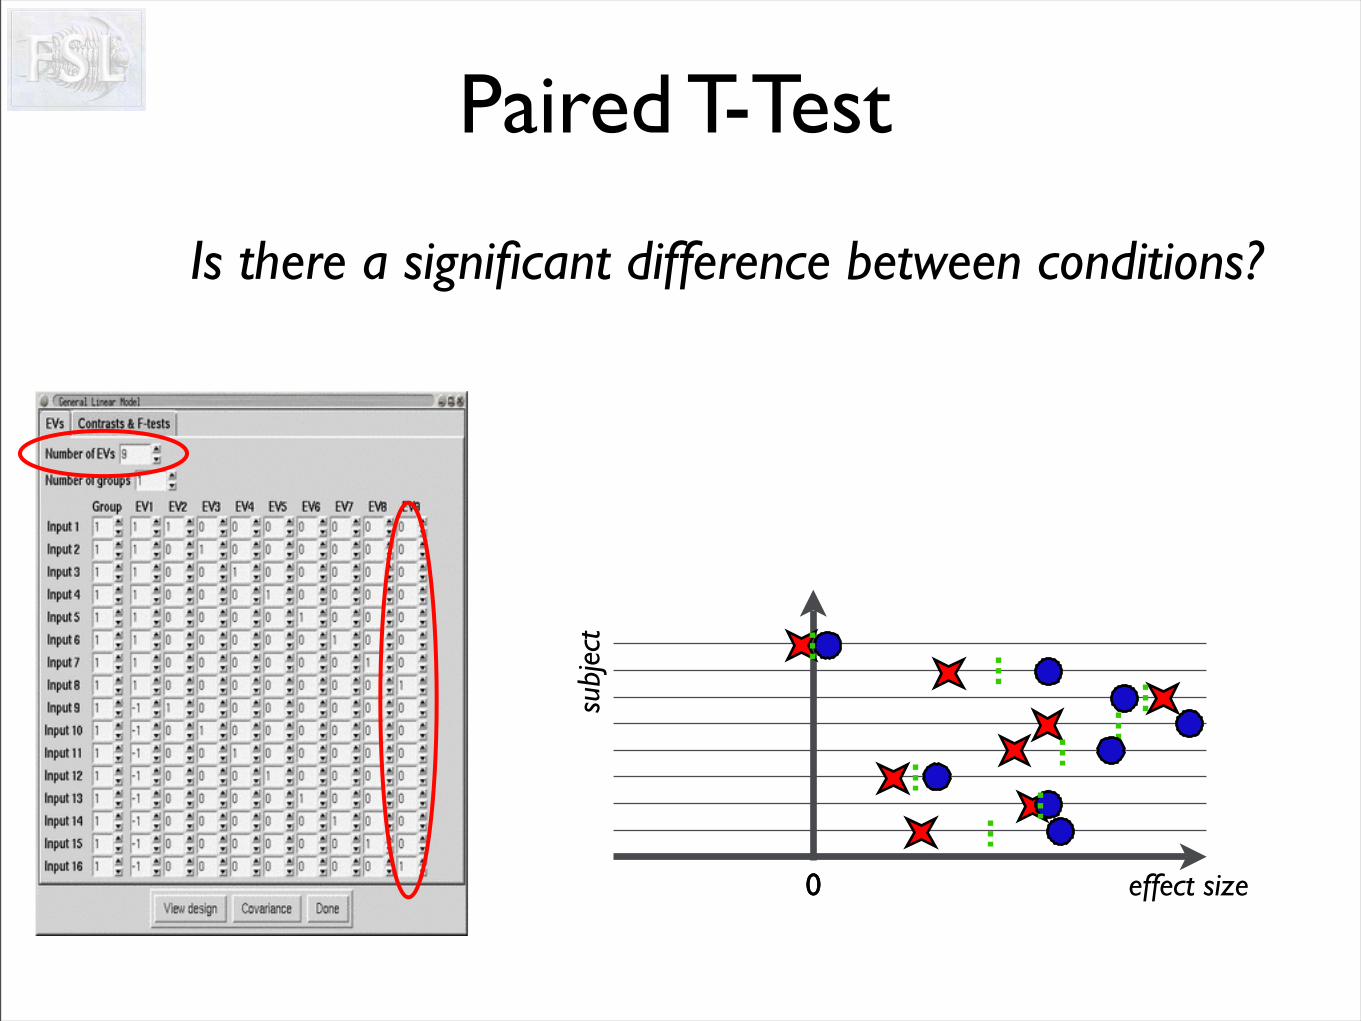
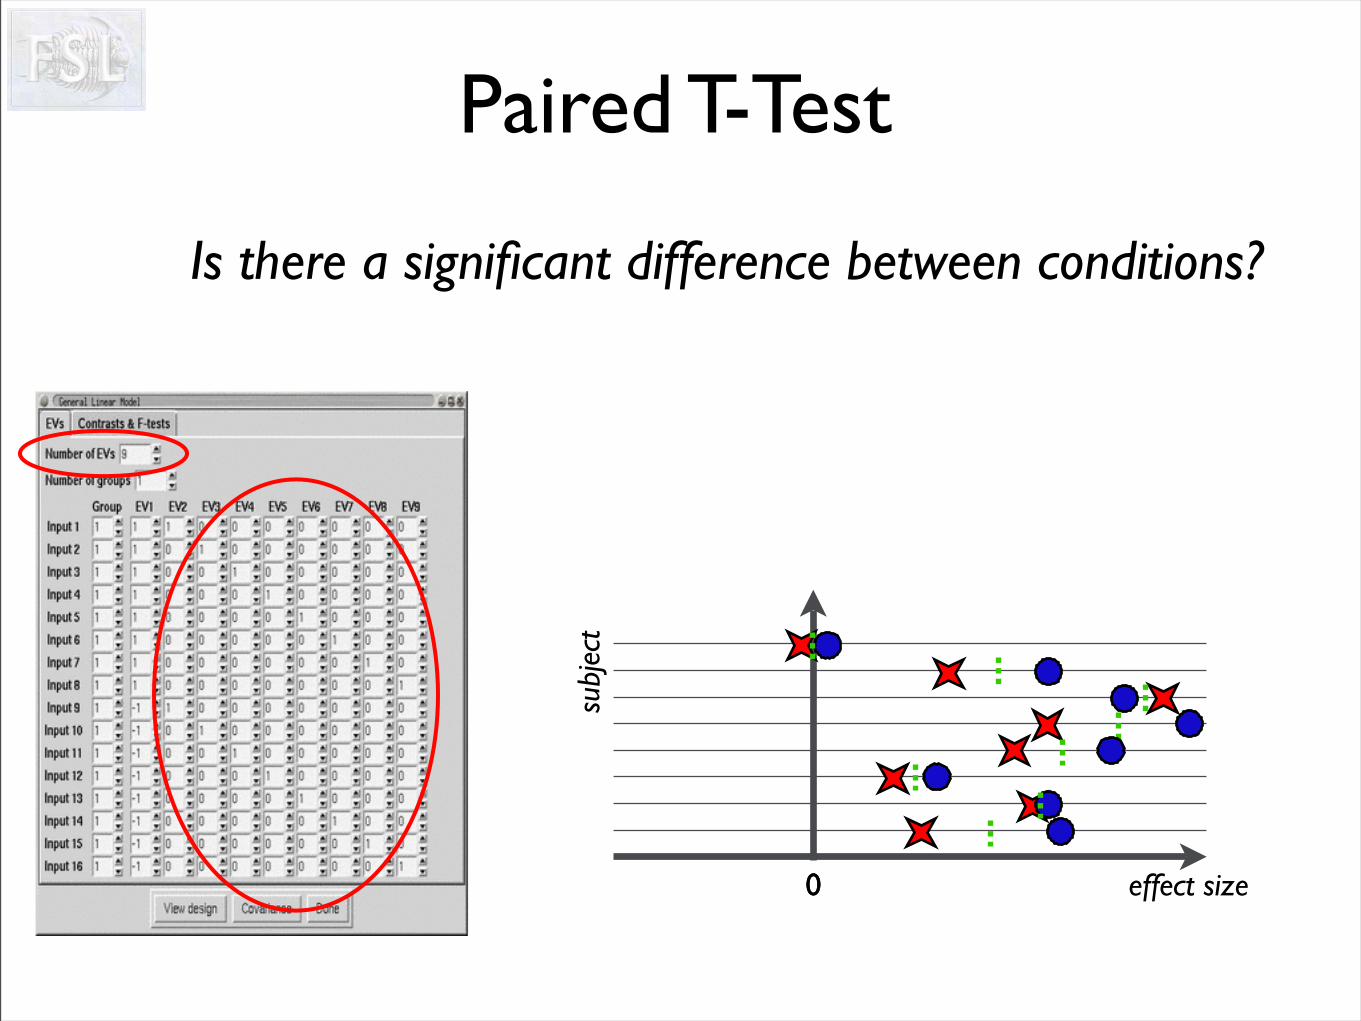
Paired T-Test
Is there a significant difference between conditions?
EV1models the A-B paired difference;
EV 2-9 are confounds which model out each subject’s mean
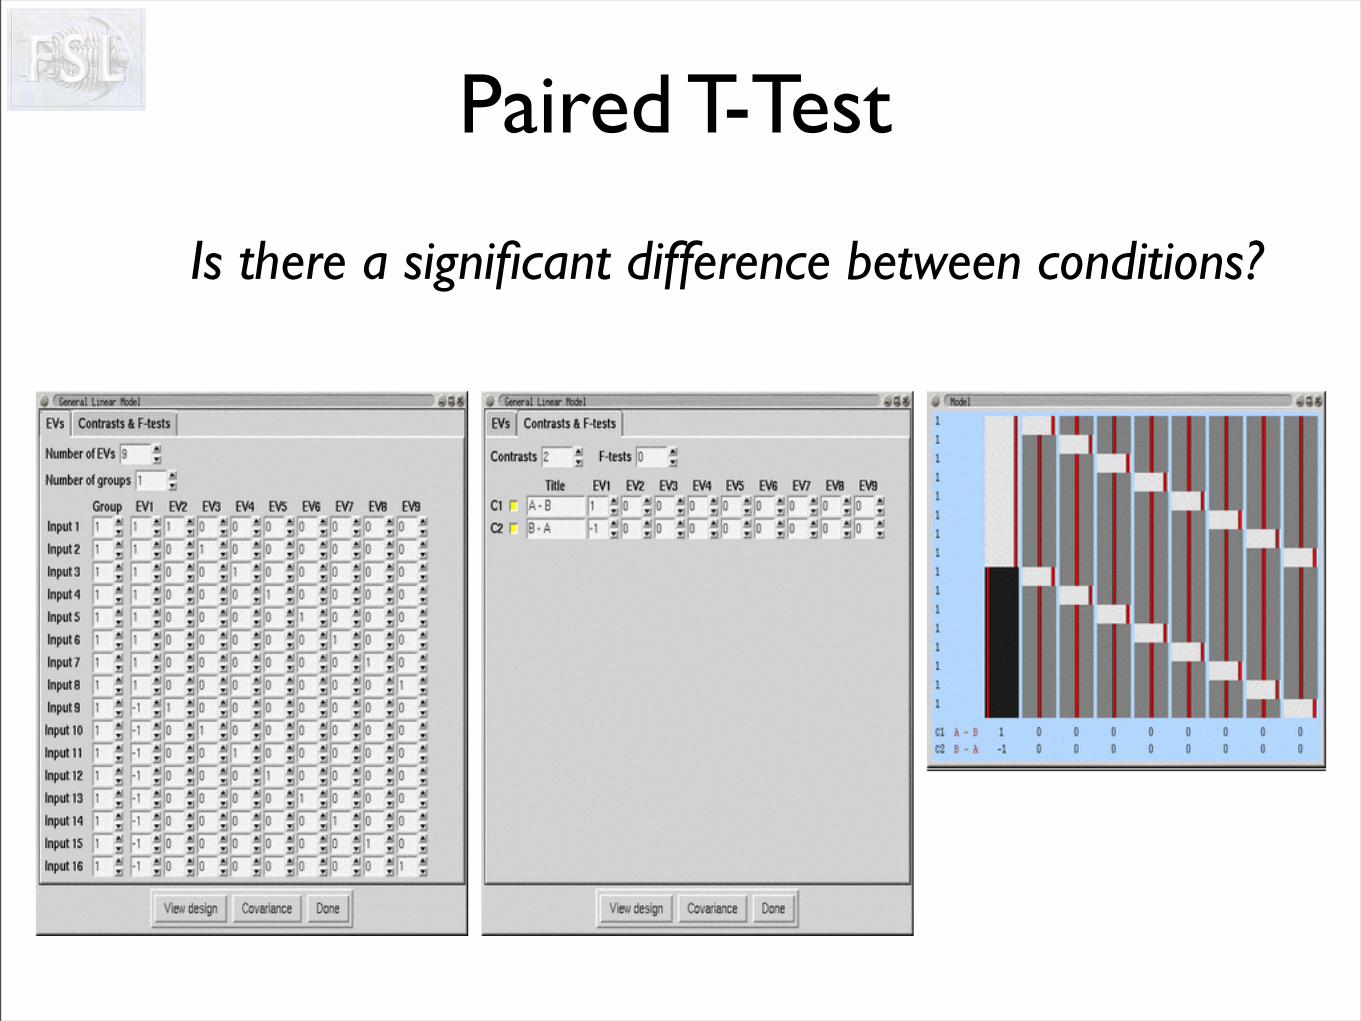
Paired T-Test
Is there a significant difference between conditions?
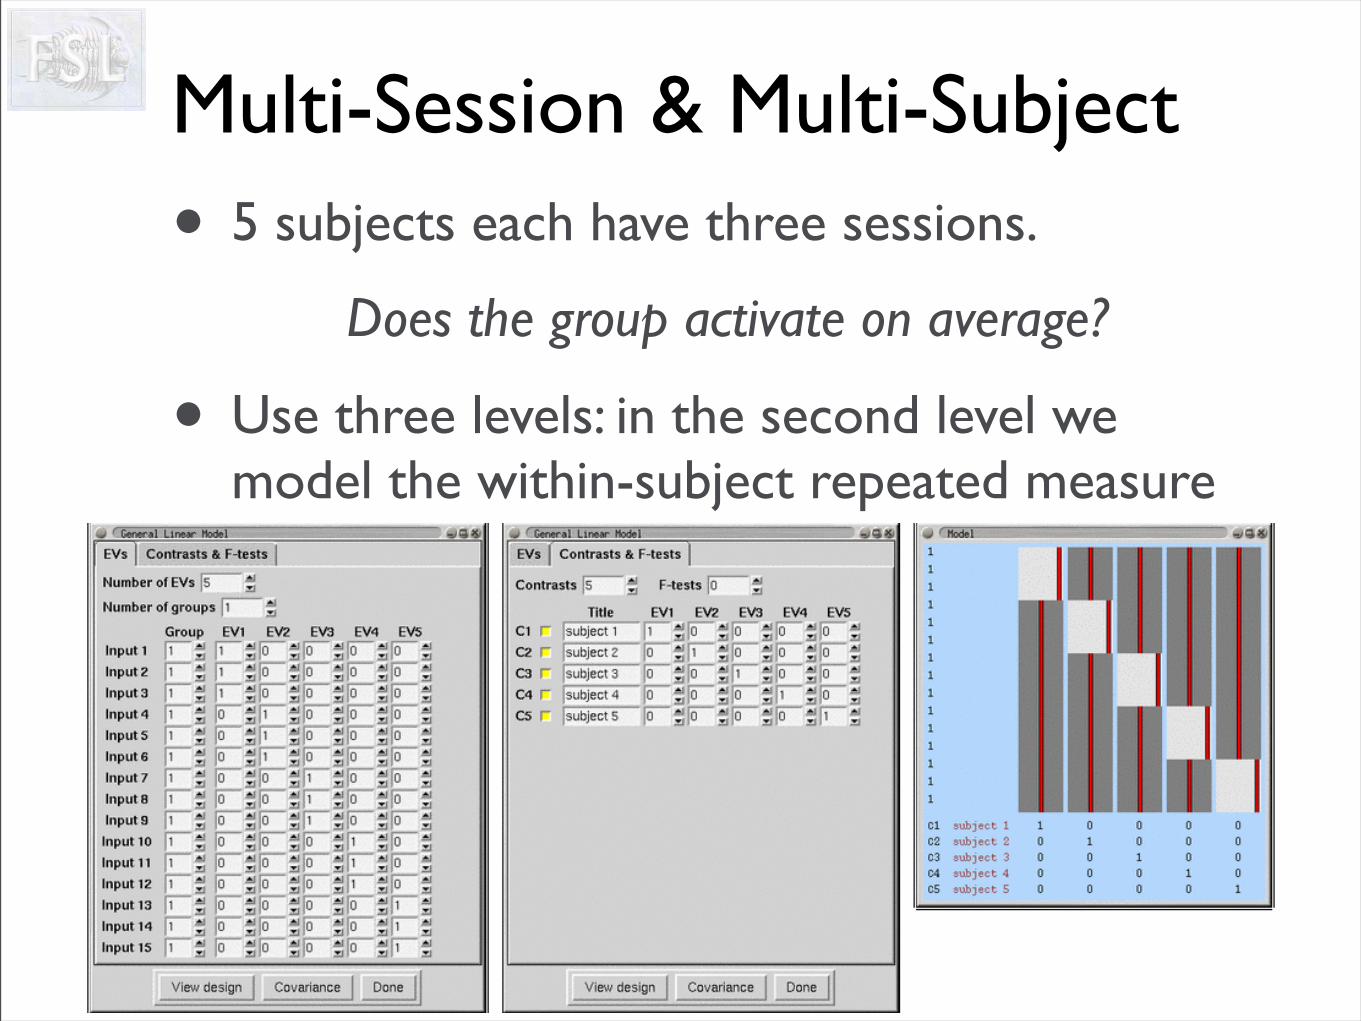
Multi-Session & Multi-Subject• 5 subjects each have three sessions.
Does the group activate on average?
• Use three levels: in the second level we model the within-subject repeated measure
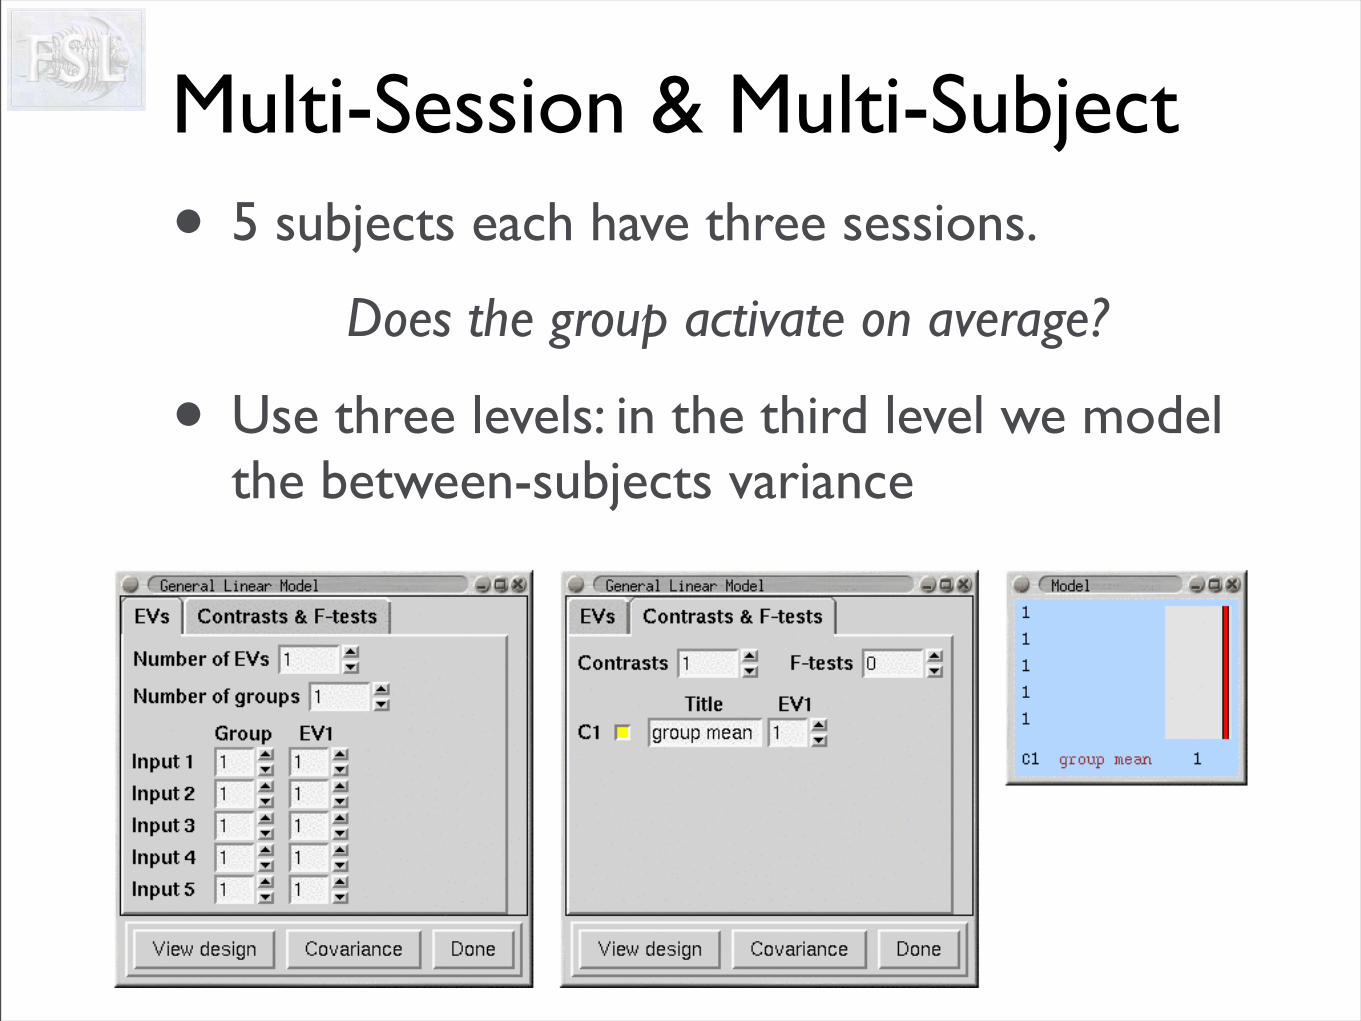
Multi-Session & Multi-Subject• 5 subjects each have three sessions.
Does the group activate on average?
• Use three levels: in the third level we model the between-subjects variance
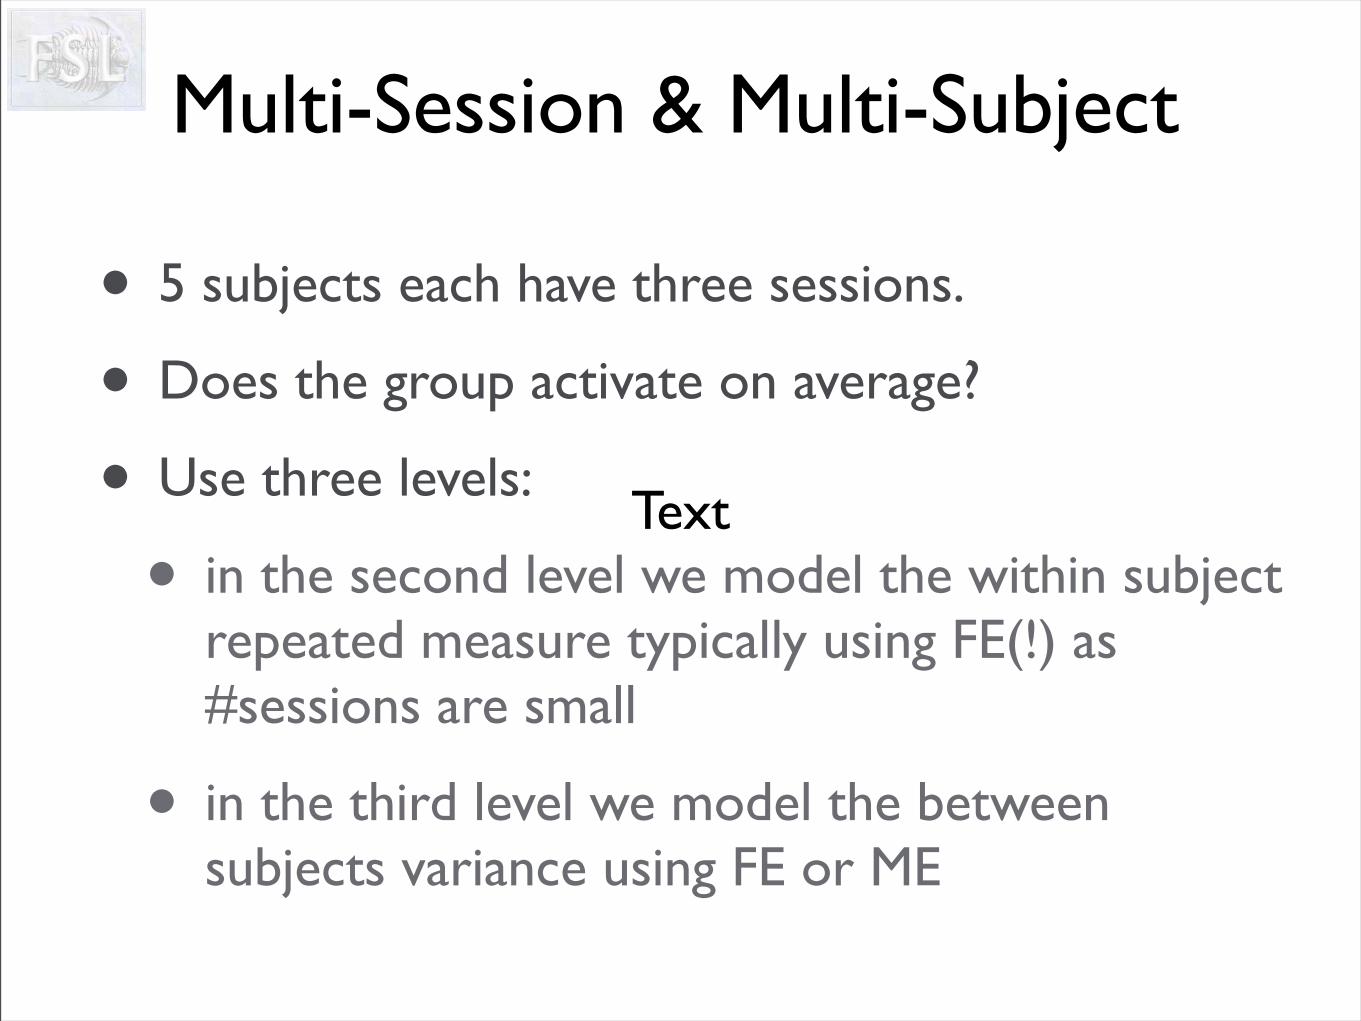
Multi-Session & Multi-Subject
• 5 subjects each have three sessions.
• Does the group activate on average?
• Use three levels:
• in the second level we model the within subject repeated measure typically using FE(!) as #sessions are small
• in the third level we model the between subjects variance using FE or ME
Text
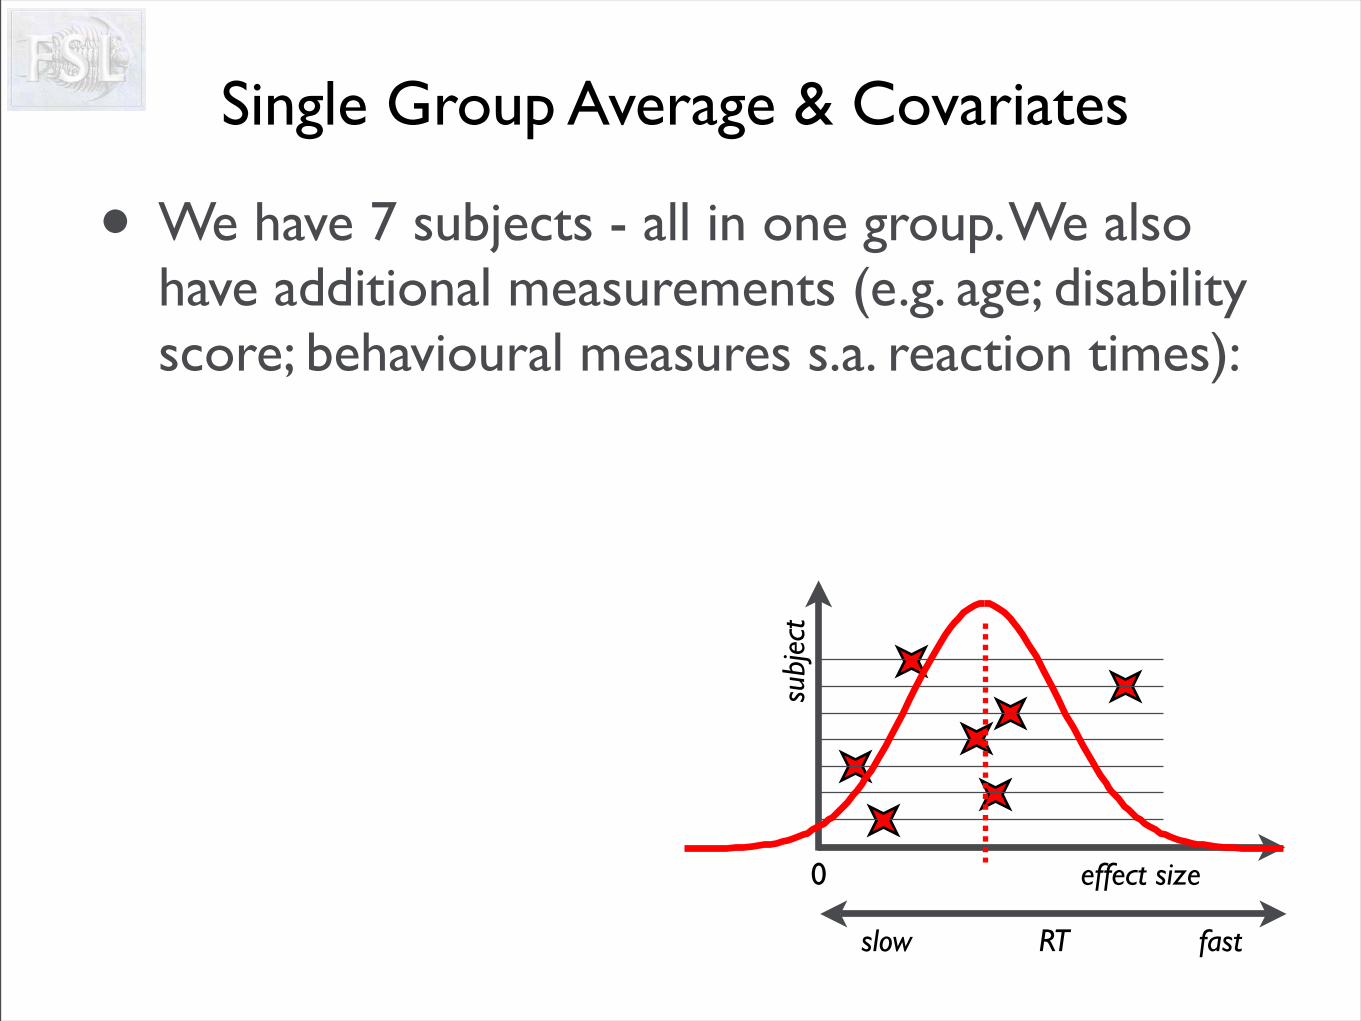
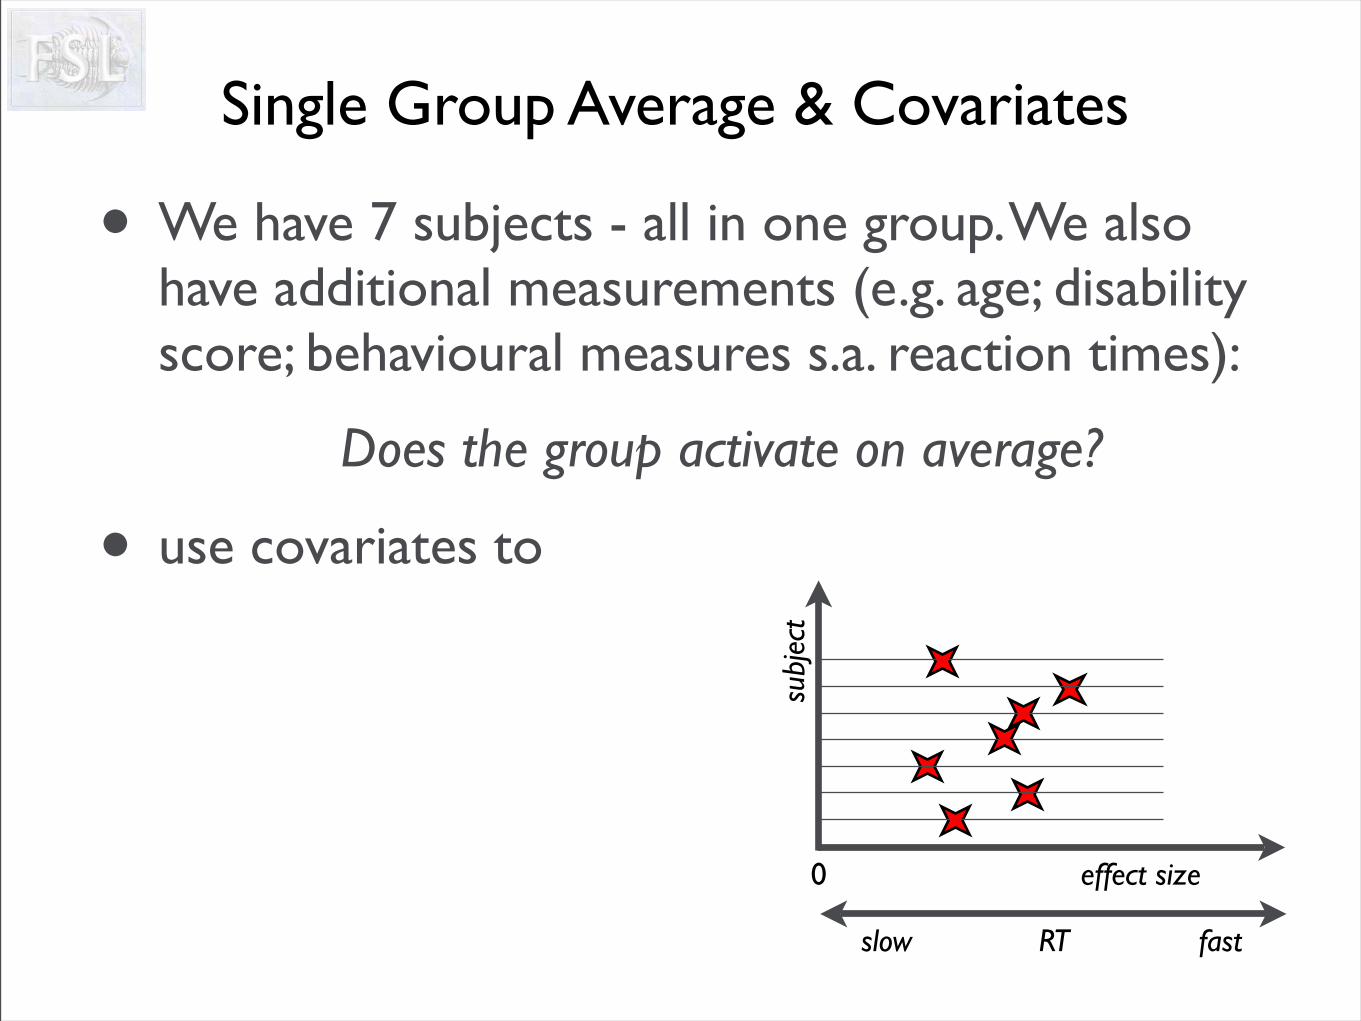
• We have 7 subjects - all in one group. We also have additional measurements (e.g. age; disability score; behavioural measures s.a. reaction times):
0
subj
ect
effect size
Single Group Average & Covariates
fastRTslow
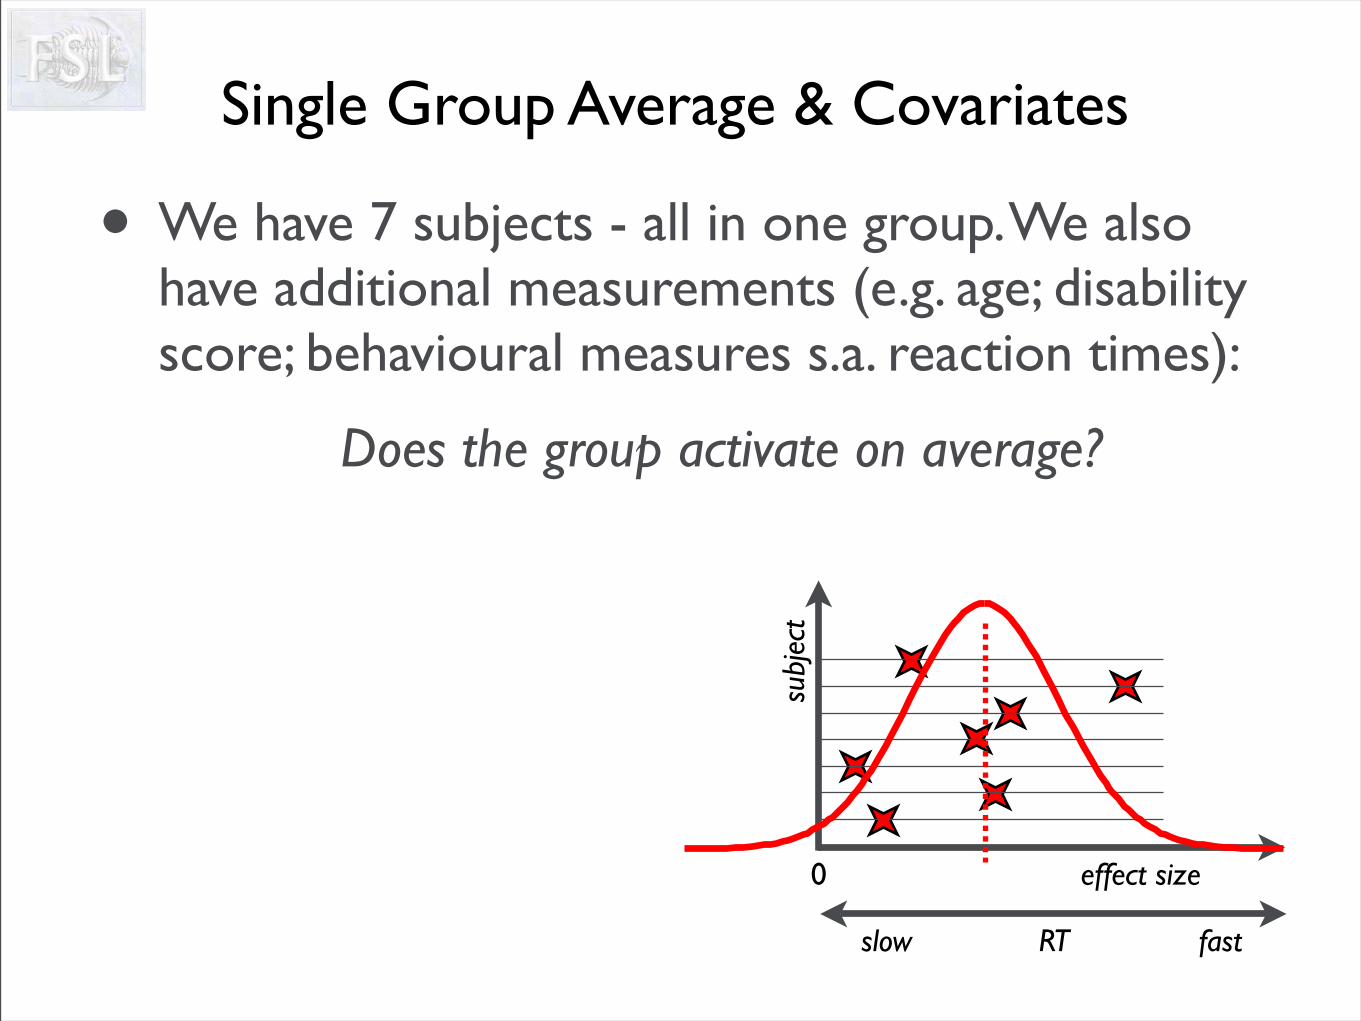
• We have 7 subjects - all in one group. We also have additional measurements (e.g. age; disability score; behavioural measures s.a. reaction times):
Does the group activate on average?
0
subj
ect
effect size
Single Group Average & Covariates
fastRTslow
• We have 7 subjects - all in one group. We also have additional measurements (e.g. age; disability score; behavioural measures s.a. reaction times):
Does the group activate on average?
• use covariates to
0
subj
ect
effect size
Single Group Average & Covariates
fastRTslow
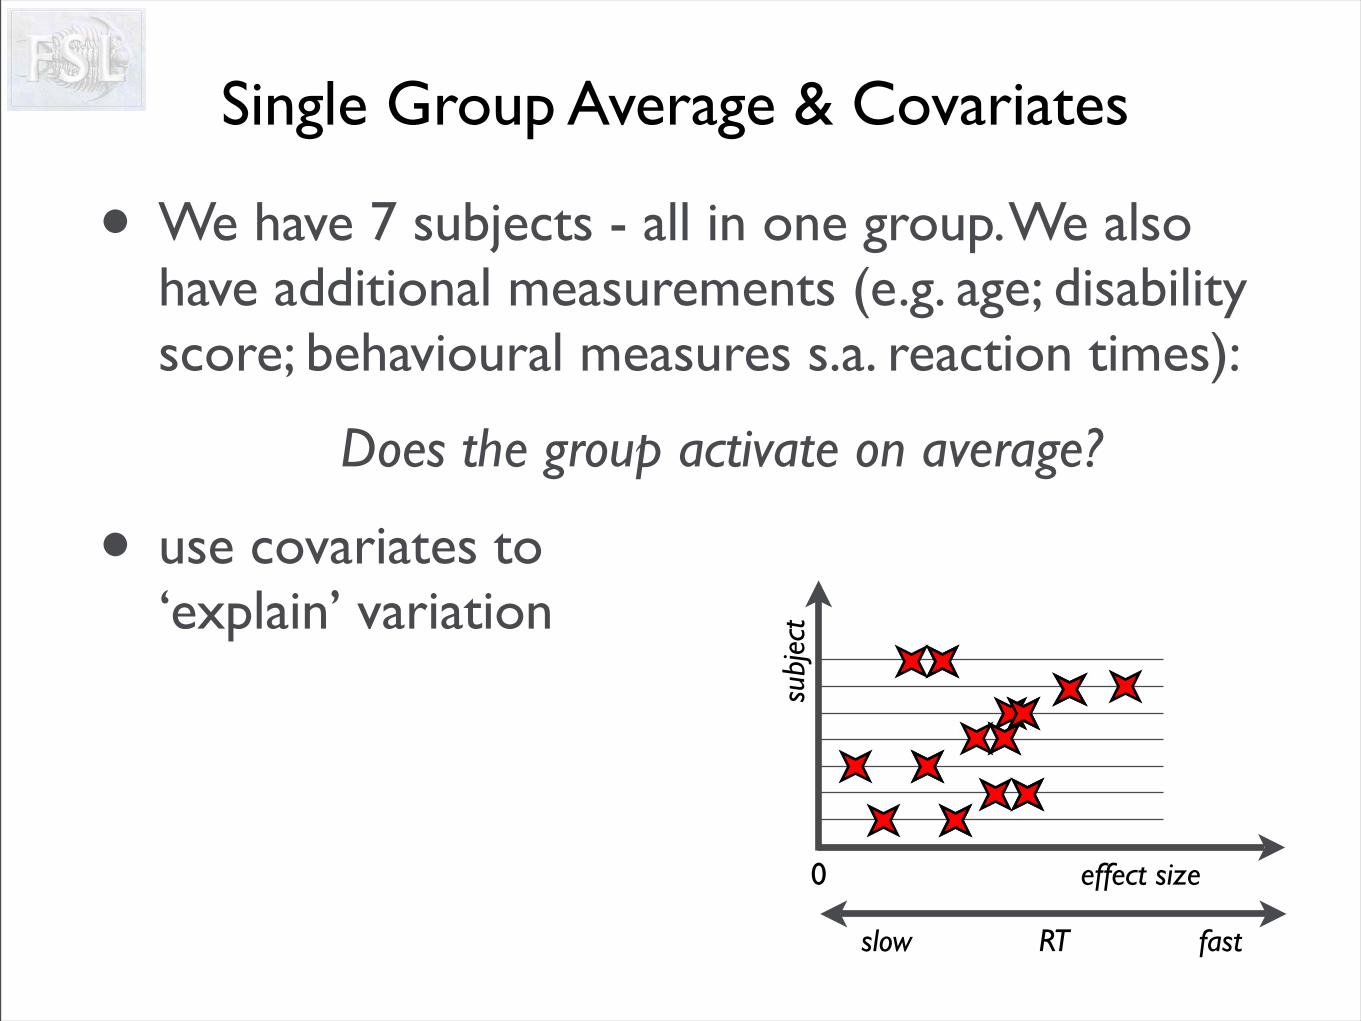
• We have 7 subjects - all in one group. We also have additional measurements (e.g. age; disability score; behavioural measures s.a. reaction times):
Does the group activate on average?
• use covariates to ‘explain’ variation
0
subj
ect
effect size
Single Group Average & Covariates
fastRTslow
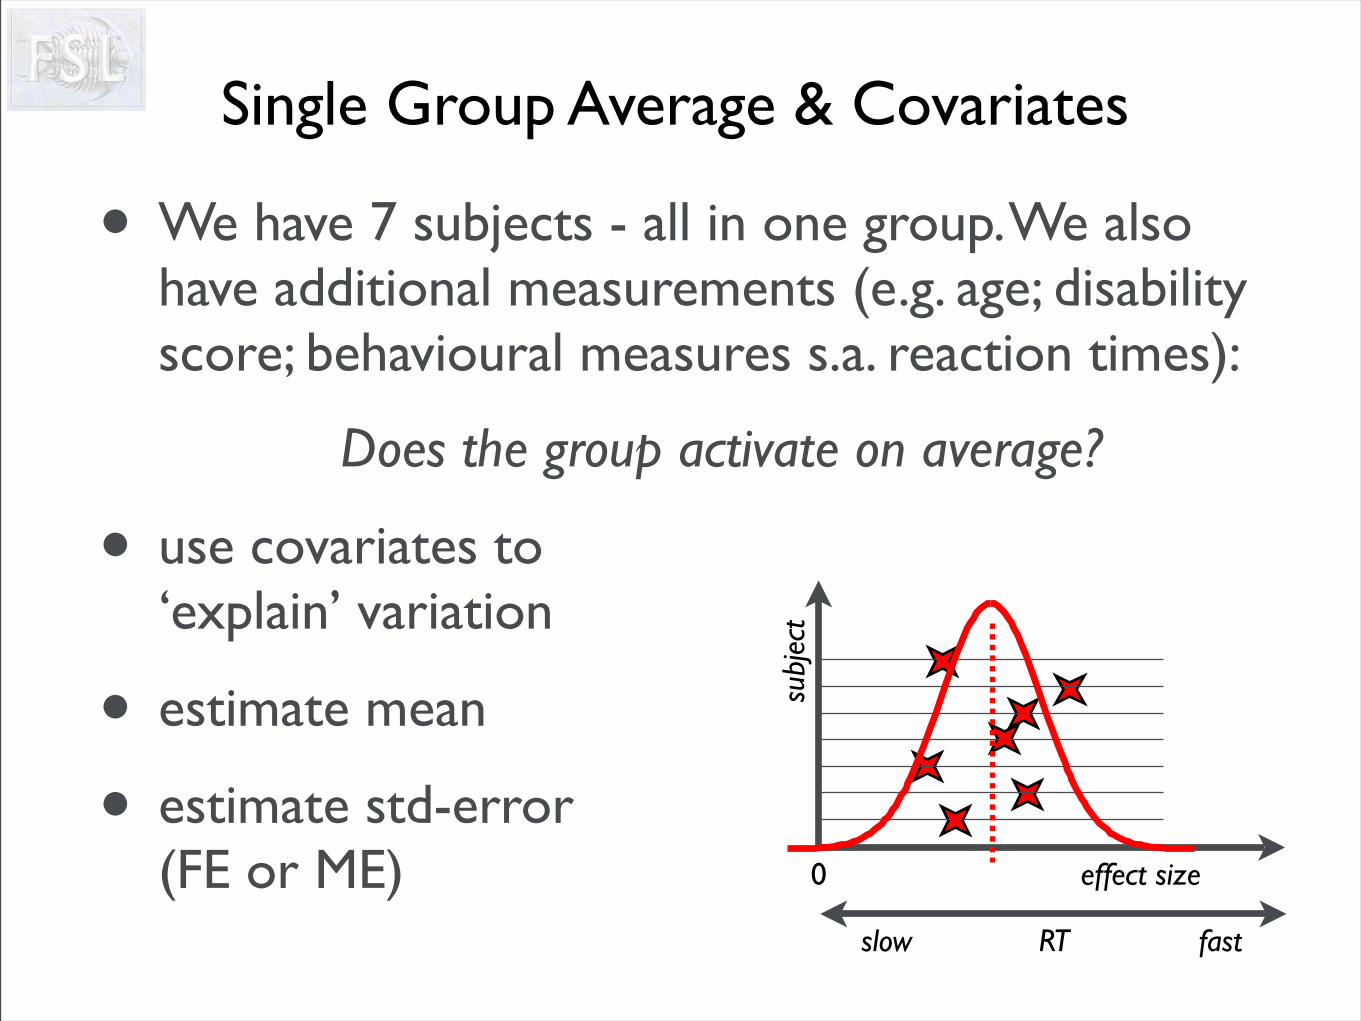
• We have 7 subjects - all in one group. We also have additional measurements (e.g. age; disability score; behavioural measures s.a. reaction times):
Does the group activate on average?
• use covariates to ‘explain’ variation
• estimate mean
• estimate std-error(FE or ME) 0
subj
ect
effect size
Single Group Average & Covariates
fastRTslow
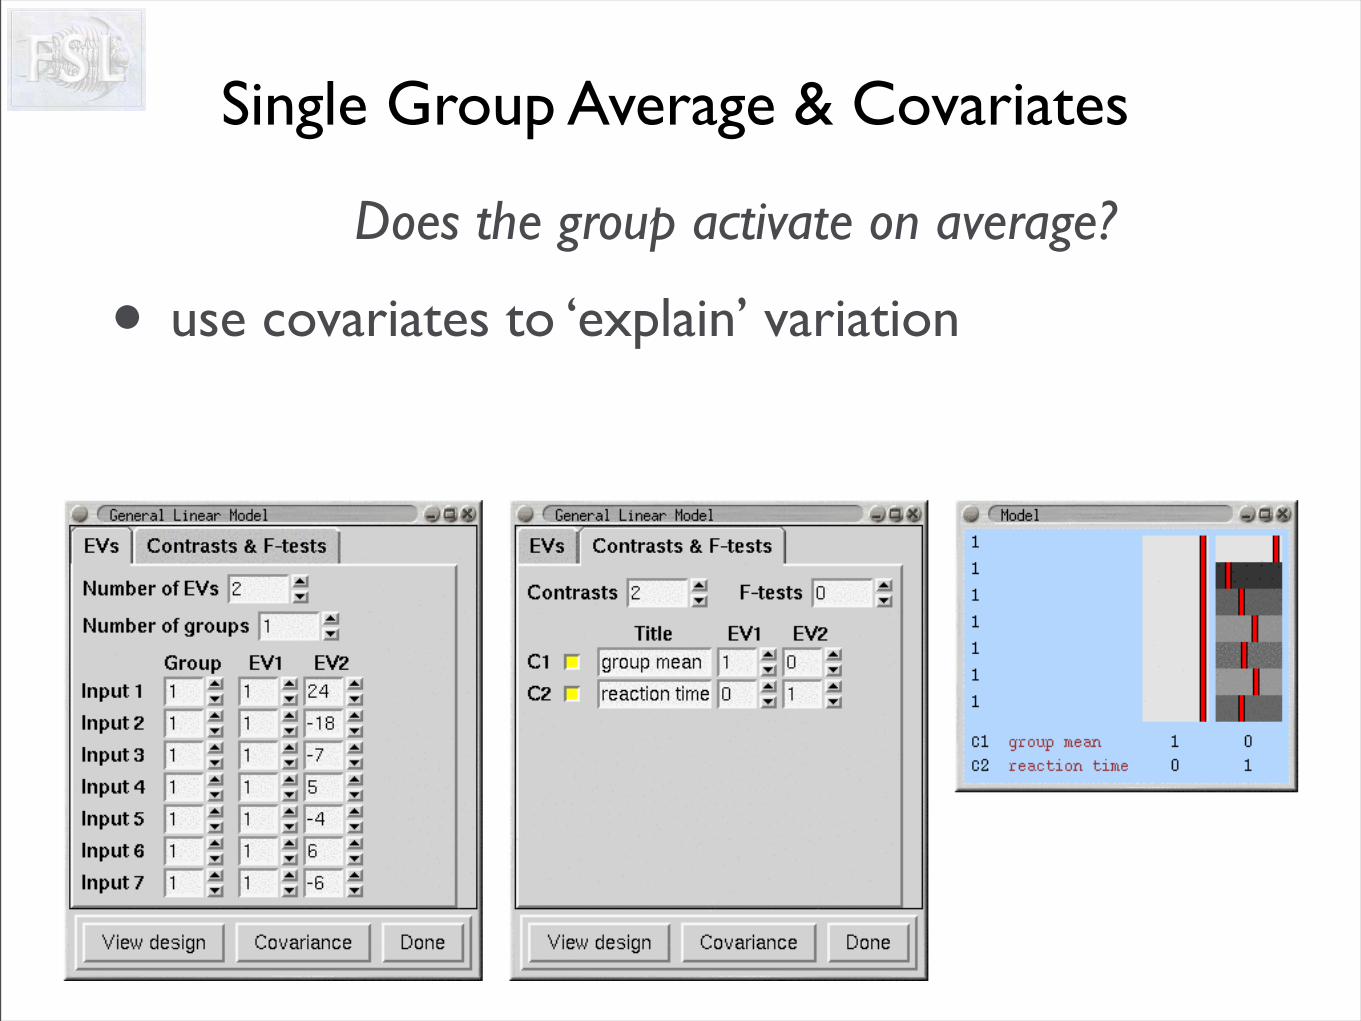
Does the group activate on average?
• use covariates to ‘explain’ variation
Single Group Average & Covariates
Does the group activate on average?
• use covariates to ‘explain’ variation
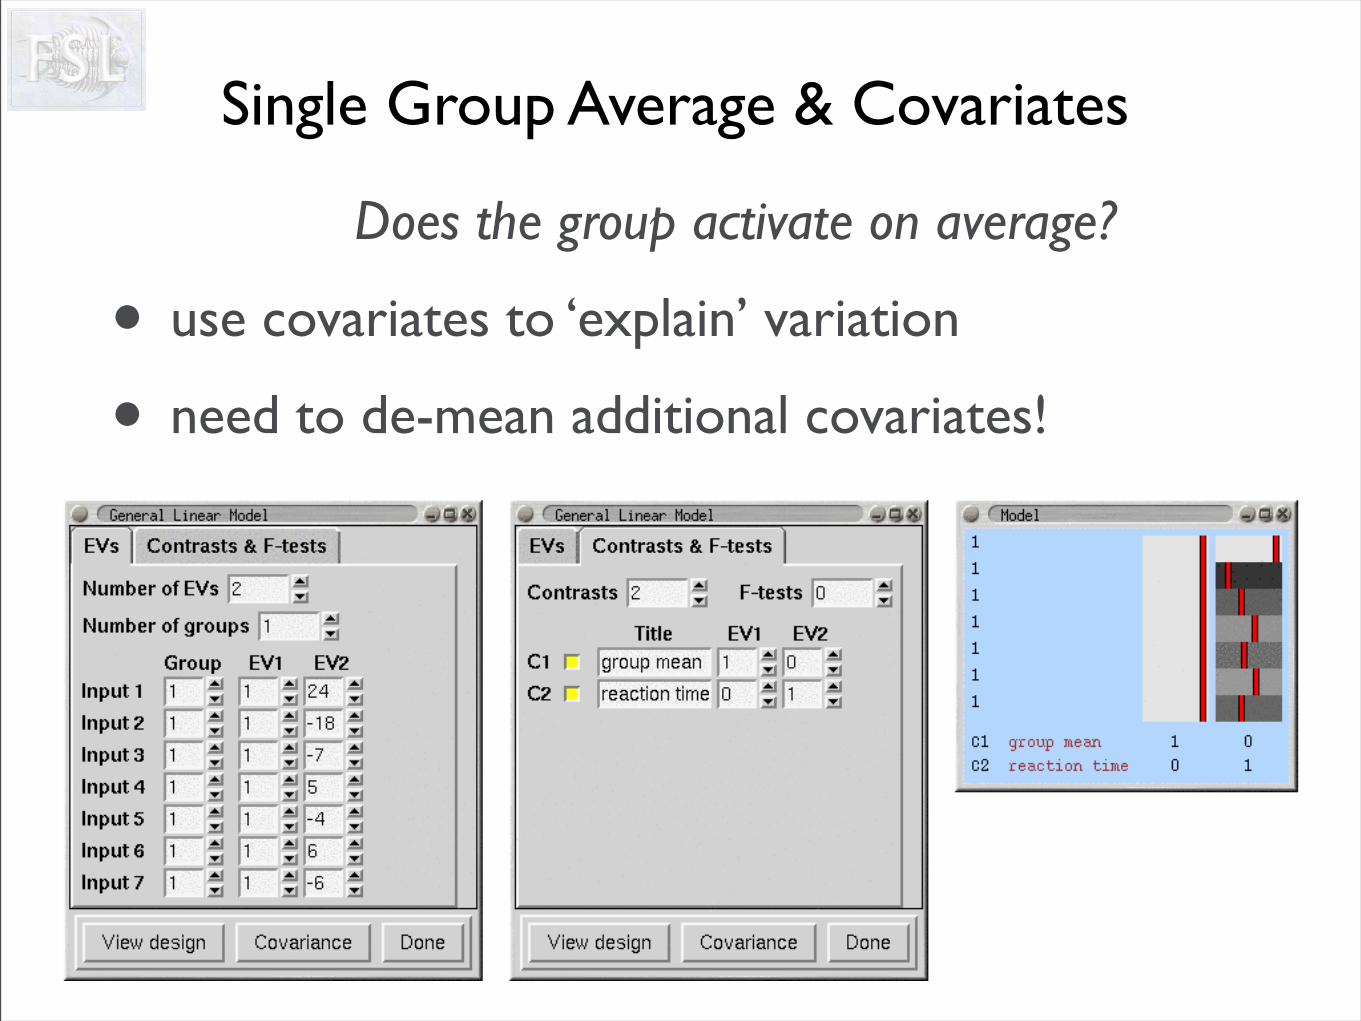
• need to de-mean additional covariates!
Single Group Average & Covariates
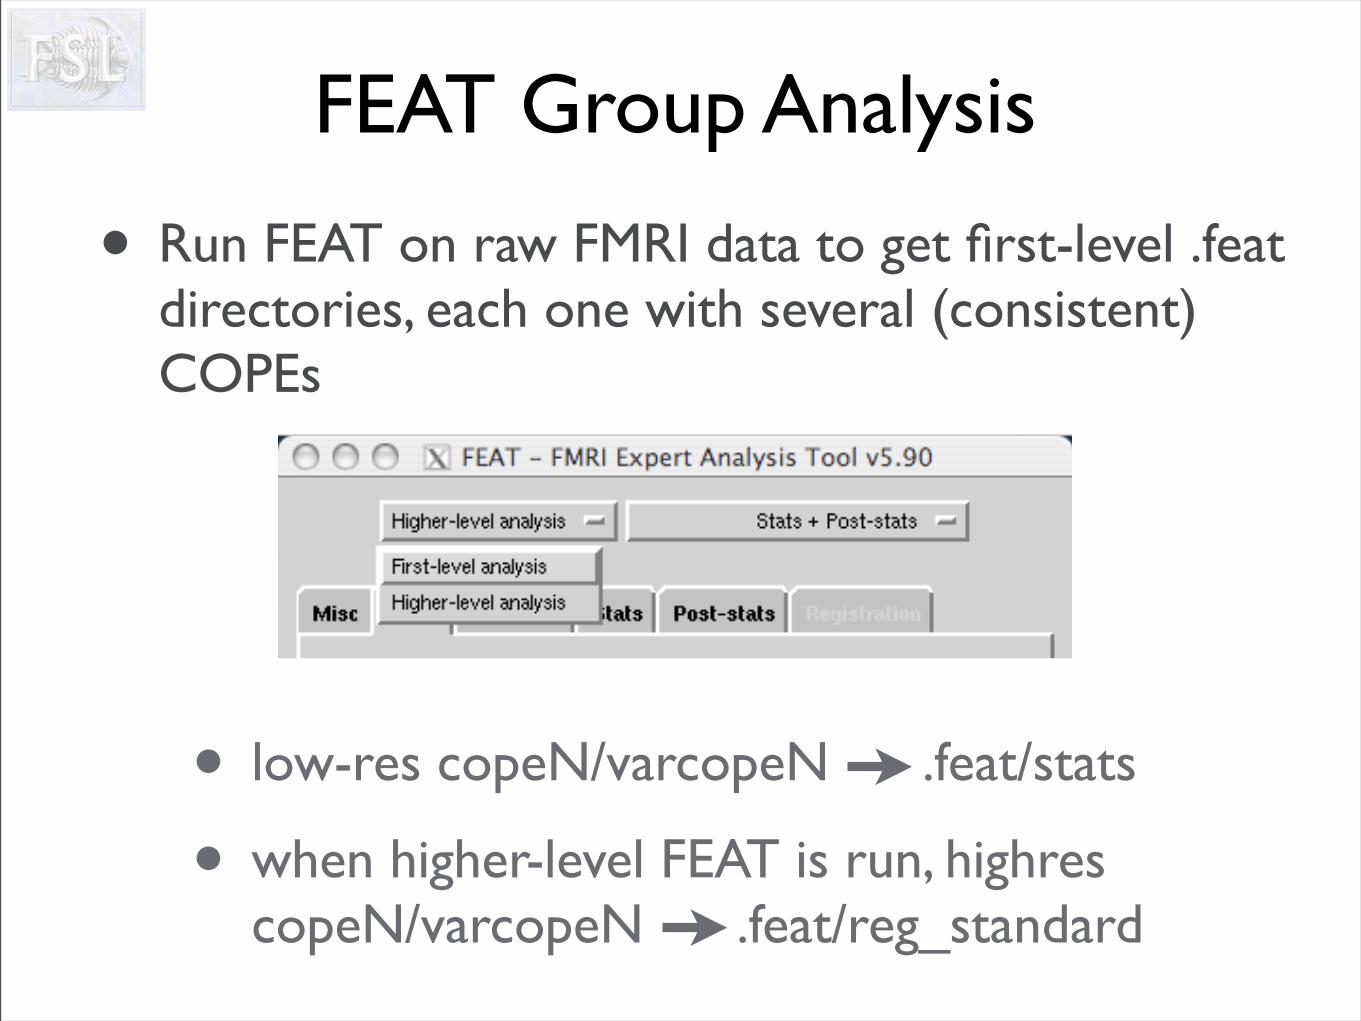
• Run FEAT on raw FMRI data to get first-level .feat directories, each one with several (consistent) COPEs
• low-res copeN/varcopeN .feat/stats
• when higher-level FEAT is run, highres copeN/varcopeN .feat/reg_standard
FEAT Group Analysis
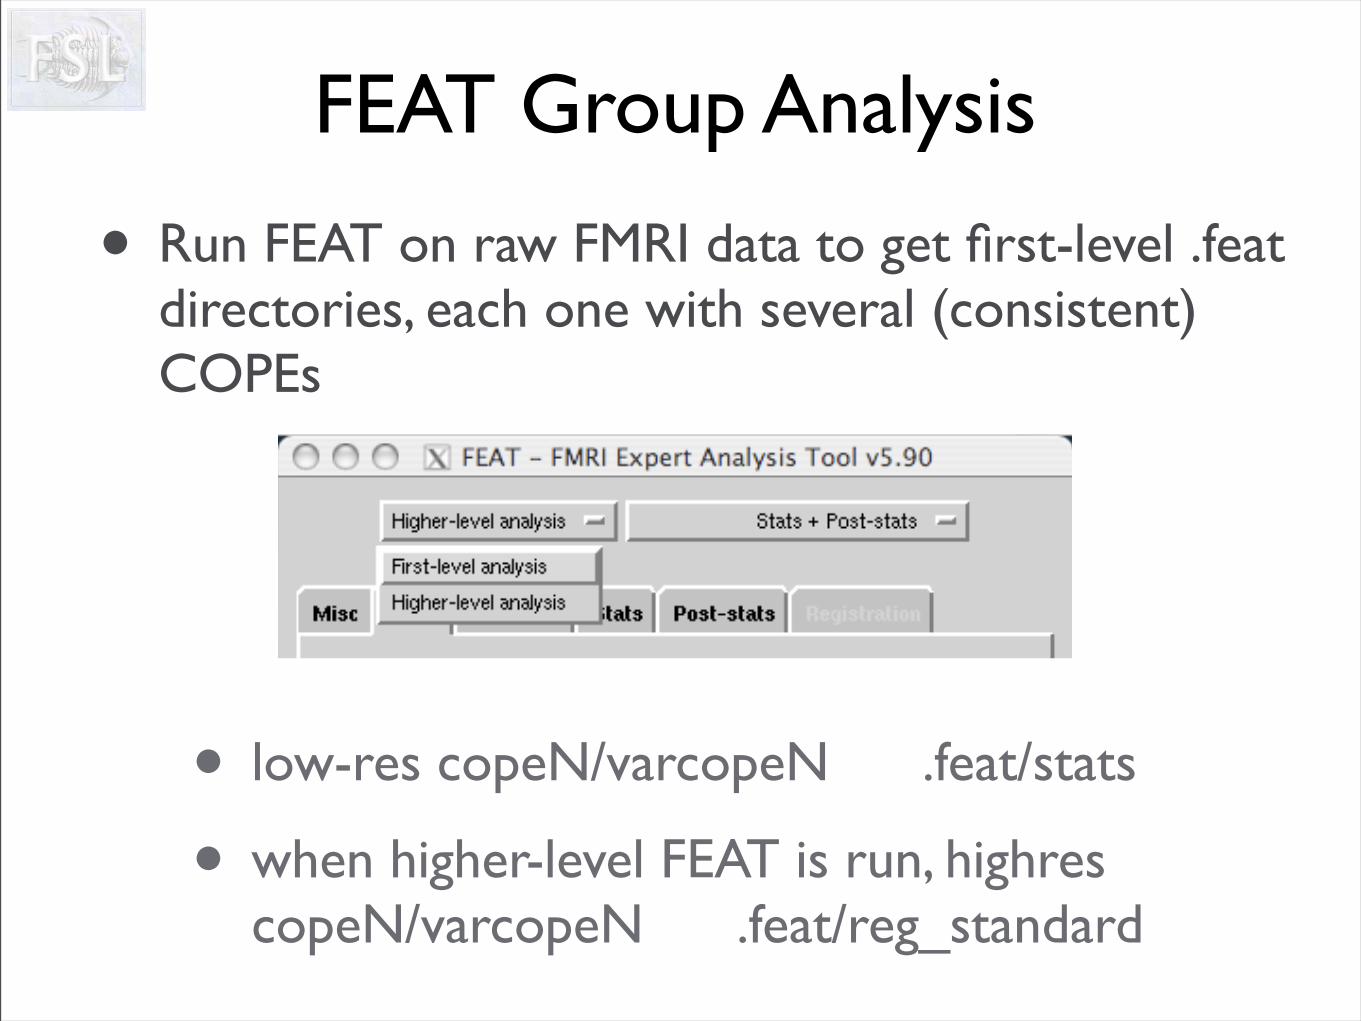
• Run FEAT on raw FMRI data to get first-level .feat directories, each one with several (consistent) COPEs
• low-res copeN/varcopeN .feat/stats
• when higher-level FEAT is run, highres copeN/varcopeN .feat/reg_standard
FEAT Group Analysis
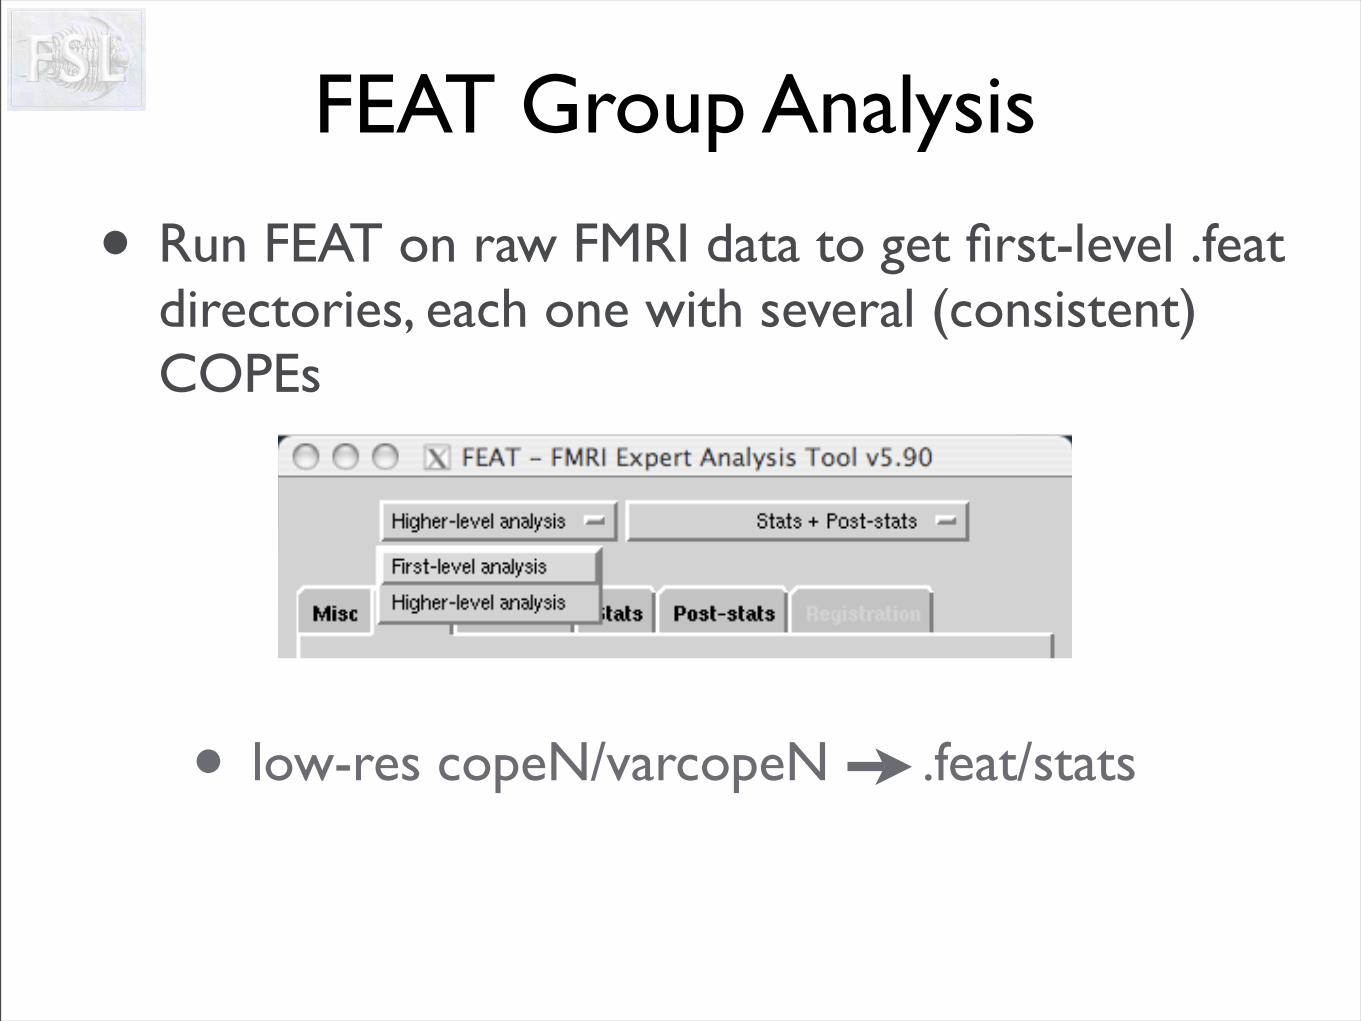
• Run FEAT on raw FMRI data to get first-level .feat directories, each one with several (consistent) COPEs
• low-res copeN/varcopeN .feat/stats
FEAT Group Analysis
• Run FEAT on raw FMRI data to get first-level .feat directories, each one with several (consistent) COPEs
• low-res copeN/varcopeN .feat/stats
• when higher-level FEAT is run, highres copeN/varcopeN .feat/reg_standard
FEAT Group Analysis
FEAT Group Analysis
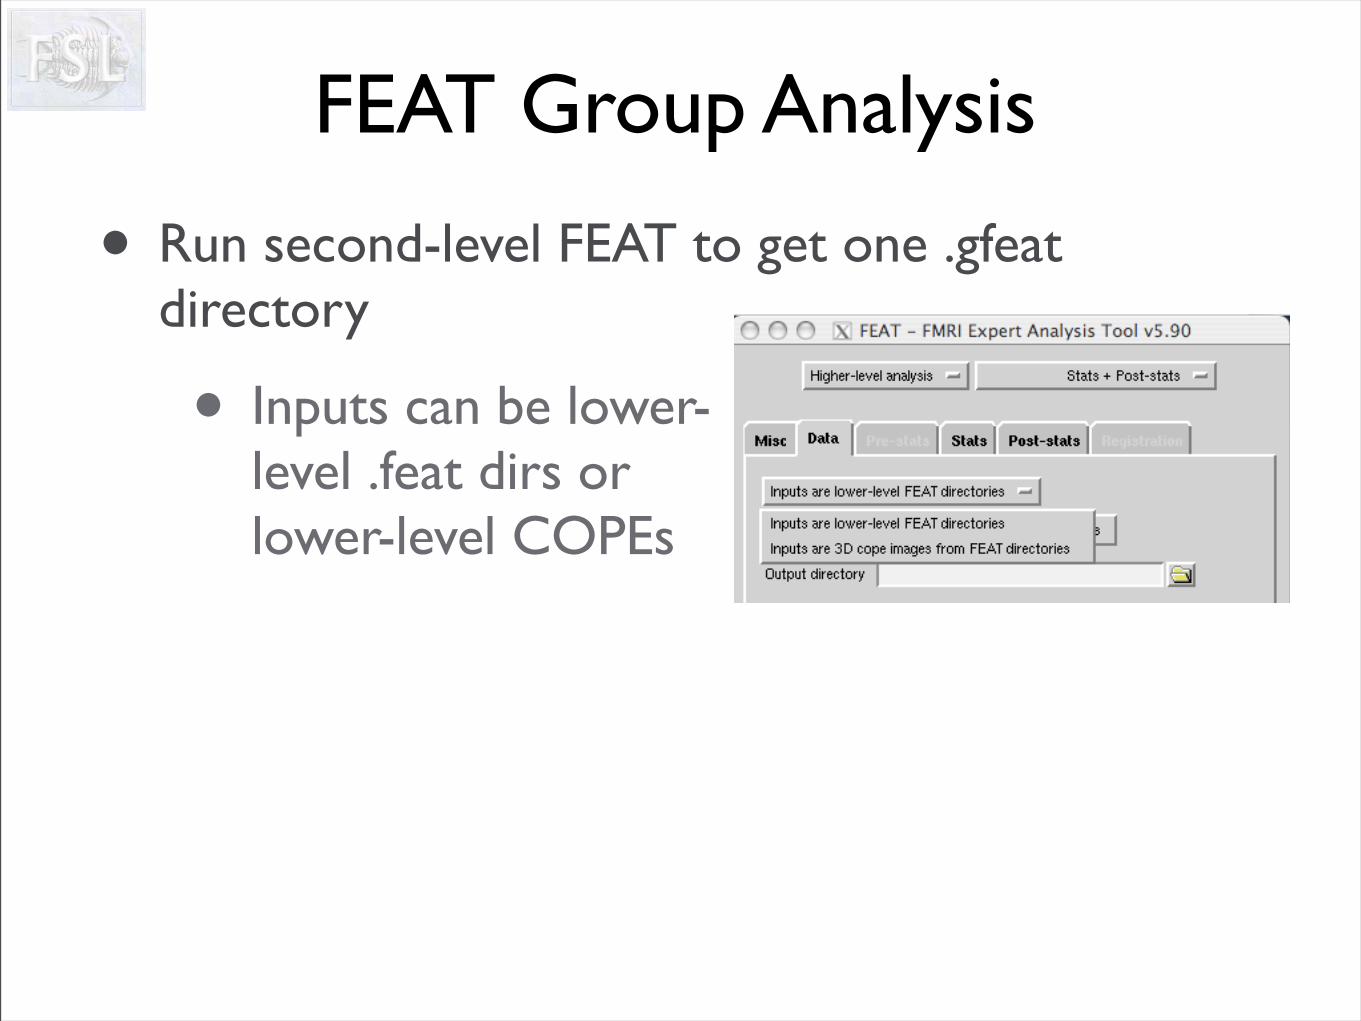
• Run second-level FEAT to get one .gfeat directory
• Inputs can be lower-level .feat dirs or lower-level COPEs
FEAT Group Analysis
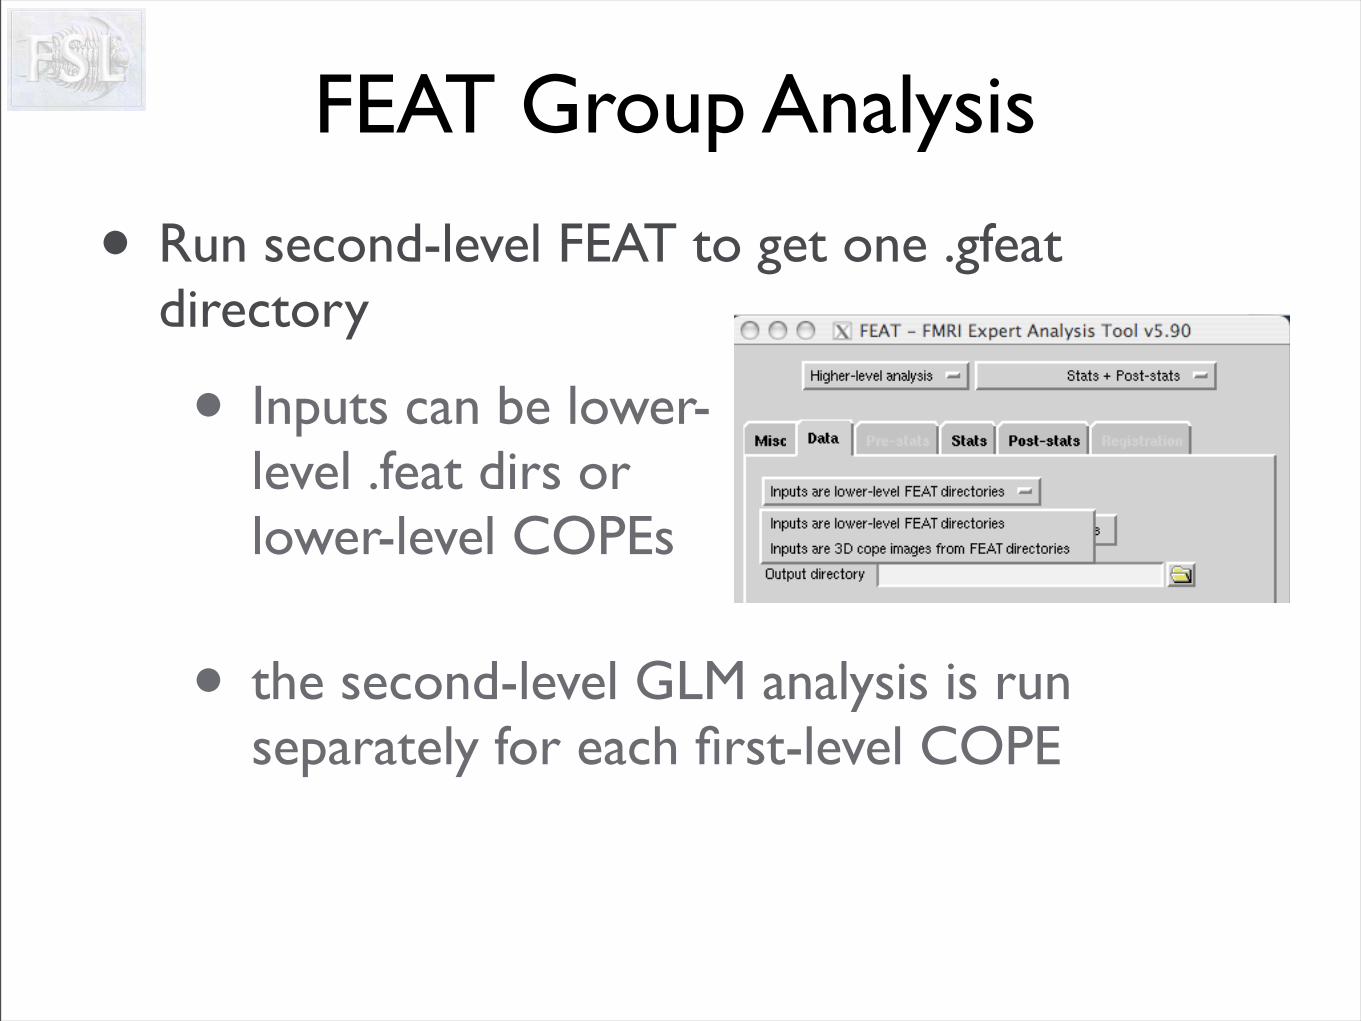
• Run second-level FEAT to get one .gfeat directory
• Inputs can be lower-level .feat dirs or lower-level COPEs
• the second-level GLM analysis is run separately for each first-level COPE
FEAT Group Analysis
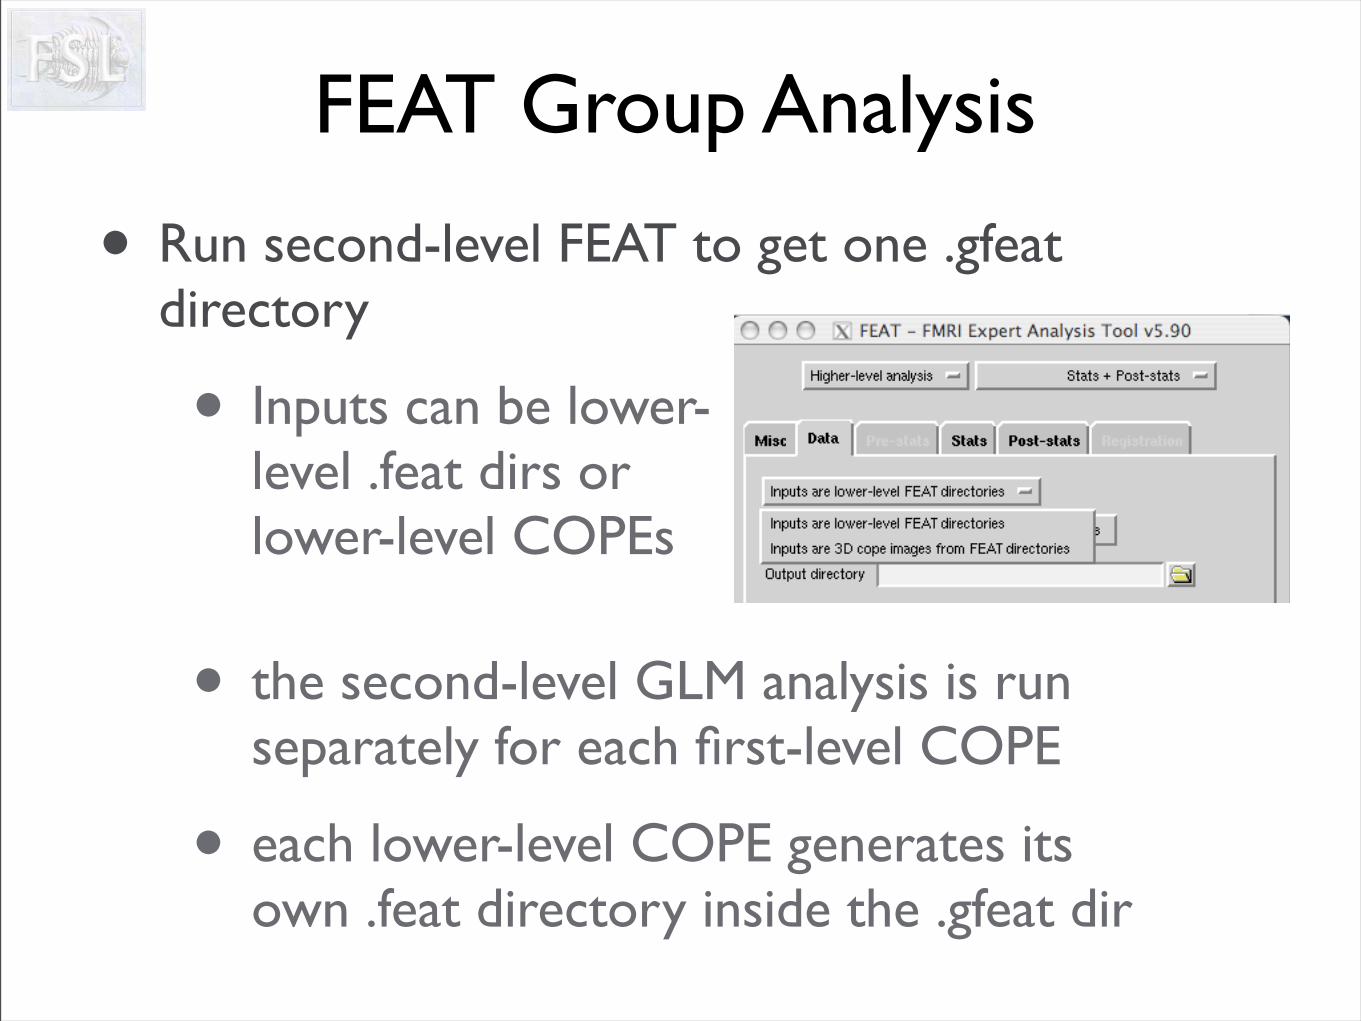
• Run second-level FEAT to get one .gfeat directory
• Inputs can be lower-level .feat dirs or lower-level COPEs
• the second-level GLM analysis is run separately for each first-level COPE
• each lower-level COPE generates its own .feat directory inside the .gfeat dir
That’s all folks
Appendix:Advanced topics
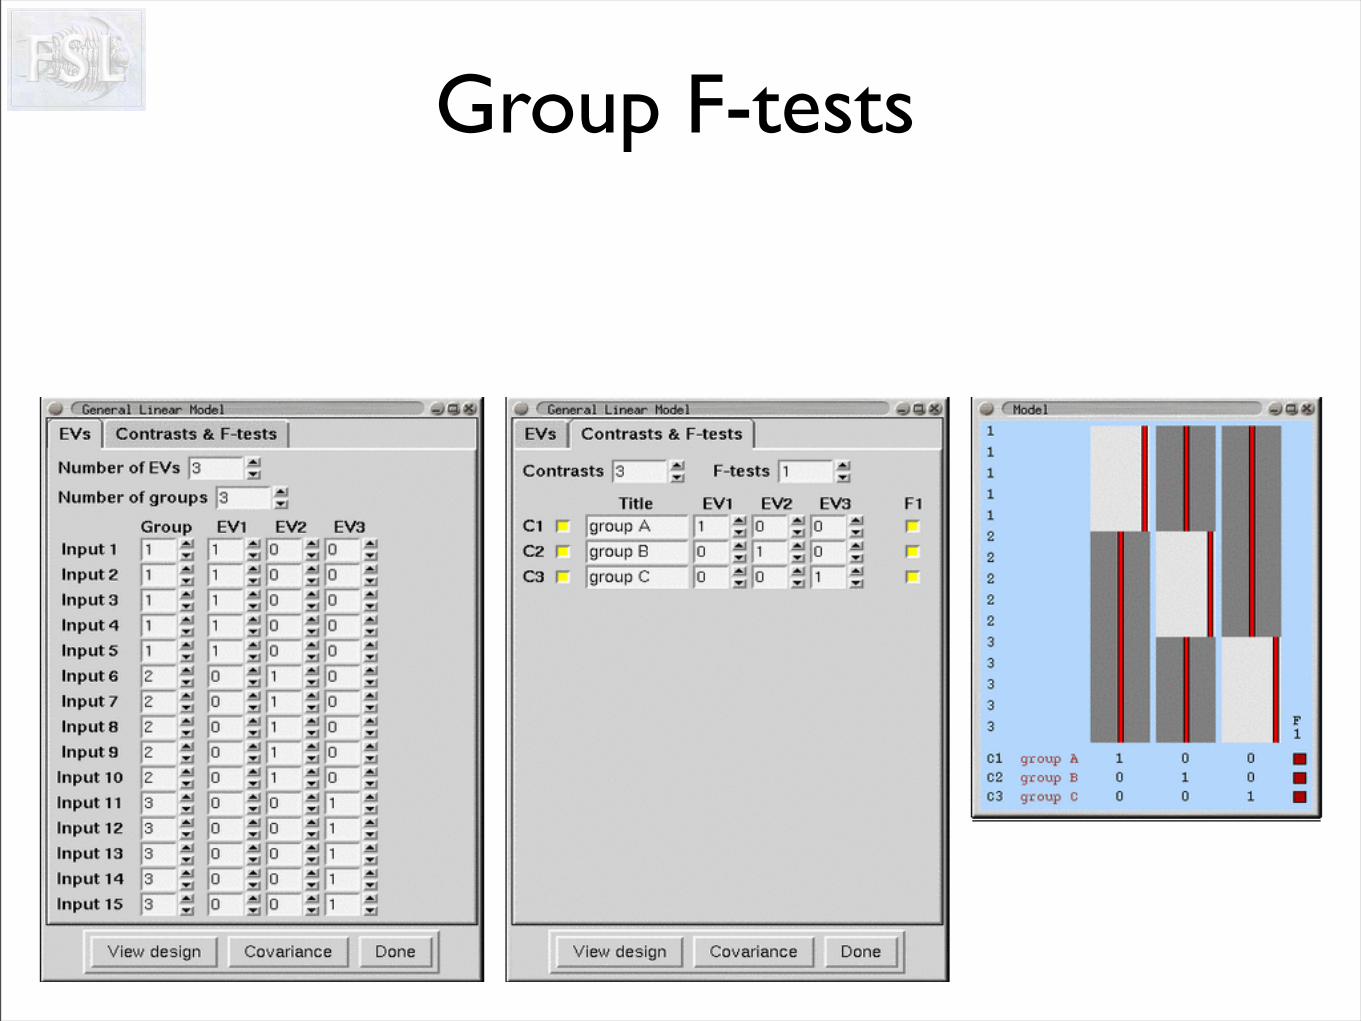
Group F-tests
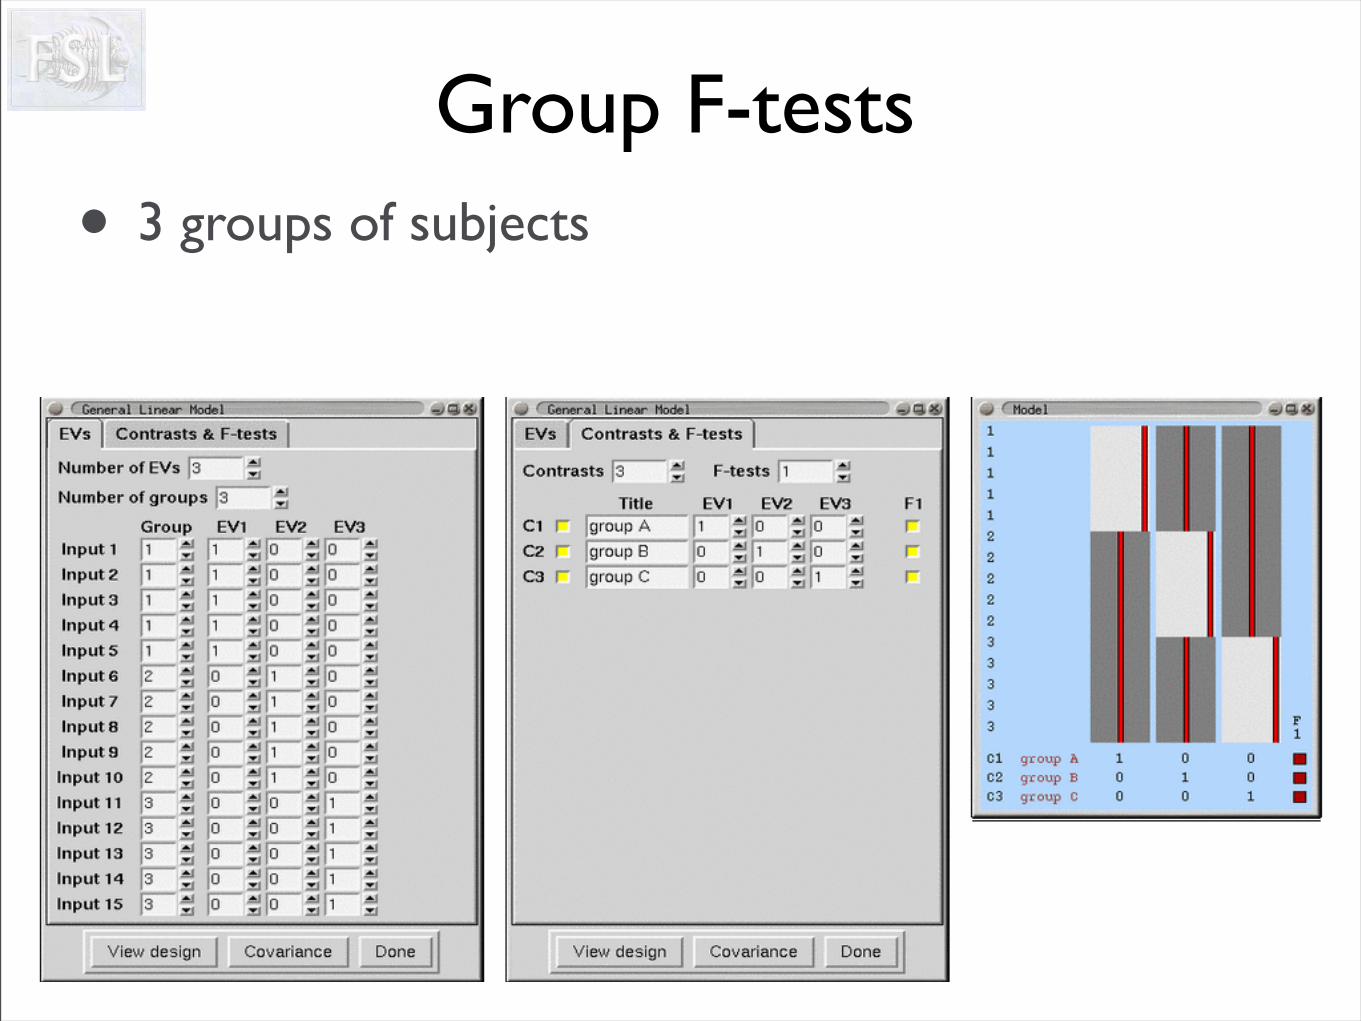
Group F-tests• 3 groups of subjects
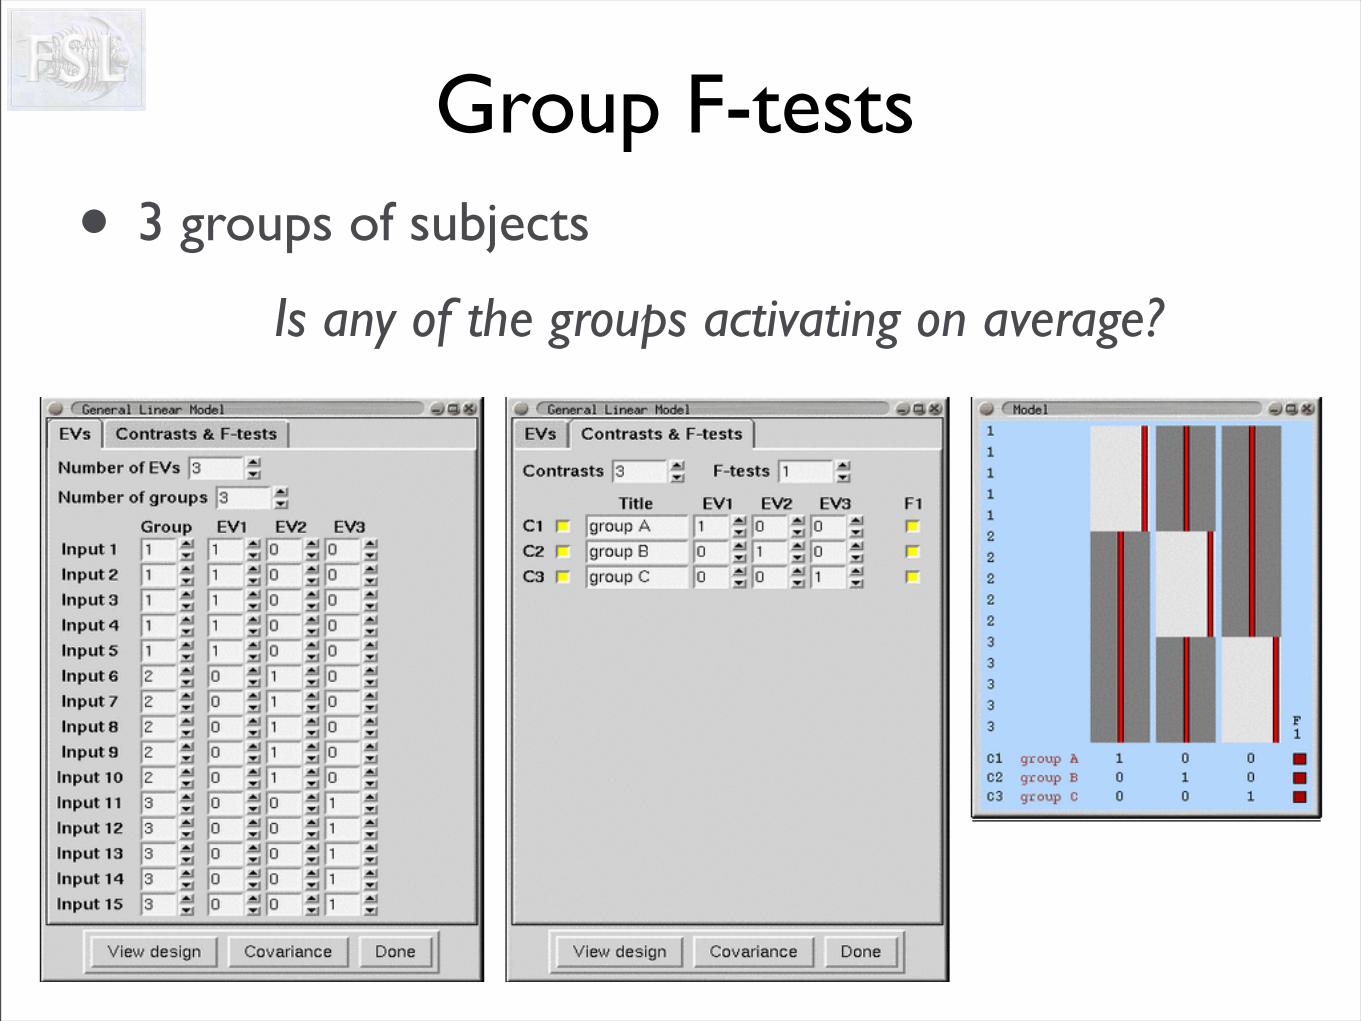
Group F-tests• 3 groups of subjects
Is any of the groups activating on average?
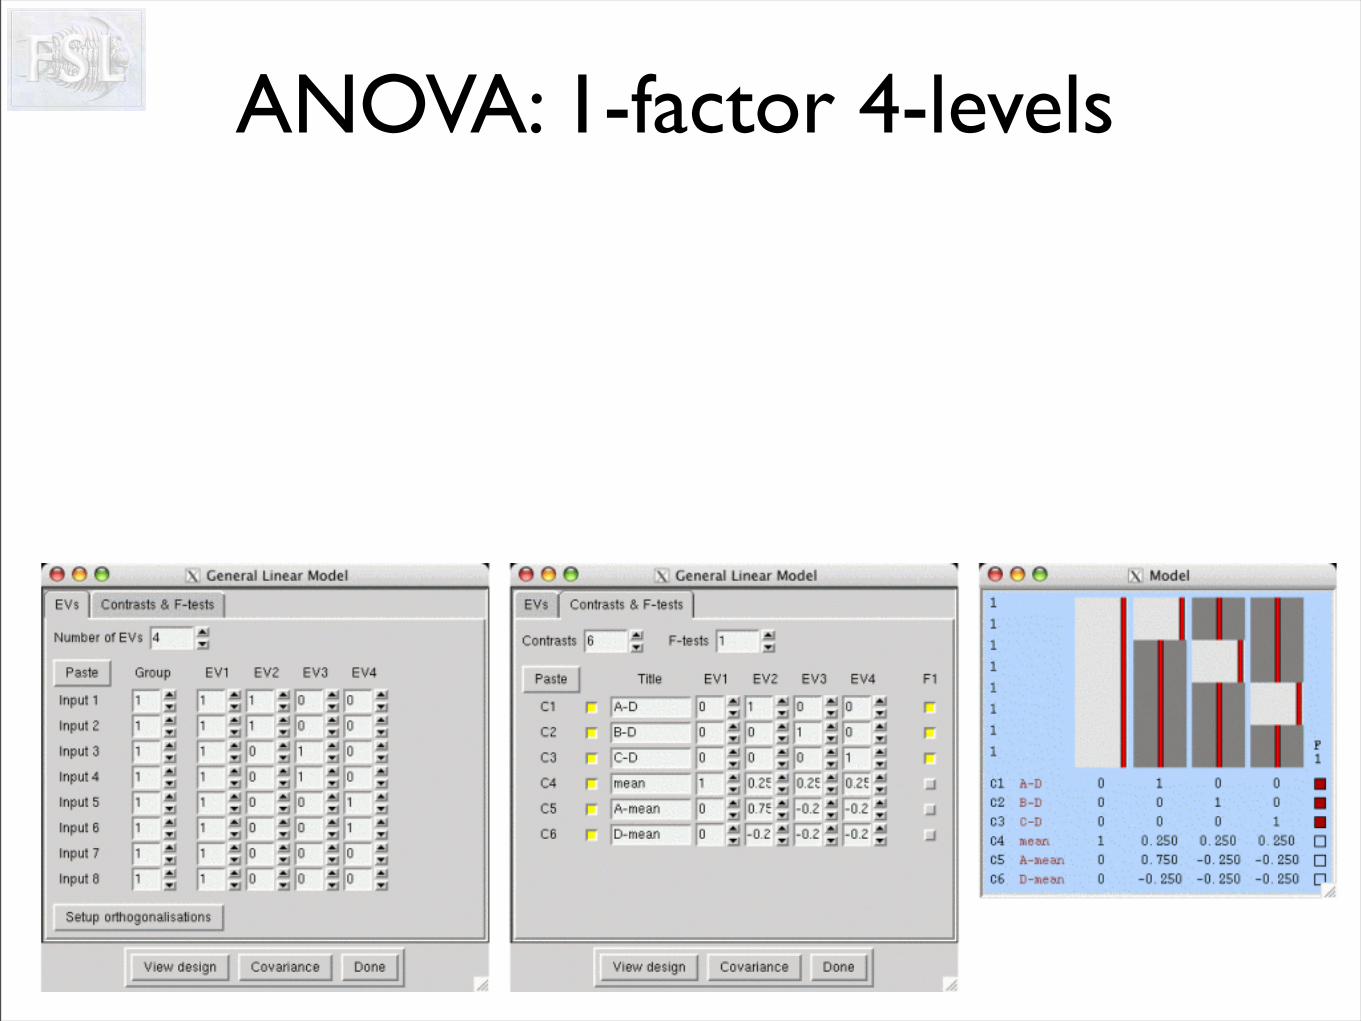
ANOVA: 1-factor 4-levels
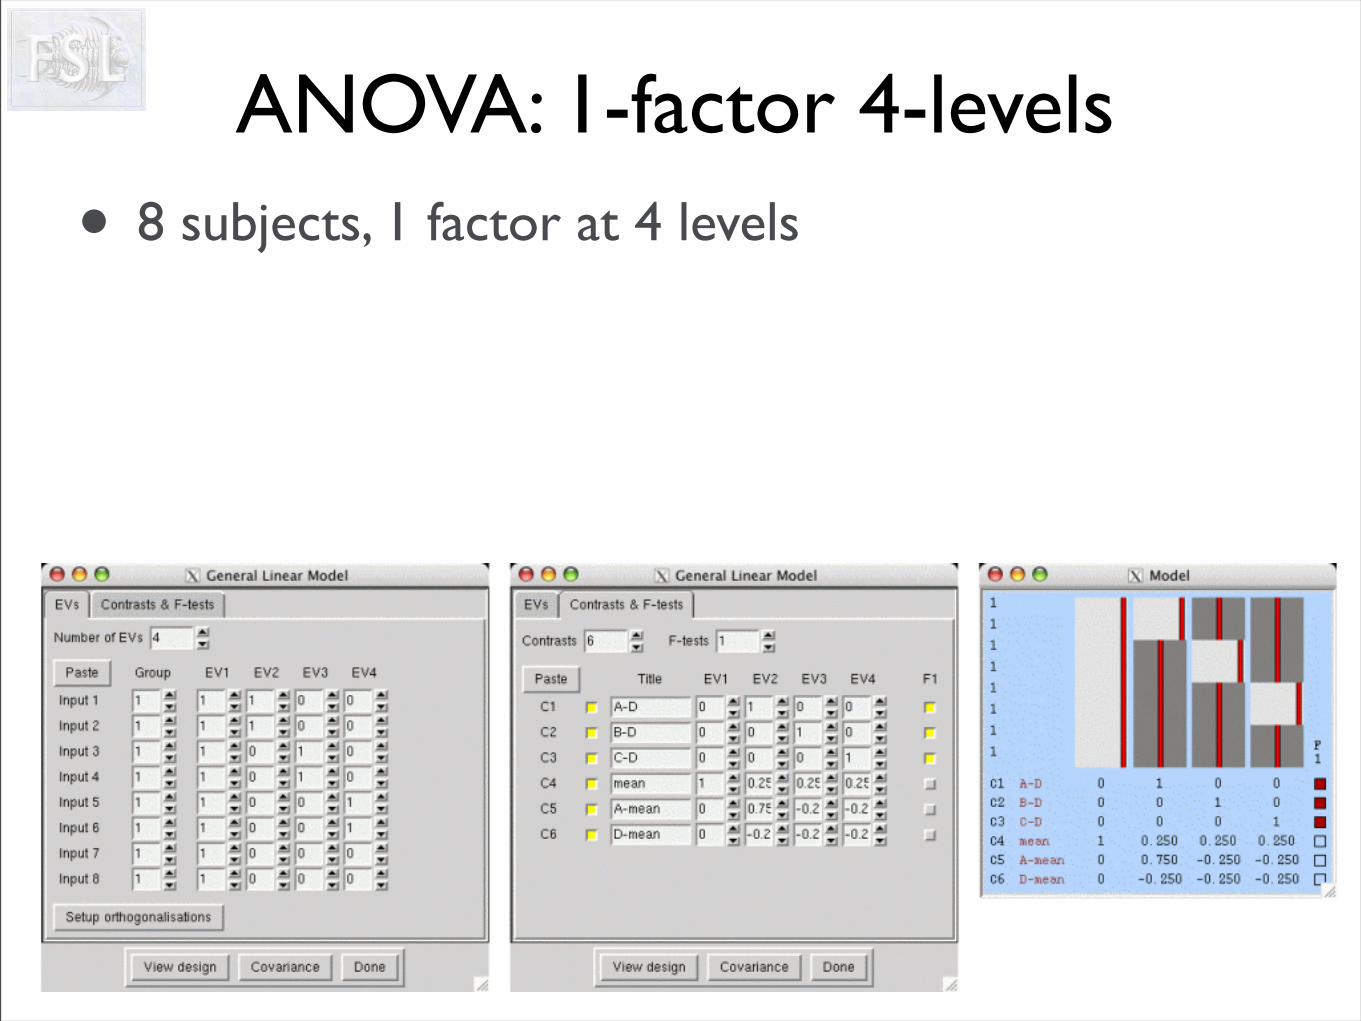
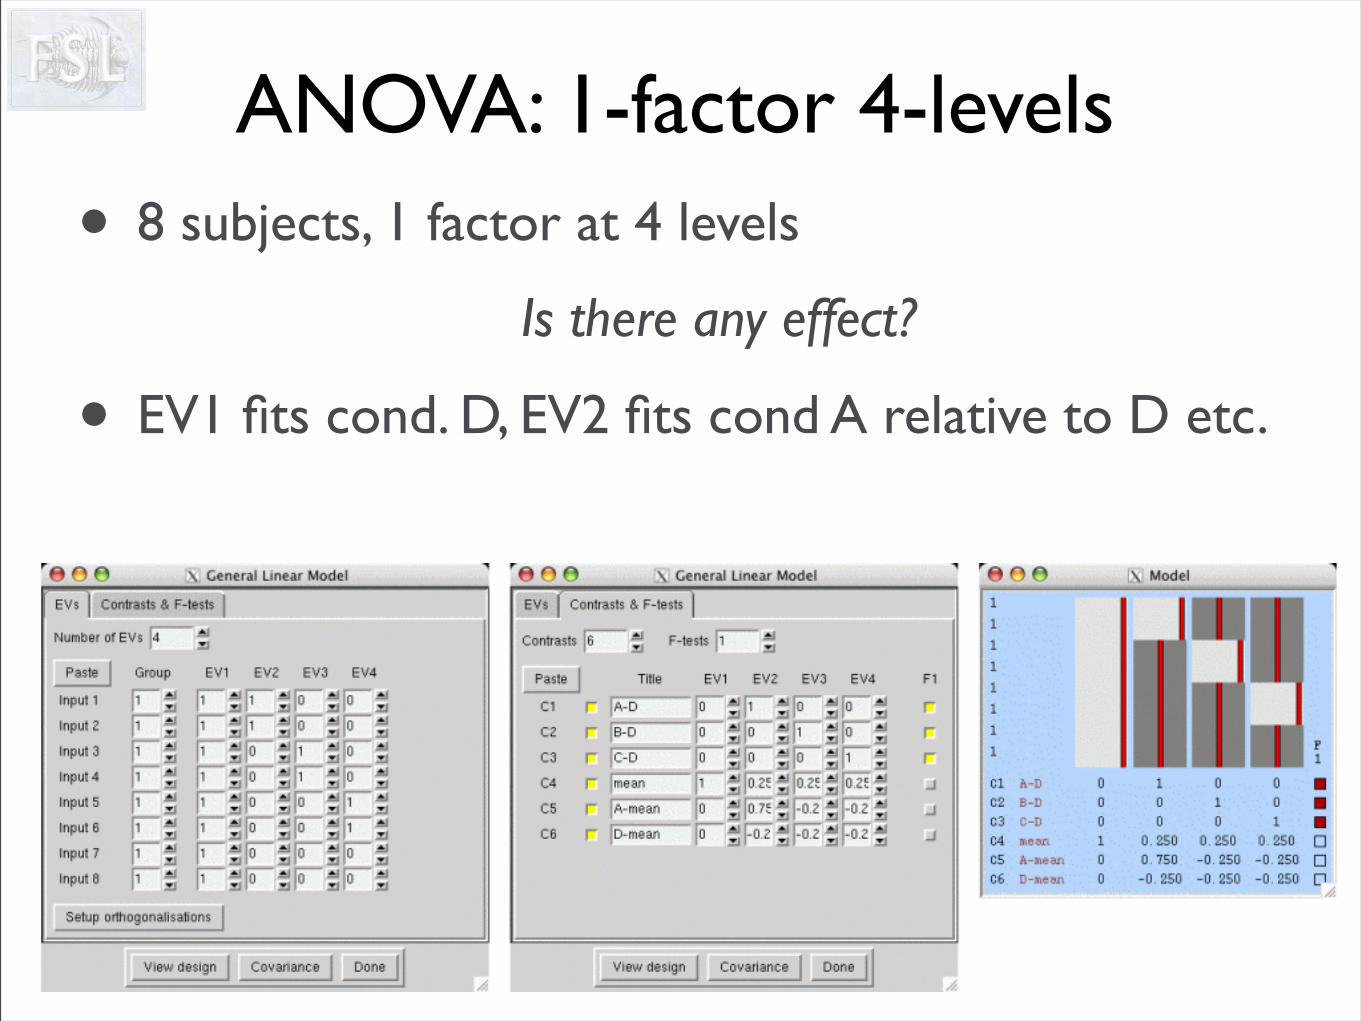
ANOVA: 1-factor 4-levels• 8 subjects, 1 factor at 4 levels
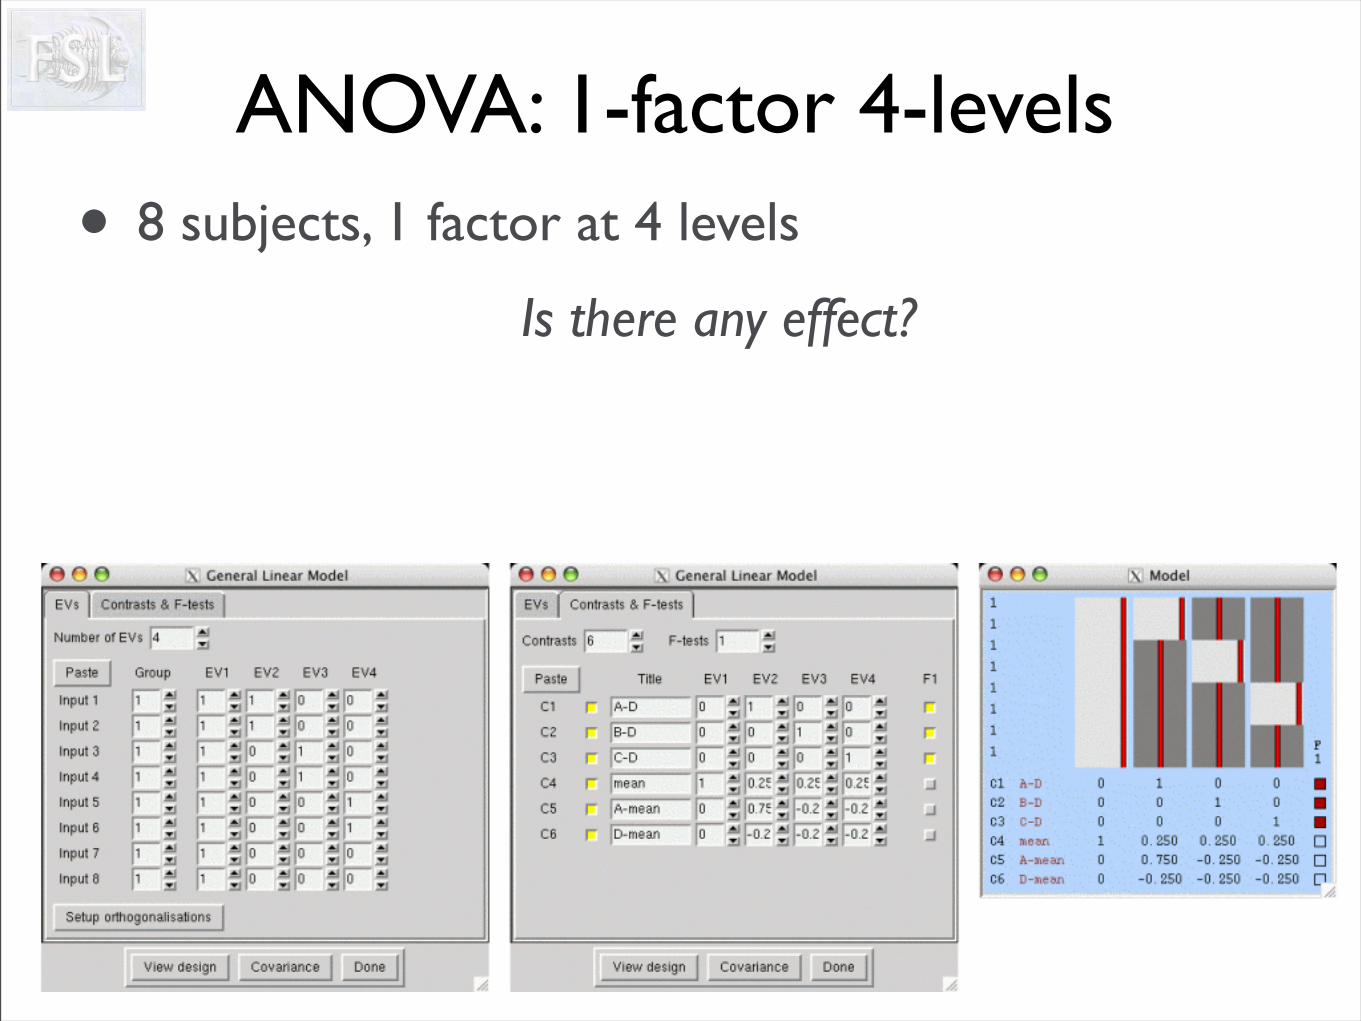
ANOVA: 1-factor 4-levels• 8 subjects, 1 factor at 4 levels
Is there any effect?
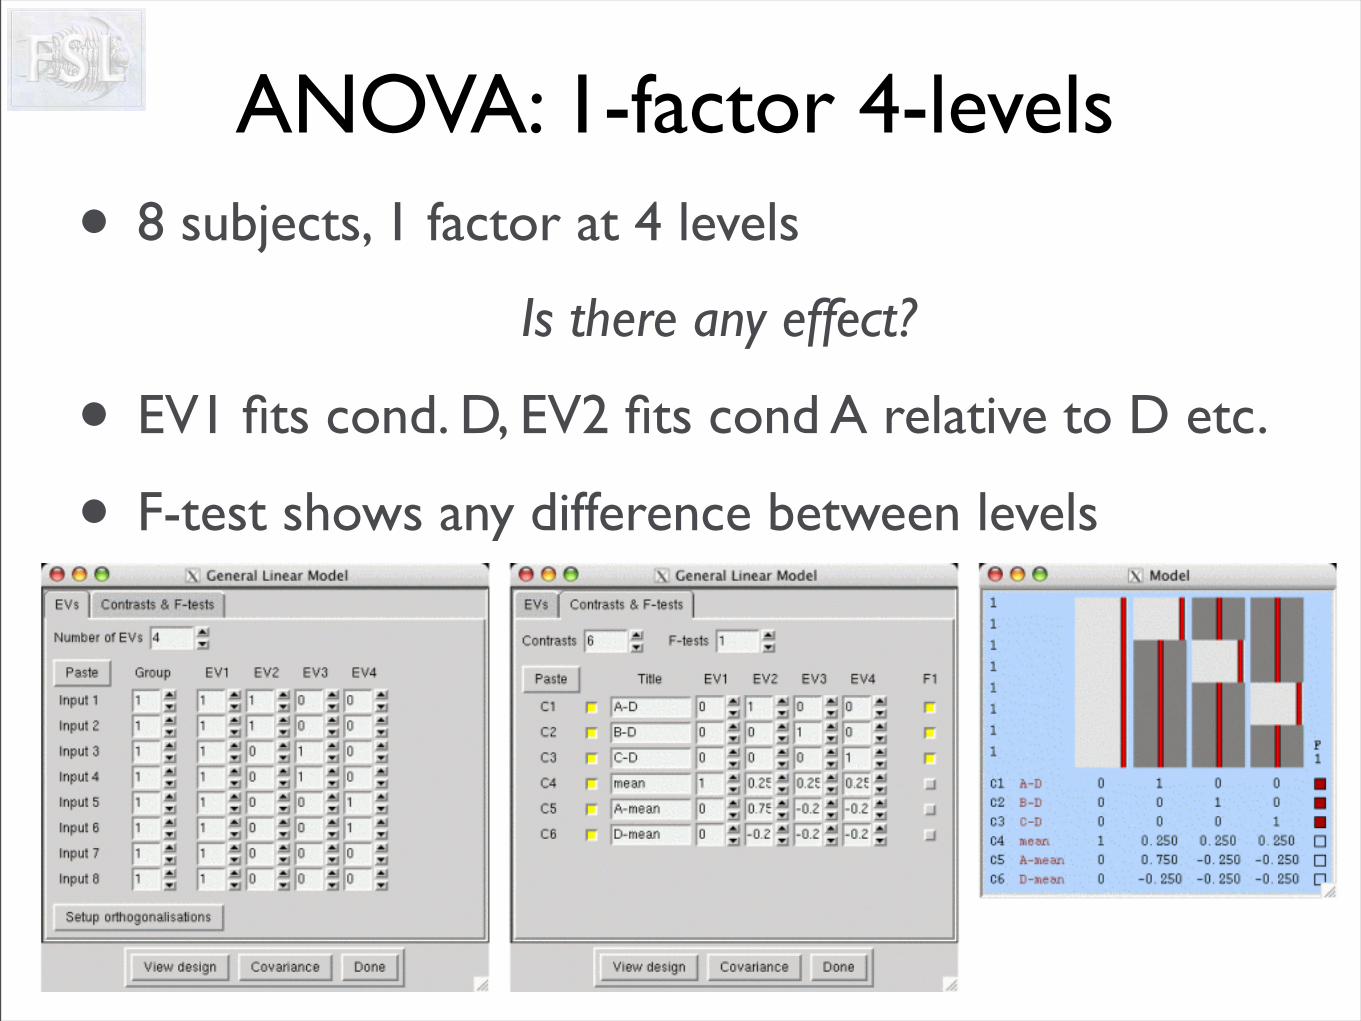
ANOVA: 1-factor 4-levels• 8 subjects, 1 factor at 4 levels
Is there any effect?
• EV1 fits cond. D, EV2 fits cond A relative to D etc.
ANOVA: 1-factor 4-levels• 8 subjects, 1 factor at 4 levels
Is there any effect?
• EV1 fits cond. D, EV2 fits cond A relative to D etc.
• F-test shows any difference between levels
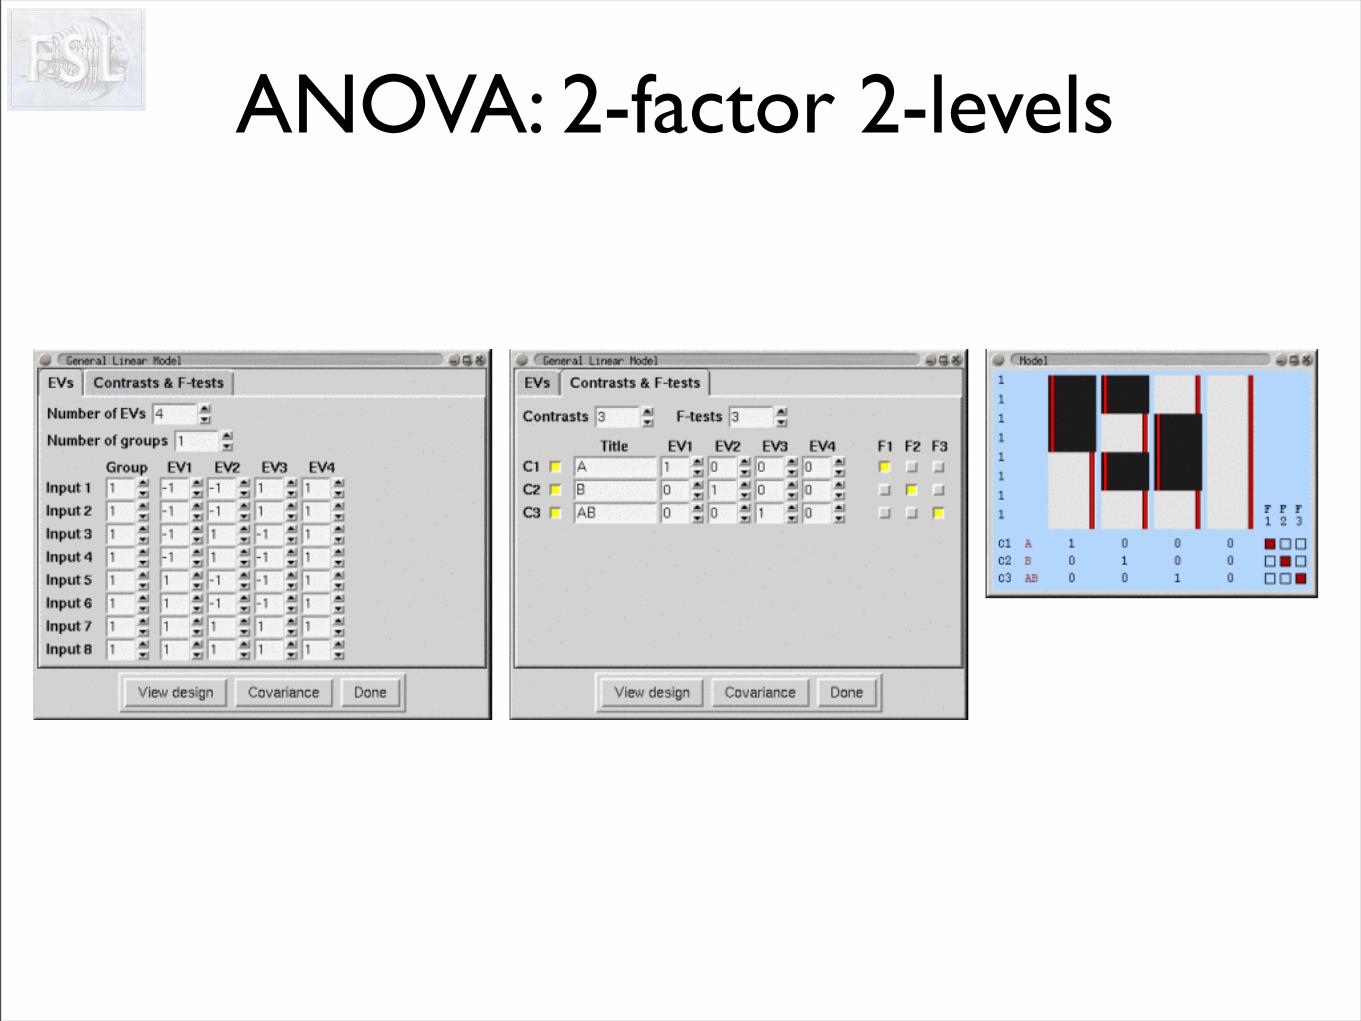
ANOVA: 2-factor 2-levels
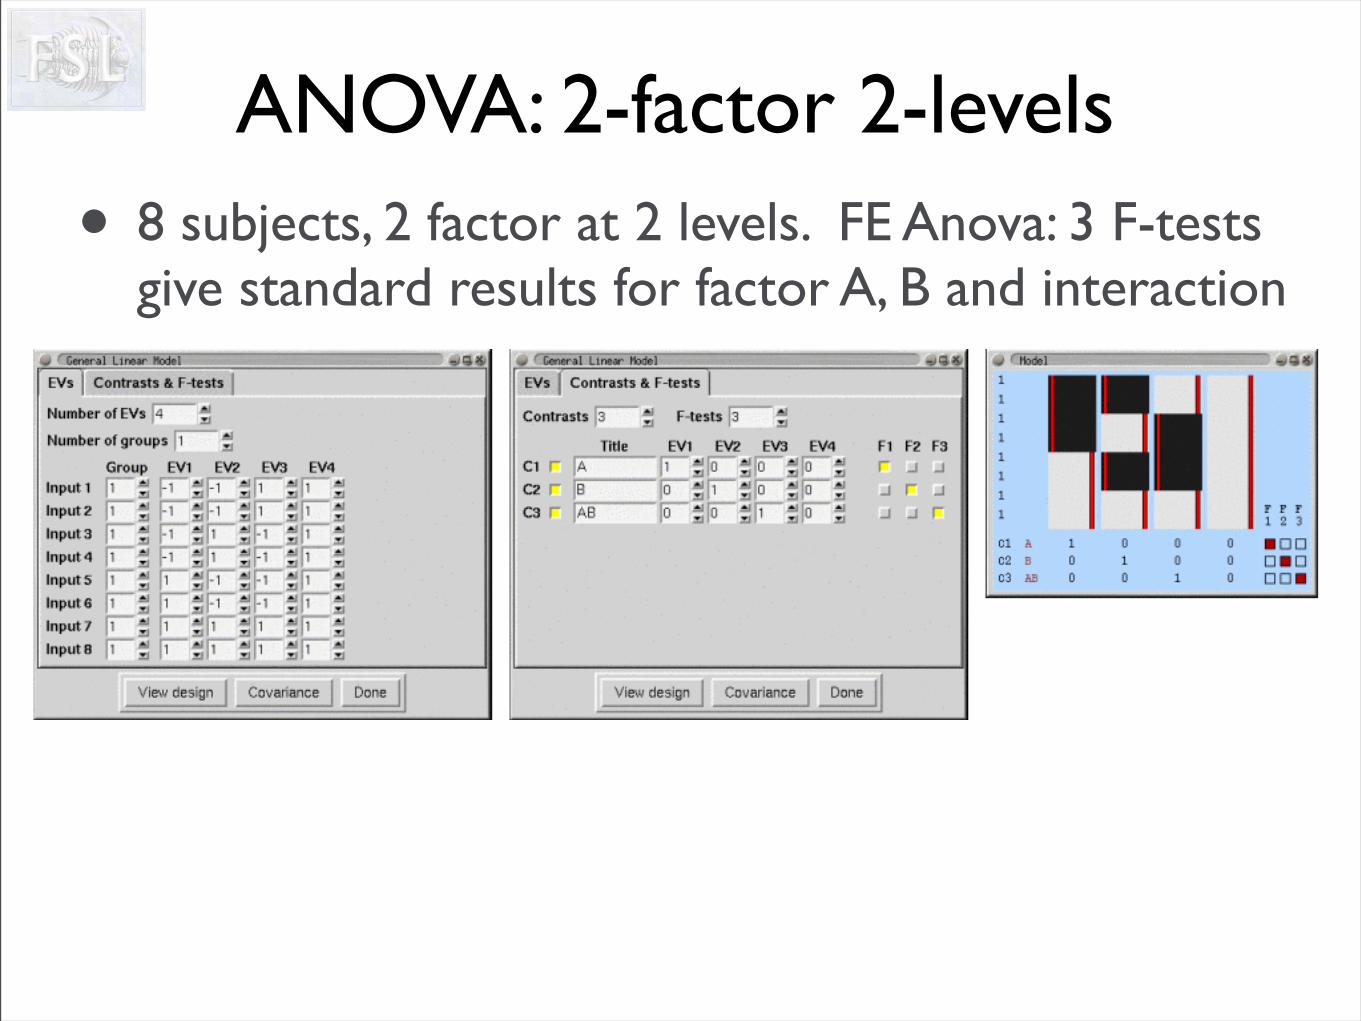
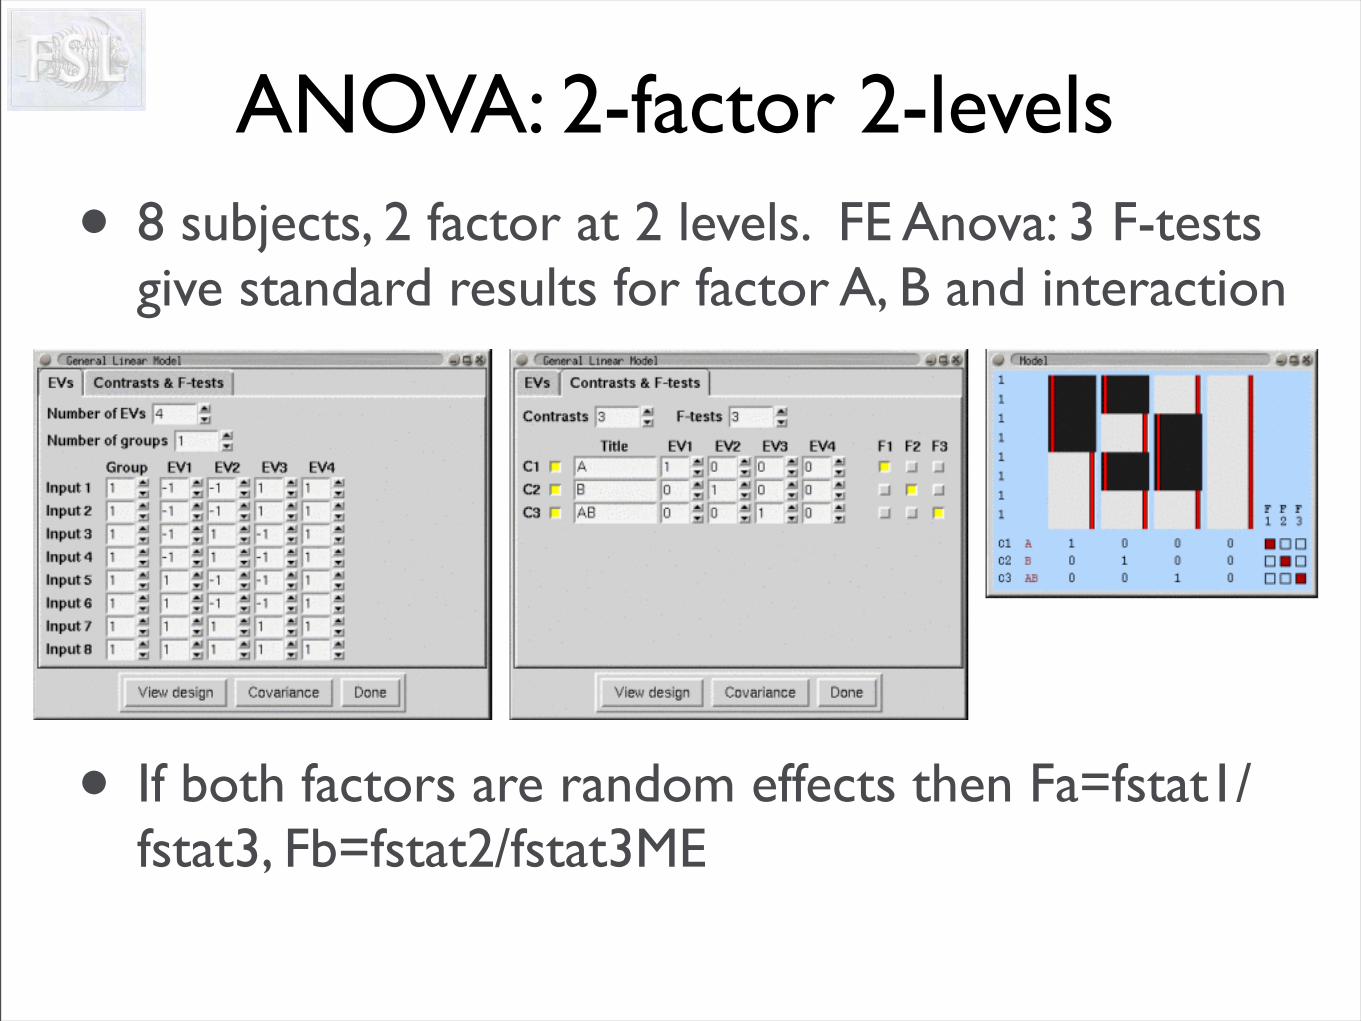
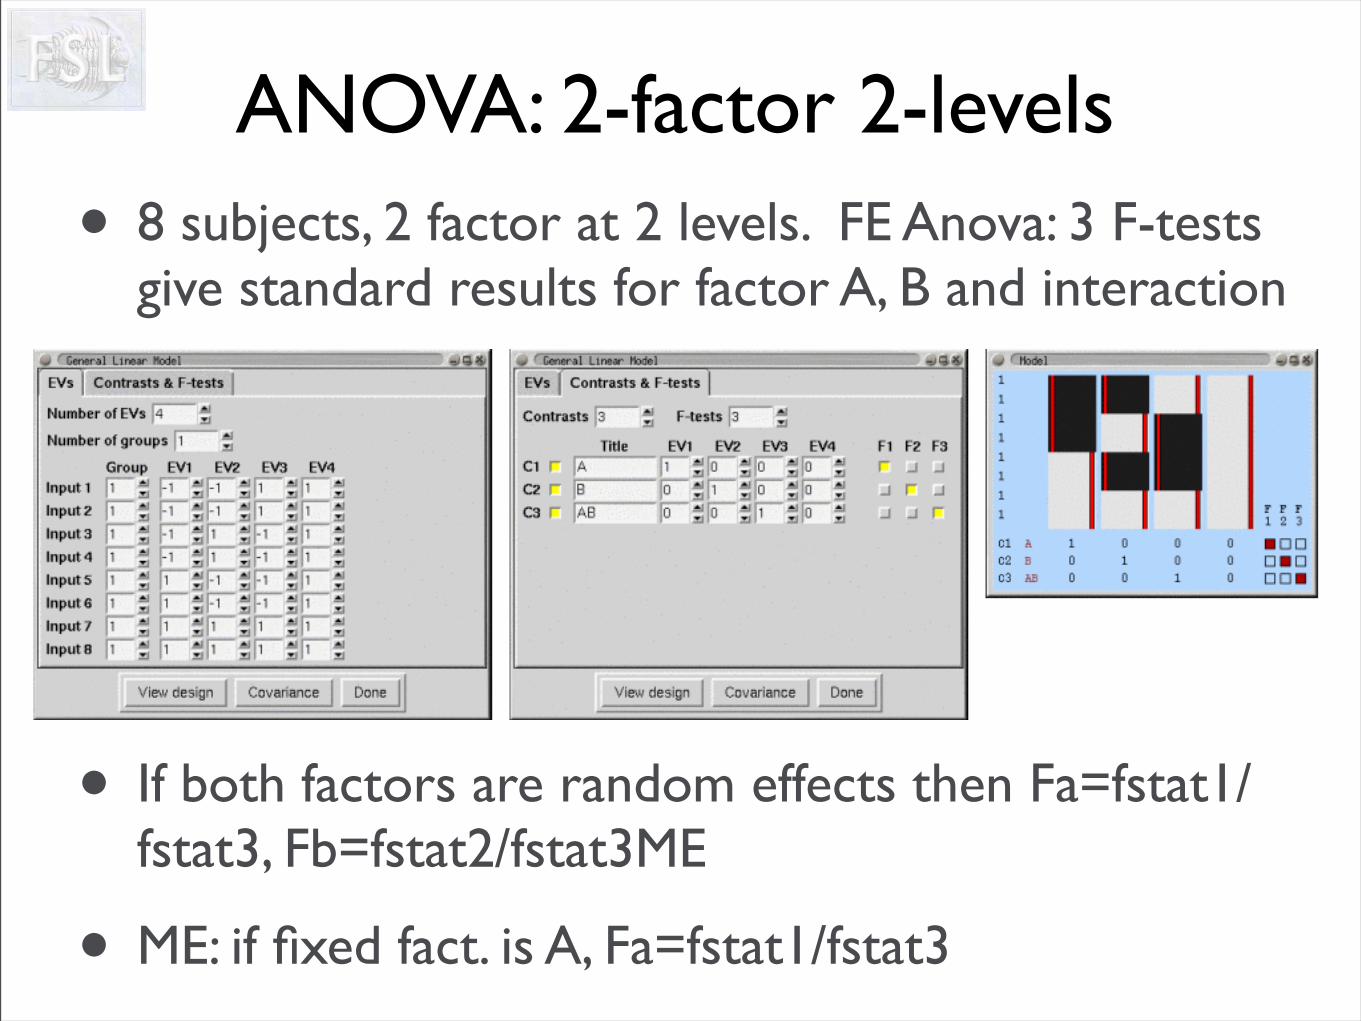
ANOVA: 2-factor 2-levels• 8 subjects, 2 factor at 2 levels. FE Anova: 3 F-tests
give standard results for factor A, B and interaction
ANOVA: 2-factor 2-levels• 8 subjects, 2 factor at 2 levels. FE Anova: 3 F-tests
give standard results for factor A, B and interaction
• If both factors are random effects then Fa=fstat1/fstat3, Fb=fstat2/fstat3ME
ANOVA: 2-factor 2-levels• 8 subjects, 2 factor at 2 levels. FE Anova: 3 F-tests
give standard results for factor A, B and interaction
• If both factors are random effects then Fa=fstat1/fstat3, Fb=fstat2/fstat3ME
• ME: if fixed fact. is A, Fa=fstat1/fstat3
ANOVA: 3-factor 2-levels
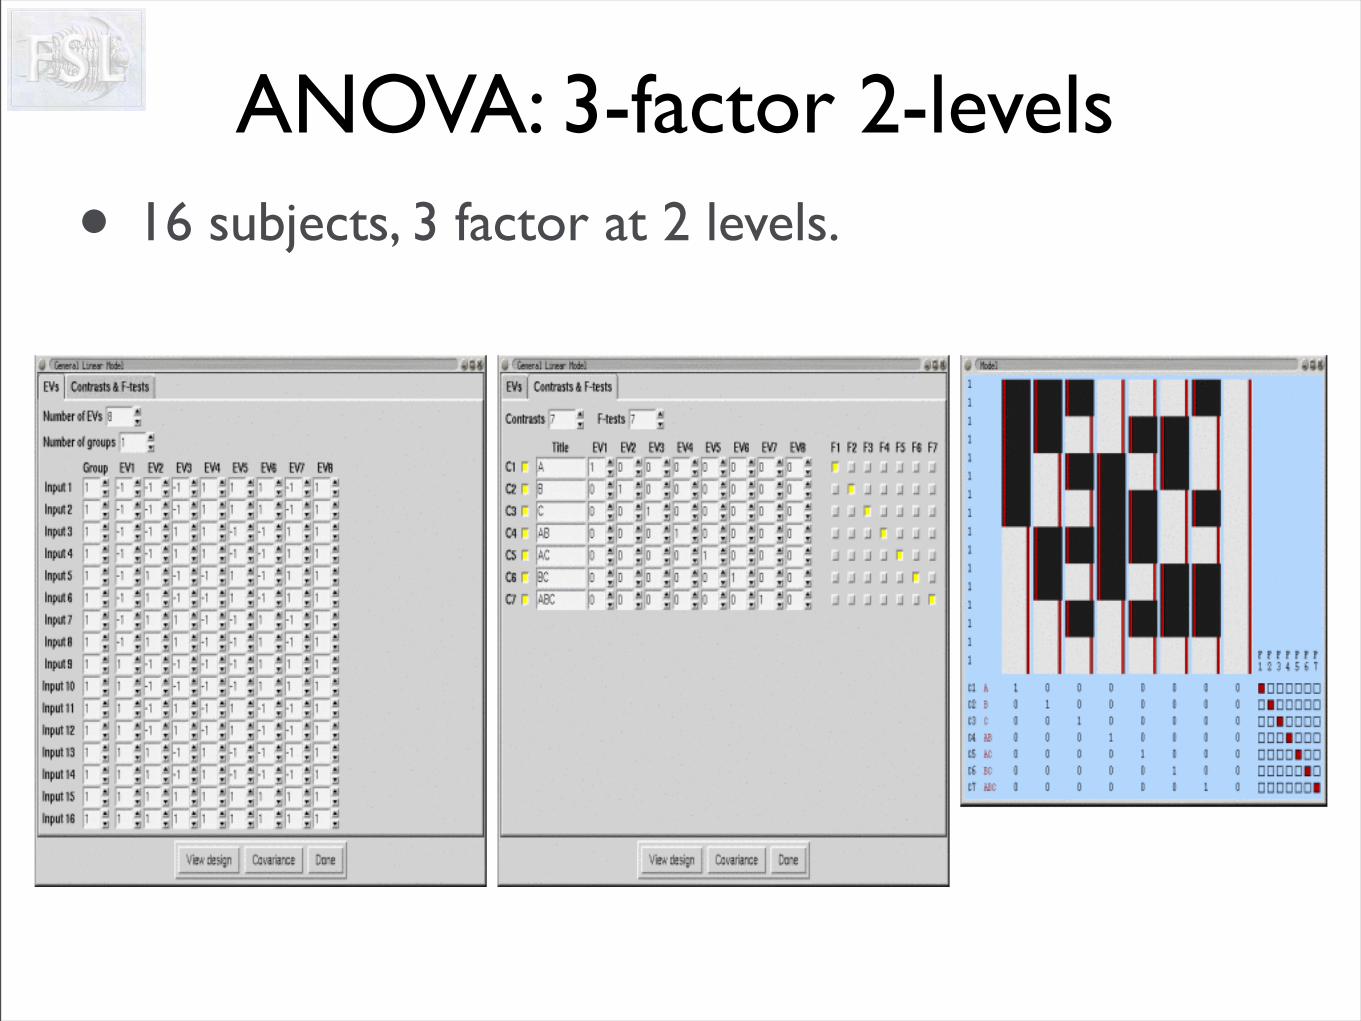
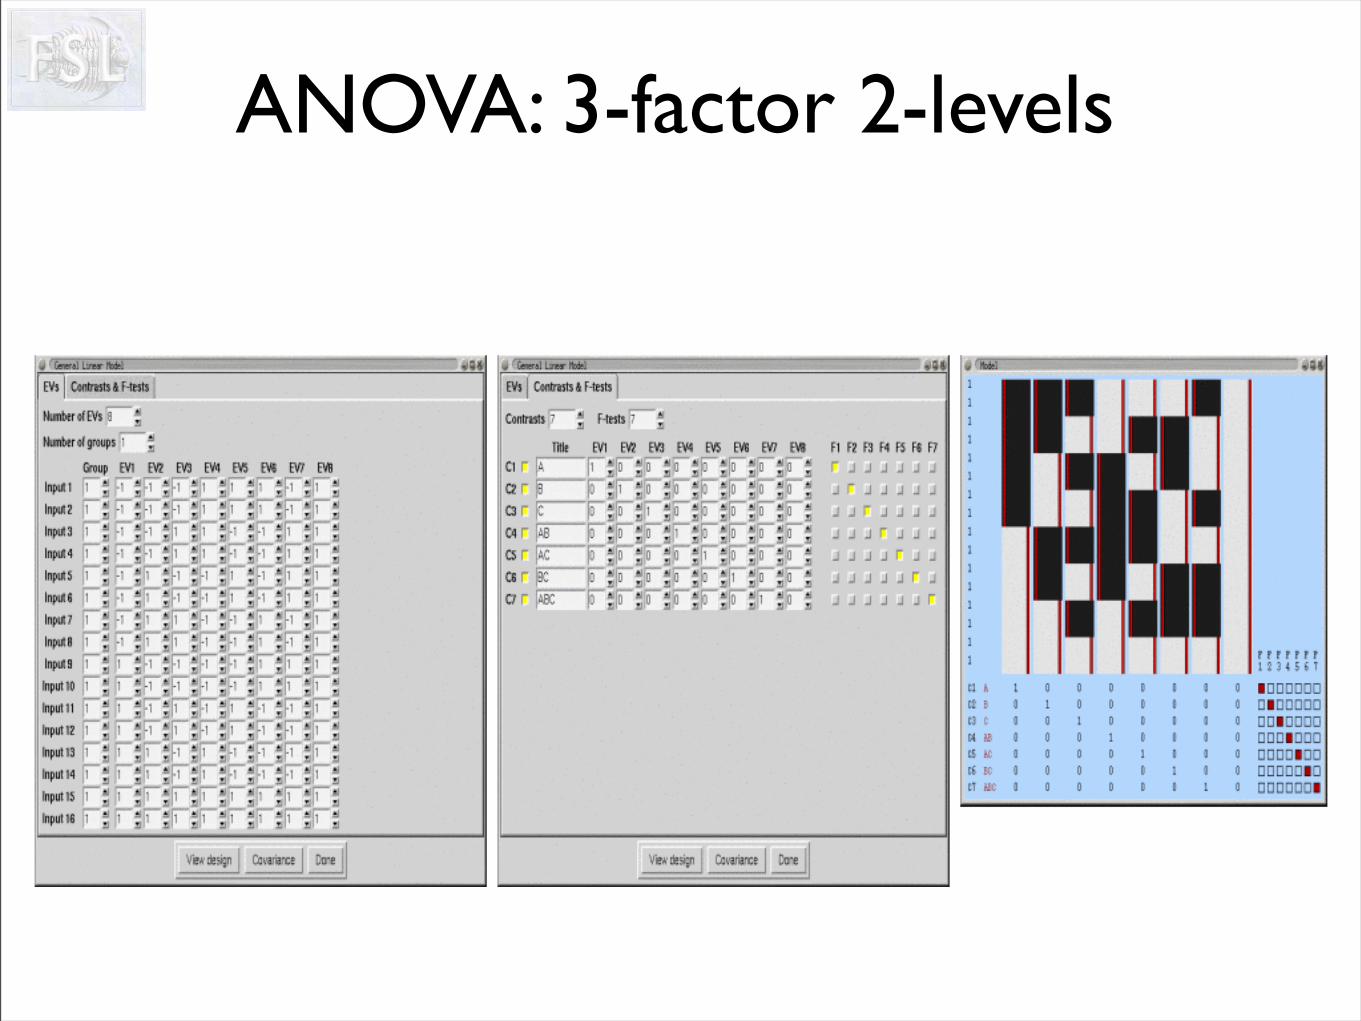
ANOVA: 3-factor 2-levels• 16 subjects, 3 factor at 2 levels.
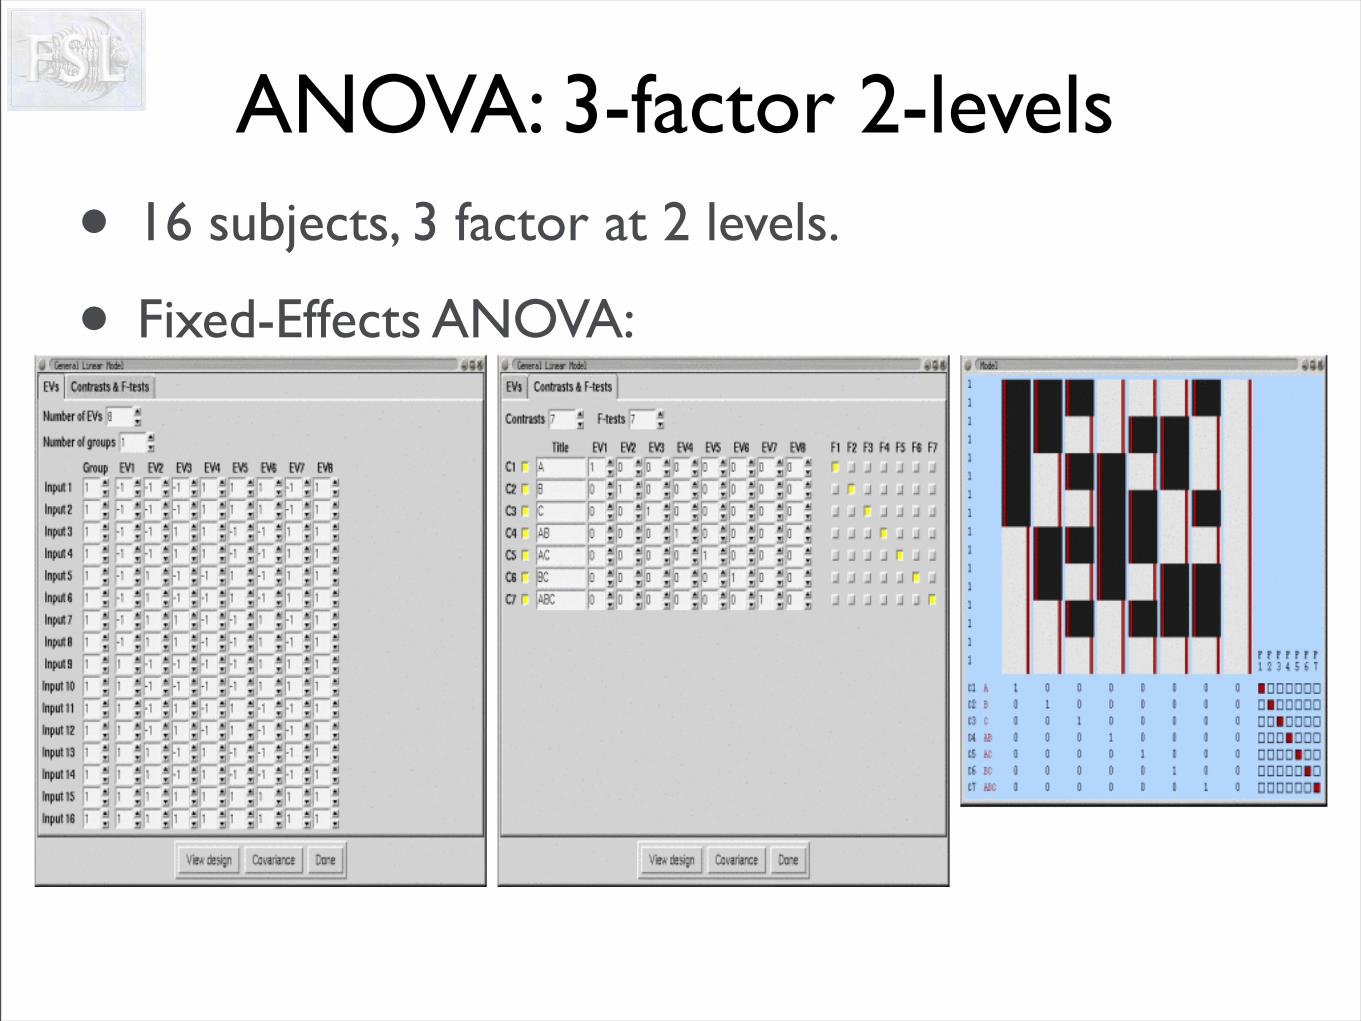
ANOVA: 3-factor 2-levels• 16 subjects, 3 factor at 2 levels.
• Fixed-Effects ANOVA:
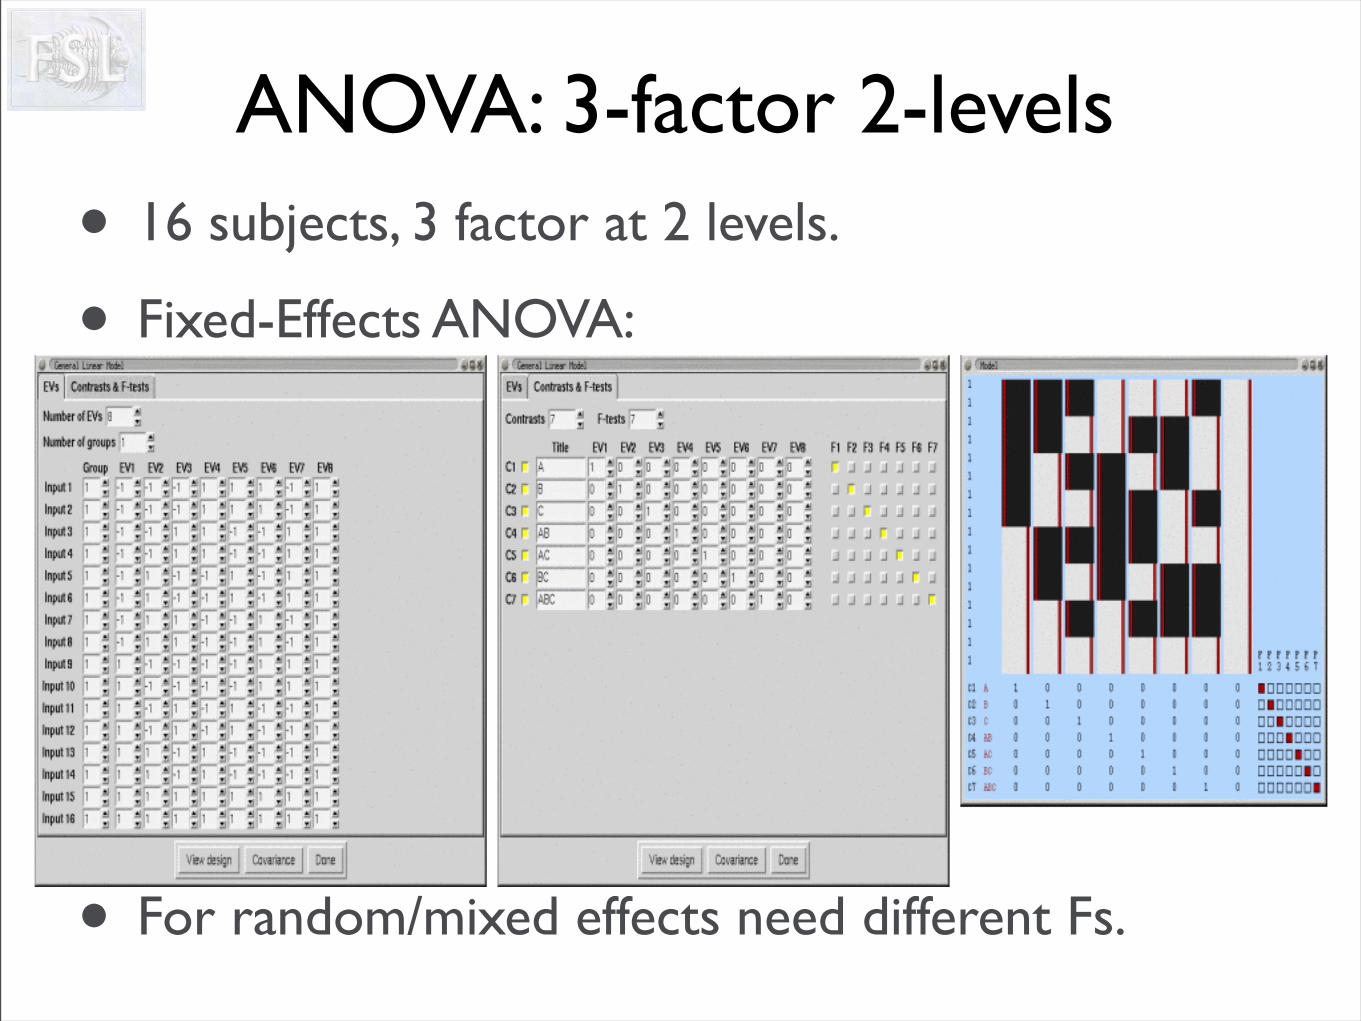
ANOVA: 3-factor 2-levels• 16 subjects, 3 factor at 2 levels.
• Fixed-Effects ANOVA:
• For random/mixed effects need different Fs.
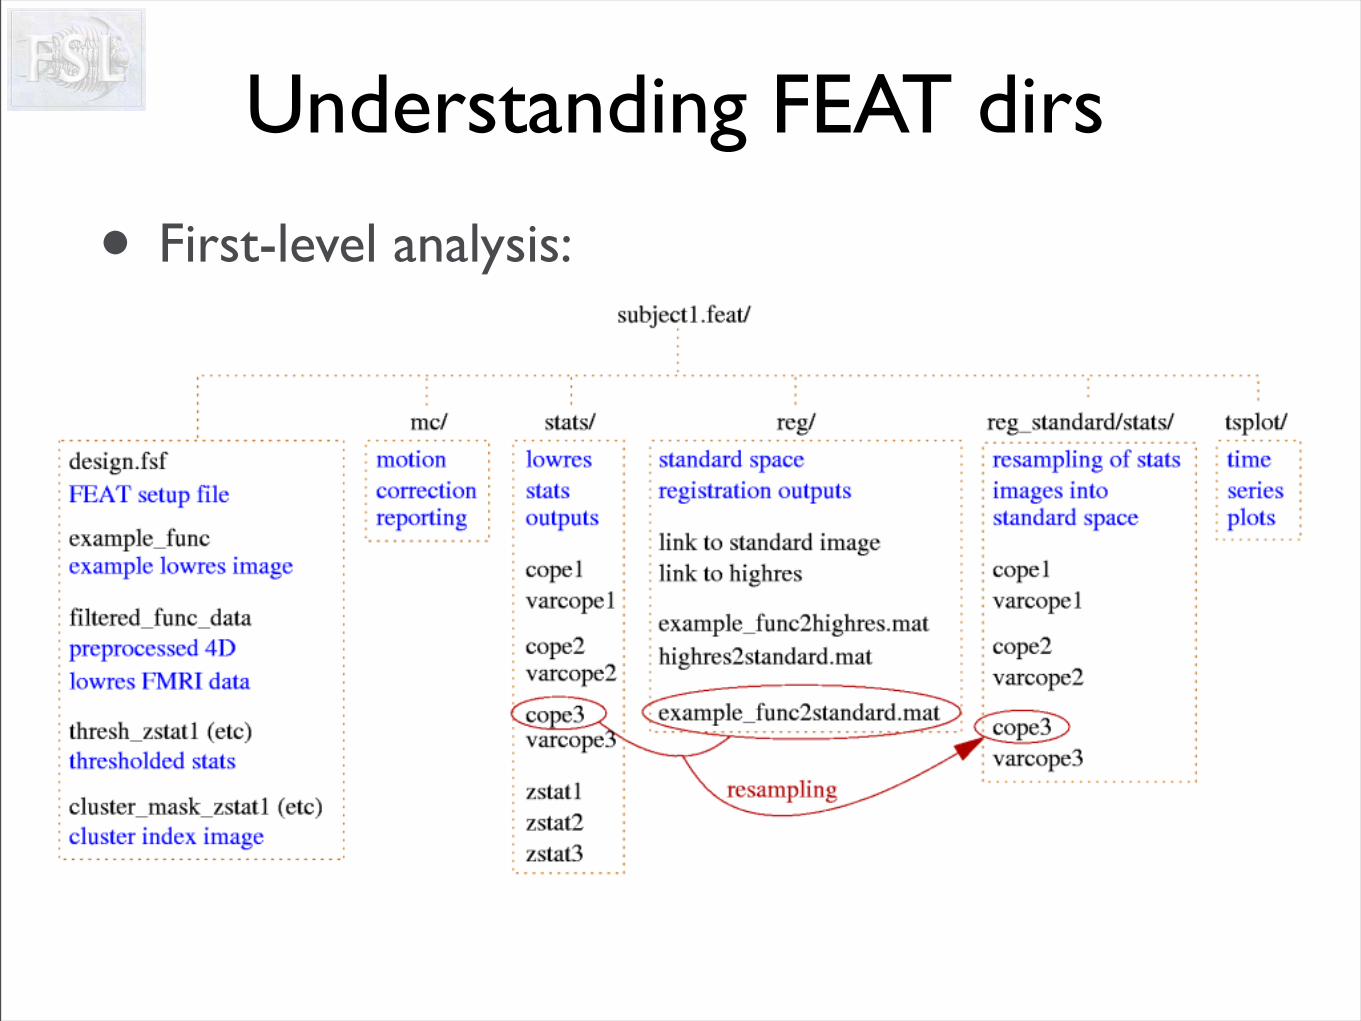
Understanding FEAT dirs
• First-level analysis:
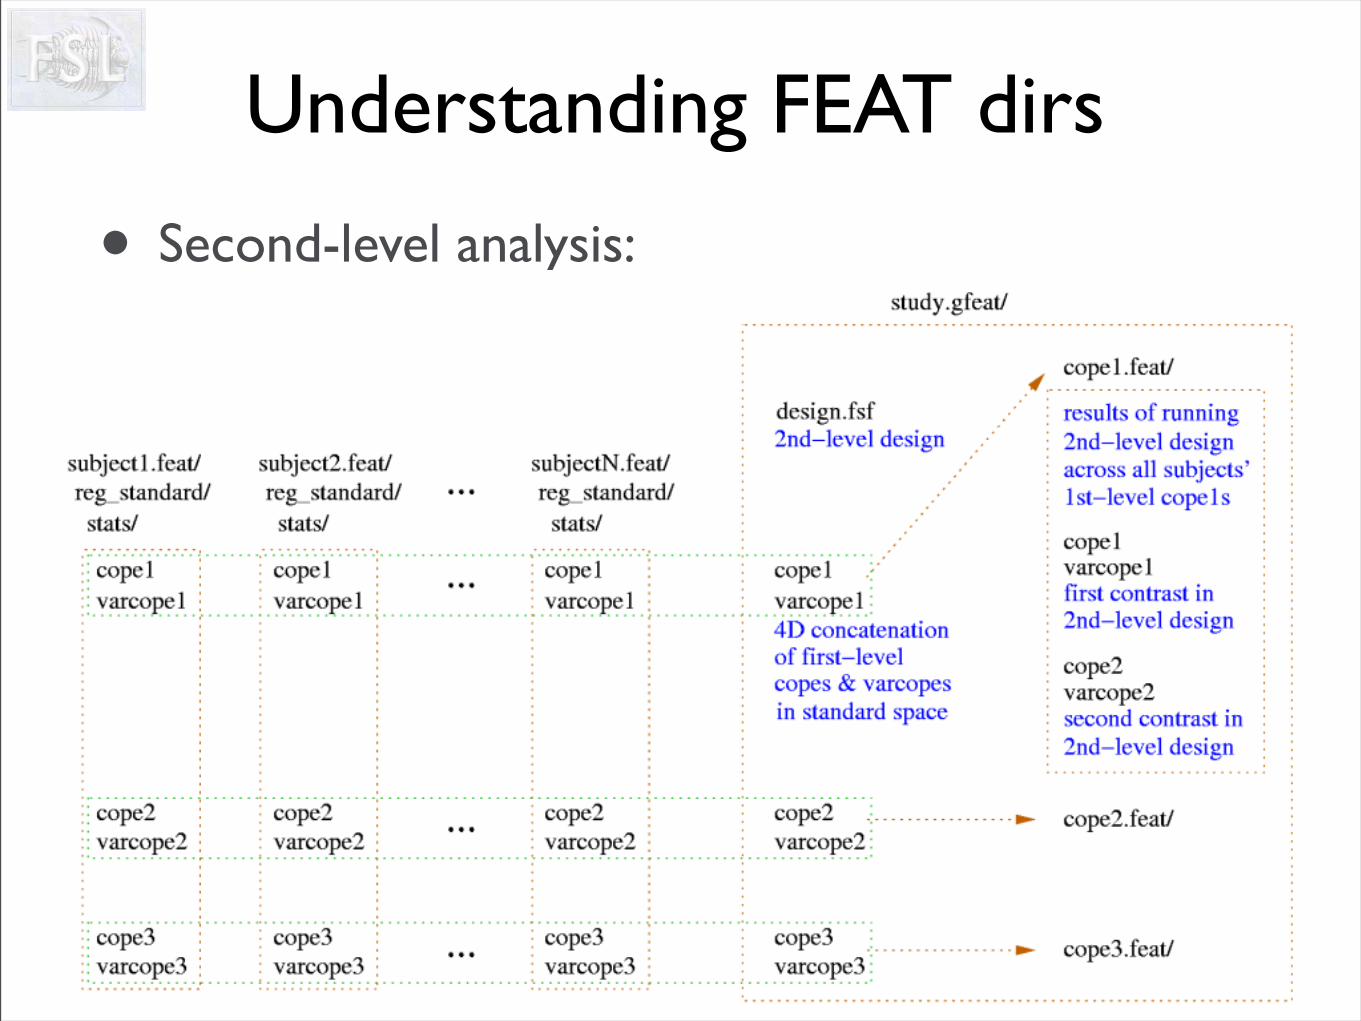
Understanding FEAT dirs
• Second-level analysis:

That’s all folks