Fluoride IQ Harvard
32
ENVIRONMENTAL HEALTH PERSPECTIVES ENVIRONMENTAL HEALTH PERSPECTIVES National Institutes of Health U.S. Department of Health and Human Services Developmental Fluoride Neurotoxicity: A Systematic Review and Meta-Analysis Anna L. Choi, Guifan Sun, Ying Zhang, Philippe Grandjean http://dx.doi.org/10.1289/ehp.1104912 Online 20 July 2012 ehponline.org ehp
-
Upload
helloforward -
Category
Documents
-
view
53 -
download
4
description
Fluoride IQ Harvard
Transcript of Fluoride IQ Harvard
ENVIRONMENTALHEALTH PERSPECTIVES
ENVIRONMENTALHEALTH PERSPECTIVES
National Institutes of HealthU.S. Department of Health and Human Services
Developmental Fluoride Neurotoxicity: A Systematic Review and Meta-Analysis
Anna L. Choi, Guifan Sun, Ying Zhang, Philippe Grandjean
http://dx.doi.org/10.1289/ehp.1104912
Online 20 July 2012
ehponline.org
ehp

1
Developmental Fluoride Neurotoxicity: A Systematic Review and Meta-
Analysis
Anna L. Choi1, Guifan Sun
2, Ying Zhang
3, Philippe Grandjean
1,4
1Department of Environmental Health, Harvard School of Public Health, Boston, MA, USA
2School of Public Health, China Medical University, Shenyang, China
3School of Stomatology, China Medical University, Shenyang, China
4Institute of Public Health, University of Southern Denmark, Odense, Denmark
Author information and address for reprints:
Anna L. Choi, Department of Environmental Health, Harvard School of Public Health,
Landmark Center 3E, 401 Park Dr., Boston, MA 02215 USA. Phone 617-384-8646; fax 617-
384-8994; email [email protected]
Page 1 of 31

2
Running Title: Fluoride neurotoxicity
Key Words: Fluoride, Intelligence, Neurotoxicity
Acknowledgments:
We thank Dr. Vasanti Malik, Harvard School of Public Health, for the helpful advice on the
meta-analysis methods.
This study was supported by internal institutional funds.
The authors declare that they have no competing financial interest.
List of Abbreviations:
CI, confidence interval
CNKI, China National Knowledge Infrastructure
SE, standard error
SMD, Standardized mean difference
TOXNET, Toxicology Data Network
Page 2 of 31

3
Abstract
Background: Although fluoride may cause neurotoxicity in animal models and acute fluoride
poisoning causes neurotoxicity in adults, very little is known of its effects on children’s
neurodevelopment.
Objective: We performed a systematic review and meta-analysis of published studies to
investigate the effects of increased fluoride exposure and delayed neurobehavioral development.
Methods: We searched the MEDLINE, EMBASE, Water Resources Abstracts, and TOXNET
databases through 2011 for eligible studies. We also searched the China National Knowledge
Infrastructure (CNKI) database, as many studies on fluoride neurotoxicity have been published
in Chinese journals only. In total, we identified 27 eligible epidemiological studies with high and
reference exposures, endpoints of IQ scores or related cognitive function measures with means
and variances for the two exposure groups. We estimated the standardized mean difference
(SMD) between exposed and reference groups across all studies using random effects models.
We conducted sensitivity analyses restricted to studies using the same outcome assessment and
having drinking water fluoride as the only exposure. Cochran test for heterogeneity between
studies, Begg’s funnel plot and Egger test to assess publication bias were performed. Meta-
regressions to explore sources of variation in mean differences among the studies were
conducted.
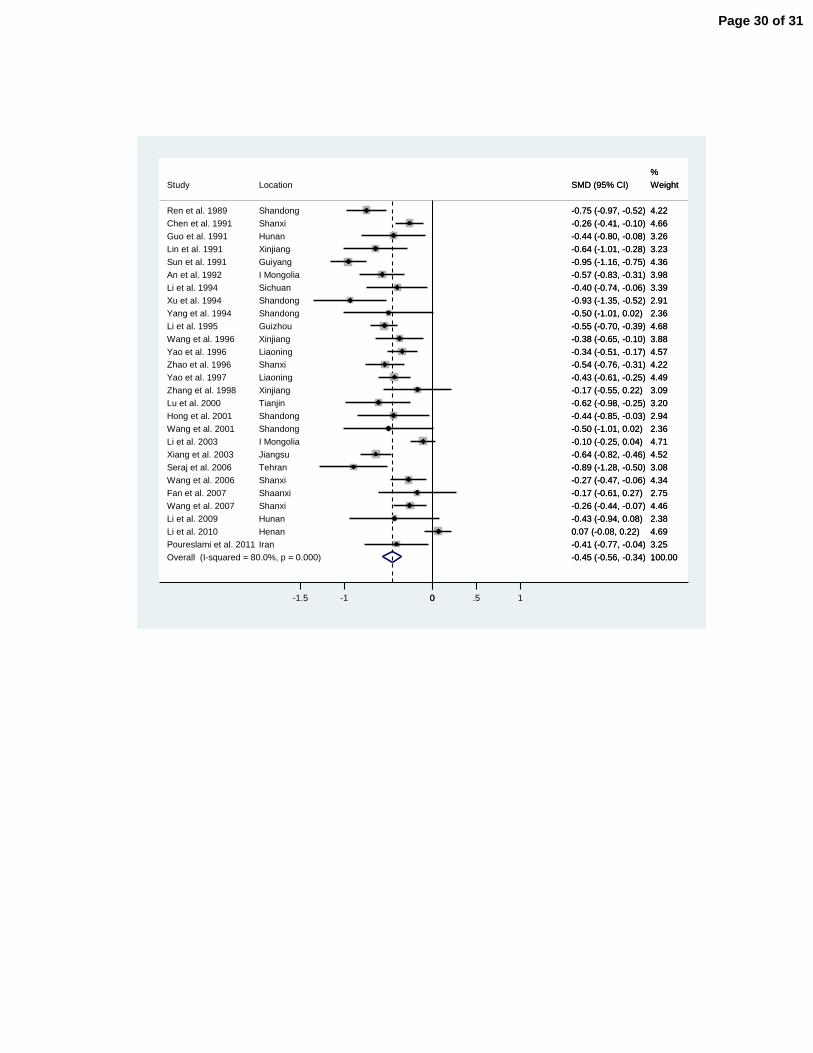
Results: The standardized weighted mean difference in IQ score between exposed and reference
populations was -0.45 (95% CI -0.56 to -0.35) using a random-effects model. Thus, children in
high fluoride areas had significantly lower IQ scores than those who lived in low fluoride areas.
Subgroup and sensitivity analyses also indicated inverse associations, although the substantial
heterogeneity did not appear to decrease.
Page 3 of 31

4
Conclusions: The results support the possibility of an adverse effect of high fluoride exposure on
children’s neurodevelopment. Future research should include detailed individual-level
information on prenatal exposure, neurobehavioral performance, and covariates for adjustment.
Page 4 of 31

5
Introduction
A recent report from the US National Research Council (NRC 2006) concluded that
adverse effects of high fluoride concentrations in drinking-water may be of concern and that
additional research is warranted. Fluoride may cause neurotoxicity in laboratory animals,
including effects on learning and memory (Chioca et al. 2008; Mullenix et al. 1995). A recent
experimental study where the rat hippocampal neurons were incubated with various
concentrations (20 mg/L, 40 mg/L, and 80 mg/L) of sodium fluoride in vitro showed that
fluoride neurotoxicity may target hippocampal neurons (Zhang et al. 2008). Although acute
fluoride poisoning may be neurotoxic to adults, most of the epidemiological information
available on associations with children’s neurodevelopment is from China, where fluoride
generally occurs in drinking water as a natural contaminant, and the concentration depends on
local geological conditions. In many rural communities in China, populations with high exposure
to fluoride in local drinking water sources may reside in close proximity to populations without
high exposure (NRC 2006).
Opportunities for epidemiological studies depend on the existence of comparable
population groups exposed to different levels of fluoride from drinking water. Such
circumstances are difficult to find in many industrialized countries, as fluoride concentrations in
community water are usually no higher than 1 mg/L, even when fluoride is added to water
supplies as a public health measure to reduce tooth decay. Multiple epidemiological studies of
developmental fluoride neurotoxicity were conducted in China due to the high fluoride
concentrations that are substantially above 1 mg/L in well-water in many rural communities,
although microbiologically safe water has been accessible to many rural households as a result of
the recent five-year plan (2001-2005) by the Chinese government. It is projected that all rural
Page 5 of 31
6
residents will have access to safe public drinking water by 2020 (World Bank 2006). However,
results of the published studies have not been widely disseminated. Four studies published in
English (Li et al. 1995; Lu et al. 2000; Xiang et al. 2003; Zhao et al. 1996) were cited in a recent
report from the National Research Council (NRC 2006), while the World Health Organization
has considered only two (Li et al. 1995; Zhao et al. 1996) in its most recent monograph on
fluoride (WHO 2002).
Fluoride readily crosses the placenta (ATSDR 2003). Fluoride exposure to the developing
brain, which is much more susceptible to injury caused by toxicants than is the mature brain,
may possibly lead to damage of a permanent nature (US EPA 2011). Based on the considerations
of health risks, and in response to the recommendation of the National Research Council (NRC
2006), the U.S. Department of Health and Human Services (HHS) and the U.S. Environmental
Protection Agency (EPA) recently announced that HHS is proposing to change the recommended
level of fluoride in drinking water to 0.7 mg/L from the currently recommended range of 0.7 to
1.2 mg/L, and EPA is reviewing the maximum amount of fluoride allowed in drinking water,
which currently is set at 4.0 mg/L (US EPA 2011).
To summarize the available literature, we performed a systematic review and meta-analysis
of published studies on increased fluoride exposure in drinking water and neurodevelopmental
delays. We specifically targeted studies carried out in rural China that have not been widely
disseminated, thus complementing the studies that have been included in previous reviews and
risk assessment reports.
Page 6 of 31

7
Methods
Search Strategy
We searched MEDLINE (National Library of Medicine, Bethesda, MD;
http://www.ncbi.nlm.nih.gov/pubmed), EMBASE (Elsevier B.V., Amsterdam, the Netherlands;
http://www.embase.com), Water Resources Abstracts (Proquest, Ann Arbor, MI;
http://www.csa.com/factsheets/water-resources-set-c.php), and TOXNET (National Library of
Medicine, Bethesda, MD; http://toxnet.nlm.nih.gov) databases to identify studies of drinking
water fluoride and neurodevelopmental outcomes in children. In addition, we searched the China
National Knowledge Infrastructure (CNKI; http://www.cnki.net) database to identify studies
published in Chinese journals only. Keywords included combinations of “fluoride” or “drinking
water fluoride”, “children”, “neurodevelopment” or “neurologic” or “intelligence” or “IQ”. We
also used references cited in articles identified. Records were searched from 1980 to 2011. Our
literature search identified 39 studies, among which 36 (95%) were studies with high and
reference exposure groups, and 3 (7.7%) studies were based on individual-level measure of
exposures. The latter showed dose-related deficits were found but were excluded because our
meta-analysis focused on studies with the high and low exposure groups only. In addition, 2
studies were published twice, and the duplicates were excluded.
Inclusion criteria and Data Extraction
The criteria for inclusion of studies included studies with high and reference fluoride exposures,
endpoints of IQ scores or other related cognitive function measures, presentation of a mean
outcome measure and associated measure of variance [95% confidence intervals (CI) or standard
errors (SEs) and numbers of participants]. Interpretations of statistical significance are based on
Page 7 of 31
8
an alpha level of 0.05. Information included for each study also included the first author, location
of the study, year of publication, and numbers of participants in high-fluoride and low-fluoride
areas. We noted and recorded the information on age and gender of children, and parental
education and income if available.
Statistical Analysis
STATA (version 11.0; StataCorp, College Station, TX) and available commands (Stern 2009)
were used for the meta-analyses. A standardized weighted mean difference (SMD) was
computed using both fixed-effects and random-effects models. The fixed-effects model uses the
Mantel-Haenszel method assuming homogeneity among the studies, while the random-effects
model uses the DerSimonian and Laird method, incorporating both a within-study and an
additive between-studies component of variance when there is between-study heterogeneity
(Egger et al. 2001). The estimate of the between-study variation is incorporated into both the
standard error of the estimate of the common effect and the weight of individual studies, which
was calculated as the inverse sum of the within and between study variance. Heterogeneity
among studies was evaluated using the I2 statistic, which represents the percentage of total
variation across all studies due to between-study heterogeneity (Higgins and Thompson 2002).
The potential for publication bias was evaluated using Begg and Egger tests and visual
inspection of a Begg funnel plot (Begg and Mazumdar 1994; Egger et al. 1997). We also
conducted independent meta-regressions to estimate the contribution of study characteristics
(mean age in years from the age range and year of publication in each study) to heterogeneity
among the studies. The scoring standard for the Combined Raven’s Test – The Rural edition in
China (CRT-RC) test classifies a score of ≤69 and 70-79 as low and marginal intelligence,
Page 8 of 31
9
respectively (Wang et al. 1989). We also used the random effects models to estimate risk ratios
for the association between fluoride exposure and a low/marginal versus normal Raven’s test
score among children in studies that used the Combined Raven’s Test –Rural in China (CRT-
RC) test (Wang et al. 1989). Scores indicating low and marginal intelligence (≤69 and 70-79,
respectively) were combined as a single outcome due to small numbers of children in each
outcome subgroup.
Results
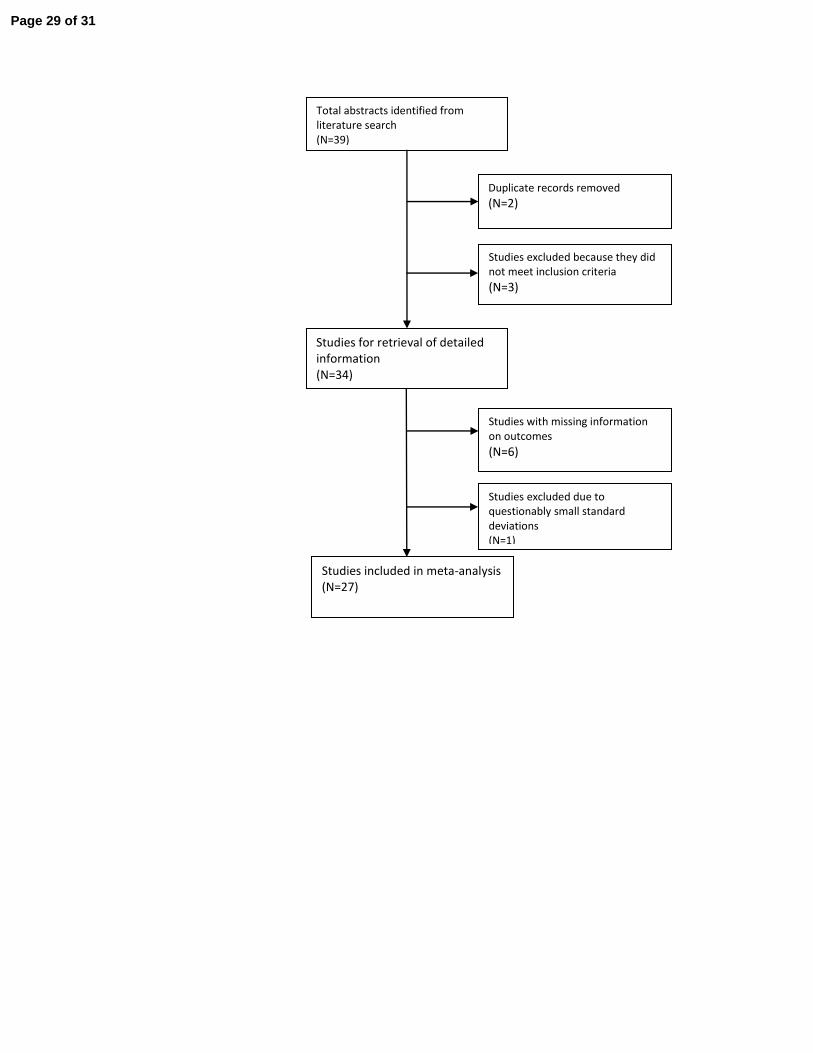
Six of the 34 studies identified were excluded due to missing information on the number of
subjects or the mean and variance of the outcome (see Figure 1 for a study selection flow chart
and Supplemental Material, Table S1 for additional information on studies that were excluded
from the analysis). Another study (Trivedi et al. 2007) was excluded because SDs reported for
the outcome parameter were questionably small (1.13 for high fluoride group, and 1.23 for low
fluoride group) and the SMD (-10.8, 95% CI -11.9, -9.6) was more than 10-times lower than the
second smallest SMD (-0.95, 95% CI -1.16, -0.75) and 150-times lower than the largest SMD
(0.07, 95% CI -0.083, 0.22) reported for the other studies, which had relatively consistent SMD
estimates. Inclusion of this study in the meta-analysis resulted with a much smaller pooled
random-effects SMD estimate and a much larger I2
(-0.63 (95% CI -0.83, -0.44), I2 94.1%)
compared to the estimates that excluded this study (-0.45, 95% CI -0.56, -0.34), I2
80%) (see
Supplemental Material, Figure S1). Characteristics of the 27 studies included are shown in Table
1(An et al. 1992; Chen et al. 1991; Fan et al. 2007; Guo et al. 1991; Hong et al. 2001; Li et al.
2003; Li et al. 2009; Li et al. 2010; Lin et al. 1991; Lin et al. 1994; Lin et al. 1995; Lu et al.
2000; Poureslami et al. 2011; Ren et al. 1989; Seraj et al. 2006; Sun et al. 1991; Wang et al.
Page 9 of 31
10
1996; Wang et al. 2001; Wang et al. 2006; Wang et al. 2007; Xiang et al. 2003; Xu et al. 1994;
Yang et al. 1994; Yao et al. 1996; Yao et al. 1997; Zhang et al. 1998; Zhao et al. 1996). Two of
the studies included in the analysis were conducted in Iran (Poureslami et al. 2011; Seraj et al.
2006), otherwise the study cohorts were populations from China. Two cohorts were exposed to
fluoride from coal burning (Guo et al. 1991; Li et al. 2010), otherwise populations were exposed
to fluoride through drinking water. The CRT-RC was used to measure the children’s intelligence
in 16 studies. Other intelligence measures included the Weschler Intelligence tests (3 studies),
Binet IQ test (2 studies), Raven’s test (2 studies), Japan IQ test (2 studies), Chinese comparative
intelligence test (1 study), and the mental work capacity index (1 study). As each of the
intelligence tests used are designed to measure general intelligence, we used data from all
eligible studies to estimate the possible effects of fluoride exposure on general intelligence.
In addition, we conducted a sensitivity analysis restricted to studies that used similar tests to
measure the outcome (specifically, the CRT-RC, Weschler Intelligence test, Binet IQ test, or
Raven’s test), and an analysis restricted to studies that used the CRT-RC. We also performed an
analysis that excluded studies with co-exposures including iodine and arsenic, or with non-
drinking water fluoride exposure from coal burning.
Pooled SMD estimates
Among the 27 studies, all but one study showed random-effect SMD estimates that indicated an
inverse association, ranging from -0.95 (95% CI: -1.16, -0.75) to -0.10 (95% CI: -0.25, 0.04)
(Figure 2). The study with a positive association reported a SMD estimate of 0.07 (95% CI: -0.8,
0.22). Similar results were found with the fixed-effect SMD estimates. The fixed-effects pooled
SMD estimate and corresponding 95% CI were -0.40 (-0.44, -0.35), with a p-value <0.001 for
Page 10 of 31
11
the test for homogeneity. The random-effects SMD estimate and 95% CI were -0.45 (95% CI:-
0.56, -0.34) with an I2 of 80% and homogeneity test p-value <0.001 (Figure 2). Because of
heterogeneity (excess variability) between study results, we primarily used the random-effects
model for subsequent sensitivity analyses, which is generally considered to be the more
conservative method (Egger et al. 2001). Among the restricted sets of intelligence tests, the SMD
for the model with only CRT-RC tests and drinking-water exposure (and to a lesser extent the
model with only CRT-RC tests) was lower than that for all studies combined, although the
difference did not appear to be significant. Heterogeneity, however, remained at a similar
magnitude when the analyses were restricted (Table 2).
Sources of heterogeneity
We performed meta-regression models to assess study characteristics as potential predictors of
effect. Information on the child’s gender and parental education were not reported in more than
80% of the studies, and only 7% of the studies reported household income. These variables were
therefore not included in the models. Among the two covariates, year of publication (0.02; 95%
CI: 0.006, 0.03), but not mean age of the study children (-0.02; 95% CI: -0.094, 0.04), was a
significant predictor in the model with all 27 studies included. I2 residual 68.7%, represented the
proportion of residual between-study variation due to heterogeneity. From the adjusted R2,
39.8% of between-study variance was explained by the two covariates. The overall test of the
covariates was significant (p=0.004).
When the model was restricted to the 16 studies that used the CRT-RC, the child’s age (but not
year of publication) was a significant predictor of the SMD. The R2
of 65.6% of between-study
variance was explained by the two covariates, and only 47.3% of the residual variation was due
Page 11 of 31
12
to heterogeneity. The overall test of both covariates in the model remained significant (p =
0.0053). On further restriction of the model to exclude the 7 studies with arsenic and iodine as
co-exposures and fluoride originating from coal-burning, thus including only the 9 with fluoride
exposure from drinking water, neither age nor year of publication was a significant predictor, and
the overall test of covariates was less important (p = 0.062), in accordance with the similarity of
intelligence test outcomes and the source of exposure in the studies included. Although official
reports of lead concentrations in the study villages in China were not available, some studies
reported high percentage (95 to 100%) of low lead exposure (less than the standard of 0.01
mg/L) in drinking water samples in villages from several study provinces (Bi et al. 2010; Peng et
al. 2008; Sun 2010).
Publication bias
A Begg’s funnel plot with the SE of SMD from each study plotted against its corresponding
SMD did not show clear evidence of asymmetry, though two studies with a large SE also
reported relatively large effect estimates, which may be consistent with publication bias or
heterogeneity (Figure 3). The plot appears symmetrical for studies with larger SE, but with
substantial variation in SMD among the more precise studies, consistent with the heterogeneity
observed among the studies included in the analysis. Begg (p = 0.22) and Egger (p = 0.11) tests
did not indicate significant (p < 0.05) departures from symmetry.
Pooled risk ratios
The relative risk of a low/marginal score on the CRT-RC test (<80) among children with high
fluoride exposure compared to those with low exposure (16 studies total) was 1.93 (95% CI:
Page 12 of 31

13
1.46, 2.55; I2 58.5%). When the model was restricted to 9 studies that used the CRT-RC and
included only drinking water fluoride exposure (Chen et al. 1991; Fan et al. 2007; Li et al. 1995;
Li et al. 2003; Li et al. 2010; Lu et al.2000; Wang et al. 2006; Yao et al. 1996, 1997), the
estimate was similar (RR 1.75; 95% CI: 1.16, 2.65; I2 70.6%). Although fluoride exposure
showed inverse associations with test scores, the available exposure information did not allow a
formal dose-response analysis. However, dose-related differences in test scores occurred at a
wide range of water-fluoride concentrations.
Discussion
Findings from our meta-analyses of 27 studies published over 22 years suggest an inverse
association between high fluoride exposure and children’s intelligence. Children who lived in
areas with high fluoride exposure had lower IQ scores than those who lived in low exposure or
control areas. Our findings are consistent with an earlier review (Tang et al. 2008), although ours
more systematically addressed study selection and exclusion information, and more
comprehensive in 1) including nine additional studies, 2) performing meta-regression to estimate
the contribution of study characteristics as sources of heterogeneity, and 3) estimating pooled
risk ratios for the association between fluoride exposure and a low/marginal Raven’s test score.
As noted by the NRC committee (NRC 2006), assessments of fluoride safety have relied on
incomplete information on potential risks. In regard to developmental neurotoxicity, much
information has in fact been published, although mainly as short reports in Chinese that have not
been available to most expert committees. We carried out an extensive review that includes
epidemiological studies carried out in China. While most reports were fairly brief and complete
information on covariates was not available, the results tended to support the potential for
Page 13 of 31

14
fluoride-mediated developmental neurotoxicity at relatively high levels of exposure in some
studies. We did not find conclusive evidence of publication bias, though there was substantial
heterogeneity among studies. Drinking-water may contain other neurotoxicants, such as arsenic,
but exclusion of studies including arsenic and iodine as co-exposures in a sensitivity analysis
resulted in a lower estimate, although the difference was not significant. The exposed groups
had access to drinking-water with fluoride concentrations up to 11.5 mg/L (Wang et al. 2007),
thus in many cases concentrations were above the levels of 0.7-1.2 mg/L (HHS) and 4.0 mg/L
(US EPA) considered acceptable in the US. A recent cross-sectional study based on individual-
level measure of exposures suggested that low levels of water fluoride (range 0.24 to 2.84 mg/L)
had significant negative associations with child’s intelligence (Ding et al. 2011). This study was
not included in our meta-analysis, which focused only on studies with exposed and reference
groups, thereby precluding estimation of dose-related effects.
The results suggest that fluoride may be a developmental neurotoxicant that affects brain
development at exposures much below those that can cause toxicity in adults (Grandjean 1982).
For neurotoxicants, such as lead and methylmercury, adverse effects are associated with blood
concentrations as low as 10 nmol/L. Serum-fluoride concentrations associated with high intakes
from drinking-water may exceed 1 mg/L, or 50 µmol/L, thus more than 1000-times the levels of
some other neurotoxicants that cause neurodevelopmental damage. Supporting the plausibility of
our findings, rats exposed to 1 ppm (50 µmol/L) of water-fluoride for one year showed
morphological alterations in the brain and increased levels of aluminum in brain tissue compared
with controls (Varner et al. 1998).
The estimated decrease in average IQ associated with fluoride exposure based on our
analysis may seem small and may be within the measurement error of IQ testing. However, as
Page 14 of 31

15
research on other neurotoxicants has shown, a shift to the left of IQ distributions in a population
will have substantial impacts, especially among those in the high and low ranges of the IQ
distribution (Bellinger 2007).
The present study cannot be used to derive an exposure limit, as the actual exposures of the
individual children are not known. Misclassification of children in both high- and low-exposure
groups may have occurred if the children were drinking water from other sources (e.g., at school
or in the field).
The published reports clearly represent independent studies and are not the result of
duplicate publication of the same studies (we removed two duplicates). Several studies (Hong et
al. 2001; Lin et al. 1991; Wang et al. 2001; Wang et al. 2007; Xiang et al. 2003; Zhao et al.
1996) report other exposures, such as iodine, and arsenic, a neurotoxicant, but our sensitivity
analyses showed similar associations between high fluoride exposure and the outcomes even
after these studies were excluded. Large tracts of China have superficial fluoride-rich minerals
with little, if any, likelihood of contamination by other neurotoxicants that would be associated
with fluoride concentrations in drinking water. From the geographical distribution of the studies,
it seems unlikely that fluoride-attributed neurotoxicity could be due to other water contaminants.
Still, each of the articles reviewed had deficiencies, in some cases rather serious, which
limit the conclusions that can be drawn. However, most deficiencies relate to the reporting,
where key information was missing. The fact that some aspects of the study were not reported
limits the extent to which the available reports allow a firm conclusion. Some methodological
limitations were also noted. Most studies were cross-sectional, but this study design would seem
appropriate in a stable population where water supplies and fluoride concentrations have
remained unchanged for many years. The current water-fluoride level likely also reflects past
Page 15 of 31
16
developmental exposures. In regard to the outcomes, the inverse association persisted between
studies using different intelligence tests, although most studies did not report age adjustment of
the cognitive test scores.
Fluoride has received much attention in China, where widespread dental fluorosis
indicates the prevalence of high exposures. In 2008, the Ministry of Health reported that
fluorosis was found in 28 provinces with 92 million residents (China News, 2008). Although
microbiologically safe, water supplies from small springs or mountain sources created pockets of
increased exposures near or within areas of low exposures, thus representing exposure settings
close to the ideal, as only the fluoride exposure would differ between nearby neighborhoods.
Chinese researchers took advantage of this fact and published their findings, though mainly in
Chinese journals, and according to the standards of science at the time. This research dates back
to the 1980s, but has not been widely cited at least in part because of limited access to Chinese
journals.
In its review of fluoride, the US National Research Council (NRC 2006) emphasized that
both the beneficial effects of fluoride on dental health and its adverse effects were incompletely
documented. Our comprehensive review substantially extends the scope of research available for
evaluation and analysis. Although the studies were generally of insufficient quality, the
consistency of their findings adds support to existing evidence of fluoride-associated cognitive
deficits, and suggests that potential developmental neurotoxicity of fluoride should be a high
research priority. While reports from WHO and national agencies have generally focused on
beneficial effects (CDC 1999; Petersen and Lennon 2004), the NRC report emphasized the need
to consider potential adverse effects as well as benefits of fluoride exposure (NRC 2006 ).
Page 16 of 31

17
In conclusion, our results support the possibility of adverse effects of fluoride exposures on
children’s neurodevelopment. Future research should formally evaluate dose-response relations
based on individual-level measures of exposure over time, including more precise prenatal
exposure assessment and more extensive standardized measures of neurobehavioral performance,
in addition to improving assessment and control of potential confounders.
Page 17 of 31
18
References
An JA, Mei SZ, Liu AP, Fu Y, Wang CF. 1992. Effect of high level of fluoride on children’s
intelligence. Chinese J of the Control of Endemic Diseases 7(2):93-94. (in Chinese)
ATSDR (Agency for Toxic Substances and Disease Registry). 2003. Toxicological profile for
fluorides, hydrogen fluoride, and fluorine (update). Available online:
http://www.atsdr.cdc.gov/toxprofiles/tp11.pdf.
Begg CB, Mazumdar M. 1994. Operating characteristics of a rank correlation test for publication
bias. Biometrics 50:1088-1101.
Bellinger DC. 2007. Interpretation of small effect sizes in occupational and environmental
neurotoxicity: Individual versus population risk. Neurotoxicol 28:245-251.
Bi WJ, Zheng X, Lan TX. 2010. Analysis on test results of drinking water’s quality in Janan
Railway Bureau from 2005-2009. Prev Med Trib 16(6):483-485. (in Chinese).
CDC (Center for Disease Control and Prevention). 1999. Achievements in Public Health, 1990-
1999: Fluoridation of drinking water to prevent dental caries. MMWR, October
22;48(41):933-940.
Chen YX, Han F, Zhou Z, Zhang H, Jiao X, Zhang S, et al. 1991. Research on the intellectual
development of children in high fluoride areas. Chinese Journal of Control of Endemic
Diseases. 6(supplement):99-100. Available online: http://www.fluoridealert.org/chinese/
(Also available: Fluoride 2008, 41(2):120-124).
China National Knowledge Infrastructure (CNKI; http://www.cnki.net) [accessed 25 May 2010].
China News. 2008. Twenty-Eight provinces were affected by fluorosis in China. Available
online: http://news.qq.com/a/20081216/001707.htm. (in Chinese). [accessed 03 July 2012].
(in Chinese).
Chioca LR, Raupp IM, Da Cunha C, Losso EM, Andreatini R. 2008. Subchronic fluoride intake
induces impairment in habituation and active avoidance tasks in rats. Eur J Pharmocol
579:196-201.
Ding Y, Gao Y, Sun H, Han H, Wang W, Ji X, et al. 2011. The relationships between low levels
of urine fluoride on children’s intelligence, dental fluorosis in endemic fluorosis area in
Hulunbuir, Inner Mongolia, China. J Harzard Mat 186:1942-1946.
Dobbing J. 1968. Vulnerable periods in developing brain. In: Davidson AN, Dobbing J, eds.
Applied Neurochemistry. Philadelphia: Davis, pp.287-316.
Page 18 of 31

19
Egger M, Davey Smith G, Altman D. 2001. Systematic reviews in health care meta-analysis in
context. London: BMJ Publishing.
Egger M, Davey Smith G, Schneider M, Minder C. 1997. Bias in meta-analysis detected by a
simple, graphical test. BMJ 315:629-634.
EMBASE (Elsevier B.V., Amsterdam, the Netherlands; http://www.embase.com) [accessed 10
April 2011].
EU (European Commission, Scientific Committee on Health and Environmental Risks). 2010.
Critical review of any new evidence on the hazard profile, health effects, and health
exposure to fluoride and the fluoridating agents of drinking water. Available online:
http://ec.europa.eu/health/scientific_committees/environmental_risks/docs/scher_o_122.pdf.
[accessed 15 September 2010]
Fan ZX, Dai HY, Bai AM, Li PO, Li T, LI GD, et al. 2007. Effect of high fluoride exposure in
children’s intelligence. J Environ Health 24(10):802-803.
Grandjean P. Occupational fluorosis through 50 years: clinical and epidemiological experiences.
Am J Ind Med 1982(3):227-36.
Grandjean P, Landrigan PJ. 2006. Developmental neurotoxicity of industrial compounds. Lancet
368:2167-2178.
Grandjean P, Olsen JH. 2004. Extended follow-up of cancer in fluoride-exposed workers. J Natl
Cancer Inst 96:802-803.
Guo XC, Wang R, Cheng C, Wei W, Tang L, Wang Q, et al. 1991. A preliminary exploration of
IQ of 7-13 year old pupils in a fluorosis area with contamination from burning coal. Chinese
Journal of Endemiology 10:98-100. Available online: http://www.fluoridealert.org/chinese/
(Also available: Fluoride 2008, 41(2):125-128)
Higgins JP, Thompson SG. 2002. Quantifying heterogeneity in a meta-analysis. Stat Med
21:1539-1558.
Hong F, Cao Y, Yang D, Wang H. 2001. A study of fluorine effects on children's intelligence
development under different environments. Chinese Primary Health Care 15: 56-57.
Available online: http://www.fluoridealert.org/chinese/ (Also available: Fluoride 2008,
41(2):156-160)
Li FH, Chen X, Huang RJ, Xie YP. 2009. Intelligence impact of children with endemic fluorosis
caused by fluoride from coal burning. J Environ Health 26(4):338-340. (in Chinese)
Page 19 of 31
20
Li XH, Hou GQ, Yu B, Yuan CS, Liu Y, Zhang L, et al. 2010. Investigation and analysis of
children’s intelligence and dental fluorosis in high fluoride area. J Med Pest Control
26(3):230-231. (in Chinese)
Li XS, Zhi JL, Gao RO. 1995. Effect of fluoride exposure on intelligence in children. Fluoride
28(4):189-192.
Li Y, Jing X, Chen D, Lin L, Wang Z. 2003. The Effects of Endemic Fluoride Poisoning on the
Intellectual Development of Children in Baotou. Chinese Journal of Public Health
Management 19(4):337-338. Available online: http://www.fluoridealert.org/chinese/ (Also
available: Fluoride 2008, 41(2):161-164)
Li Y, Li X, Wei S. 1994. Effect of excessive fluoride intake on mental work capacity of children
and a preliminary study of its mechanism. Journal of West China University of Medical
Sciences 25(2):188-91. Available online: http://www.fluoridealert.org/chinese/
Lin FF, Ai HT, Zhao HX, Lin J, Jhiang JY, Maimaiti, et al. 1991. High fluoride and low iodine
environment and subclinical cretinism in Xinjiang. Endemic Dis Bull 6(2):62-67. (in
Chinese)
Lu Y, Sun ZR, Wu LN, Wang X, Lu W, Liu SS. et al. 2000. Effect of high-fluoride water on
intelligence in children. Fluoride 33(2):74-78. (Also available: The Chinese Journal of
Control of Endemic Disease. 15(4):231-232. (in Chinese) MEDLINE (National Library of
Medicine, Bethesda, MD; http://www.ncbi.nlm.nih.gov/pubmed) [accessed 5 April 2011].
Mullenix PJ, Denbesten PK, Schunior A, Kernan WJ. 1995. Neurotoxicity of sodium fluoride in
rats. Neurotoxicol Terator 17:169-177.
NRC (National Research Council). 2006. Fluoride in drinking water: a scientific review of
EPA’s standards. The National Academies Press, Washington, DC.
Petersen PE, Lennon MA. 2004. Effective use of fluorides for the prevention of dental caries in
the 21st century: the WHO approach. Community Dent Oral Epidem 32(5):319-321.
Peng YP, Zou J, Yang DF, Li XH, Wu K. 2008. Analysis of water quality from homemade wells
in Leshan downtown during 2004-2006. J Occup Health and Damage. 23(4):219-221. (in
Chinese).
Poureslami HR, Horri A, Atash R. 2011. High fluoride exposure in drinking water: effect on
children’s IQ, one new report. Int J Pediatr Dent 21 (Suppl 1):47.
Page 20 of 31
21
Ren DL, Li K, Lin D. 1989. An investigation of intelligence development of children aged 8-14
years in high-fluoride and low-iodine areas. Chinese Journal of Control of Endemic Diseases
4:251. Available online: http://www.fluoridealert.org/chinese/. (Also available: Fluoride
2008, 41(4):319-320)
Seraj B, Shahrabi M, Falahzade M, Falahzade FP, Akhondi N. 2006. Effect of High Fluoride
Concentration in Drinking Water on Children’s Intelligence. Journal of Dental Medicine
19(2):80-86. (Abstract in English) Available online: http://www.fluoridealert.org/chinese/
Stern JAC. 2009. Meta-analysis in Stata: An updated collection from the Stata journal. College
Station, Texas: Stata Press.
Sun MM, Li SK, Wang YF, Li FS. 1991. Measurement of intelligence by drawing test among the
children in the endemic area of Al-F combined foxieosis. J Guiyang Medical College.
16(3):204-206. (in Chinese)
Sun LY. 2010. Survey of drinking water quality in Jintang County. J Occup Health and Damage.
25(5):277-280. (in Chinese).
Tang QQ, Du J, Ma HH, Jiang SJ, Zhou XJ. 2008. Fluoride and children’s intelligence: a meta-
analysis. Bio Trace Elem Res 126:115-120.
TOXNET (National Library of Medicine, Bethesda, MD; http://toxnet.nlm.nih.gov) [accessed 25
May 2011].
Trivedi MH, Verma RJ, Chinoy NJ, Patel RS, Sathawara NG. 2007. Effect of high fluoride water
on intelligence of school children in India. Fluoride 40(3):178-183.
U.S. EPA. 2011. EPA and HHS announce new scientific assessments and actions on
fluoride/agencies working together to maintain benefits of preventing tooth decay while
preventing excessive exposure. See:
http://yosemite.epa.gov/opa/admpress.nsf/bd4379a92ceceeac8525735900400c27/86964af57
7c37ab285257811005a8417!OpenDocument. [accessed 7 January 2011].
Varner JA, Jensen KF, Horvath W, Isaacson RL. 1998. Chronic administration of aluminum-
fluoride or sodium-fluoride to rats in drinking water: alterations in neuronal and
cerebrovascular integrity. Brain Res 784:284-298.
Wang D, Di M, Qian M. 1989. Chinese Standardized Raven Test, Rural Version. Tianjin, China.
Page 21 of 31

22
Wang G, Yang D, Jia F, Wang H. 1996. A Study of the IQ Levels of Four- to Seven-year-old
Children in High Fluoride Areas. Endemic Diseases Bulletin 11:60-62. Available online:
http://www.fluoridealert.org/chinese/ (Also available: Fluoride 2008, 41(4):340-343)
Wang SH, Wang LF, Hu PY, Guo SW, Law SH. 2001. Effects of high iodine and high fluorine
on children’s intelligence and thyroid function. Chinese J of Endemiology 20(4):288-290.
(in Chinese)
Wang SX, Wang ZH, Cheng XT, Li J, Sang ZP, Zhang XD, et al. Water Arsenic and Fluoride
Exposure and Children’s Intelligence Quotient and Growth in Shanyin County, Shanxi,
China. Environ Health Perspect 115(4):643-647.
Wang ZH, Wang SX, Zhang XD, Li J, Zheng XT, Hu CM, et al. 2006. Investigation of
children’s growth and development under long-term fluoride exposure. Chinese J Control
Endem Dis 21(4):239-241. (Article in Chinese, Abstract in English)
Water Resources Abstracts (Proquest, Ann Arbor, MI; http://www.csa.com/factsheets/water-
resources-set-c.php) [accessed 1 May 2011].
WHO (World Health Organization). 2002. Fluorides. WHO, Geneva.
World Bank. 2006. China water quality management: policy and institutional considerations.
Available online:
http://siteresources.worldbank.org/INTEAPREGTOPENVIRONMENT/Resources/China_
WPM_final_lo_res.pdf [accessed 13 June 2012].
Xiang Q, Liang Y, Chen L, Wang C, Chen B, Chen X, et al. 2003. Effect of fluoride in drinking
water on children’s intelligence. Fluoride. 36(2):84-94.
Xu YL, Lu CS, Zhang XN. 1994. Effect of fluoride on children’s intelligence. Endemic Disease
Bulletin 2:83-84. (in Chinese)
Yang Y, Wang X, Guo X, Hu P. 1994. Effects of high iodine and high fluorine on children's
intelligence and the metabolism of iodine and fluorine. Chinese Journal of Pathology
15(5):296-8. Available online: http://www.fluoridealert.org/chinese/ (Also available:
Fluoride 2008, 41(4):336-339)
Yao LM, Zhou JL, Wang SL, Cui KS, Lin FY. 1996. Analysis of TSH levels and intelligence of
children residing in high fluorosis areas. Literature and Information on Preventive Medicine
2(1):26-27. (in Chinese)
Page 22 of 31
23
Yao LM, Deng Y, Yang SY, Zhou JL, Wang SL, Cui JW. 1997. Comparison of children’s health
and intelligence between the fluorosis areas with and without altering water sources.
Literature and Information on Preventive Medicine 3(1):42-43. (in Chinese)
Zhang JW, Yao H, Chen Y. 1998. Effect of high level of fluoride and arsenic on children’s
intelligence. Chinese J of Public Health. 17(2):57. (in Chinese)
Zhang M, Wang A, Xia T, He P. 2008. Effects of fluoride on DNA damage, S-phase cell-cycle
arrest and the expression of NF-κB in primary cultured rat hippocampal neurons. Toxicol
Letters 179:1-5.
Zhao LB, Liang GH, Zhang DN, Wu XR. 1996. Effect of a High Fluoride Water Supply on
Children’s Intelligence. Fluoride 29(4); 190-192.
Page 23 of 31

24
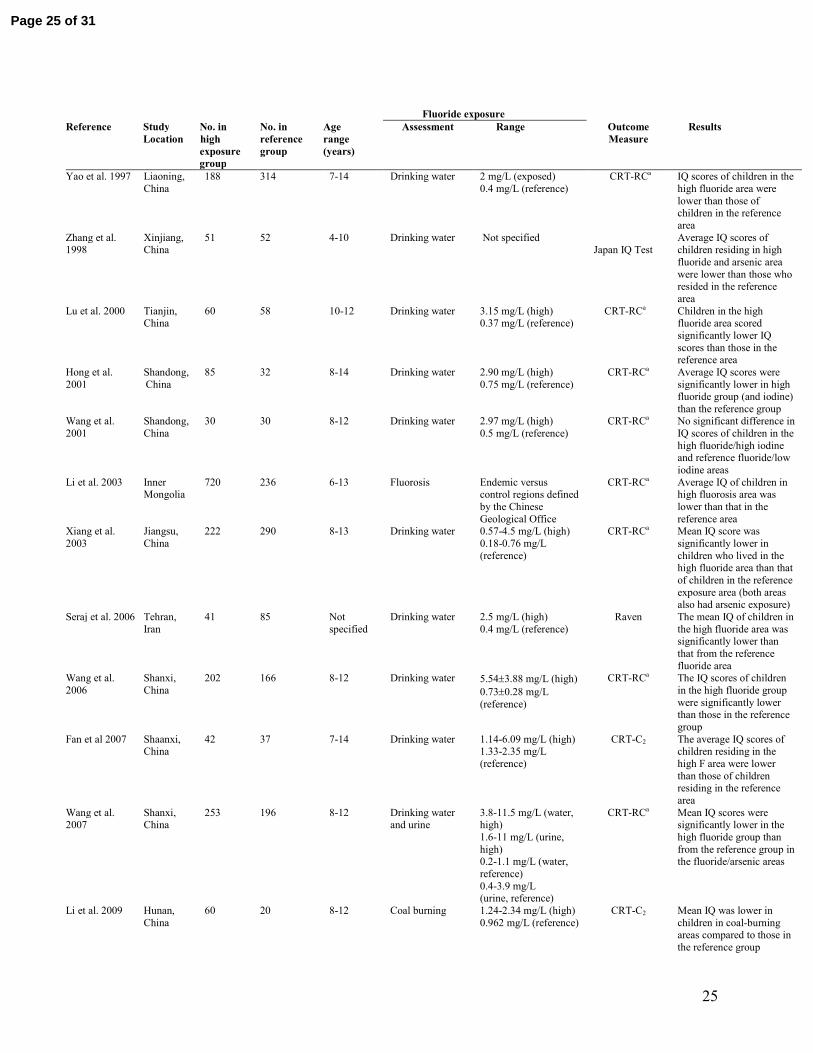
Table 1. Characteristics of epidemiological studies of fluoride exposure and child’s cognitive
outcomes Fluoride exposure
Reference Study
Location
No. in
h high
exposure
g group
No. in
reference
group
Age
range
(years)
Assessment Range Outcome
Measure
Results
Ren et al. 1989
Shandong, China
160 169 8-14 High/low F villages
Not specified Wechler Intelligence test
Children in highF, region had lower IQ scores
Chen et al. 1991
Shanxi,
China
320 320 7-14 Drinking water 4.55 mg/L (high);
0.89 mg/L (reference)
CRT-RCa The average IQ of children
from high fluoride area were lower than that of the
reference area
Guo et al. 1991
Hunan, China
60 61 7-13 F in coal burning 118.1-1361.7 mg/kg (coal burning area);
Control area used
wood
Chinese Binet Average IQ in fluoride coal burning area was
lower than that in the
reference area Lin et al. 1991
Xinjiang,
China
33 86 7-14 Drinking
water
0.88mg/L (high);
0.34 mg/L (reference)
CRT-RCa Children in the high
fluoride (low iodine) area
had lower IQ scores compared with the children
from the reference fluoride
(low iodine) areas Sun et al. 1991
Guiyang,
China
196
224 6.5-12 Rate of fluorosis Fluorosis: 98.36%
(high); not specified (reference)
Japan IQ test Mean IQ was lower in all
age groups except ≤7 years
old group in the area with high fluoride and alumin-
um (limited to high fluoride population only)
An et al. 1992
Inner
Mongolia, China
121
121 7-16 Drinking water 2.1-7.6mg/L (high)
0.6-1.0 mg/L (reference)
Wechler
Intelligence test
IQ scores of children in
high fluoride areas were significantly lower than
those of children living in
reference fluoride area Li et al. 1994
Sichuan,
China
106 49 12-13 Buring of high-
fluoride coal to
cook grain in high fluoride
area
4.7-31.6 mg/kg (high)
0.5 mg/kg (reference)
Child mental
work capacity
Early, prolonged high
fluoride intake causes a
decrease in the child’s mental work capacity
Xu et al. 1994
Shandong, China
97
32 8-14 Drinking water 1.8 mg/L (high) 0.8 mg/L (reference)
Binet-Siman Children had lower IQ scores in high fluoride area
than those who lived in the
reference area. Yang et al. 1994
Shandong,
China
30 30 8-14 Well water 2.97 mg/L (high);
0.5 mg/L (reference)
Chinese
comparative
intelligence test
The average IQ scores was
lower in children from
high fluoride and iodine area than those from the
reference area, but the
results were not significant Li et al. 1995
Guizhou,
China
681 226 8-13 Urine,
Dental Fluorosis
Index(DFI)
1.81-2.69 mg/L (high);
1.02 mg/L (reference);
DFI 0.8-3.2 (high) DFI <0.4 (reference)
CRT-RCa Children living in fluorosis
areas had lower IQ scores
than children living in non- fluorosis areas
Wang et al.
1996
Xinjiang,
China
147 83 4-7 Drinking water >1.0-8.6 mg/L (high)
0.58-1.0 mg/L (reference)
Wechsler
Intelligence Test
Average IQ score was
lower in children in the high fluoride group than
those in the reference
group Yao et al. 1996
Liaoning,
China
266
270 8-12 Drinking water 2-11mg/L (high)
1 mg/L (reference)
CRT-RCa Average IQ scores of
children residing in
exposed fluoride areas were lower than those in
the reference area
Zhao et al. 1996
Shanxi, China
160 160 7-14 Drinking water 4.12 mg/L (high) 0.91 mg/L (reference)
CRT-RCa Children living in high fluoride and arsenic area
had significantly lower IQ
scores than those living in the reference fluoride (and
no arsenic) area
Page 24 of 31
25
Fluoride exposure
Reference Study
Location
No. in
h high
exposure
g group
No. in
reference
group
Age
range
(years)
Assessment Range Outcome
Measure
Results
Yao et al. 1997
Liaoning,
China
188
314 7-14 Drinking water 2 mg/L (exposed)
0.4 mg/L (reference)
CRT-RCa IQ scores of children in the
high fluoride area were
lower than those of children in the reference
area
Zhang et al. 1998
Xinjiang, China
51 52 4-10 Drinking water Not specified Japan IQ Test
Average IQ scores of children residing in high
fluoride and arsenic area
were lower than those who resided in the reference
area
Lu et al. 2000
Tianjin, China
60 58 10-12 Drinking water 3.15 mg/L (high) 0.37 mg/L (reference)
CRT-RCa Children in the high fluoride area scored
significantly lower IQ
scores than those in the reference area
Hong et al.
2001
SShandong,
China
85 32 8-14 Drinking water 2.90 mg/L (high)
0.75 mg/L (reference)
CRT-RCa Average IQ scores were
significantly lower in high fluoride group (and iodine)
than the reference group Wang et al.
2001
Shandong,
China
30 30 8-12 Drinking water 2.97 mg/L (high)
0.5 mg/L (reference)
CRT-RCa No significant difference in
IQ scores of children in the
high fluoride/high iodine and reference fluoride/low
iodine areas
Li et al. 2003
Inner Mongolia
720 236 6-13 Fluorosis Endemic versus control regions defined
by the Chinese
Geological Office
CRT-RCa Average IQ of children in high fluorosis area was
lower than that in the
reference area Xiang et al.
2003
Jiangsu,
China
222
290
8-13 Drinking water 0.57-4.5 mg/L (high)
0.18-0.76 mg/L
(reference)
CRT-RCa Mean IQ score was
significantly lower in
children who lived in the high fluoride area than that
of children in the reference
exposure area (both areas also had arsenic exposure)
Seraj et al. 2006
Tehran,
Iran
41 85 Not
specified
Drinking water 2.5 mg/L (high)
0.4 mg/L (reference)
Raven The mean IQ of children in
the high fluoride area was significantly lower than
that from the reference
fluoride area Wang et al.
2006
Shanxi,
China
202 166 8-12 Drinking water 5.54±3.88 mg/L (high)
0.73±0.28 mg/L
(reference)
CRT-RCa The IQ scores of children
in the high fluoride group
were significantly lower than those in the reference
group
Fan et al 2007 Shaanxi, China
42 37 7-14 Drinking water 1.14-6.09 mg/L (high) 1.33-2.35 mg/L
(reference)
CRT-C2 The average IQ scores of children residing in the
high F area were lower
than those of children residing in the reference
area
Wang et al. 2007
Shanxi, China
253
196 8-12 Drinking water and urine
3.8-11.5 mg/L (water, high)
1.6-11 mg/L (urine,
high) 0.2-1.1 mg/L (water,
reference)
0.4-3.9 mg/L (urine, reference)
CRT-RCa Mean IQ scores were significantly lower in the
high fluoride group than
from the reference group in the fluoride/arsenic areas
Li et al. 2009
Hunan,
China
60 20 8-12 Coal burning 1.24-2.34 mg/L (high)
0.962 mg/L (reference)
CRT-C2 Mean IQ was lower in
children in coal-burning areas compared to those in
the reference group
Page 25 of 31

26
Fluoride exposure
Reference Study
Location
No. in
h high
exposure
g group
No. in
reference
group
Age
range
(years)
Assessment Range Outcome
Measure
Results
Li et al. 2010
Henan, China
347
329 7-10 Drinking water 2.47±0.75mg/L (high) CRT-RC No significant difference in IQ scores between children
in the exposed and
reference groups Poureslami
et al. 2011
Iran 59 60 6-9 Drinking
Water
2.38 mg/L (high)
0.41 mg/L (reference)
Raven Children in the high
fluoride group scored
significantly lower than those in reference group
aCRT-RC denotes Chinese Standardized Raven Test, rural version (Wang et al. 1989)
Page 26 of 31
27
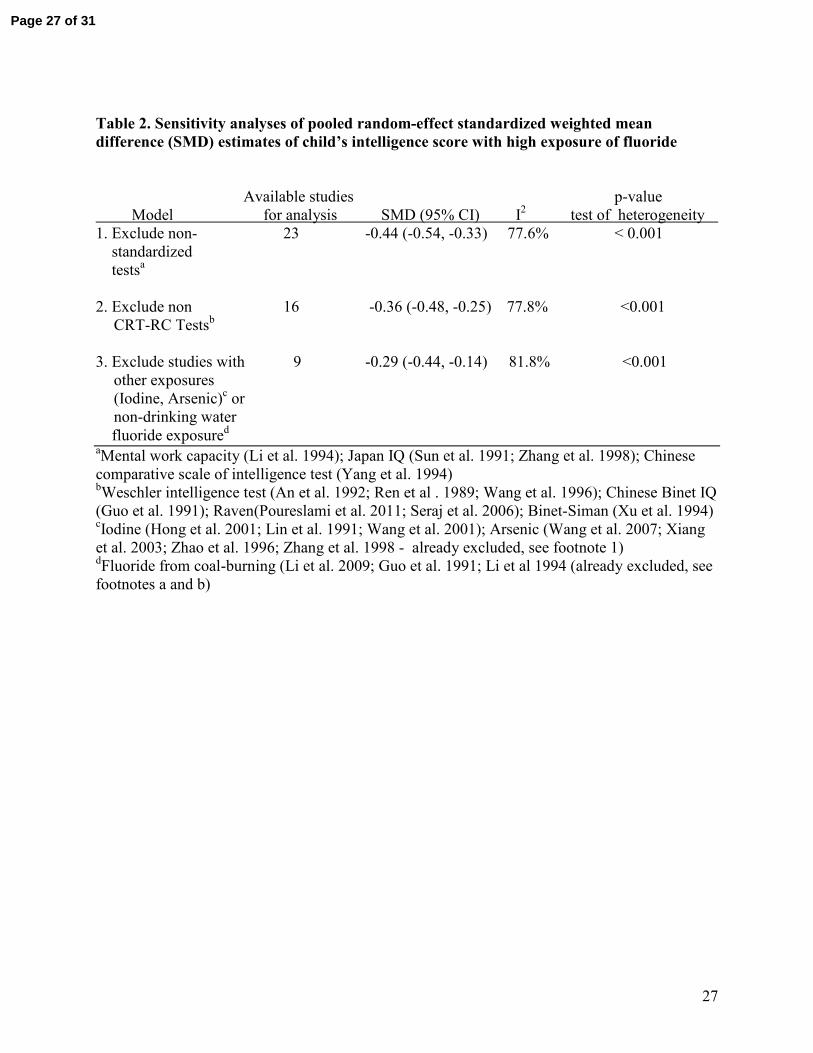
Table 2. Sensitivity analyses of pooled random-effect standardized weighted mean
difference (SMD) estimates of child’s intelligence score with high exposure of fluoride
Available studies p-value
Model for analysis SMD (95% CI) I2 test of heterogeneity
1. Exclude non- 23 -0.44 (-0.54, -0.33) 77.6% < 0.001
standardized
testsa
2. Exclude non 16 -0.36 (-0.48, -0.25) 77.8% <0.001
CRT-RC Testsb
3. Exclude studies with 9 -0.29 (-0.44, -0.14) 81.8% <0.001
other exposures
(Iodine, Arsenic)c or
non-drinking water
fluoride exposured
aMental work capacity (Li et al. 1994); Japan IQ (Sun et al. 1991; Zhang et al. 1998); Chinese
comparative scale of intelligence test (Yang et al. 1994) bWeschler intelligence test (An et al. 1992; Ren et al . 1989; Wang et al. 1996); Chinese Binet IQ
(Guo et al. 1991); Raven(Poureslami et al. 2011; Seraj et al. 2006); Binet-Siman (Xu et al. 1994) cIodine (Hong et al. 2001; Lin et al. 1991; Wang et al. 2001); Arsenic (Wang et al. 2007; Xiang
et al. 2003; Zhao et al. 1996; Zhang et al. 1998 - already excluded, see footnote 1) dFluoride from coal-burning (Li et al. 2009; Guo et al. 1991; Li et al 1994 (already excluded, see
footnotes a and b)
Page 27 of 31
28
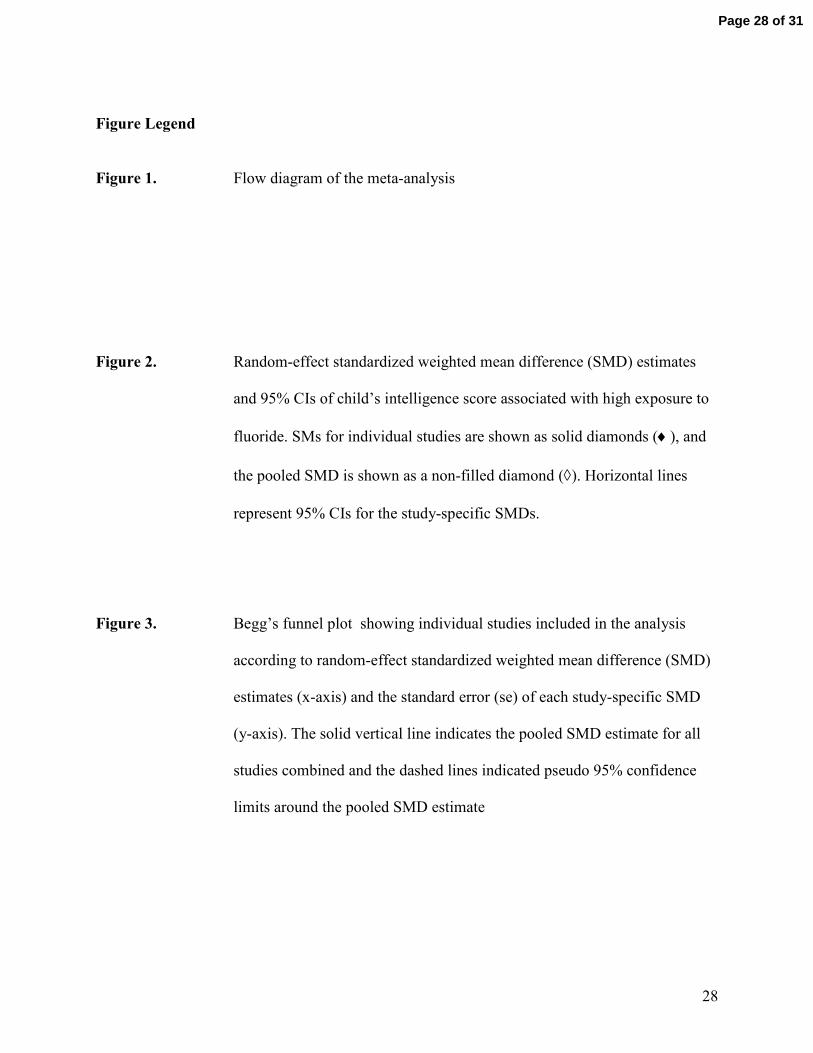
Figure Legend
Figure 1. Flow diagram of the meta-analysis
Figure 2. Random-effect standardized weighted mean difference (SMD) estimates
and 95% CIs of child’s intelligence score associated with high exposure to
fluoride. SMs for individual studies are shown as solid diamonds (♦), and
the pooled SMD is shown as a non-filled diamond (◊). Horizontal lines
represent 95% CIs for the study-specific SMDs.
Figure 3. Begg’s funnel plot showing individual studies included in the analysis
according to random-effect standardized weighted mean difference (SMD)
estimates (x-axis) and the standard error (se) of each study-specific SMD
(y-axis). The solid vertical line indicates the pooled SMD estimate for all
studies combined and the dashed lines indicated pseudo 95% confidence
limits around the pooled SMD estimate
Page 28 of 31
Total abstracts identified from literature search (N=39)
(N=38)- Duplicate records removed
(N=2) (N=2)
(N=38)-
Studies for retrieval of detailed information (N=34)
(N=38)- Studies with missing information on outcomes
(N=6)
(N=38)-
Studies excluded because they did not meet inclusion criteria
(N=3) (N=2)
(N=38)-
Studies included in meta-analysis (N=27)
Studies excluded due to questionably small standard deviations (N=1)
(N=2)
(N=38)-
Page 29 of 31
Overall (I-squared = 80.0%, p = 0.000)
Xiang et al. 2003
Lu et al. 2000
Li et al. 1995
Wang et al. 2006
Li et al. 2009
Hong et al. 2001
Wang et al. 2007
Guo et al. 1991
Wang et al. 1996
Li et al. 1994
Li et al. 2003
Wang et al. 2001
Li et al. 2010
Seraj et al. 2006
Zhang et al. 1998
Zhao et al. 1996
Xu et al. 1994
Yao et al. 1996
Sun et al. 1991
Yao et al. 1997
Yang et al. 1994
Fan et al. 2007
Poureslami et al. 2011
Ren et al. 1989
Study
Lin et al. 1991
An et al. 1992
Chen et al. 1991
Jiangsu
Tianjin
Guizhou
Shanxi
Hunan
Shandong
Shanxi
Hunan
Xinjiang
Sichuan
I Mongolia
Shandong
Henan
Tehran
Xinjiang
Shanxi
Shandong
Liaoning
Guiyang
Liaoning
Shandong
Shaanxi
Iran
Shandong
Location
Xinjiang
I Mongolia
Shanxi
-0.45 (-0.56, -0.34)
-0.64 (-0.82, -0.46)
-0.62 (-0.98, -0.25)
-0.55 (-0.70, -0.39)
-0.27 (-0.47, -0.06)
-0.43 (-0.94, 0.08)
-0.44 (-0.85, -0.03)
-0.26 (-0.44, -0.07)
-0.44 (-0.80, -0.08)
-0.38 (-0.65, -0.10)
-0.40 (-0.74, -0.06)
-0.10 (-0.25, 0.04)
-0.50 (-1.01, 0.02)
0.07 (-0.08, 0.22)
-0.89 (-1.28, -0.50)
-0.17 (-0.55, 0.22)
-0.54 (-0.76, -0.31)
-0.93 (-1.35, -0.52)
-0.34 (-0.51, -0.17)
-0.95 (-1.16, -0.75)
-0.43 (-0.61, -0.25)
-0.50 (-1.01, 0.02)
-0.17 (-0.61, 0.27)
-0.41 (-0.77, -0.04)
-0.75 (-0.97, -0.52)
SMD (95% CI)
-0.64 (-1.01, -0.28)
-0.57 (-0.83, -0.31)
-0.26 (-0.41, -0.10)
100.00
4.52
3.20
4.68
4.34
2.38
2.94
4.46
3.26
3.88
3.39
4.71
2.36
4.69
3.08
3.09
4.22
2.91
4.57
4.36
4.49
2.36
2.75
3.25
4.22
Weight
3.23
3.98
4.66
%
0-1.5 -1 0 .5 1
Page 30 of 31

0.0
5.1
.15
.2.2
5se
(SM
D)
-1 -.5 0SMD
p p
Page 31 of 31


![Fluoride toothpastes for preventing dental caries in ...neuron.mefst.hr/docs/katedre/znanstvena_metodologija/Fluoride... · [Intervention Review] Fluoride toothpastes for preventing](https://static.fdocuments.us/doc/165x107/5ac7a33f7f8b9aa3298b67ff/fluoride-toothpastes-for-preventing-dental-caries-in-intervention-review-fluoride.jpg)