Flow Regime Classification and Hydrological ...
17
Water 2015, 7, 3149-3165; doi:10.3390/w7063149 water ISSN 2073-4441 www.mdpi.com/journal/water Article Flow Regime Classification and Hydrological Characterization: A Case Study of Ethiopian Rivers Belete Berhanu 1,2 , Yilma Seleshi 1 , Solomon S. Demisse 2 and Assefa M. Melesse 3, * 1 School of Civil and Environmental Engineering, Addis Ababa Institute of Technology (AAiT), Addis Ababa 385, Ethiopia; E-Mails: [email protected] (B.B.); [email protected] (Y.S.) 2 Ethiopian Institute of Water Resources (EIWR), Addis Ababa University, Addis Ababa 3001, Ethiopia; E-Mail: [email protected] 3 Department of Earth and Environment, Florida International University, Miami, FL 33199, USA * Author to whom correspondence should be addressed; E-Mail: [email protected]; Tel.: +1-305-348-6518; Fax: +1-305-348-3877. Academic Editor: Athanasios Loukas Received: 23 March 2015 / Accepted: 15 June 2015 / Published: 22 June 2015 Abstract: The spatiotemporal variability of a stream flow due to the complex interaction of catchment attributes and rainfall induce complexity in hydrology. Researchers have been trying to address this complexity with a number of approaches; river flow regime is one of them. The flow regime can be quantified by means of hydrological indices characterizing five components: magnitude, frequency, duration, timing, and rate of change of flow. Similarly, this study aimed to understand the flow variability of Ethiopian Rivers using the observed daily flow data from 208 gauging stations in the country. With this process, the Hierarchical Ward Clustering method was implemented to group the streams into three flow regimes (1) ephemeral, (2) intermittent, and (3) perennial. Principal component analysis (PCA) is also applied as the second multivariate analysis tool to identify dominant hydrological indices that cause the variability in the streams. The mean flow per unit catchment area (QmAR) and Base flow index (BFI) show an incremental trend with ephemeral, intermittent and perennial streams. Whereas the number of mean zero flow days ratio (ZFI) and coefficient of variation (CV) show a decreasing trend with ephemeral to perennial flow regimes. Finally, the streams in the three flow regimes were characterized with the mean and standard deviation of the hydrological variables and the shape, slope, and scale of the flow duration curve. Results of this study are the basis for further understanding of the ecohydrological processes of the river basins in Ethiopia. OPEN ACCESS
Transcript of Flow Regime Classification and Hydrological ...

Water 2015, 7, 3149-3165; doi:10.3390/w7063149
water ISSN 2073-4441
www.mdpi.com/journal/water
Article
Flow Regime Classification and Hydrological Characterization: A Case Study of Ethiopian Rivers
Belete Berhanu 1,2, Yilma Seleshi 1, Solomon S. Demisse 2 and Assefa M. Melesse 3,*
1 School of Civil and Environmental Engineering, Addis Ababa Institute of Technology (AAiT),
Addis Ababa 385, Ethiopia; E-Mails: [email protected] (B.B.); [email protected] (Y.S.) 2 Ethiopian Institute of Water Resources (EIWR), Addis Ababa University, Addis Ababa 3001,
Ethiopia; E-Mail: [email protected] 3 Department of Earth and Environment, Florida International University, Miami, FL 33199, USA
* Author to whom correspondence should be addressed; E-Mail: [email protected];
Tel.: +1-305-348-6518; Fax: +1-305-348-3877.
Academic Editor: Athanasios Loukas
Received: 23 March 2015 / Accepted: 15 June 2015 / Published: 22 June 2015
Abstract: The spatiotemporal variability of a stream flow due to the complex interaction
of catchment attributes and rainfall induce complexity in hydrology. Researchers have
been trying to address this complexity with a number of approaches; river flow regime is
one of them. The flow regime can be quantified by means of hydrological indices
characterizing five components: magnitude, frequency, duration, timing, and rate of change
of flow. Similarly, this study aimed to understand the flow variability of Ethiopian Rivers
using the observed daily flow data from 208 gauging stations in the country. With this
process, the Hierarchical Ward Clustering method was implemented to group the streams
into three flow regimes (1) ephemeral, (2) intermittent, and (3) perennial. Principal
component analysis (PCA) is also applied as the second multivariate analysis tool to
identify dominant hydrological indices that cause the variability in the streams. The mean
flow per unit catchment area (QmAR) and Base flow index (BFI) show an incremental
trend with ephemeral, intermittent and perennial streams. Whereas the number of mean
zero flow days ratio (ZFI) and coefficient of variation (CV) show a decreasing trend with
ephemeral to perennial flow regimes. Finally, the streams in the three flow regimes were
characterized with the mean and standard deviation of the hydrological variables and the
shape, slope, and scale of the flow duration curve. Results of this study are the basis for
further understanding of the ecohydrological processes of the river basins in Ethiopia.
OPEN ACCESS
Water 2015, 7 3150
Keywords: Ethiopia; flow regime; ephemeral; intermittent; perennial; hydrological indices;
flow duration curve
1. Introduction
The stream flow response to rainfall depends on the catchment attributes [1] that include the
physiographic, underlying geology, vegetation cover and rainfall amount, intensity, and frequency.
The interaction between these attributes and the nature of the response are variable in space and time
and induce complexity which cannot yet be predicted in hydrology [2]. River flow regime is one of the
means that addresses the complexity of stream flow response through the process of systematically
organizing streams, rivers or catchments into groups that are most similar with respect to their flow
characteristics [3].
Historically, flow regimes have played a vital role in the ecological sciences in understanding river
flow variability [4–7], planning conservation efforts for freshwater ecosystems [8,9], exploring the
influence of stream flow on living communities and ecological processes [10–14], providing an
inventory of hydrologic types for water resource management [15,16], and hydrologic regionalization
analyses [17]. Recently, grouping of gauging stations into flow regime classes based on time series
data and selected hydrological variables has shown some significance in large-scale river management
and research [7,18] for environmental monitoring, simplifying water allocation decisions and
environmental flow setting [1,18,19], and also used as a tool for comparative hydrology to understand
the physical representations of the flow duration curves [20–24].
Flow regime classification is achieved commonly on the basis of stream flow characteristics using
hydrologic indices with five stream flow components; magnitude, frequency, duration, timing, and rate
of changes of flows [25,26]. In most of the studies, the hydrological indices of the rivers are calculated
from a time series data recorded at gauging stations [27]. Statistical similarities in hydrological indices
are then used to group gauging stations with similar flow regimes [18]. The use of a flow regime
classification is maximized when class membership is extrapolated to ungauged locations. In several
recent studies, temporal flow data have been combined with spatial environmental and physical data of
watersheds in statistical classifications that were used to predict river flow regimes for ungauged
watersheds [1,19].
To our knowledge, there have been no comparable studies that focused specifically on flow regimes
of rivers at gauge stations in Ethiopia. Thus the objectives of the study were to (1) classify the rivers of
the country based on hydrological indices into three flow regimes as ephemeral, intermittent, and
perennial, and (2) develop relationships among flow regimes, hydrological variables, and catchment
descriptors to characterize flows for ungauged rivers.
Water 2015, 7 3151
2. Study Area and Dataset
2.1. Study Area Description
Ethiopia is a country that has a high plateau with a central mountain range divided by the Great Rift
Valley. The altitudinal variation of the country ranges between two extremes, from 125 m below sea
level at Denakil Depression to 4543 m above sea level at RasDejen (Dashen) peak. Broadly, the
country can be divided into two areas: the highlands and the lowlands, by the dividing contour line at
an altitude of 1500 m above sea level. The high lands, covering nearly 44% of the country’s landmass,
accommodate 88% of the total human and 70% of the livestock populations [28,29]. Rivers that
originate from the central and western highlands on the west side of the Great-Rift Valley flow to the
west into the Nile River basin system, and cover about 39% of the land mass and 70% of the surface
water of the country. The rivers originating from the eastern highlands of the country mainly flow to
the east. These rivers together with the two Rift Valley river basins cover the largest land mass of the
country (61%) but generate only 30% of the surface water [30]. Those rivers flowing to the west are
mono-modal in nature with distinct single peak flow in July–August, whereas the rivers flowing to the
east and south are generally bi-modal in nature with different seasonal flow peaks in March–April, and
September–October.
2.2. Data Set
The daily flow data and stream flow gauging stations were collected from the Hydrology
Directorate of the Ministry of Water and Energy of Ethiopia. River flow data from 208 flow gauging
stations with more than 15 years daily flow data were collected and processed (Figure 1). A 30 m
digital elevation model (DEM) data was used to delineate the catchments and compute different
catchment features upstream of the gauging stations.
3. Methodology
3.1. Data Analysis
Daily time series flow data of the selected stations were analyzed using REXCEL, a software
application which combines the computational capability of R with excel data. The hydrological
indices and statistical analysis were computed using the RExcel version 3.2.12. The statistical methods
were programmed in open access R software. The Archydro extension of ArcGIS was also used to
delineate catchment area and to compute the catchment attributes.
3.2. Flow Regime Classification
Flow regime classification provides the basis for hydrological and ecological studies [31]. Stream
flow is a useful measure for classification purposes, because it integrates the influences of most
landscape features into a single measurable “characteristic”. Likens [32], Richter [33], and Poff [25]
suggested five stream flow categories; magnitude, frequency, duration, predictability, and rate of

Water 2015, 7 3152
change that include a number of flow characteristics and represent the flow regimes as ephemeral,
intermittent, and perennial.
Figure 1. Summary statistics of catchment area, river length, and gauging stations used in
this study.
The flow regimes classification for Ethiopian gauged streams used a supervised approach. First, the
three flow types were identified from the sample selected rivers in the country as Ephemeral: a stream
or portion of a stream which flows briefly in direct response to precipitation in the immediate vicinity,
and whose channel is at all times above the groundwater reservoir. Intermittent: a stream where
portions flow continuously only at certain times of the year (i.e., seasonal). At low flow there may be
dry segments alternating with flowing segments. The stream bed has at sometime of the year to be
above the groundwater table. Perennial: a stream or portion of a stream that flows year-round is
considered a permanent stream, and for which base flow is maintained by groundwater discharge to the
stream bed due to the groundwater elevation adjacent to the stream typically being higher than the
elevation of the streambed [34]. The flow regime of the sampled rivers is used to define the flow
regimes of the 208 gauged streams in the country.
Cluster analysis is the method most often used to make classifications of objects [35]. It is
used to portion the dataset into groups (clusters) using the statistical proximity according to some
defined distance measure. We grouped 208 gauged rivers into three clusters using the agglomerative
Water 2015, 7 3153
hierarchical clustering. Poff and Ward [3] employed a conceptual stream classification model, which
was based on a hierarchical ranking of four components of flow regime (intermittency, flood
frequency, flood predictability, and overall flow predictability). Moliere [36] also followed the
previous work and arrived at a broad streams classification as perennial, seasonal, dry seasonal, and
seasonal intermittent using the hierarchical ranking. A study in the Mediterranean basin also adopted
the same clustering approach with the introduction of a new variable called flashiness index [37].
Thus, in this study, the hierarchical agglomerative clustering was used to define the flow regime of the
gauged streams using six hydrological indices, which were grouped into three flow regime descriptors
(Table 1).
Table 1. Definitions of the hydrological variables derived for each station.
Variable Symbol Definition
Catchment descriptors
Flow per catchment unit area QmAR Mean daily discharge divided by the catchment Area (m3/s/km2)
Base flow Index BFI The ratio of mean daily discharge by the mean daily base flow
Flow variability
Coefficient of Variation CV Coefficient of variation of daily flows
flashiness index RBI Flashiness reflects the frequency and rapidity of short term changes in stream flow
Extent of Intermittency
Mean Peak flow day PFday The mean day of the year for the peak flow occurred
Zero flow DAY index ZFI Mean annual number of zero flow days is divided by 365
3.2.1. Catchment Descriptor
Two hydrological variables; the mean flow per unit catchment area (QmAR), and the base flow
index (BFI) are used as the catchment descriptors in the multivariate clustering analysis [36,37]. The
BFI indicates the nature of the water dynamics in the river and is related to the groundwater aquifer. In
northeastern USA, 1575 stream flow stations were classified into different regional properties based on
base flow [38].
In our study, the base flows for 208 stream gauged stations were computed based on Digital Filter
Approach. It uses a numerical algorithm (a digital filter) to partition the stream flow hydrograph into
“high frequency” (direct runoff) and “low frequency” (base flow) components. The following single
parameter algorithm is used for the computation of the base flow.
( )tttt QQRR −++= ++ 11 2
1 αα (1)
Check: If Rt+1 < 0; then Rt+1 = 0 and If Rt+1> Qt+1; then Rt+1 = Qt+1
Compute base flow: Bt+1 = Qt+1 − Rt+1
The single parameter α is taken as 0.98 as default value.
3.2.2. Flow Variability
Two measures of flow variability were used in this category. The first is the annual daily flow
coefficient of variation, which is calculated as the standard deviation of all the daily flow values

Water 2015, 7 3154
divided by the mean annual daily flow. The second is the flashiness index, which indicates the
frequency and rapidity of short term changes in the stream flow [39]. Streams that rise and fall quickly
are considered as flasher than those that maintain a steady flow [40]. The quantifying approach of this
flashiness was proposed by Baker [39] as flashiness index (RB Index) as
=
=− −
=n
ii
n
iii
Index
q
qqRB
1
11
(2)
where, i is the time step and q is the daily flow.
3.2.3. Extent of Intermittency
The mean annual number of days with zero flow ratio (ZFRatio) is computed by dividing the mean
annual number of days with zero flow by 365 [36,41]. This index has been widely used in river
classification taxonomy [42].The mean day of the peak flow (PFday) is also the other variable that
measures the time of the occurrence of the flood for the given station. Then values of the six
hydrological variables (QmAR, BFI, CV, RBI, PFday, and ZFI) for 208 gauging stations were used as
input to group the streams into three flow regimes. With the Agglomerative Hierarchical Ward
Clustering method, the streams are broadly grouped into three classes. Then the three groups are
assigned as (1) Ephemeral, (2) Intermittent, and (3) Perennial streams, based on their representative
sampled rivers at the time of supervision.
3.2.4. Principal Component Analysis of Hydrologic Variables
Principal component analysis (PCA) is used as a secondary multivariate analysis in this study. This
analysis was performed for each homogeneous group of streams and for all the streams combined. For
every set of streams, PCA was extracted from the correlation matrix of the hydrological indices and
employed to examine dominant patterns of inter-correlation among the hydrological variables and to
identify the major sources of variation. PCA was selected in this analysis since it puts a unit on the
diagonal and all of the variances (variance unique to each variable, variance common among variables
and error variance) in the matrix are considered [43]. Its contributions are scale-independent [44] and
less sensitive to extreme values [45].
3.3. Flow Regime Characterization
Once the flow regimes were developed with the clustering procedure, they were characterized and
described using the hydrological variables and the flow duration curve (FDC). The hydrological
variables describe the magnitude and rate of change of the flows. The flow duration curve also
characterizes the flow regime using the magnitude, frequency, and duration of the flow. The graphical
display power of FDC also helps to visualize the variability of the stream flows in different flow regimes.
Water 2015, 7 3155
3.4. Relationships of Flow Duration Curve (FDC) and Catchment Descriptors
The computations of FDC quantiles for ungauged basins can be done through different methods. In
this research, the multiple regression model, which is widely applied for such a purpose was used to
relate the catchment descriptors, catchment area (A, km2) and longest flow length of the catchment
(L, km), with different regime characteristics to estimate values for ungauged basins.
4. Results
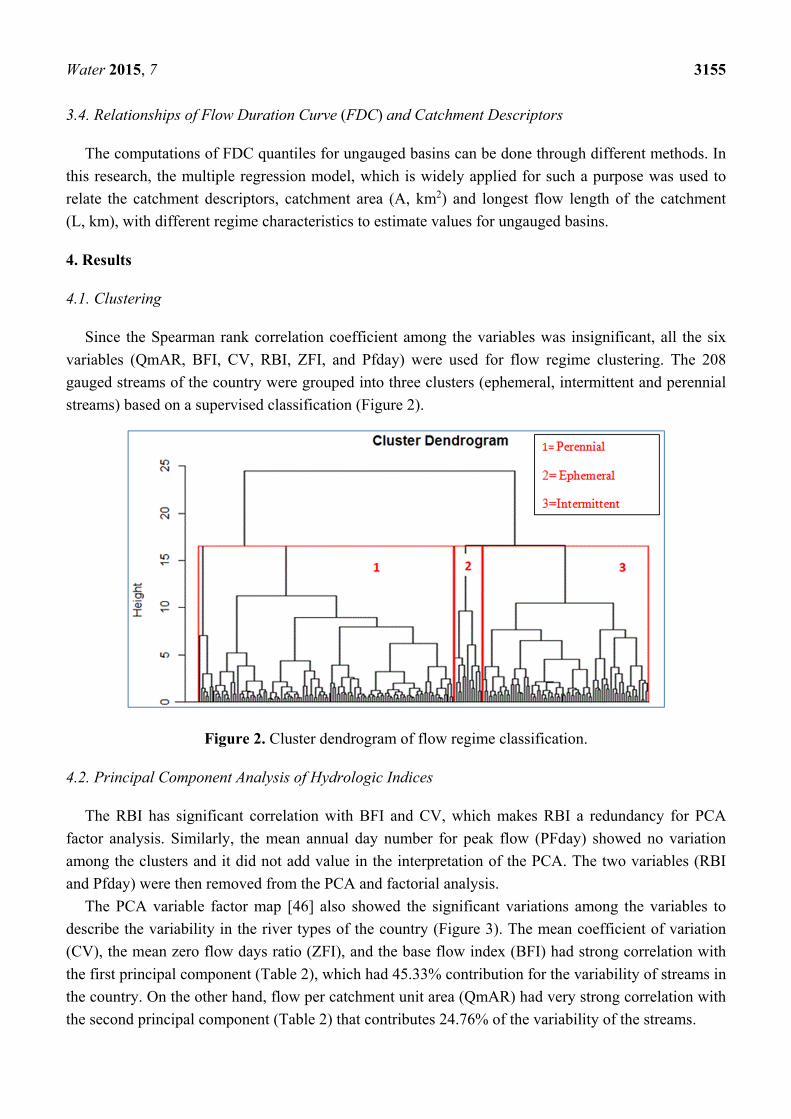
4.1. Clustering
Since the Spearman rank correlation coefficient among the variables was insignificant, all the six
variables (QmAR, BFI, CV, RBI, ZFI, and Pfday) were used for flow regime clustering. The 208
gauged streams of the country were grouped into three clusters (ephemeral, intermittent and perennial
streams) based on a supervised classification (Figure 2).
Figure 2. Cluster dendrogram of flow regime classification.
4.2. Principal Component Analysis of Hydrologic Indices
The RBI has significant correlation with BFI and CV, which makes RBI a redundancy for PCA
factor analysis. Similarly, the mean annual day number for peak flow (PFday) showed no variation
among the clusters and it did not add value in the interpretation of the PCA. The two variables (RBI
and Pfday) were then removed from the PCA and factorial analysis.
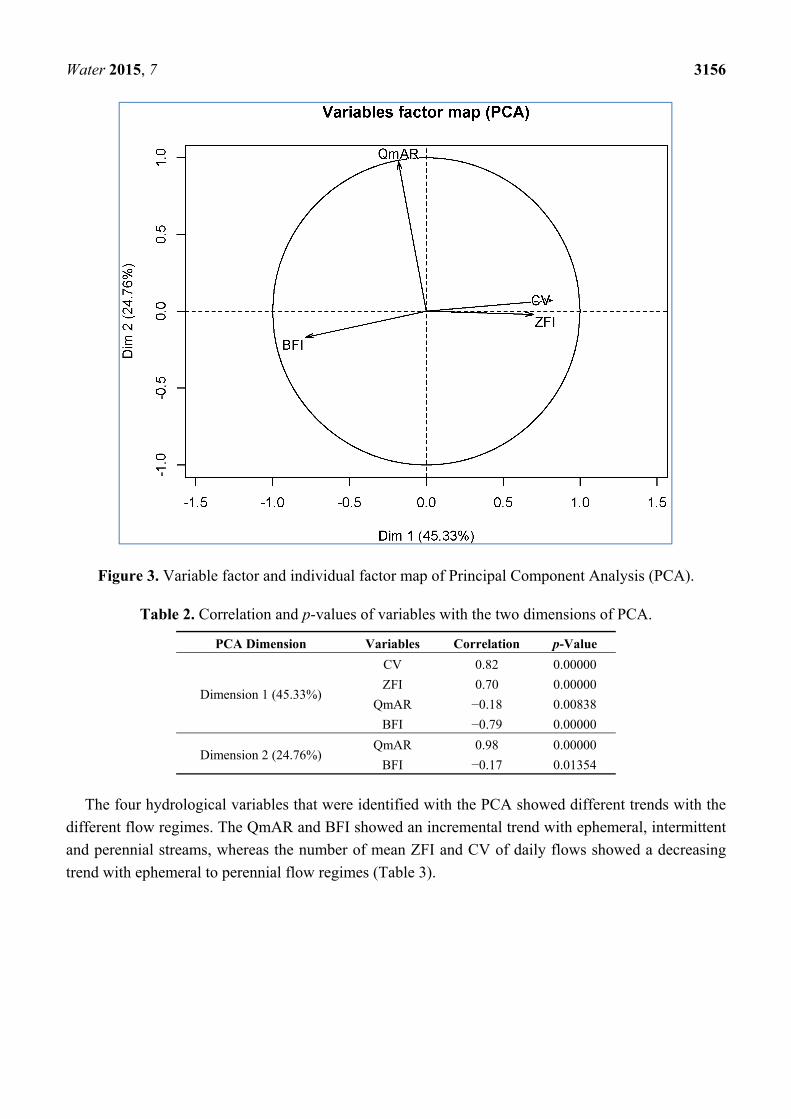
The PCA variable factor map [46] also showed the significant variations among the variables to
describe the variability in the river types of the country (Figure 3). The mean coefficient of variation
(CV), the mean zero flow days ratio (ZFI), and the base flow index (BFI) had strong correlation with
the first principal component (Table 2), which had 45.33% contribution for the variability of streams in
the country. On the other hand, flow per catchment unit area (QmAR) had very strong correlation with
the second principal component (Table 2) that contributes 24.76% of the variability of the streams.
Water 2015, 7 3156
Figure 3. Variable factor and individual factor map of Principal Component Analysis (PCA).
Table 2. Correlation and p-values of variables with the two dimensions of PCA.
PCA Dimension Variables Correlation p-Value
Dimension 1 (45.33%)
CV 0.82 0.00000
ZFI 0.70 0.00000
QmAR −0.18 0.00838
BFI −0.79 0.00000
Dimension 2 (24.76%) QmAR 0.98 0.00000
BFI −0.17 0.01354
The four hydrological variables that were identified with the PCA showed different trends with the
different flow regimes. The QmAR and BFI showed an incremental trend with ephemeral, intermittent
and perennial streams, whereas the number of mean ZFI and CV of daily flows showed a decreasing
trend with ephemeral to perennial flow regimes (Table 3).
Water 2015, 7 3157
Table 3. The mean, standard deviation (SD) and coefficient of variation (CV) of variables
of flow regimes.
Flow
Regimes
Mean Flow Per Catchment
Area (QmAR)
Base Flow
Index (BFI)
Number of Mean Zero
Flow Days Ratio (ZFI)
Coefficient of Variation
of Daily Flow (CV)
Mean SD CV Mean SD CV Mean SD CV Mean SD CV
Ephemeral 0.013 0.012 0.918 0.189 0.080 0.420 0.242 0.224 0.924 4.386 1.622 0.370
Intermittent 0.015 0.015 0.985 0.294 0.097 0.329 0.104 0.109 1.048 1.230 0.598 0.486
Perennial 0.022 0.033 1.475 0.451 0.118 0.262 0.044 0.075 1.695 0.507 0.226 0.446
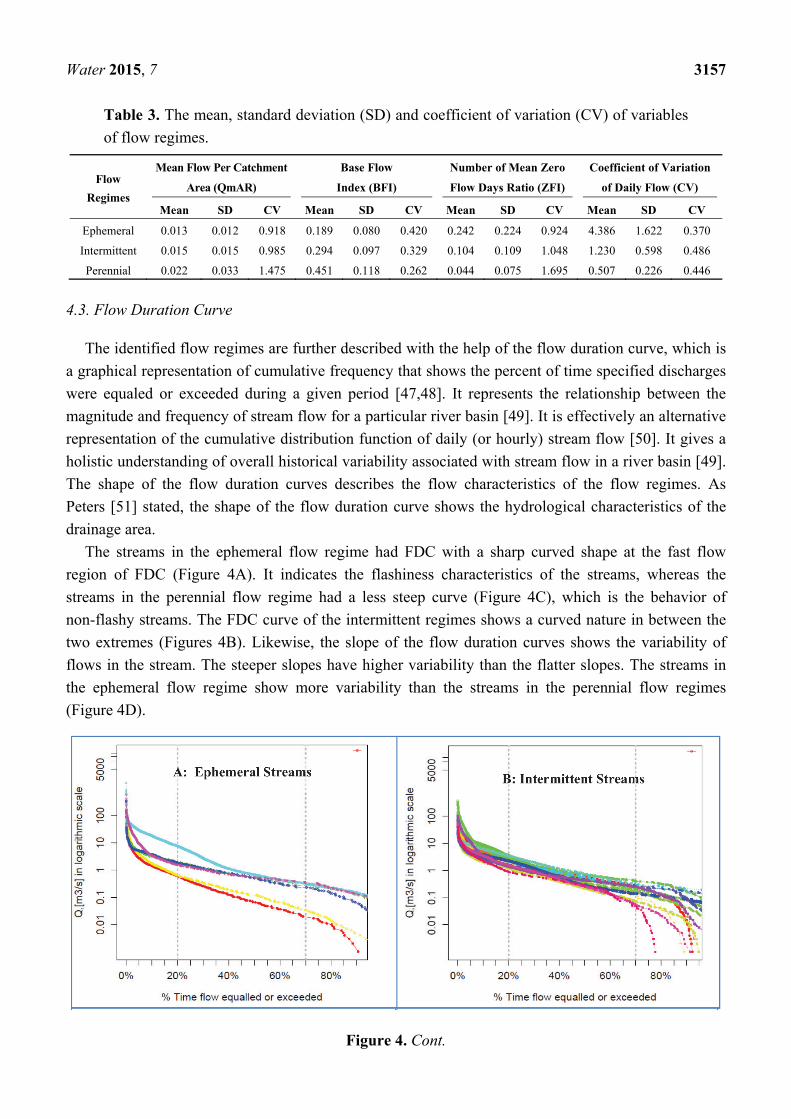
4.3. Flow Duration Curve
The identified flow regimes are further described with the help of the flow duration curve, which is
a graphical representation of cumulative frequency that shows the percent of time specified discharges
were equaled or exceeded during a given period [47,48]. It represents the relationship between the
magnitude and frequency of stream flow for a particular river basin [49]. It is effectively an alternative
representation of the cumulative distribution function of daily (or hourly) stream flow [50]. It gives a
holistic understanding of overall historical variability associated with stream flow in a river basin [49].
The shape of the flow duration curves describes the flow characteristics of the flow regimes. As
Peters [51] stated, the shape of the flow duration curve shows the hydrological characteristics of the
drainage area.
The streams in the ephemeral flow regime had FDC with a sharp curved shape at the fast flow
region of FDC (Figure 4A). It indicates the flashiness characteristics of the streams, whereas the
streams in the perennial flow regime had a less steep curve (Figure 4C), which is the behavior of
non-flashy streams. The FDC curve of the intermittent regimes shows a curved nature in between the
two extremes (Figures 4B). Likewise, the slope of the flow duration curves shows the variability of
flows in the stream. The steeper slopes have higher variability than the flatter slopes. The streams in
the ephemeral flow regime show more variability than the streams in the perennial flow regimes
(Figure 4D).
Figure 4. Cont.

Water 2015, 7 3158
Figure 4. Flow duration curve (FDC) of streams for different flow regimes in Ethiopia.
(A) Ephemeral streams; (B) Intermittent streams; (C) Perennial stream; (D) All in one view.
4.4. Catchment Descriptors and Flow Duration Relations
A multiple regression analysis was applied to develop the relationships of catchment descriptors,
longest flow length, L (km) and catchment area A (km2) (Table 4). The catchment descriptors L and A
showed strong relationship with the flow quantiles shown in the FDC for perennial, intermittent and
ephemeral streams with ranges of R2 values (0.86–0.98), (0.67–0.91) and (0.53–0.64), respectively.
These linear relationships have a significant contribution in estimating the quantiles and plotting the
FDC for ungauged catchments. The poor correlation between the flow quantiles and catchment
descriptors in ephemeral streams is an indicator of a flashy nature of the stream flow and shows the
flow is not very dependent on the area and length of the drainage area.
Table 4. Linear relationship of catchment descriptors with flow duration curve for each
flow regimes.
Flow Regime Linear Relationship R-Square
L = Length of the longest river in the catchment (km); A = Catchment area of the basin (km2)
Ephemeral streams
Q10 = −3.7621 + 0.3614 × L − 0.0077 × A 0.642
Q20 = −1.4761 + 0.1540 × L − 0.0042 × A 0.533
Q33 = −0.3934 + 0.0500 × L − 0.0014 × A 0.640
Q66 = −0.0988 + 0.0122 × L − 0.0003 × A 0.624
Q80 = −0.0833 + 0.0084 × L − 0.0002 × A 0.605
Q90 = −0.0465 + 0.0049 × L − 0.0002 × A 0.570
Intermittent streams
Q10 = 10.0137 − 0.0870 × L + 0.0138 × A 0.913
Q20 = 3.0111 + 0.0294 × L + 0.0045 × A 0.805
Q33 = 1.2064 + 0.0114 × L + 0.0017 × A 0.738
Q66 = 0.5749 − 0.0061 × L + 0.0005 × A 0.864
Q80 = 0.3164 − 0.0033 × L + 0.0002 × A 0.836
Q90 = 0.1823 − 0.0007 × L + 0.0001 × A 0.665

Water 2015, 7 3159
Table 4. Cont.
Flow Regime Linear Relationship R-Square
Perennial streams
Q10 = 13.7561 − 0.2223 × L + 0.0274 × A 0.976
Q20 = 6.7423 + 0.0916 × L + 0.0111 × A 0.915
Q33 = 5.5108 + 0.0552 × L + 0.0053 × A 0.858
Q66 = 1.2939 − 0.0036 × L + 0.0018 × A 0.959
Q80 = 0.6057 + 0.0062 × L + 0.0009 × A 0.952
Q90 = 0.4870 − 0.0021 × L + 0.0006 × A 0.959
5. Discussions
5.1. Flow Regime Classification
The three flow regimes (ephemeral, intermittent and perennial) of the streams of the country were
identified and classified using the flow indices derived from flow data collected at the gauging
stations. The spatial distribution of the stream types in the river basins along with the topographical
variability of the country is presented in Figure 5.
Figure 5. Flow regimes of Ethiopian streams along with elevation variability.
As depicted in Figure 5, most of the stream gauging stations in the country fall under perennial
followed by the seasonal (intermittent) category. The ephemeral streams, which have significant

Water 2015, 7 3160
variability on the flood occurrence, were not well represented by the existing gauging stations.
Therefore, the results of this research indicate the need for a better stream monitoring network.
Ephemeral streams are found on the head water catchments, whereas the perennial and intermittent
streams were identified in the lower and intermediate section of the river basins. The result is also
useful to predict flow regime of ungauged streams based on their catchment area and river length as
shown in Table 4.
5.2. Flow Regime Characterization
The PCA differentiates the hydrological variables that have a contribution for the variability of
stream regimes in the country. The singularity and no variance conditions make the PCA senseless and
its verification is essential to identify the hydrological variables that contribute more for flow regime
variations [37]. As stated in the results section, RBI has strong correlation with the other two variables
(CV and BFI), and PFday has no variability among the flow regimes, Using them in the PCA is a
redundancy. Although the two variables (PFday and RBI) are removed from the PCA analysis, they
have a significant importance in describing the characteristics of rivers in Ethiopia. The mean annual
values of PFday range from 157–271 days. It means that the peak flows of the rivers in the country are
recorded in the months of June to September, which is referred to as the main rainy season of the
country [30]. Similarly, the mean flashiness index (RBI) of the streams of the different clusters ranges
from 0.011–1.113, which is the smallest value among mean flashiness indices computed in similar
studies in tropical and Mediterranean regions [37,39,40].This is a good indicator that Ethiopian rivers
are non-flashy.
The values of selected hydrological variables (QmAR, BFI, ZFI, and CV) characterize the different
flow regimes and potentially can be used to characterize streams of ungauged watersheds. Ephemeral
streams can be characterized with small QmAR and BFI values and high ZFI and CV values. It shows
that ephemeral streams are relatively small streams with a large dry period and high variability of flow.
Perennial streams are large streams with significant contribution of the base flows and relatively less
variability throughout the year. This finding is in line with similar studies in France [47] and other
tropical regions [36].
Furthermore, the different flow regimes were characterized by their shape, scale, and slope of the
flow duration curve. A flow duration curve (FDC) with a steep slope results from a streamflow that is
highly influenced by direct runoff, which is a marked characteristic of ephemeral streams. Whereas a
curve with a relatively lower slope results from streamflow that is well sustained by surface releases or
groundwater discharges and also identified as a perennial stream. The shape of the FDC is determined
by the hydrologic and geologic characteristics of the drainage area and the FDC can be used to study
the hydrologic response of basins to various types and distributions of hydro-meteorological inputs.
Finally, linear relationships among catchment descriptors and the FDC were developed for flow
regimes characterization of ungauged catchments. A number of studies presented different
relationships of catchment descriptors with regional models of FDCs for various geographical areas of
the world [21,52–59]. Similarly, the linear relationships of catchment descriptors and FDC presented
in Table 4 can serve as the basis for the estimation of FDC for ungauged catchments and also to
characterize the flow regimes of ungauged catchments of the country. Selection of the flow regimes for

Water 2015, 7 3161
ungauged catchments can be initiated based on the size of the catchment as described above in the
hydrological variables characterization section. Then, the selection can be verified using the scale,
shape, and slope of the FDC drawn after the computation of the FDC quantiles using the relationships
in Table 4.
6. Conclusion
Multivariate cluster analysis was applied in this study in order to classify rivers based on flow data from
208 gauging stations in Ethiopia. Six hydrological variables (daily mean flow area ratio, base flow index,
coefficient of variation, flashiness index, mean peak flow day, and the ratio of mean zero flow days) that
were grouped into three categories as catchment descriptor, flow variability, and extent of intermittency
were used for the flow regime classification. The study result shows Ethiopian Rivers are grouped into
three flow regimes: (1) Ephemeral streams, (2) Intermittent streams and (3) Perennial streams.
The three flow regimes are characterized using the hydrological variables and the shape, slope, and
scale of the flow duration curve. The flow duration curve is selected for the characterization of the
flow regimes because of its ability to describe the magnitude, frequency, duration, timing, and rate of
change of flows. Thus, rivers that have lower mean daily flows and a high proportion of zero flow days
are ephemeral streams whereas large mean daily flows and a lower proportion of zero flow days
become perennial streams. Similarly, sharp curved, very steep, and lower scale flow duration curves
described the ephemeral flow regimes as the lower boundary, and a straight curve with flatter slope
and high scale flow duration curves describe the upper boundary of the flow regime classification as
perennial flow regimes.
The linear relationships among the catchment descriptors and FDC also help to classify and
characterize the flow regimes of ungauged catchments. These flow regimes of the country can further
be refined with additional hydrological signatures and by integrating them with other similar
hydrological regimes, like rainfall regimes and soil hydrological classification, to assist in the
understanding of the spatiotemporal variability of the hydrological and ecological processes.
Acknowledgment
The study was supported by the United States Agency for International Development (USAID) under
the USAID/HED funded grant in the Africa-US Higher Education Initiative-HED052-9740-ETH-11-01.
The authors also gratefully acknowledge the Hydrology Directorate, and the National meteorological
agency of the Ministry of Water and Energy Ethiopia, for their full corporation to provide hydrological
and meteorological data and also the Florida International University (FIU) for providing assistance
during the three months of the research visit by the first author. Our special thanks go to Nile Express,
a private Trucking company at Dallas, Texas USA for the financial support during the internship
program in FIU for the first author.
Author Contributions
This research article is the part of the PhD thesis of the first author, Belete Berhanu. Therefore he is
responsible for research design, analysis, and write-up. The other three co-authors, Yilma Seleshi,

Water 2015, 7 3162
Solomon S. Demisse and Assefa M. Melesse are the supervisors of this Ph.D work, particularly
Assefa Melesse who contributed more on editing, organizing, and submission of this research article.
Conflicts of Interest
The authors declare no conflict of interest.
References
1. Snelder, T.H.; Lamouroux, N.; Leathwick, J.R.; Pella, H.; Sauquet, E.; Shankar, U. Predictive
mapping of the natural flow regimes of France. J. Hydrol. 2009, 373, 56–67.
2. Sivapalan, M. Pattern, process and function: Elements of a unified theory of hydrology at
the catchment scale. In Encyclopedia of Hydrological Sciences; Anderson, M.G., Ed.;
John Wiley & Sons, Ltd.: Chichester, UK, 2005.
3. Poff, N.L; Ward, J.V. Implications of streamflow variability and predictability for lotic
community structure: A regional analysis of streamflow patterns. Can. J. Fish. Aquat. Sci. 1989, 46,
1805–1818.
4. Mosley, M.P. Delimitation of New Zealand hydrologic regions. J. Hydrol. 1981, 49, 179–192.
5. Haines, D.A. A lower atmospheric severity index for wildland fire. Natl. Weather Dig. 1988,
13, 23–27
6. Poff, N.L. A hydrogeography of unregulated streams in the United States and an examination of
scale-dependence in some hydrological descriptors. Freshw. Biol. 1996, 36, 71–91.
7. Poff, N.L.; Olden, J.D.; Pepin, D.M.; Bledsoe, B.P. Placing global stream flow variability in
geographic and geomorphic contexts. River Res. Appl. 2006, 22, 149–166.
8. Nel, J.L.; Roux, D.J.; Maree, G.; Kleynhans, C.J.; Moolman, J.; Reyers, B.; Rouget, M.;
Cowling, R.M. Rivers in peril inside and outside protected areas: A systematic approach to
conservation assessment of river ecosystems. Divers. Distrib. 2007, 13, 341–352.
9. Snelder, T.H.; Dey, K.; Leathwick, J.R. A procedure for making optimal selection of input
variables for multivariate environmental classifications. Conserv. Biol. 2007, 21, 365–375.
10. Jowett, I.G.; Duncan, M.J. Flow variability in New Zealand Rivers and its relationship to
in-stream habitat and biota. N. Z. J. Mar. Freshw. Res. 1990, 24, 305–317.
11. Poff, N.L.; Allan, J.D. Functional organization of stream fish assemblages in relation to
hydrological variability. Ecology 1995, 76, 606–627.
12. Pusey, B.J.; Arthington, A.H.; Read, M.G. Freshwater fishes of the Burdekin River, Australia:
Biogeography, history and spatial variation in community structure. Environ. Biol. Fish. 2000,
53, 303–318.
13. Snelder, T.H.; Weatherhead. M.; Biggs. B.J.F. Nutrient concentration criteria and characterization
of patterns in trophic state for rivers in heterogeneous landscape. J. Am. Water Resour. Assoc.
2004, 40, 1–13.
14. Monk, W.A.; Wood, P.J.; Hannah, D.M.; Wilson, D.A.; Extence, C.A.; Chadd, R.P. Flow
variability and macroinvertebrate community response within riverine systems. River Res. Appl.
2006, 22, 595–615.

Water 2015, 7 3163
15. Snelder, T.H.; Biggs, B.J.F. Multi-Scale river environment classification for water resources
management. J. Am. Water Resour. Assoc. 2002, 38, 1225–1240.
16. Arthington, A.H.; Bunn, S.E.; Naiman, N.L. The challenge of providing environmental flow rules
to sustain river ecosystems. Ecol. Appl. 2006, 16, 1311–1318.
17. Nathan, R.J.; McMahon, T.A. Identification of homogeneous regions for the purposes of
regionalization. J. Hydrol. 1990, 121, 217–238.
18. Olden, J.D.; Kennard, M.J.; Pusey, B.J. A framework for hydrologic classification with a review
of methodologies and applications in ecohydrology. Ecohydrology 2012, 5, 503–518.
19. Kennard, M.J.; Pusey, B.J.; Olden, J.D.; Mackay, S.J.; Stein, J.L.; Marsh, N. Classification of
natural flow regimes in Australia to support environmental flow management. In Freshwater
Biology; Blackwell Publishing Ltd: Queensland, Australia, 2010; Volume 55, pp.171–193.
20. Cheng, L.; Yaeger, M.A.; Coopersmith, E.; Ye, S.; Viglione, A.; Sivapalan, M. Exploring the
physical controls of regional patterns of Flow Duration Curves: Part 1 Insights fromstatistical
analyses. Hydrol. Earth Syst. Sci. 2012, 16, 4435–4446.
21. Castellarin, A.; Galeati, G.; Brandimarte, L.; Brath, A.; Montanari, A. Regional flow–duration
curves: Reliability for ungauged basins. Adv. Water Resour. 2004, 27, 953–965
22. Yaeger, M.A.; Ye, S.; Coopersmith, E.; Cheng, L.; Viglione, A.; Sivapalan, M. Exploring the
physical controls of regional patterns of Flow Duration Curves: 4. A synthesis of empirical analysis,
process modeling and catchment classification. Hydrol. Earth Syst. Sci. 2012, 16, 4483–4498.
23. Ye, S.; Yaeger, M.A.; Coopersmith, E.; Cheng, L.; Sivapalan, M. Exploring the physical controls
of regional patterns of Flow Duration Curves: 2. Role of seasonality and associated process
controls. Hydrol. Earth Syst. Sci. 2012, 16, 4447–4465.
24. Huxter, E.H.H.; van Meerveld, H.J. Intermittent and Perennial Stream flow Regime Characteristics in
the Okanagan. Can. Water Resour. J. 2012, 37, 391–414.
25. Poff, N.L.; Allan, J.D.; Bain, M.B.; Karr, J.R.; Prestegaard, K.L.; Richter, B.D.; Sparks, R.E.;
Stromberg, J.C. The natural flow regime: A paradigm for river conservation and restoration.
Bioscience 1997, 47, 769–784.
26. Henriksen, J.A.; Heasley, J.; Kennen, J.G.; Niewsand, S. Users’ Manual for the Hydroecological
Integrity Assessment Process Software (Including the New Jersey Assessment Tools); Open File
Report, 2006–1093; U.S. Geological Survey: Fort Collins, CO, USA, 2006.
27. Olden, J.D.; Poff, N.L. Redundancy and the choice of hydrologic indices for characterizing stream
flow regimes. River Res. Appl. 2003, 19, 101–121.
28. Erkossa, T.; Kidanu, S.; Mamo, T.; Abebe, M. Effect of Land preparation methods on runoff and
soil loss on a Vertisol at Ginchi, Ethiopia. Ethiop. J. Natl. Resour. 1999, 1, 1–15.
29. Solomon, A. Land Use Dynamics, Soil Degradation and Potential for Sustainable Use in Metu
Area, Illubabor region, Ethiopia; University of Berne: Berne, Switzerland, 1994; p. 135.
30. Berhanu, B.K.; Seleshi Y.; Melesse, A.M. Surface and Ground Water Resources of Ethiopia:Potentials
and Challenges of Water Resources Development, a Chapter in Ecohydrological Challenges,
Climate Change and Hydropolitics; Melesse, A.M., Abtew, W., Setegn, S.G., Eds.; Springer:
Cham, Switzerland, 2014; Volume 15, pp. 97–117.
31. Arthington, A.H.; Pusey, B.J. Flow restoration and protection in Australian rivers. River Res.
Appl. 2003, 19, 377–395.

Water 2015, 7 3164
32. Likens, G.E.; Bormann, F.; Pierce, R.S.; Eaton, J.S.; Johnson, N.M. Biogeochemistry of a
Forested Ecosystem; Springer-Verlag: New York, NY, USA, 1977.
33. Richte, B.D.; Baumgartner, J.V.; Powell, J.; Braun, D.P. A method for assessing hydrologic
alteration within ecosystems. Conserv. Biol. 1996, 10, 1163–1174.
34. Levick, L.J.; Fonseca, D.; Goodrich, M.; Hernandez, D.; Semmens, J.; Stromberg, R.; Leidy, M.;
Scianni, D.P.; Guertin, M.T.; Kepner, W. The Ecological and Hydrological Significance of Ephemeral
and Intermittent Streams in the Arid and Semi-arid American Southwest; EPA/600/R-08/134,
ARS/233046; U.S. Environmental Protection Agency: Washington, DC, USA; USDA/ARS
Southwest Watershed Research Center: Tucson, AZ, USA, 2008; p. 116.
35. Romesburg, H.C. General Features of Cluster Analysis; Lulu Press: Raleigh, NC, USA, 2004;
pp. 29–52.
36. Moliere, D.R.; Lowry, J.B.C.; Humphrey, C.L. Classifying the flow regime of data-limited
streams in the wet-dry tropical region of Australia. J. Hydrol. 2009, 367, 1–13.
37. Oueslati, O.; de girolamo, A.; Abouabdillah, A.; Lo porto, A. Attempts to flow regime
classification and Characterization in Mediterranean Streams Using Multivariate Analysis.
In Proceedings of the International workshop advances in statistical hydrology, Taormina, Italy,
23–25 May 2010.
38. Kim, K.; Hawkins, R.H. Classification of environmental hydrologic behaviors in the northeastern
unitedstates. JAWRA 2007, 29, 449–459.
39. Baker, D.B.; Richards, R.P.; Loftus, T.T.; Kramer, J.W. A new flashiness index: Characteristics
and applications to Midwestern Rivers and Streams. J. Am. Water Resour. Assoc. 2004,
95, 503–522.
40. Fongers, D.; Day, R.; Rathbun, J. Application of the Richards-Baker Flashiness Index to Gaged
Michigan Rivers and Streams; MI/DEQ/WRD-12/028; Michigan Department of Environmental
Quality: Lansing, MI, USA, 2012.
41. Snelder, T.H.; Datry, T.; Lamouroux, N.; Larned, S.T.; Sauquet, E.; Pella, H.; Catalogne, C.
Regionalization of patterns of flow intermittence from gauging station records: Hydrol. Earth
Syst. Sci. 2013, 17, 2685–2699.
42. Matthews, W.J. North American streams as systems for ecological study. J. North Am. Benthol. Soc.
1988, 7, 387–409.
43. Brown, T.A. Confirmatory Factor Analysis for Applied Research; Guilford Press: New York, NY,
USA, 2006.
44. Legendre, P.; Legendre, L. Numerical Ecology; Elsevier Scientific: Amsterdam, The Netherlands, 1998.
45. Assani, A.A.; Lajoie, S.; Tardif, F. Statistical analysis of factors affecting the spatial variability of
annual minimum flow characteristics in a cold temperate continentalregime (southern Quebec,
Canada). J. Hydrol. 2006, 328, 753–763.
46. Principal Component Analysis with FactoMineR. Available online: http://www.statistik.tuwien.ac.at/
public/filz/students/seminar/ws1011/hoffmann_ausarbeitung.pdf (accessed on 17 June 2015).
47. Sauquet, E.; Catalogne, C. Comparison of catchment grouping methods for 685 flow duration
curve estimation at ungauged sites in France. Hydrol. Earth Syst. Sci. 2011, 15, 2421–2435.
48. Searcy, J.C. Flow Duration Curves; United States Geological Survey Water Supply: Washington,
DC, USA, 1959.
Water 2015, 7 3165
49. Vogel, R.M.; Fennessey, N.M. Flow duration curves II: A review of applications in water
resources planning. J. Am. Water Resour. Assoc. 1995, 31, 1029–1039.
50. Yokoo Y.; Sivapalan M. Towards reconstructionof the flow duration curves Development of a
conceptual framework with a physical basis. Hydrol. Earth Syst. Sci. 2011, 15, 2805–2819.
51. Peters, N.E. Water-quality variations in a forested Piedmont catchment Georgia, USA. J. Hydrol.
1994, 156, 73–90.
52. Claps, P.; Fiorentino, M. Probabilistic flow duration curves for use in environmental planning and
management. In Integrated Approach to Environmental Data Management Systems; NATO-ASI
Series; Harmancioglu, N.B., Alpaslan, M.N., Ozkul, S.D., Singh, V.P., Eds.; Kluwer: Dordrecht,
The Netherlands, 1997; Volume 2, pp. 255–266.
53. Croker, K.M.; Young, M.D.Z.; Rees, H.G. Flow duration curve estimation in ephemeral
catchments in Portugal. Hydrol. Sci. J. 2003, 48, 427–439.
54. Fennessey, N.M.; Vogel, R.M. Regional flow-duration curves for ungauged sites in
Massachusetts. J. Water Resour. Plan Manag. 1990, 116, 531–549.
55. Franchini, M.; Suppo, M. Regional analysis of flow duration curves for a limestone region.
Water Resour. Manag. 1996, 10, 199–218.
56. LeBoutillier, D.V.; Waylen, P.R. Regional variations in flow-duration curves for rivers in British
Columbia, Canada. Phys. Geogr. 1993, 14, 359–378.
57. Mimikou, M.; Kaemaki, S. Regionalization of flow duration characteristics. J. Hydrol. 1985,
82, 77–91.
58. Quimpo, R.G.; Alejandrino, A.A.; McNally, T.A. Regionalised flow duration curves for
Philippines. J. Water Res. Plan. Manag. 1983, 109, 320–330
59. Singh, R.D.; Mishra, S.K.; Chowdhary, H. Regional flow-duration models for large number
of ungauged Himalayan catchments for planning microhydro projects. J. Hydrol. Eng. 2001,
6, 310–316.
© 2015 by the authors; licensee MDPI, Basel, Switzerland. This article is an open access article
distributed under the terms and conditions of the Creative Commons Attribution license
(http://creativecommons.org/licenses/by/4.0/).