Floods on Mars Released from Groundwater by Impactseismo.berkeley.edu/~manga/paper86.pdf · Floods...
21
Floods on Mars Released from Groundwater by Impact Chi-yuen Wang, Michael Manga and Alex Wong Department of Earth and Planetary Science University of California, Berkeley CA 94720 On earth, large earthquakes commonly cause saturated soils to liquefy and streamflow to increase. We suggest that meteoritic impacts on Mars may have repeatedly caused similar liquefaction to enable violent eruption of groundwater. The amount of erupted water may be comparable to that required to produce catastrophic floods and to form outflow channels. Key words: liquefaction, impacts, chaos
Transcript of Floods on Mars Released from Groundwater by Impactseismo.berkeley.edu/~manga/paper86.pdf · Floods...
Floods on Mars Released from Groundwater by Impact
Chi-yuen Wang, Michael Manga and Alex Wong
Department of Earth and Planetary Science
University of California, Berkeley CA 94720
On earth, large earthquakes commonly cause saturated soils to liquefy and
streamflow to increase. We suggest that meteoritic impacts on Mars may have repeatedly
caused similar liquefaction to enable violent eruption of groundwater. The amount of
erupted water may be comparable to that required to produce catastrophic floods and to
form outflow channels.
Key words: liquefaction, impacts, chaos
1. Introduction
Liquefaction frequently occurs on Earth during or immediately after large earthquakes,
when saturated soils lose their shear resistance, become fluid-like, and are ejected to the surface,
causing lateral spreading of ground and foundering of engineered foundations (e.g., Terzaghi et
al., 1996). During the 1964 Alaskan earthquake, for example, ejection of fluidized sediments
occurred at distances more than 400 km from the epicenter (Waller, 1968). Increased streamflow
is also commonly observed after earthquakes (Montgomery and Manga, 2003). Suggested causes
include coseismic liquefaction (Manga et al., 2003), coseismic strain (Muir-Wood and King,
1993), enhanced permeability (Rojstaczer et al., 1995) and rupturing of hydrothermal reservoirs
(Wang et al., 2004a).
Extensive laboratory and field studies (e.g., Terzaghi et al., 1996) show that saturated
soils liquefy during ground shaking as a result of pore-pressure buildup that in turn is due to the
compaction of soils in an undrained condition. Furthermore, laboratory experiments (Dobry,
1985; Vucetic, 1994) showed that the threshold of pore-pressure buildup is insensitive to the type
of soils (from clays to loose sand) and the environmental conditions. Thus we may reasonably
suggest that saturated soils on Mars, even though composed of pulverized basalt rather than
alluvial sand, may also experience undrained consolidation, pore-pressure buildup and
liquefaction when subjected to strong ground shaking.
Liquefaction caused by meteoritic impact is also preserved in the sedimentary record
(Underwood, 1976; Warme et al., 1998; Terry et al., 2001). Among the documented examples is a
field of circular plugs of sandstone near the Oasis impact crater in Libya, which "appear to be the
result of upward movement of fluidized sand" (Underwood, 1976). Strong evidences for
liquefaction (Terry et al., 2001) and related landslides (Bralower et al., 1998; Klaus et al., 2000)
were also found shallow submarine sediments in connection with the Chicxulub impact at the
Cretaceous-Tertiary boundary. Soil liquefaction during underground and surface explosions has
also been documented (e.g., Charlie et al., 1996). Could meteoritic impact on Mars also have
caused liquefaction and floods?
Heavy meteoritic bombardment on the early Mars formed a thick layer of dust, regolith
and ejecta. Assuming that abundant water was present on the early Mars, a saturated aquifer of
global extent may have been present beneath a few km of frozen ground (e.g., Carr, 1996;
Clifford and Parker, 2001). Stewart et al. (2003) showed that meteoritic impacts may cause
melting and vaporization of ice in the ground close to the crater. We suggest here that
liquefaction can release water at great distances from the impact site. Given that Mars' surface
heat flow in the late-Naochian to early Hesperian was ~5 times greater than its present value (e.g.,
Schubert et al., 1992), it is likely that the cryosphere was much thinner, and thus much weaker,
during that time (Clifford and Parker, 2003). Under these conditions, meteoritic impact may have
caused widespread liquefaction of the near-surface aquifers (Clifford, 1997).
Unfortunately, quantitative studies of impact-induced liquefaction are limited. Leyva and
Clifford (1993) calculated the pore-pressure change on Mars during an impact by assuming that
the change was caused by a single compressional wave. Field and laboratory studies show,
however, that pore-pressure change and liquefaction are more likely to be caused by many cycles
of shearing of saturated soils (e.g., Terzaghi et al., 1996). In view of the difficulties in making
theoretical predictions, we adopt an empirical approach.
2. Relationship between crater size and spatial extent of liquefaction
Because liquefaction is a major concern in earthquake-prone areas, numerous attempts
have been made to predict its occurrence. Field and laboratory studies show that liquefaction
depends on many factors, including earthquake magnitude, peak ground velocity, liquefaction
susceptibility of soils, basin structures, and depth to the groundwater table (e.g., Terzaghi et al.,
1996). Consequently, the occurrence of liquefaction is difficult to predict either physically or
numerically; and empirical approaches, as a rule, have been adopted. The most used methods in
engineering practice are the ground penetration tests for evaluating the liquefaction resistance of
soils. Because of the required time and costs, such tests are mostly limited to sites of engineering
importance.
In areas where such tests are absent, a simpler approach has been attempted (Kuribayashi
and Tatsuoka, 1975; Ambraseys, 1988; Galli, 2000). Field observations show that, for
earthquakes of a given magnitude M, the occurrence of liquefaction is mostly confined within a
particular distance from the epicenter, i.e., the liquefaction limit, Rmax, beyond which liquefaction
is not observed. The liquefaction sites at the farthest distance are those with optimal conditions
for liquefaction. Figure 1a shows the relationship between earthquake magnitude and the distance
between the hypocenters of earthquakes and sites of liquefaction. The compilation of
observations in Figure 1a is based on eartlier compilations (Kuribayashi and Tatsuoka, 1975;
Ambraseys, 1988; Galli, 2000) and updated with observations for 14 additional large earthquakes
up to December, 2003 (Table 1). Based on the observations in Figure 1a, we obtain the following
relation for the liquefaction limit:
M = - 5.0 + 2.26 log Rmax. (1)
where Rmax is in meters. This equation is well constrained by data at earthquake magnitudes
between 5.5 and 7.5 (Figure 1a), but becomes less constrained at M > 7.5 because too little data
are available at such magnitudes.
As noted in the introduction, increased streamflow also commonly occurs after
earthquakes. After the 2003 San Simeon, California, earthquake, streamflow even appeared in a
nearby dry valley where the groundwater table was several tens of meters below the surface
(Wang et al., 2004a). Figure 1b shows the distance to the earthquake epicenter from documented
postseismic streamflow increases against earthquake magnitude, based on an existing compilation
(Montgomery and Manga, 2003) updated with data up to December, 2003 (Wang et al., 2004b).
Also plotted is equation (1) for liquefaction, which appears to be a limiting bound for the post-
seismic streamflow increase too. This may not be surprising since the mechanisms that control
earthquake-induced liquefaction (e.g., Terzaghi et al., 1996) can also control earthquake-induced
streamflow (Manga et al., 2003). Hence, equation (1) will be used to estimate the maximum
epicentral distances to both liquefaction and increased streamflow.
For meteoritic impacts, there are too few documented examples of liquefaction to
determine the farthest distance to the liquefaction site or the occurrence of increased streamflow.
Thus an indirect approach is required. From cratering experiments and dimensional analysis, an
empirical π -scaling relation was derived by Melosh (1989), relating the diameter of the impact
crater, D, and the impact energy Wim (all parameters in SI units):
D = 1.8 22.013.022.03/111.0implanettp WLg −−ρρ (2)
where ρ and ρ are, respectively, densities of the projectile and target, gplanet is the surface
gravity of the planet, and L is the projectile diameter. Obviously, other combinations of
variables are possible, for example, Wim may be expressed in terms of the size, density and
velocity of the impactor. We prefer the combination of variables in equation (2) because the
impact energy may be related to seismic energy, as explained next, and the crater
diameter D is directly observable, while the alternative choice of the impactor size or
velocity as variables may not be helpful from an observation or application perspective.
In large impacts, most of the impact energy is spent in fracturing, ejecting, heating,
melting and vaporizing the projectile and the target, and only a small part of the impact energy is
converted to seismic waves (with energy Ws), with a conversion factor s =Ws/Wim known as the
seismic efficiency. Estimates of s range from 10-5 to 10-3, with the most commonly accepted value
being 10-4 (e.g., Schulz and Gault, 1975). Given Ws, we may estimate the seismic magnitude
produced by an impact by using the classical Gutenberg-Richter relation:
log Ws = 4.8 + 1.5 Mim. (3)
Impact-generated seismic events, however, contain significantly less shear energy than
earthquakes of the same magnitudes. A rule of thumb developed from cratering experiments is
that, to produce the same amount of shear energy, the seismic magnitude of an impact needs to be
one magnitude greater than that of an earthquake (Melosh, 1989). Replacing M in (1) by Mim+1,
Ws in (3) by s Wim, and combining (1) and (3), we obtain
Rmax = 3.0
imWcs
(4)
where c = 10-4.2. Furthermore, in applying this relation to different planets, we need to scale it
with respect to the surface gravity of the planets, because the occurrence of consolidation and
liquefaction requires relative motion among soil particles which is resisted by the friction
between soil particles, which in turn is, on the average, proportional to gravity. Since the stress
required to overcome friction is, to a first approximation, proportional to strain and hence to the
square root of strain energy that in turn is, again to a first approximation, proportional to the
inverse square of distance, the liquefaction limit on a planet may be scaled by a factor of
gearth/gplanet. Hence the maximum distance from impact on a planet to liquefaction and streamflow
increase (Rmax) is related to the crater diameter (D) by
Rmax = planet
earth
gg
3.0
22.01
13.022.03/111.08.1
−− Lg
Dcs
planettp ρρ. (5)
3. Discussion
Equation (5) predicts, for Earth (Figure 2a), Rmax = 200 + 100 km for the Oasis crater in
Lybia (D = 11.5 km; Underwood, 1976) and Rmax = 5,000 + 2000 km for the Chicxulub crater in
Mexico (D ~ 100 km; Melosh, 1989). To this group we add the Upheaval Dome crater (Alvarez
et al., 1998), with D = 4 km and Rmax = 60 + 30 km, even though the origin of this crater is
controversial. Figure 2a shows that the observations at all these sites are consistent with
predictions, although there is too little data to constrain Rmax as a function of D. Also plotted in
Figure 2a is the possible liquefaction-induced debris-flow deposit ~450 km south of the young
Lowell crater (D ~ 250 km) on Mars (Tanaka et al., 1998). This deposit, if correctly explained, is
also consistent with prediction.
Based on the liquefaction limit proposed for Mars (Figure 2a), we suggest that impacts
producing craters with diameters of 100 km or greater may have caused global occurrence of
liquefaction and streamflow. Assuming the timeline proposed by Frey (2004) for impact events
on early Mars, we estimate a total of ~380 impacts with crater diameter >200 km since Hellas
formed (4.02 Ga). Assuming further a -2 power law for crater size distribution (Hartmann and
Neukum, 2001), we infer a total of ~1,500 impacts with crater diameter >100 km and ~105
impacts with crater diameter >10 km since Hellas. The liquefaction effect due to each smaller
impact, however, decreases drastically according to equation (5). Using this relation and a -2
power law for crater size distribution, we compare the integrated maximum liquefaction area
caused by the numerous ‘mid-size” impacts (with crater diameters from 10 to 100 km) with that
caused by the fewer but larger impacts. We find the former is comparable to that caused by
impacts with crater diameters from 100 to 200 km, but is smaller by nearly an order of magnitude
than that caused by impacts with crater diameters from 100 to 1,000 km.
Soil engineers sometimes assert that the occurrence of liquefaction is limited within the
upper few tens of meters of Earth’s surface. This conclusion, however, may be a result of limited
information. Liquefaction structures ranging from a few hundred to several kilometers in depth
have been documented in exploration well logs (Deville et al., 2003), inferred from seismic
profiles (Van Rensbergen and Morley, 2003), and from geochemical studies of the extruded
liquefied sediments (Deyhle et al., 2003).
The amount of groundwater released from soils during liquefaction may be determined
from the change in soil volume (the volumetric strain) which is mostly related to the degree of
consolidation of the liquefied soils. Laboratory measurements (Silver and Seed, 1971; Yoshimi
and Kuwabara, 1973; Whitman et al., 1981) and field investigation of soil settlement (Lee and
Albaisa, 1974) showed that the amount of water released during liquefaction ranges from 3 – 5%
of the soil volume for loose sands and 0.2% or smaller for very dense sands. As an order-of-
magnitude estimate in the present study, we assume that the amount of groundwater released
from the Martian regolith during liquefaction is 1% of the regolith volume.
As noted earlier, the liquefaction sites at the farthest distance Rmax are those with optimal
conditions for liquefaction. Observations on Earth show that the actual occurrence of liquefaction
is rather spotty and would account only ~1% of the maximum possible area of π (Rmax)2. Thus the
volume of groundwater released during an impact event from an aquifer of thickness h would be
of the order of 10-4π (Rmax)2 h. The result for Mars (Figure 2b) shows that impacts that produced
craters of ~100 km in diameter may each have released groundwater with a volume of ~ 104 km3
from a 1-km thick global aquifer. Using equations (2) and (3) and assuming a seismic efficiency
of 10-4 we estimate that the equivalent seismic magnitude for impacts producing craters of ~100
km in diameter is ~10. Since this is beyond the range of magnitudes for which there is data for
liquefaction or streamflow (Figure 1), the application of equation (1) in estimating Rmax may be
subjected to substantial uncertainty and can only be taken as an order-of-magnitude estimate.
Nonetheless, we may reasonably suggest that even greater amounts of groundwater may have
been released during impacts that produced the largest basins on Mars (i.e., Hellas, Chryse,
Argyre, Isidis, Utopia, with D ~ 103 km).
Estimating the volume of floodwater required to form the outflow channels is difficult.
Assuming that the regolith in the outflow channels was removed by a single outburst flood, Carr
(1986) estimated a lower bound of ~7 x 10⁴ km3 for the Maja Valles and ~7 x 10⁵ km3 for the
Kasei Valles. However, the regolith in the outflow channels may have been removed by many
separate flood events, each with a much smaller volume of floodwater (e.g., Williams et al.,
2000). Thus the amount of groundwater released by impact may be sufficient to form the outflow
channels.
A thick cryosphere and hence cold climate on Mars are often thought to be required in the
Hesperian for the formation of outflow channels (e.g., Clifford and Parker, 2001). A thick
cryosphere allows the buildup of pore pressure in the underlying aquifer, thereby enabling violent
eruptions of groundwater and formation of large catastrophic floods. In the model presented here,
lithostatic pore pressures are created during each liquefaction event by undrained compaction of
soils induced by meteoritic impacts. Thus violent eruptions of groundwater and large catastrophic
floods in the Hesperian may occur without requiring a thick cryosphere or cold climate. In fact, a
thin, and thus a weak, cryosphere may be necessary for the model, since a thicker cryosphere may
make it more difficult for groundwater to breakout. Thus the model implies that large releases of
groundwater may have declined drastically near the end of the era of heavy bombardment –
consistent with the dramatic decline of erosion rates during that time (Baker and Patridge, 1986;
Craddock and Maxwell, 1993). The model is also consistent with the evidence for massive
subsurface flow of water (Carr and Malin, 2000) and localized water sources for the valley
networks (Gulick, 2001) because the eruption of pressurized groundwater will be focused in
newly formed or pre-existing fractures.
One particular surface manifestation of liquefaction on Mars may be the chaotic terrain
(Figure 3a) often found at the heads of outflow channels (Ori and Mosangini, 1998), which is
commonly attributed to the collapse of the surface when groundwater is evacuated (e.g., Carr,
1996). However, the checkerboard patterns of gaps between blocks of chaotic terrain (Figure 3a)
suggest some combinations of lateral spreading and collapse. Liquefaction on Earth (Figure 3b)
often leads to lateral spreading and collapse of the surface (e.g., Kayan et al., 2002), so chaotic
terrain on Mars may be a manifestation of the same effect, but on a much larger scale. Lateral
spreading creates tensile stresses in the overlying layers, causing rupture to allow groundwater
and liquefied sediments to erupt to the surface. The lower gravity on Mars implies lower
confining pressure at depths, which in turn implies a reduction in the required pore pressure for
rupturing the overlying layers. Water so expelled could then have deepened and widened the
fractures between the blocks and carved the outflow channels often associated with chaotic
terrains.
The average block size in Figure 3a is greater than that in Figure 3b by a factor of ~103.
Assuming that, at the onset of lateral spreading, the integrated tensile stress across an incipient
vertical fracture through the block is balanced by the integrated shear stress over the base of the
block, the ~103 difference between the average block sizes in the two cases implies a ~103
difference between the thicknesses of the frozen ground. The frozen ground in Figure 3b was 0.3
m thick (Kayan et al., 2002); this implies that the cryosphere in Figure 3a may have been ~300 m
thick when the chaotic terrain was formed.
The challenge for the future may be to find field evidence that either supports or refutes
the above predictions. Geologists gather evidence for paleo-liquefaction on Earth by examining
the detailed relations among sedimentary units exposed on cliffs or man-made trenches (e.g.,
Obermeier, 1996; Warme et al., 1998); thus the task for recognizing paleo-liquefaction on Earth
for a particular impact event is limited by the preservation of the sedimentary record. Since
erosion rates on Mars are presumably much lower and the crust has undergone far less tectonic
activity, the geologic records are likely to be much better preserved on Mars than on Earth. With
a long line of planned orbitor, rover and lander missions in the queue, it will be just a matter of
time before sufficient geologic evidence is accumulated to test the above hypothesis.
Acknowledgements. This work grew out of a graduate seminar on floods on Mars in the Spring
of 2004. We thank the participants of the seminar for discussions and comments, and Sarah
Stewart, James Richardson and Jay Melosh for reviewing the manuscript and offering
constructive comments that helped to improve the paper. Work is supported by US National
Science Foundation (EAR-0125548) and NASA Astrobiology Institute (NNA04CC02A).
References Alvarez, W., E. Staley, D. O'Connor, and M.A. Chan, 1998, Synsedimentary deformation in the
Jurassic of southeastern Utah - A case of impact shaking? Geology, 26, 579-582.
Ambraseys, N.N., 1988, Engineering seismology, Earthquake Eng. Structural Dynamics, 17, 1-
105.
Bralower, T.J., C.K. Paull and R.M. Leckie, 1998, The Cretaceous-Tertiary boundary cocktail:
Chicxulub impact triggers margin collapse and extensive sediment gravity flows,
Geology, 26, 331-334.
Carr, M.H., 1986, Mars - a water-rich planet, Icarus, 68, 187-216.
Carr, M.H., 1996, Water on Mars, Oxford University Press, New York, 229 pp.
Carr, M.H., and M.C. Malin, 2000, Meter-scale characteristics of Martian channels and valleys,
Icarus, 146, 366-386.
Charlie, W.A., G.E. Veyera, D.S. Durnford, D.O. Doehring, 1996, Porewater pressure increases
in soil and rock from underground chemical and nuclear explosions, Eng. Geol., 43, 225-
236.
Clifford, S.M., 1997, The origin of the martian intercrater plains: The role of liquefaction from
impact and tectonic-induced seismicity, Lunar Planet. Sci. Conf., 27, 241.
Clifford, S.M., and T.J. Parker, 2001, The evolution of the Martian hydrosphere: Implications for
the fate of a primordial ocean and the current state of the northern plains, Icarus, 154, 40-
79.
Deville, E., A. Battani, R. Griboulard, S. Guerlais, J.P. Herbin, J.P. Houzay, C. Muller, and A.
Prinzhofer, 2003, The origin and processes of mud volcanism: new insights from
Trinidad, in Subsurface Sediment Mobilization, eds.: P. Van Rensbergen, R.R. Hillis, A.J.
Maltman, and C.K. Morley, Geol. Soc. London Sp. Publ. 216, 475-490.
Deyhle, A., A.J. Kopf, and G. Aloisi, 2003, Boron and boron isotopes as tracers for diagenetic
reactions and depth of mobilization, using muds and authigenic carbonates from eastern
Mediterranean mud volcanoes, in Subsurface Sediment Mobilization, eds.: P. Van
Rensbergen, R.R. Hillis, A.J. Maltman, and C.K. Morley, Geol. Soc. London Sp. Publ.
216, 491-503.
Frey, H.V., 2004, A timescale for major events in early Mars crustal evolution, Lunar Planet. Sci.
Conf. XXXV Abstract, 1382.
Galli, P., 2000, New empirical relationships between magnitude and distance for liquefaction,
Tectonophysics, 324, 169-187.
Gulick, V.C., 2001, Origin of the valley networks on Mars: a hydrological perspective,
Geomorphology, 37, 241- 268.
Hartmann, W.K., and G. Neukum, 2001, Cratering chronology and the evolution of Mars, Space
Sc. Rev., 96, 165-194.
Kayen, R., E. Thompson, D. Minasian, B. Collins, E.R.S. Moss, N. Sitar, and G. Carver, 2002,
Geotechnical reconnaissance of the November 3, 2002 M7.9 Denali fault earthquake,
Earthquake Spectra, Special Volume on the M7.9 Denali Earthquake of 3 November
2002, 1-27.
Klaus, A. R.D. Norris, D. Kroon, and J. Smit, 2000, Impact-induced mass wasting at the K-T
boundary: Blake Nose, western North Atlantic, Geology, 28, 319-322.
Kuribayashi, E., and F. Tatsuoka, 1975, Brief review of liquefaction during earthquakes in Japan,
Soil and Foundations, 15, 81-92.
Leyva, I.A., and S.M. Clifford, 1993, The seismic response of an aquifer to the propagation of an
impact generated shock wave: A possible trigger of the martian outflow channels? Lunar
Planet. Sci., 24, 875-876.
Melosh, H.J., 1989, Impact Cratering - A Geologic Process, Oxford University Press, New York,
245 pp.
Lee, K.L., and A. Albaisa, 1974, Earthquake-induced settlement in saturated sands, J. Soil Mech.
Foundations Division, ASCE, 100, 387-406.
Manga, M., E.E. Brodsky, and M. Boone, 2003, Response of streamflow to multiple earthquakes
and implications for the origin of postseismic discharge changes, Geophys. Res. Lett., 30,
doi:10.1029/2002GL016618.
Montgomery, D.R., and M. Manga, 2003, Streamflow and water well responses to earthquakes,
Science, 300, 2047-2049.
Muir-Wood, R., and G.C.P. King, 1993, Hydrological signatures of earthquake strain: J.
Geophys. Res., 98, 22035-22068.
Ori, G.G., and C. Mosangini, 1998, Complex depositional systems in Hydrates Chaos, Mars: An
example of sedimentary process interactions in the Martian hydrological cycle, J.
Geophys. Res., 103, 22713-22723.
Rojstaczer, S., S. Wolf, and R. Michel, 1995, Permeability enhancement in the shallow crust as a
cause of earthquake-induced hydrological changes, Nature, 373, 237-239.
Schubert, G., S.C. Solomon, D.L. Turcotte, M.J. Drake, and N.H. Sleep, 1992, Origin and thermal
evolution of Mars, in H.H. Kieffer et al., eds., Mars, University of Arizona Press, Tucson,
147-183.
Schultz, P.H., and D.E. Gault, 1975, Seismic effects from major basin formation on the moon and
Mercury, The Moon, 12, 159-177.
Silver, M.L., and H.B. Seed, 1971, Volume changes in sands during cyclic load, J. Soil Mech.
Foundations Division, ASCE, 97, 1171-1182.
Stewart, S.T., T.J. Ahrens, and J.D. O'Keefe, 2003, Impact-induced melting of near-surface water
ice on Mars, in M.D. Furnish, ed., 13th APS Topical Confernce on Shock-Compression of
Condensed Matter, American Institute of Physics, College Park, MD.
Tanaka, K.L., J.M. Dohm, J.H. Lias, and T.M. Hare, 1998, Erosional valleys in the Thaumasia
region of Mars: Hydrothermal and seismic origins, J. Geophys. Res., 103, 31407-31419.
Terry, D.O., J.A. Chamberlain,P.W. Stoffer, P. Messina, and P.A. Jannett, 2001, Marine
Cretaceous-Tertiary boundary section in southwestern South Dakota, Geology, 29, 1055-
1058.
Terzaghi, K., R.B. Peck, and G. Mesri, 1996, Soil Mechanics in Engineering Practice, 3rd edn.,
John Wiley & Sons, New York, 549 pp.
Underwood, J.R., 1976, Impact structures of the Libyan Sahara: Some comparisons with Mars,
Geol. Romana, 15, 337-340.
Van Rensbergen, P., and C.K. Morley, 2003, Re-evaluation of mobile shale occurrences on
seismic sections of the Champion and Baram deltas, offshore Brunei, in Subsurface
Sediment Mobilization, eds.: P. Van Rensbergen, R.R. Hillis, A.J. Maltman, and C.K.
Morley, Geol. Soc. London Sp. Publ., 216, 395-409.
Waller, R.M., 1968, Water-sediment ejections, in The Great Alaska Earthquake of 1964,
Hydrology, National Academy of Science Pub. 1603, Washington, DC, 97-116.
Wang, C.Y., M. Manga, D. Dreger, A. Wong, 2004a, Streamflow increase due to rupturing of
hydrothermal reservoirs - Evidence from the 2003 San Simeon, California, earthquake,
Geophys. Res. Lett., 31, doi:10.1029/2004GL020124.
Wang, C.Y., C.H. Wang, and M. Manga, 2004b, Coseismic release of water from mountains:
Evidence from the 1999 (Mw = 7.5) Chi-Chi, Taiwan, earthquake, Geology, 32, 769-772.
Warme, J.E., and H.C. Kuehner, 1998, Anatomy of an anomaly: The Devonian catastrophic
Alamo impact breccia of southern Nevada, Intern. Geology Rev., 40, 189-216.
Whitman. R.V., P.C. Lambe, abd B.L. Kutter, 1981, Initial results from a stacked ring apparatus
for simulation of a soil profile, Proc. Int. Conf. Recent Advances Geothech Engin. Soil
Dynamics, 3, St. Louis, 1105-1110.
Williams, R.M., R.J. Phillips, and M.C. Malin, 2000, Flow rates and duration within Kasei
Valles, Mars: Implications for the formation of a martian ocean, Geophys. Res. Lett., 27,
1073-1076.

Yoshimi, Y., and F. Kuwabara, 1973, Effect of subsurface liquefaction on the strength of surface
soil, Soils and Foundations, 13, 67-81.
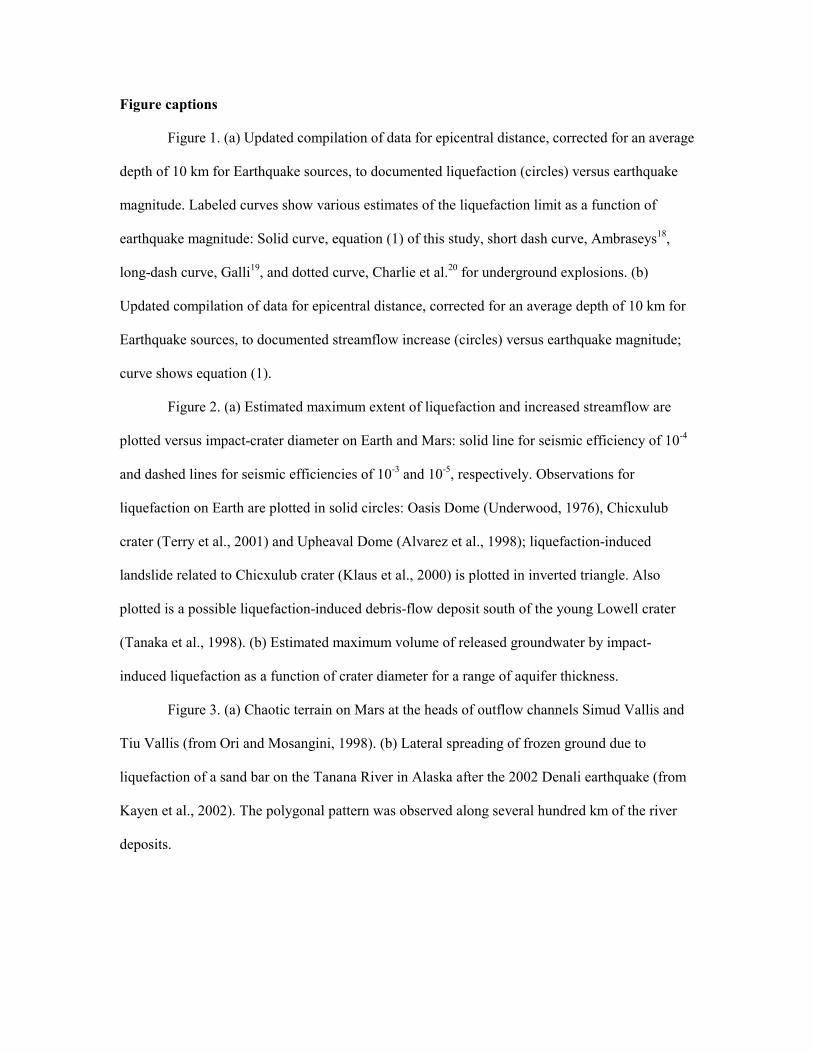
Figure captions
Figure 1. (a) Updated compilation of data for epicentral distance, corrected for an average
depth of 10 km for Earthquake sources, to documented liquefaction (circles) versus earthquake
magnitude. Labeled curves show various estimates of the liquefaction limit as a function of
earthquake magnitude: Solid curve, equation (1) of this study, short dash curve, Ambraseys18,
long-dash curve, Galli19, and dotted curve, Charlie et al.20 for underground explosions. (b)
Updated compilation of data for epicentral distance, corrected for an average depth of 10 km for
Earthquake sources, to documented streamflow increase (circles) versus earthquake magnitude;
curve shows equation (1).
Figure 2. (a) Estimated maximum extent of liquefaction and increased streamflow are
plotted versus impact-crater diameter on Earth and Mars: solid line for seismic efficiency of 10-4
and dashed lines for seismic efficiencies of 10-3 and 10-5, respectively. Observations for
liquefaction on Earth are plotted in solid circles: Oasis Dome (Underwood, 1976), Chicxulub
crater (Terry et al., 2001) and Upheaval Dome (Alvarez et al., 1998); liquefaction-induced
landslide related to Chicxulub crater (Klaus et al., 2000) is plotted in inverted triangle. Also
plotted is a possible liquefaction-induced debris-flow deposit south of the young Lowell crater
(Tanaka et al., 1998). (b) Estimated maximum volume of released groundwater by impact-
induced liquefaction as a function of crater diameter for a range of aquifer thickness.
Figure 3. (a) Chaotic terrain on Mars at the heads of outflow channels Simud Vallis and
Tiu Vallis (from Ori and Mosangini, 1998). (b) Lateral spreading of frozen ground due to
liquefaction of a sand bar on the Tanana River in Alaska after the 2002 Denali earthquake (from
Kayen et al., 2002). The polygonal pattern was observed along several hundred km of the river
deposits.

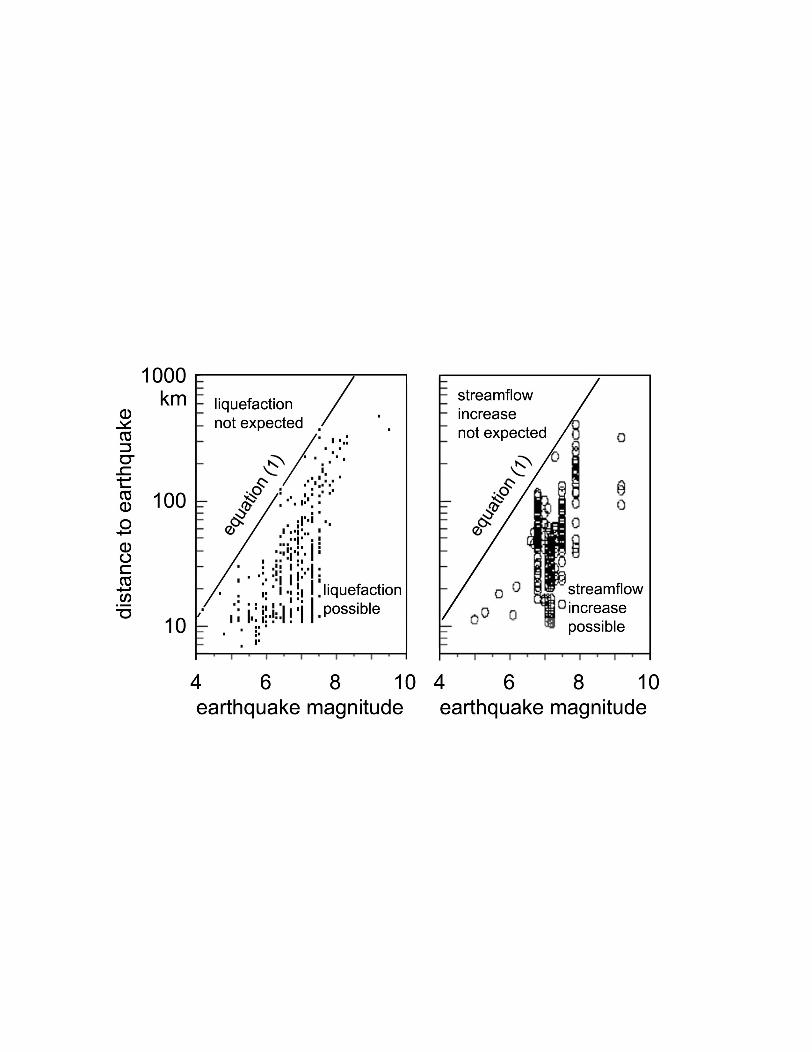
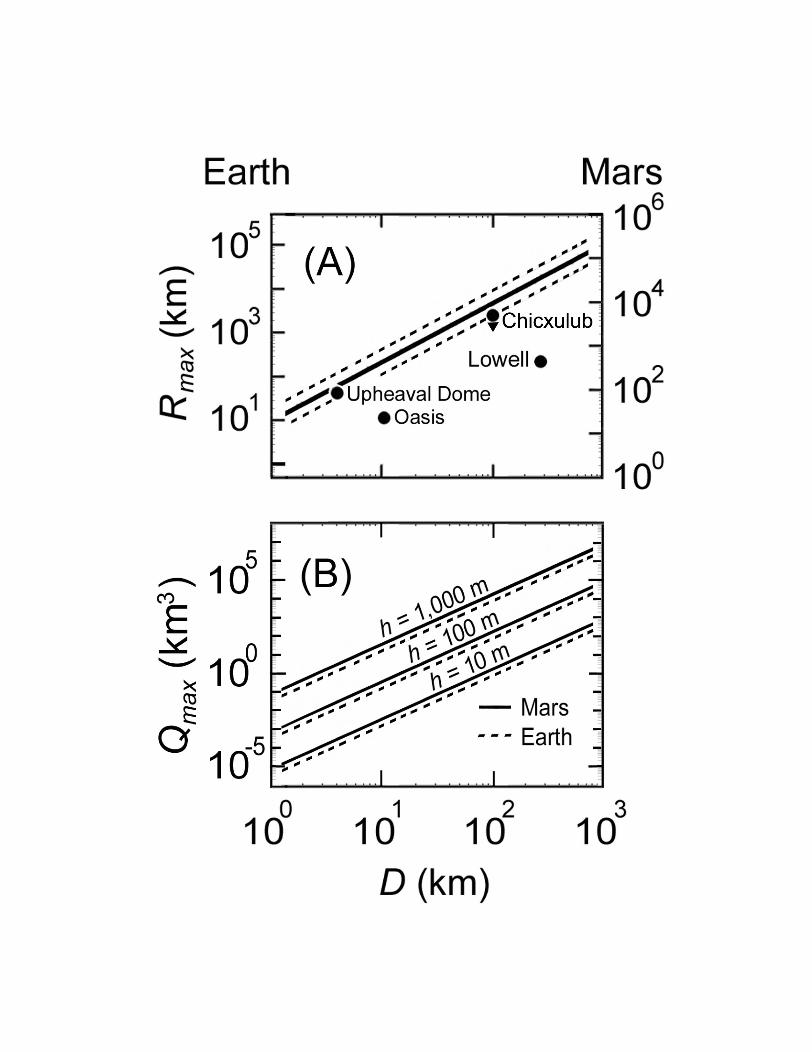
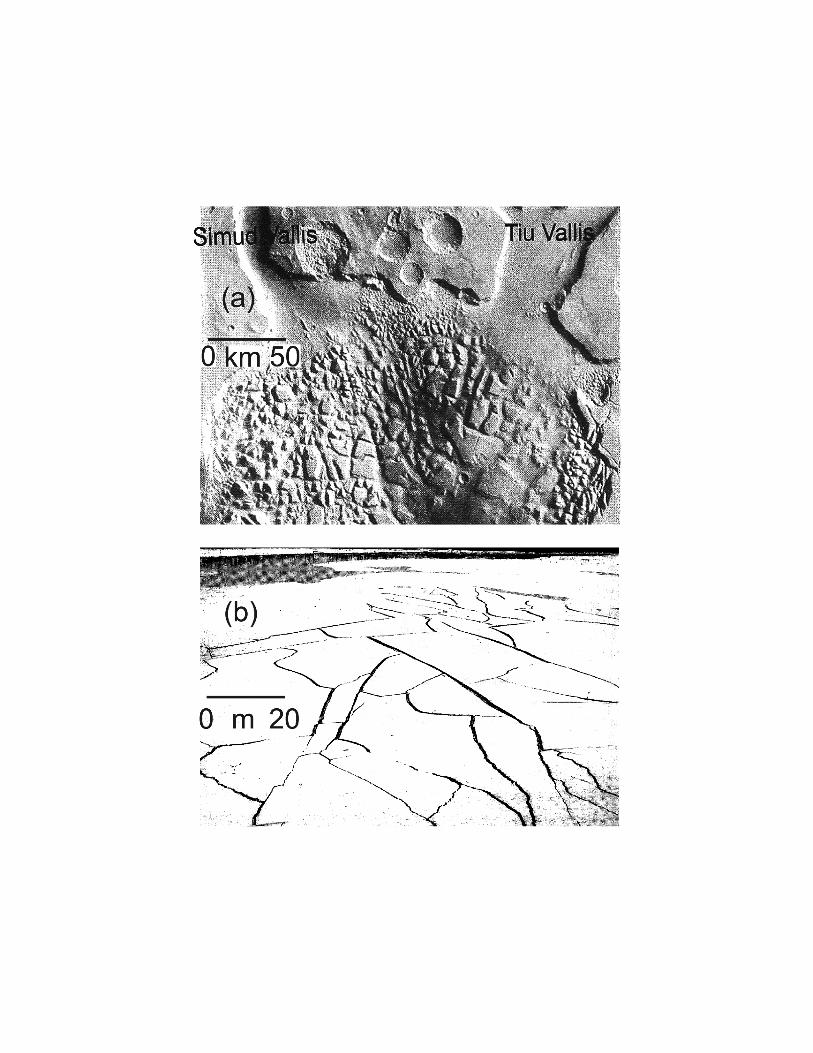
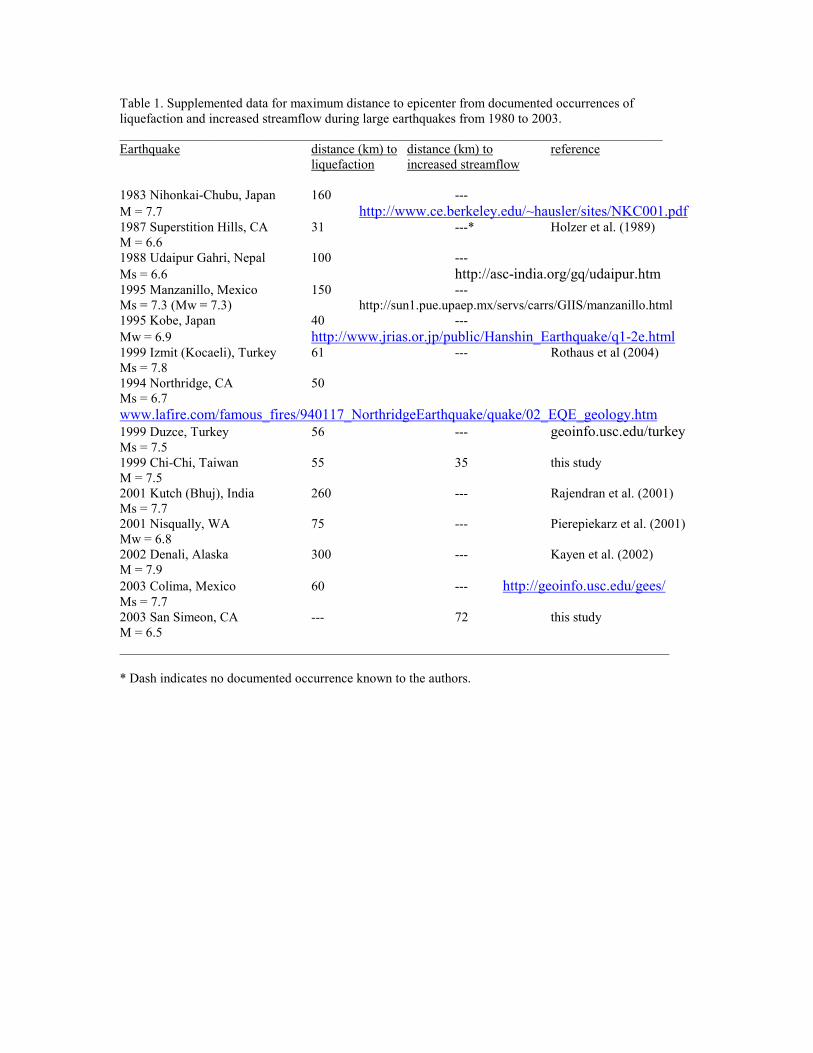
Table 1. Supplemented data for maximum distance to epicenter from documented occurrences of liquefaction and increased streamflow during large earthquakes from 1980 to 2003. _________________________________________________________________________________ Earthquake distance (km) to distance (km) to reference
liquefaction increased streamflow 1983 Nihonkai-Chubu, Japan 160 --- M = 7.7 http://www.ce.berkeley.edu/~hausler/sites/NKC001.pdf 1987 Superstition Hills, CA 31 ---* Holzer et al. (1989) M = 6.6 1988 Udaipur Gahri, Nepal 100 --- Ms = 6.6 http://asc-india.org/gq/udaipur.htm 1995 Manzanillo, Mexico 150 --- Ms = 7.3 (Mw = 7.3) http://sun1.pue.upaep.mx/servs/carrs/GIIS/manzanillo.html 1995 Kobe, Japan 40 --- Mw = 6.9 http://www.jrias.or.jp/public/Hanshin_Earthquake/q1-2e.html 1999 Izmit (Kocaeli), Turkey 61 --- Rothaus et al (2004) Ms = 7.8 1994 Northridge, CA 50 Ms = 6.7 www.lafire.com/famous_fires/940117_NorthridgeEarthquake/quake/02_EQE_geology.htm 1999 Duzce, Turkey 56 --- geoinfo.usc.edu/turkey Ms = 7.5 1999 Chi-Chi, Taiwan 55 35 this study M = 7.5 2001 Kutch (Bhuj), India 260 --- Rajendran et al. (2001) Ms = 7.7 2001 Nisqually, WA 75 --- Pierepiekarz et al. (2001) Mw = 6.8 2002 Denali, Alaska 300 --- Kayen et al. (2002) M = 7.9 2003 Colima, Mexico 60 --- http://geoinfo.usc.edu/gees/ Ms = 7.7 2003 San Simeon, CA --- 72 this study M = 6.5 __________________________________________________________________________________ * Dash indicates no documented occurrence known to the authors.