Flood hazard zonation of Bhima river basin (Haveli,Shirur ... hazard zonation of Bhima river basin...
10
INTERNATIONAL JOURNAL OF ENVIRONMENTAL SCIENCES Volume 5, No 6, 2015 © Copyright by the authors - Licensee IPA- Under Creative Commons license 3.0 Research article ISSN 0976 – 4402 Received on January 2015 Published on July 2015 169 Flood hazard zonation of Bhima river basin (Haveli,Shirur,Khed and Daund taluka),Pune, India using Remote Sensing and GIS techniques Ashwajit A. B 1 , Sivakumar V 2 , Chincholkar S1, Thakare A 1 , Ingole A 1 1- Department of Civil Engineering, College of Engineering, Pune-411 005, India. 2- Spatial Sciences and Disaster Management Group, Centre for Development of Advanced Computing (C-DAC), Pune- 411007. [email protected] doi:10.6088/ijes.6019 ABSTRACT Flood is an inevitable natural phenomenon occurring from time to time in all rivers and natural drainage systems, which not only damages the lives, natural resources and environment, but also causes the loss of economy and health. An attempt has been made in the project to prepare Flood Hazard Risk Zone maps of Bhima river basin (Part of Haveli,Shirur,Khed and Daund taluka) based on multi criteria assessment using remote sensing and Geographic Information System (GIS) techniques. Parameter considered for the flood are rainfall distribution, drainage density, land use/land cover, soil type, size of micro watershed, slope, and roads per micro watershed to prepare Flood hazard risk zone map. A final Flood Hazard Risk Zone map has been prepared showing three categories High, Moderate and Low Risk Zone. This identifies flood prone areas and will help in proper river management and appropriate planning of development works. Keywords: Hazard risk zone map, multi criteria assessment, GIS, remote sensing, Bhima river basin. 1. Introduction Flood is most common natural disasters in India. When rivers overflow their banks they cause damage to lives, property, infrastructure and crops. Floods usually are local, short-lived events that can happen suddenly and sometimes with little or no warning. They usually are caused by intense storms that produce more runoff than an area can store or a stream can carry within its normal channel. Rivers can also flood its surroundings when the dams fail, when ice or a landslide temporarily block the course of the river channel. Flood is the penalty human beings have to pay when they interfere in the rivers right of way. While flood research and flood protection policy has ever since been dominated by a technical world view, the social and socio-economic aspects gained in importance in recent decades due to expansive and intensified land use, rising damage potentials in floodplain areas and, thus, increasing conflicts between socio-economic land use and flood protection policy (Schanze, 2002). Flooding in general and urban flooding in particular is not an unknown event in world and in India .The uneven distribution of rain fall coupled with Mindless urbanisation, encroaching upon and filling up natural drainage channels and urban lakes to use the high-value urban land for buildings are the cause of urban flooding. The flood hazard zonation for the study area identifies flood prone areas that will help in proper river management and appropriate planning of development works.
Transcript of Flood hazard zonation of Bhima river basin (Haveli,Shirur ... hazard zonation of Bhima river basin...

INTERNATIONAL JOURNAL OF ENVIRONMENTAL SCIENCES Volume 5, No 6, 2015
© Copyright by the authors - Licensee IPA- Under Creative Commons license 3.0
Research article ISSN 0976 – 4402
Received on January 2015 Published on July 2015 169
Flood hazard zonation of Bhima river basin (Haveli,Shirur,Khed and
Daund taluka),Pune, India using Remote Sensing and GIS techniques Ashwajit A. B1, Sivakumar V2, Chincholkar S1, Thakare A1, Ingole A1
1- Department of Civil Engineering, College of Engineering, Pune-411 005, India.
2- Spatial Sciences and Disaster Management Group, Centre for Development of Advanced
Computing (C-DAC), Pune- 411007.
doi:10.6088/ijes.6019
ABSTRACT
Flood is an inevitable natural phenomenon occurring from time to time in all rivers and
natural drainage systems, which not only damages the lives, natural resources and
environment, but also causes the loss of economy and health. An attempt has been made in
the project to prepare Flood Hazard Risk Zone maps of Bhima river basin (Part of
Haveli,Shirur,Khed and Daund taluka) based on multi criteria assessment using remote
sensing and Geographic Information System (GIS) techniques. Parameter considered for the
flood are rainfall distribution, drainage density, land use/land cover, soil type, size of micro
watershed, slope, and roads per micro watershed to prepare Flood hazard risk zone map. A
final Flood Hazard Risk Zone map has been prepared showing three categories High,
Moderate and Low Risk Zone. This identifies flood prone areas and will help in proper river
management and appropriate planning of development works.
Keywords: Hazard risk zone map, multi criteria assessment, GIS, remote sensing, Bhima
river basin.
1. Introduction
Flood is most common natural disasters in India. When rivers overflow their banks they
cause damage to lives, property, infrastructure and crops. Floods usually are local, short-lived
events that can happen suddenly and sometimes with little or no warning. They usually are
caused by intense storms that produce more runoff than an area can store or a stream can
carry within its normal channel. Rivers can also flood its surroundings when the dams fail,
when ice or a landslide temporarily block the course of the river channel. Flood is the penalty
human beings have to pay when they interfere in the rivers right of way.
While flood research and flood protection policy has ever since been dominated by a
technical world view, the social and socio-economic aspects gained in importance in recent
decades due to expansive and intensified land use, rising damage potentials in floodplain
areas and, thus, increasing conflicts between socio-economic land use and flood protection
policy (Schanze, 2002). Flooding in general and urban flooding in particular is not an
unknown event in world and in India .The uneven distribution of rain fall coupled with
Mindless urbanisation, encroaching upon and filling up natural drainage channels and urban
lakes to use the high-value urban land for buildings are the cause of urban flooding. The
flood hazard zonation for the study area identifies flood prone areas that will help in proper
river management and appropriate planning of development works.

Flood hazard zonation of Bhima river basin (Haveli,Shirur,Khed and Daund taluka),Pune, India using Remote
Sensing and GIS techniques
Ashwajit A. B et al.,
International Journal of Environmental Sciences Volume 5 No.6 2015 170
2. Literature review
Pramojanee, et al., (2012) have carried out a study for the flood hazard and risk areas
mapping for the Nakhon Si Thammarat province is situated on the east coast of Peninsular
Thailand. This paper discusses only the procedures that were applied for mapping flood
hazard and risk areas in the provinces. The study includes the analysis and compilation of the
flood hazard map and the flood risk map probability rating of flooding in each hazard zone
in every watershed was done by considering certain causative factors such as size of
watershed, annual rainfall sum, degree of both side slopes of the watershed, gradient of main
river and stream of the watershed, drainage density of watershed, type of soil in watershed,
land use type of watershed and, communication lines and other infrastructure that influences
drainage of the watershed. The significance was indicated by weighting and causative factors
and based this final maps were prepared.
Ajin, et al., (2011) has carried out a study to prepare Flood hazard risk zone maps of
Vamanapuram River basin based on multi criteria assessment using remote sensing and GIS
tools. The factors such as rainfall distribution, drainage density, land use, soil type, size of
micro watershed, slope, and roads per micro watershed are studied to prepare Flood hazard
risk zone map.
Muhammad and Saanyol, (2013) have carried out a study for the Flood vulnerability mapping
in the river Kaduna which is a tributary of river Niger in Nigeria. Using High resolution
imagery, a Digital Elevation Model was developed with ArcGIS to identify flood prone areas
along the Middle Course of the river. A flow accumulation model was created using the DEM
and the DEM was reclassified into high risk, moderate risk and low risk zones using equal
interval of separation based on elevation. This was overlaid on the map of the area to produce
a vulnerability map of the area. The study also conducted interviews with a sample of
residents of certain areas that are at risk from flooding to identify elements-at risk of flood.
Natural barriers exist between the river and the surrounding area, however urban explosion
within the past decade and relocation after the Kaduna violence in 2000 have led to
settlement within flood prone areas and finally they have discovered that a flood map can be
used effectively in public enlightenment, disaster response planning and flood risk
management.
Aditi, et al., (2011) have carried out a study Flood Hazard Mapping for the Dikrong river
basin of Arunachal Pradesh India. In this paper flood inundated areas were mapped using GIS
for the Dikrong river basin corresponding to different return periods (2, 5, 25, 50, and 100
years). In this paper at First the digital elevation model (DEM) of the entire basin and the
water source grid were loaded into ArcGIS 9.3. Then a cost grid map was created for a
particular return period and grid map and flood hazard map is created. The flood hazard maps
were digitized to determine the inundation area and the developed inundation maps
corresponding to 25, 50, and 100 year return period floods were compared to corresponding
maps developed by conventional methods as reported in the Brahmaputra Board Master Plan
for Dikrong basin. They have found that, the average deviation of modeled flood inundation
areas from reported map inundation areas is below 5%. Hence, GIS techniques were proved
to be successful in extracting the flood inundation extent of Dikrong basin in a time and cost
effective manner.
Thilagavathi, et al., (2011) has carried out a study to demarcate the flood hazard prone areas
in the papanasam taluk, northern part of Thanjavur District in Tamilnadu. In this paper the
toposheets in a scale of 1:50,000 and 58 N/1, N/2, N/6, N/5, M/8, and satellite image that

Flood hazard zonation of Bhima river basin (Haveli,Shirur,Khed and Daund taluka),Pune, India using Remote
Sensing and GIS techniques
Ashwajit A. B et al.,
International Journal of Environmental Sciences Volume 5 No.6 2015 171
cover the study area was collected. The base map of village boundary showing all the
prominent geographic features of the basin was prepared by integrating toposheets and
satellite image. Field visits to different parts of the basin made to observe the landforms.
Based on the observations made from the field base map was prepared. The amount of
rainfall in the study area for various seasons like pre-monsoon, monsoon and post-monsoon
were collected from the metrological department and an annual average for each season were
arrived at. Contour map already prepared through GIS with the field data by GPS. The
parameters like Soil, Cropping pattern, Topogaphy and Drainage have been observed and
finally Causes of floods in study area are found out. Major problems like Rainfall, Huts
Damages, and Agriculture Loss are studied.
3. Study area
The study area lies between latitude 180 35’0’’ to 180 45’00’’ N and longitude 740 00’ 00’’ to
740 15’00’’ E in middle upper Bhima watershed basin in khed, Haveli, Shirur and Daund
taluka, of Pune district in Maharashtra which covering an area of approximately 300 km2 and
perimeter 108 km. The study area is covered in one SOI 1:50000 scale toposheet. As shown
in Figure1, the area was selected according to the watershed on both the sides of the river
covering parts of Shirur Taluka on upper side and part of Haveli Taluka and small part of
Khed and daund Taluka on top and bottom side respectively.
Figure 1: Map showing the study area
3.1 Material and methods
For the present studies the various maps were formed using ArcGIS and ERDAS imagine
software. The study area delineated from survey of India Toposheet of scale 1:50000
numbered E43 I2. The Base map, micro-watershed, water bodies, Roads, drainage were
digitized from SOI toposheet. The rainfall distribution map was prepared from Indian
Metrological Department (IMD) data. The soil map was prepared by digitizing geographic
profile of Pune division by Dr. D.V. phokharkar-2012. The land use/land cover map was
extracted from LANDSAT ETM+ satellite image and the data was classified using ERDAS

Flood hazard zonation of Bhima river basin (Haveli,Shirur,Khed and Daund taluka),Pune, India using Remote
Sensing and GIS techniques
Ashwajit A. B et al.,
International Journal of Environmental Sciences Volume 5 No.6 2015 172
Imagine 9.1 software. The slope map was prepared from ASTER DEM obtained from
eartexplolar.usgs.gov. The google earth was used to modify road network.
For the present study Multi criteria evaluation method were used. A personal geodatabase
was created in Arc Catalog and dataset was created for the Study area with the spatial
reference of GCS_WGS_1984. Important features like streams, roads, water bodies, soil and
micro watershed were digitized using ArcGIS tools. The thematic maps of rainfall
distribution, slope, micro watershed size, drainage density, soil type, land use/land cover and
roads per micro watershed were prepared using ArcGIS software and assigned weightage for
each class. After assigning weightage all the thematic maps were integrated in ARCGIS
Weighted Overlay Spatial Analysis tools and percentage was given for each factor on the
basis of its estimated importance in causing flooding. Finally, integrated Flood Hazard Risk
Zone map was prepared.
4. Results and discussions
4.1 Land use land cover
Land use land cover is most important factor that causes the flood hazard. The increase of
human population and standards of living require more harvest and production from the earth
resources, especially the land resources. The destruction of this steady state causes many
problems such as soil erosion and increase of the surface run off decreases the soil moisture
withholding capacity, resulting in more surfaces run off and hence more sudden heavy floods.
For Agricultural land the presence of thick vegetation cover slows the journey of water from
sky to soil and reduces amount of runoff. The vegetation cover of soils, weather it is
permanent grassland or the cover of other crops, has a contact on the capacity of the soil to
act as a water store. Barren land consists of soil in which plants cannot grow results in
increasing runoff on the other side fallow land causes destruction to free flow of runoff. The
land use /land cover classes of study area were prepared from LANDSAT 7 (ETM+) data. A
supervised classification method was adopted using ERDAS Imagine 9.1 software and later
analyzed using ArcGIS spatial analyst tools. The land use/land cover map is as shown in
Figure2, the land use classes are agricultural land, fallow land, barren land, settlement, and
water bodies.
Figure 2: Map showing the landuse landcover

Flood hazard zonation of Bhima river basin (Haveli,Shirur,Khed and Daund taluka),Pune, India using Remote
Sensing and GIS techniques
Ashwajit A. B et al.,
International Journal of Environmental Sciences Volume 5 No.6 2015 173
4.2 Soil type
For flood hazard zonation soil type is a most important factor as the amount of water flow
through soil is depends on infiltration capacity and the remaining results in to the surface
runoff. Therefore for study soil present in the watershed classified on the basis of its
infiltration capacity. The soil map available from geographic profile of Pune division was
digitized in ArcGIS and the soil map of study area was extracted from it. It is shown from
Figure3, that the majority of the study area is consists of Coarse shallow soil and some part
Medium black soil. Out of which the formal having high infiltration capacity than later. The
chances of flood increase with decrease in infiltration capacity.
Figure 3: Map showing soil type
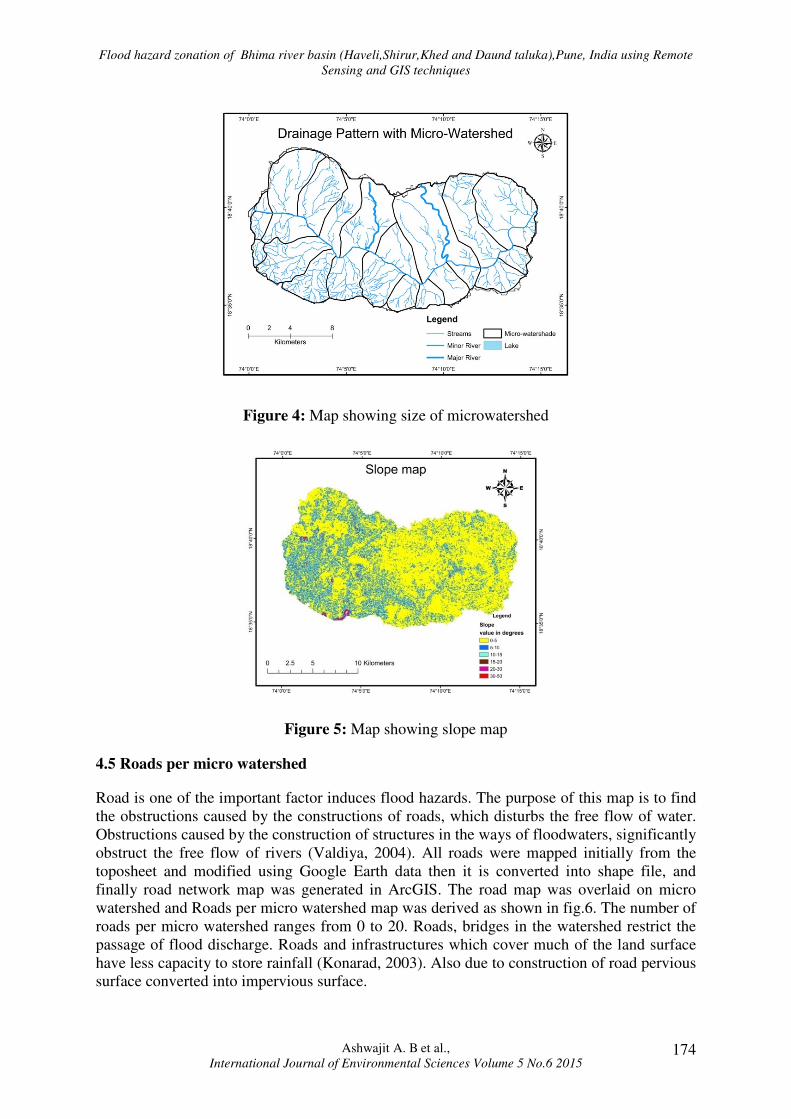
4.3 Size of Micro-watershed
Size of micro watershed have greater effect on flood if the area is larger it requires runoff of
longer duration for major increase in water level to cause flood. Therefore chances of flood
decreases with increase in size of micro-watershed and vice-versa. Micro-watersheds were
trace from the toposheet on water divide basis. These were digitized and the size of each
watershed was computed. The size of micro watershed ranges from 2 sq.km-38 sq.km. The
micro-watershed size map is as shown in Figure 4.
4.4 Slope map
The nature of the landscape around a river will control how quickly rainwater reaches the
river. Slope influences direction and amount of surface runoff reaching the site. A river
channel surrounded by steep slope causes’ fast surface runoff. Therefore the slope map of the
study area is most important for flood hazard zonation. ASTER DEM 30 meter spatial
resolution data was downloaded from eartexplolar.usgs.gov. The slope map in degree was
prepared using ArcGIS software. As shown in Figure5, slope angles for study area ranges
from 0-48 degrees. Steeper slopes are more susceptible to surface runoff on other hand flat
terrain susceptible to water logging.
Flood hazard zonation of Bhima river basin (Haveli,Shirur,Khed and Daund taluka),Pune, India using Remote
Sensing and GIS techniques
Ashwajit A. B et al.,
International Journal of Environmental Sciences Volume 5 No.6 2015 174
Figure 4: Map showing size of microwatershed
Figure 5: Map showing slope map
4.5 Roads per micro watershed
Road is one of the important factor induces flood hazards. The purpose of this map is to find
the obstructions caused by the constructions of roads, which disturbs the free flow of water.
Obstructions caused by the construction of structures in the ways of floodwaters, significantly
obstruct the free flow of rivers (Valdiya, 2004). All roads were mapped initially from the
toposheet and modified using Google Earth data then it is converted into shape file, and
finally road network map was generated in ArcGIS. The road map was overlaid on micro
watershed and Roads per micro watershed map was derived as shown in fig.6. The number of
roads per micro watershed ranges from 0 to 20. Roads, bridges in the watershed restrict the
passage of flood discharge. Roads and infrastructures which cover much of the land surface
have less capacity to store rainfall (Konarad, 2003). Also due to construction of road pervious
surface converted into impervious surface.

Flood hazard zonation of Bhima river basin (Haveli,Shirur,Khed and Daund taluka),Pune, India using Remote
Sensing and GIS techniques
Ashwajit A. B et al.,
International Journal of Environmental Sciences Volume 5 No.6 2015 175
Figure 6: Map showing road per micro watershed
4.6 Rainfall distribution
Rainfall distribution is important factor for flood hazard zonation. High intensity rainfall is
results into heavy floods. As rainfall volume increases it leads to increase in surface runoff
volume. Floods occur when the volume of water exceeds the ability of a stream and river to
hold the water within its normal banks. Any stream, creek, lake or river can flood. There is
no rain gauge station present in the study area, therefore, we collected nearby raingauge
station surrounding the study area i.e. Shirur, Haveli, Daund and Khed. The rainfall data of
these stations were collected from IMD and the rainfall map was prepared using Inverse
Distance Weighted method using ArcGIS spatial analyst tool. After preparing (interpolating)
rainfall distribution map of this region, we clipped for this study area and classified in to five
classes. The rainfall distribution map is as shown in Figure7.
Figure 7: Map showing the rainfall distribution

Flood hazard zonation of Bhima river basin (Haveli,Shirur,Khed and Daund taluka),Pune, India using Remote
Sensing and GIS techniques
Ashwajit A. B et al.,
International Journal of Environmental Sciences Volume 5 No.6 2015 176
4.7 Drainage density
Drainage density is total length of all streams in the watershed divided by total area of
watershed. It is a measure of how the watershed is drained by streams. Drainage density
indicates well drainage and poor drainage conditions. A high drainage density value is
favorable for runoff and hence indicates low chances of flood and vice-versa. Drainage
density map is derived from the drainage map, Drainage map is overlaid on Watershed map
to find out the ratio of total length of watershed to total area of watershed and it is categorized.
The overall drainage density of area is 1.71/km. Fig.8 shows drainage density map.
Figure 8: Map showing drainage density. High -1.14 to 1.71, Moderate- 0.57 to 1.14, Low -0
to 0.57
4.8 Flood hazard risk zone map
After preparing all the maps weightage were assigning in each map and weighted map were
prepared for each factor considered. Then the net probability of occurrence of flooding in
each flood hazard zone was estimated from the total sum of weight of each contributing
factor. To obtain this all the weighted maps were overlaid. GIS allows the decision maker to
make out a list meeting a predefined set of criteria with the overlay process (Heywood, et al.,
1993). The processes, like compilation of contributing factor maps, the overlaying of all maps
and the calculation of hazard areas were obtained by using Raster Calculator in ArcGIS
Spatial Analyst tool. The factors which contribute to the floods are given in the Table.1. The
flood hazard map was prepared by giving suitable percentage to these contributing factors
and the prepared map is shown in Figure 9.
Table1: Showing the contributing factors to flood
Sr.No Contributing Factor Percentage
1 Land use land cover 20%
2 Soil type 10%
3 Size of micro-watershed 20%
4 Slope 15%
5 Roads per micro watershed 5%
6 Rainfall Distribution 20%
7 Drainage density 10%

Flood hazard zonation of Bhima river basin (Haveli,Shirur,Khed and Daund taluka),Pune, India using Remote
Sensing and GIS techniques
Ashwajit A. B et al.,
International Journal of Environmental Sciences Volume 5 No.6 2015 177
Figure 9: Map showing flood hazard risk zone
5. Conclusion
The study was carried out with the aim of creating an flood susceptibility map along the
course of Bhima river basin region (Haveli,Shirur, Daund and Khed taluka). GIS is used for
creating flood hazard map from the available data base. The primary purpose of producing
these kinds of maps is for public dissemination of flood map which will serve to increase
public awareness. This will empower individuals and officials to take suitable preliminary
and response measures, which will help them for taking decision. Further scope of the study
would be validating prepared thematic maps and accuracy assessment; however, this study
would encourage carrying out further analysis. This result would helpful to understand the
overall flood scenario of the area.
Acknowledgement
Authors from College of Engineering, Pune wish to express their gratitude to Dr. A.
Sahasrabudhe, Principal; Prof. S. Bhosale, HOD and Department of Civil Engineering, COEP
for providing necessary facilities, encouragement and support.
6. References
1. Ajin, R. S., Krishnamurthy, R. R., Jayaprakash, M. and Vinod, P. G., (2013), Flood
hazard assessment of Vamanapuram River Basin, Kerala, India: An approach using
Remote Sensing and GIS techniques, Advances in Applied Science Research, 4(3), pp
263-274.

Flood hazard zonation of Bhima river basin (Haveli,Shirur,Khed and Daund taluka),Pune, India using Remote
Sensing and GIS techniques
Ashwajit A. B et al.,
International Journal of Environmental Sciences Volume 5 No.6 2015 178
2. Aditi Bhadra, Sutapa Choudhury, and Daita Kar, (2011), Flood Hazard Mapping in
Dikrong Basin of Arunachal Pradesh (India), World Academy of Science,
Engineering and Technology, 5, pp 12-22.
3. Heywood, I., Oliver, J. and Tomlinson, S., (1993), International Journal of
Geographical Information Science, 7 (4), pp 315-329.
4. Konrad. C.P.( 2003), Effects of Urban Development on Flood, U.S. Department of the
Interior, U.S. Geological Survey, USGS Fact Sheet FS-076-03.
5. Muhammad Ismail and Iyortim Opeluwa Saanyol, (2013), Application of Remote
Sensing (RS) and Geographic Information Systems (GIS) in flood vulnerability
mapping: Case study of River Kaduna, International Journal of Geomatics and
Geosciences, 3, pp 3.
6. Pramojanee, P., Tanavud, C., Yongchalermchai, C., Navanugraha, C., (1997), An
application of GIS for mapping of flood hazard and risk area in Nakorn Sri
Thammarat province, south of Thailand, Report by Walailak University, Department
of land development.
7. Schanze, (2002), Flood risk management: A basic framework, (67), pp 1-20.
8. Thilagavathi, G., Tamilenthi, S., Ramu, C. and Baskaran, R., (2011), Application of
GIS in flood hazard zonation studies in papanasam taluk, thanjavur district,
tamilnadu, Advances in Applied Science Research, 2 (3), pp 574-585.
9. Valdiya, K.S., (2004), Lessening the ravages of floods. In book: Geology,
Environment and Society, (University Press, India,), pp 112-115.