Fixed vs. Random Effects
13
Fixed vs. Random Effects Fixed effect – we are interested in the effects of the treatments (or blocks) per se – if the experiment were repeated, the levels would be the same – conclusions apply to the treatment (or block) levels that were tested – treatment (or block) effects sum to zero Random effect – represents a sample from a larger reference population – the specific levels used are not of particular interest – conclusions apply to the reference population • inference space may be broad (all possible random effects) or narrow (just the random effects in the experiment) – goal is generally to estimate the variance among treatments (or other groups) Need to know which effects are fixed or random to determine appropriate F tests in ANOVA 2 T 0 i i
description
Fixed vs. Random Effects. Fixed effect we are interested in the effects of the treatments (or blocks) per se if the experiment were repeated, the levels would be the same conclusions apply to the treatment (or block) levels that were tested treatment (or block) effects sum to zero - PowerPoint PPT Presentation
Transcript of Fixed vs. Random Effects
Fixed vs. Random Effects Fixed effect
– we are interested in the effects of the treatments (or blocks) per se– if the experiment were repeated, the levels would be the same– conclusions apply to the treatment (or block) levels that were tested– treatment (or block) effects sum to zero
Random effect– represents a sample from a larger reference population– the specific levels used are not of particular interest– conclusions apply to the reference population
• inference space may be broad (all possible random effects) or narrow (just the random effects in the experiment)
– goal is generally to estimate the variance among treatments (or other groups)
Need to know which effects are fixed or random to determine appropriate F tests in ANOVA
2T
0i
i
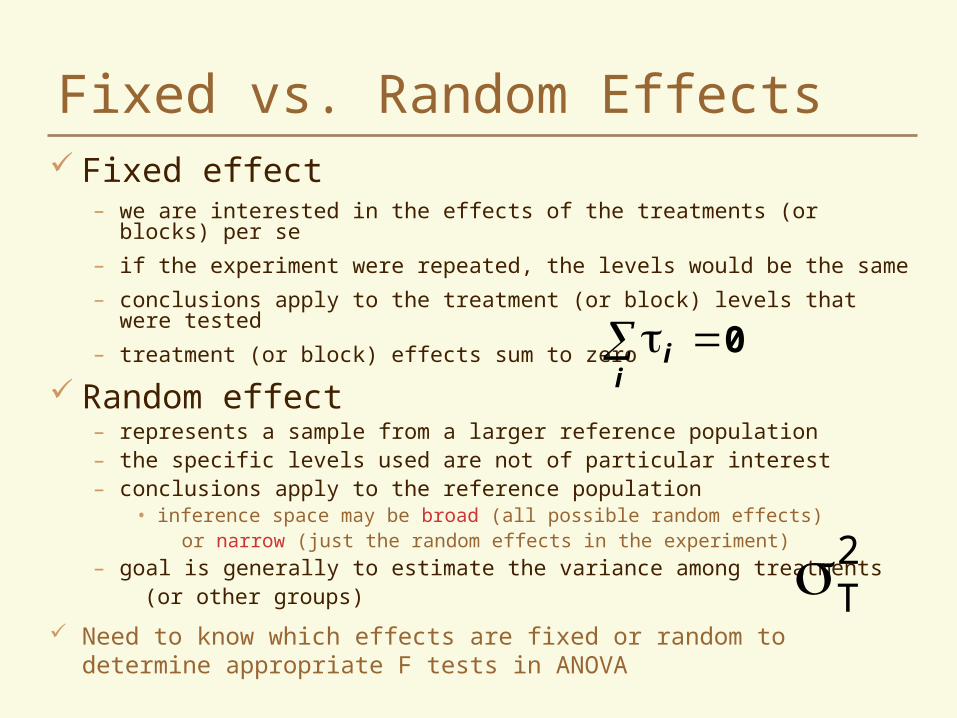
Fixed or Random? lambs born from common parents (same ram and ewe)
are given different formulations of a vitamin supplement comparison of new herbicides for potential licensing comparison of herbicides used in different decades
(1980’s, 1990’s, 2000’s) nitrogen fertilizer treatments at rates of 0, 50, 100, and
150 kg N/ha years of evaluation of new canola varieties (2008, 2009,
2010) location of a crop rotation experiment that is conducted
on three farmers’ fields in the Willamette valley (Junction City, Albany, Woodburn)
species of trees in an old growth forest
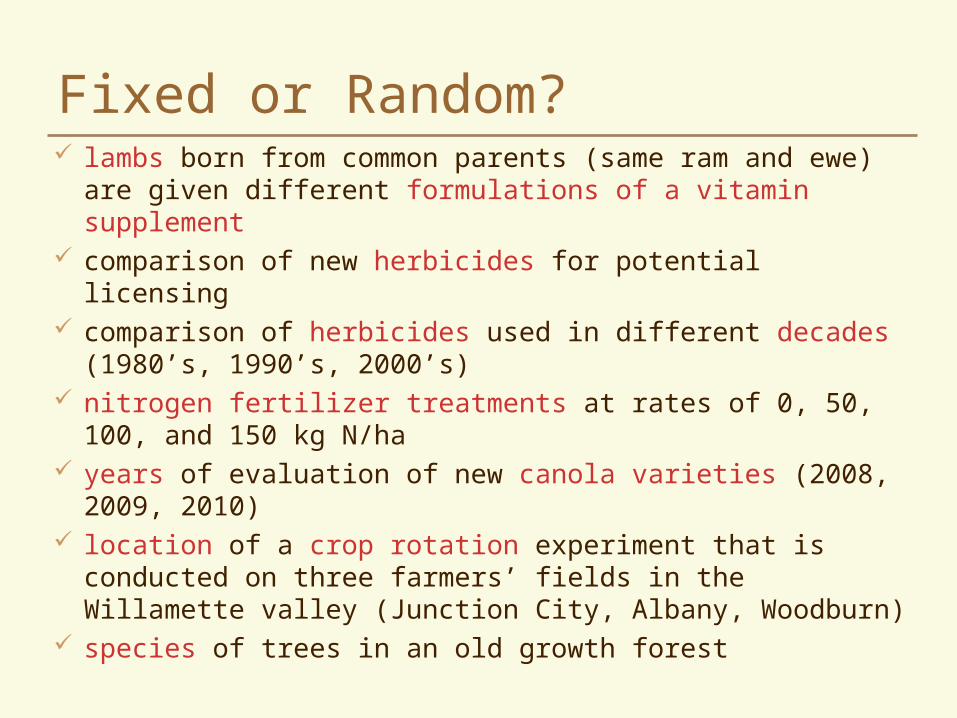
Fixed and random models for the CRD
Fixed Model(Model I)
Random Model(Model II)
Yij = µ + i + ij
Expected Source df Mean Square Treatment t -1 Error tr -t
2T
2e r2e
Expected
Te r 22
Source df Mean Square
Treatment t -1 Error tr -t
2e
2 2t i
i(t 1)
variance among fixed treatment effects

Models for the RBDFixed Model Random Model
Yij = µ + i +j + ij
2 2T j
j
2 2B i
i
(t 1)
(r 1)
Source dfExpectedMean Square
Block r-1Treatment t-1Error (r-1)(t-1)
Source
Treatment
Block2 2e Bt 2 2e Tr 2e
Source dfExpectedMean Square
Block r-1Treatment t-1Error (r-1)(t-1)
Source
Treatment
Block2 2e Bt 2 2e Tr 2e
Source dfExpectedMean Square
Block r-1Treatment t-1Error (r-1)(t-1)
Source
Treatment
Block2 2e Bt 2 2e Tr 2e
Mixed Model
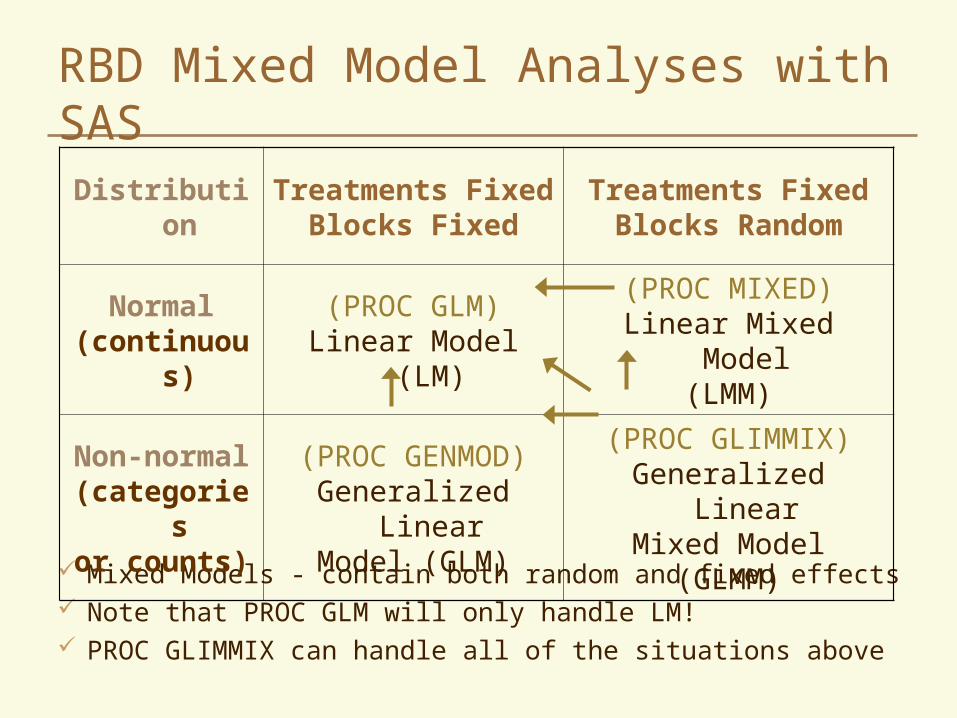
RBD Mixed Model Analyses with SAS
Mixed Models - contain both random and fixed effects Note that PROC GLM will only handle LM! PROC GLIMMIX can handle all of the situations above
Distribution Treatments FixedBlocks Fixed
Treatments FixedBlocks Random
Normal(continuous)
(PROC GLM)Linear Model (LM)
(PROC MIXED)Linear Mixed Model
(LMM)
Non-normal(categoriesor counts)
(PROC GENMOD)Generalized Linear
Model (GLM)
(PROC GLIMMIX)Generalized Linear
Mixed Model(GLMM)
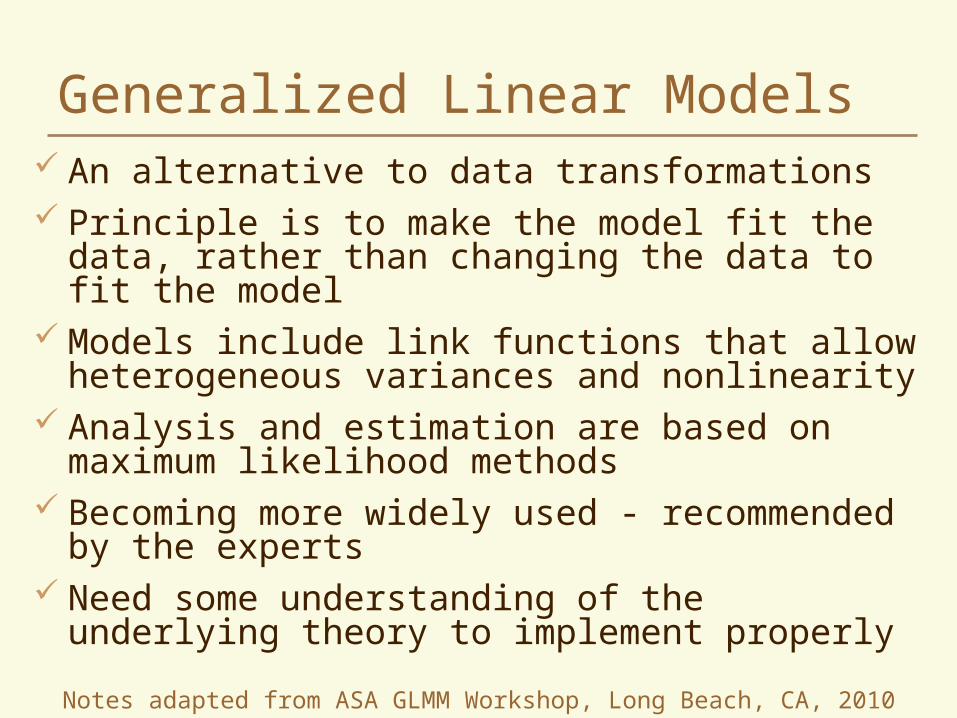
Generalized Linear Models An alternative to data transformations Principle is to make the model fit the data, rather
than changing the data to fit the model Models include link functions that allow
heterogeneous variances and nonlinearity Analysis and estimation are based on maximum
likelihood methods Becoming more widely used - recommended by the
experts Need some understanding of the underlying theory
to implement properly
Notes adapted from ASA GLMM Workshop, Long Beach, CA, 2010
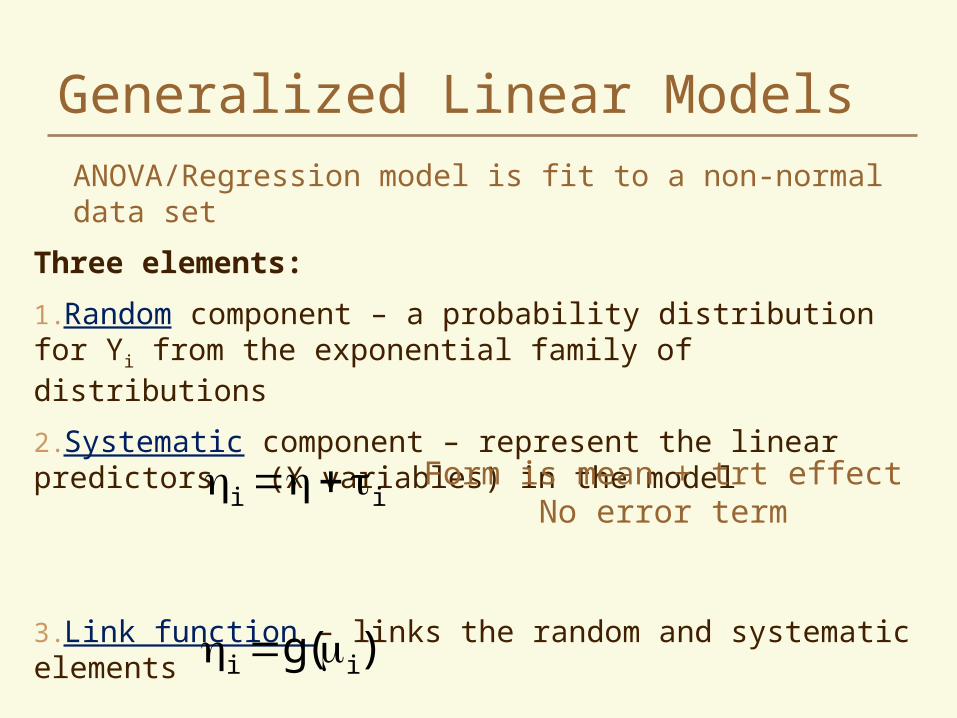
Generalized Linear ModelsANOVA/Regression model is fit to a non-normal data set
Three elements:1.Random component – a probability distribution for Yi from the exponential family of distributions
2.Systematic component – represent the linear predictors (X variables) in the model
3.Link function – links the random and systematic elements
i i Form is mean + trt effectNo error term
i ig( )

Log of Distribution = “Log-Likelihood” Binary responses (0 or 1) Probability of success follows a binomial distribution
Y YN Y N YN N!1 1Y Y! N Y !
P P P P
Y N Y
log
Nlog 1
Y
NY N log(
11 ) log
Y
P
PPP
P
“canonical parameter” Takes the form Y * function of P

Example – logit link
link log1
e1 e
µ can only vary from 0 to 1 can take on any value
Use an inverse function to convert means to the original scale
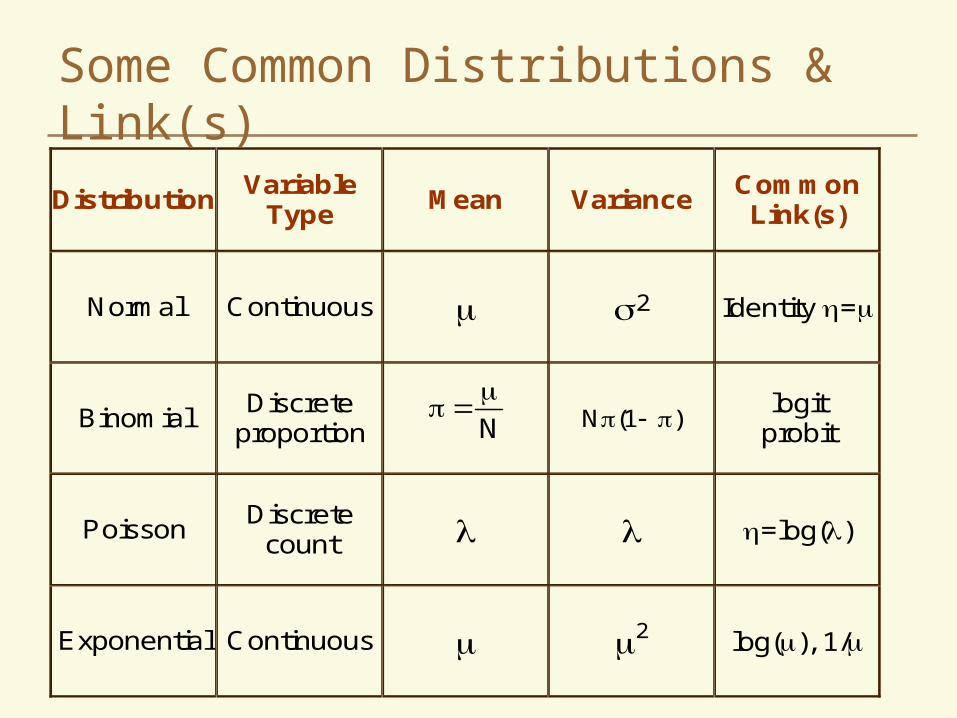
Some Common Distributions & Link(s)
Distribution Variable Type Mean Variance Common
Link(s)
Normal Continuous 2 Identity =
Binomial Discrete proportion
N (1 ) logit
probit
Poisson Discrete count =log()
Exponential Continuous 2 log(), 1/
N
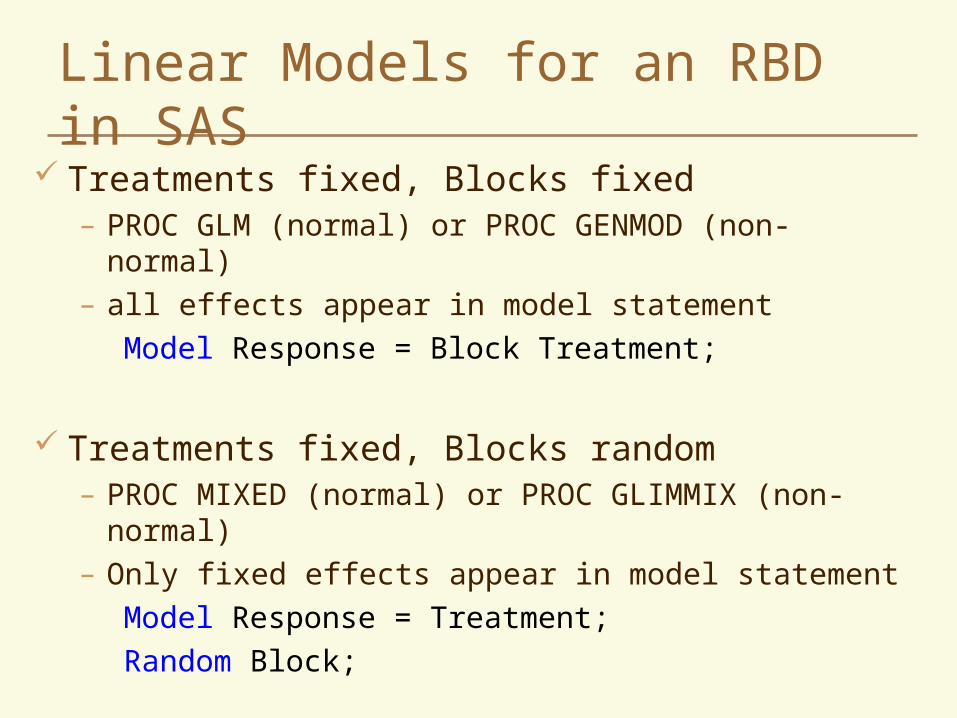
Linear Models for an RBD in SAS Treatments fixed, Blocks fixed
– PROC GLM (normal) or PROC GENMOD (non-normal)– all effects appear in model statement
Model Response = Block Treatment;
Treatments fixed, Blocks random– PROC MIXED (normal) or PROC GLIMMIX (non-normal)– Only fixed effects appear in model statement
Model Response = Treatment;Random Block;
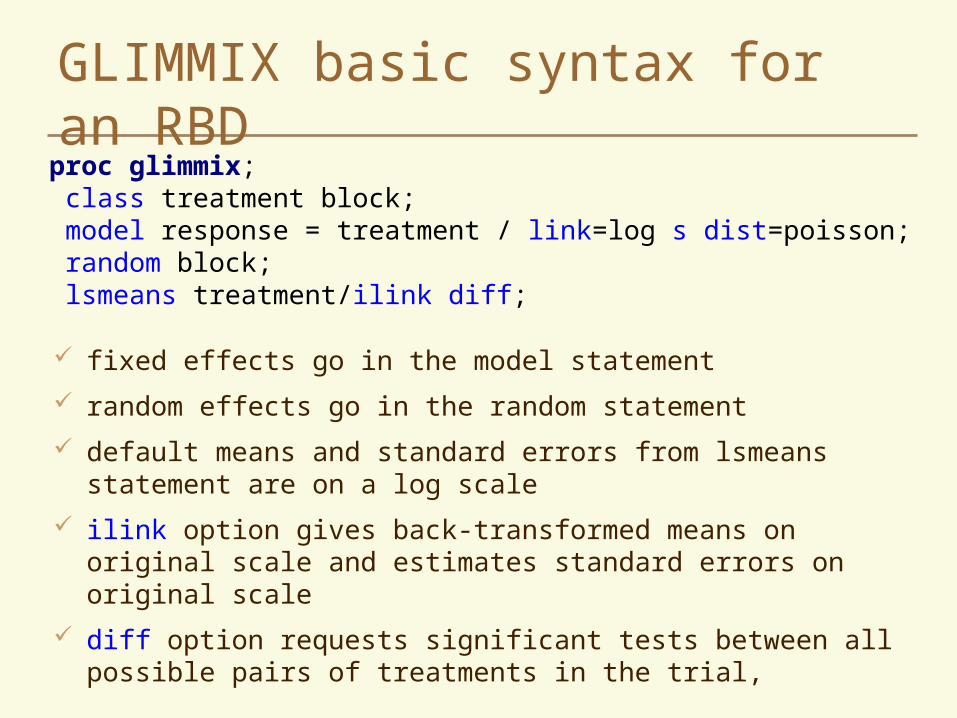
GLIMMIX basic syntax for an RBD
fixed effects go in the model statement random effects go in the random statement default means and standard errors from lsmeans statement are
on a log scale ilink option gives back-transformed means on original scale and
estimates standard errors on original scale diff option requests significant tests between all possible pairs
of treatments in the trial,
proc glimmix; class treatment block; model response = treatment / link=log s dist=poisson; random block; lsmeans treatment/ilink diff;
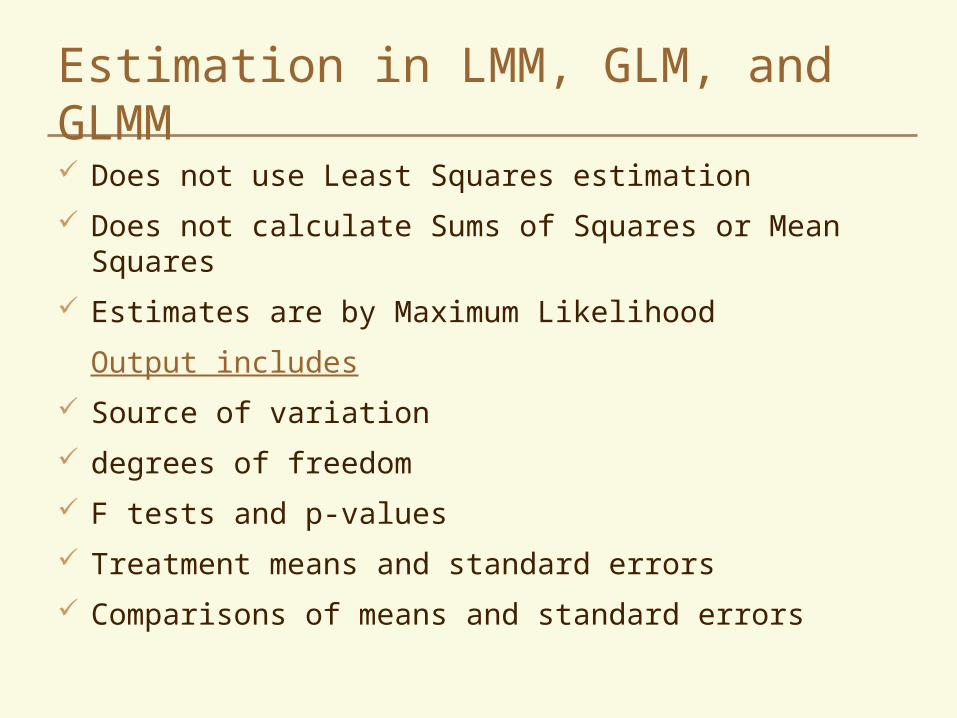
Estimation in LMM, GLM, and GLMM Does not use Least Squares estimation Does not calculate Sums of Squares or Mean Squares Estimates are by Maximum Likelihood
Output includes Source of variation degrees of freedom F tests and p-values Treatment means and standard errors Comparisons of means and standard errors