Fixed-Mobile Interconnection Issues - TT Dec fixed-mobile.pdf · Fixed-Mobile Interconnection...
27
Fixed Fixed - - Mobile Interconnection Mobile Interconnection Issues Issues The views expressed in this paper are those of the author and do not necessarily reflect the opinions of the ITU or its Membership. Dr Kelly can be contacted by e-mail at [email protected] Dr Tim Kelly, ITU Workshop on international settlement reform and the costing and pricing of telecom services, Hanoi, 11-13 December 2000
-
Upload
nguyenxuyen -
Category
Documents
-
view
222 -
download
0
Transcript of Fixed-Mobile Interconnection Issues - TT Dec fixed-mobile.pdf · Fixed-Mobile Interconnection...

FixedFixed--Mobile Interconnection Mobile Interconnection IssuesIssues
The views expressed in this paper are those of the author and do not necessarily reflect the opinions of the ITU or its Membership. Dr Kelly can be contacted by e-mail at [email protected]
Dr Tim Kelly, ITU�Workshop on international settlement reform and the
costing and pricing of telecom services�, Hanoi,
11-13 December 2000

Fixed-Mobile Interconnection Issues
Pricing mobile services:Pricing mobile services:AgendaAgenda
� A Mobile Revolution! Worldwide and in the sub-region
� Pricing Mobile! Options! Price comparisons and trends! Price trends! Average Revenue Per User (ARPU)
� Fixed-Mobile Interconnect� A Mobile Future

A Mobile RevolutionA Mobile Revolution
Source: ITU World Telecommunication Indicators Database.
0
200
400
600
800
1'000
1'200
1'400
1993 1995 1997 1999 2001 2003
Mobile UsersFixed Lines
Fixed Lines vs. Mobile Users, worldwide, Million

Mobile subscribers Mobile subscribers per 100 inhabitants per 100 inhabitants
YearYear--end 1999end 1999SubSub--regionregion
Source: ITU World Telecommunication Indicators Database.
13.70
3.84
3.42
3.66
1.22
1.06
0.81
0.42
0.17
Malaysia
Thailand
China
Philippines
Sri Lanka
Indonesia
Cambodia
Viet Nam
Lao P.D.R.

Mobile subscribers Mobile subscribers as % of total as % of total
telephone telephone subscribers subscribers
YearYear--end 1999end 1999SubSub--regionregion
Source: ITU World Telecommunication Indicators Database.
76.3%
48.5%
40.3%
31.0%
28.5%
26.8%
25.1%
20.8%
13.5%
Cambodia
Philippines
Malaysia
Thailand
China
Indonesia
Sri Lanka
Lao P.D.R.
Viet Nam

Fixed-Mobile Interconnection Issues
The secret of mobile success" Why is mobile currently growing ten times
faster (~55% p.a.) worldwide than fixed lines networks (~5.5% p.a.)?
" Why is the average mobile user much youngerthan the average fixed-line user?
" Why do users make calls using a mobilephoneeven when a fixed-line telephone is available and cheaper?
" What is the secret of the success of mobile?
Price Options

Plan name Monthlycharge for
single phone
Standard talktime included(per month)
Peak timecall charges(per minute)
Off-peakcall charges(per minute)
Chat 60 £17.63 60 off-peakminutes
40p 5p
Talk 30 £17.50 30 minutes 30p 5pTalk 120 £25.00 120 minutes 24p 5pTalk 400 £58.75 400 minutes 22p 5p
Talk 1300 £176.25 1�300 minutes 17p 5pTalk 3700 £470.00 3�700 minutes 15p 5pTalk 7500 £940.00 7�500 minutes 15p 5p
Everyday 50 50p/day 50 minutes/day 40p 1p
A selection of price optionsA selection of price optionsFrom Orange (UK)From Orange (UK)
Source: http://www.uk.orange.net/kit/index.html.
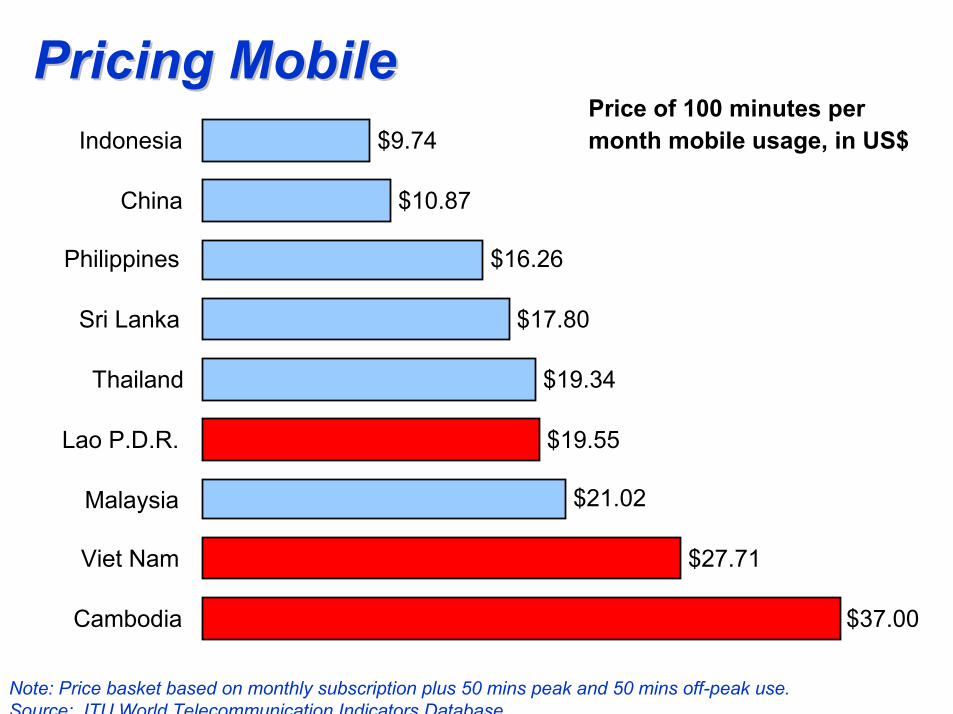
Pricing MobilePricing Mobile
Note: Price basket based on monthly subscription plus 50 mins peak and 50 mins off-peak use.Source: ITU World Telecommunication Indicators Database.
$37.00
$27.71
$21.02
$19.55
$19.34
$17.80
$16.26
$10.87
$9.74
Cambodia
Viet Nam
Malaysia
Lao P.D.R.
Thailand
Sri Lanka
Philippines
China
IndonesiaPrice of 100 minutes per month mobile usage, in US$

Declining prices for mobile access, global average, in US$, 1992-98
547
410
231180
1992 1994 1996 1998
Connection charge, US$
CAGR, 1992-98 = -16.9% p.a.547
410
231180
1992 1994 1996 1998
Connection charge, US$
CAGR, 1992-98 = -16.9% p.a. 44.938.1
34.2 31.3
1992 1994 1996 1998
Monthly subscription, US$
CAGR, 1992-98 = -5.8% p.a.
Note: CAGR = Compound Annual Growth rate.Source: ITU �World Telecommunication Development Report 1999: Mobile cellular�

Average revenue per user (ARPU)Bell Mobility (Canada)
0
20
40
60
80
100
120
90 91 92 93 94 95 96 97 98
Rev
enue
/cos
t per
sub
scrib
er
per m
onth
(US$
)
0
200
400
600
800
1'000
1'200
1'400
1'600
Subs
crib
ers
('000
s)
Revenue per sub/month
Cost per sub/month
Subscribers
Source: ITU �World Telecommunication Development Report 1999: Mobile cellular�

14%
22%
24%
40%
53%
36%
8%
3%
Customers
Average revenueper user (ARPU)
Expe
nditu
re p
er m
onth
40 per cent of low-spending customers
generate 3% ofrevenue
14 per cent of high-spending customers
generate 53% ofrevenue
Cultivate the highCultivate the high--spendersspenders
Source: Price Waterhouse Coopers, based on Canadian data.

Mobile ARPU converging with Fixed-line ARPU, Japan (Yen �000s p.a.)
0
50
100
150
200
250
300
1990 1991 1992 1993 1994 1995 1996 1997
Mobile ARPU
Fixed-line ARPU
Source: ITU �World Telecommunication Development Report 1999: Mobile cellular�

Pricing mobile and fixed:Monthly subscription charges (US$)
0
5
10
15
20
25
MalaysiaIndonesia
CambodiaThailand
HK SarSri Lanka
Residential fixed-lineDigital cellular
3.0
2.4 1.1 5.0 1.7
5.0
Ratio: Cellular/fixed

0.0
0.2
0.4
0.6
0.8
1.0
HK SarSri Lanka
CambodiaMalaysia
ThailandIndonesia
Residential fixed-lineDigital cellular
18.26.7
10.03.0 7.5
Ratio:Cellular/fixed
0
n.a.
Pricing mobile and fixed:Pricing mobile and fixed:Price of 3 minute local calls (US$)Price of 3 minute local calls (US$)

Fixed-Mobile Interconnection Issues
RPP vs. CPP: Mobile users don�t always pay to talk
Receiving Party Pays# Mobile party pays for
incoming calls and fixed party pays only local tariff
# Often, no interconnect arrangement is negotiated with the fixed operator for F-M calls. Mobile operators bill mobile consumer directly for �airtime�.
Calling Party Pays# Mobile party does
not pay for incoming calls and fixed party pays a premium to call the mobile party
# Call termination paid by fixed operators is a significant part of mobile operator revenues

Fixed-Mobile Interconnection Issues
Components of a Fixed to Mobile Call
Orig. Access
Switching
Authentication
Orig. Access
Switching
Authentication
CoreNetwork
Switching
CoreNetwork
Switching
Locating theCustomer
Switching
Term. Access
Locating theCustomer
Switching
Term. Access
Call Origination Call TerminationCalling Party
(FIXED)
Called Party
(MOBILE)
Transit service
Source: Adapted from ECTA

Fixed-Mobile Interconnection Issues
Fixed-Mobile Interconnection" Interconnect prices are a major determinant of
retail prices" Evidence of �market failure�
⇒ Interconnect prices are variable but generally very high⇒ In Calling Party-Pays environments, caller may not be aware of
the charge they will be paying⇒Calling party does not have a choice of operator to terminate the
call" Fixed-to-mobile and mobile-to-fixed highly
asymmetric" By 2003, 75% of all calls worldwide will involve a
mobile

Fixed-Mobile Interconnection Issues
Problems in calling-party-pays (CPP) environments
" Lack of tariff transparency " Mobile operators not subject to commercial
consequences of keeping rates elevated" Vertical integration further reduces incentives to lower
rates
Inefficient pricing
Non-transparent Tariffs
Market Structure

Fixed-Mobile Interconnection Issues
Calling opportunities worldwide
89.7%
5.0%5.0% 0.3%
199352.7%
19.9%
19.9%
7.5%
1998
23.4%
25.0%25.0%
26.7%
2003
Fixed-to-fixed
Fixed-to-mobile
Mobile-to-fixed
Mobile-to-mobile
Source: ITU Fixed-Mobile Interconnect website: http://www.itu.int/interconnect

Fixed-Mobile Interconnection Issues
Calling opportunities, CambodiaFixed-to-mobile17%
Mobile-to-fixed17%
Mobile-to-mobile, with interconnect
34%
Fixed-to-fixed5%
Mobile-to-mobile, without
interconnect27%
Note: Mobile subscribers = March 2000; fixed-line subscribers = December 1999. Source: ITU World Telecommunication Indicators Database.

Fixed-Mobile Interconnection Issues
Calling opportunities, Lao PDR
Note: Mobile subscribers = March 2000; fixed-line subscribers = December 1999. Source: ITU World Telecommunication Indicators Database.
Fixed-to-mobile18%
Mobile-to-mobile, without
interconnect6%
Fixed-to-fixed58%
Mobile-to-fixed18%

Fixed-Mobile Interconnection Issues
Calling opportunities, Viet Nam
Note: Mobile subscribers = March 2000; fixed-line subscribers = December 1999. Source: ITU World Telecommunication Indicators Database.
Fixed-to-mobile10%
Mobile-to-mobile, with interconnect
0.71%
Mobile-to-fixed10%
Mobile-to-mobile, without
interconnect0.74%
Fixed-to-fixed78%

Fixed/Mobile interconnect rates in selected calling-party-pays countries
0.293
0.208
0.205
0.078
0.070
0.064
0.047
0.034
0.017
0.293
0.052
0.051
0.042
0.050
0.026
0.047
0.034
0.017
Antigua
Botswana
Philippines
Dom. Rep.
Cambodia
Mexico
Guatemala
Malaysia
Costa Rica
Mobile-to-fixedinterconnect rate
Fixed-to-mobileinterconnect rate
Source: ITU.

Fixed-Mobile Interconnection Issues
Sample prices in RPP environments
0.092
0.005
0.020
0.001
0.056
0.009
0.020
0.009
0.008
0.008
0.007
0.002
0.000
0.000
0.008
0.000
CPP
RPP
USA
Sri Lanka
Singapore
HK SAR
Canada
China
Mobile-to-fixedinterconnect rateFixed-to-mobileinterconnect rate
RPP countries
Average

The race for 3rd Generation mobiles: IMT-2000
0
32
64
9.6
128
144
384
2,000 1G 2G 3G
VoiceVoice
Text MessagingText Messaging
Video StreamingVideo Streaming
StillStillImagingImaging
Audio StreamingAudio Streaming
Dat
a Tr
ansm
issi
on S
peed
-kb
it/s
ElectronicNewspaper
RemoteMedicalService(Medicalimage)
VideoConference
(High quality)
Telephone(Voice)
VoiceMail
E-MailFax
ElectronicPublishing
Video onDemand:
Sports, NewsWeather
Karaoke
VideoConference
(Lower quality)
JPEGStill Photos
MobileRadio
Video Surveillance,Video Mail, Travel
Image
AudioVoice-driven Web PagesStreaming Audio
DataWeather, Traffic, News,Sports, Stock updates
Mobile TV
E-Commerce
TimeSource: Adapted from Motorola.

Fixed-Mobile Interconnection Issues
Future Trends: Mobile Internet" Pricing and billing
⇒unmetered flat-rate (Internet) ⇒per-minute charges (Mobile)
" From circuit-switching to packet-switching⇒ Impact on nature of interconnection agreements?
" Evolution of the interconnection value chain: connectivity, capacity, content �⇒How to measure value? How to split revenue among
players?

For more information ... ITU Website at For more information ... ITU Website at www.itu.int/interconnectwww.itu.int/interconnect
Case studies" Finland" India" Mexico" China/HK
Trends in Telecom Reform, 2001 edition: Interconnection