Fission gas release from high burnup fuel during normal and power
13
PEER-REVIEWED ARTICLE bioresources.com Li et al. (2014). “Crystallinity vs. saccharification,” BioResources 9(3), 3993-4005. 3993 Relationship between Crystallinity Index and Enzymatic Hydrolysis Performance of Celluloses Separated from Aquatic and Terrestrial Plant Materials Li Li, a Wenbing Zhou, a, * Hongwei Wu, b, * Yun Yu, b Fen Liu, a and Duanwei Zhu a Hydrolysis experiments of five cellulose samples (separated from two aquatic plants and three terrestrial plants, respectively) were conducted at various cellulase loadings (7 to 200 FPU/g cellulose). No obvious correlation was found between CrI and hydrolysis performance at low enzyme loadings (e.g. 7 and 28 FPU/g cellulose), as the hydrolysis was controlled by enzyme availability and the differences in cellulose structure were unimportant. At a sufficiently high enzyme loading ( e.g. 200 FPU/g cellulose), the yield of reducing sugar was linearly proportional to the CrI value. Therefore, to establish such a correlation between cellulose structure and hydrolysis performance, hydrolysis experiments must be conducted under the conditions where enzyme availability is not a limiting factor. It was found that celluloses from sugarcane bagasse and water hyacinth have low CrI, achieve high sugar yields, exhibit fast reactions during enzymatic hydrolysis at low enzyme loadings, and can potentially be good feedstocks for bio-ethanol production. Keywords: Cellulose; Crystallinity index; Enzymatic hydrolysis performance; Aquatic/terrestrial plants; Water hyacinth Contact information: a: Laboratory of Eco-Environmental Engineering Research, Microelement Research Center of Huazhong Agricultural University; Key Laboratory of Arable Land Conservation (Middle and Lower Reaches of Yangtze River), Ministry of Agriculture, Wuhan 430070, China; b: School of Chemical and Petroleum Engineering, Curtin University, GPO Box U1987, Perth, WA 6845, Australia; *Corresponding authors: [email protected] (W.-B. Zhou); [email protected] (H. Wu) INTRODUCTION Depletion of fossil fuels, e.g. petroleum and coal that are the dominant sources for supplying cheap energy for the world’s economy, has prompted recent significant research efforts in finding viable and sustainable alternatives (Chang et al. 2011). Among various options, conversion of abundant lignocellulosic biomasses to biofuels has received significant attention. Currently, bio-ethanol production from corn and sugarcane has posed a threat to the food supply (Guragain et al. 2011), and the cost of these raw materials accounts for up to 40 to 70% of the production cost (Quintero et al. 2008). Lignocellulosic biomass serves as a cheap and abundant feedstock (Balat 2011), in it has the potential to produce low-cost bio-ethanol at a large scale. Its production does not compete with food production. Therefore, bio-ethanol from lignocellulose is considered to be second-generation and sustainable so that it receives considerably wider acceptance than the first-generation bio-ethanol from crops. The production of bio-ethanol from lignocellulosic biomass materials consists of four major steps including pretreatment, hydrolysis, fermentation, and product recovery (Hu et al. 2008). Enzymatic hydrolysis
Transcript of Fission gas release from high burnup fuel during normal and power

PEER-REVIEWED ARTICLE bioresources.com
Li et al. (2014). “Crystallinity vs. saccharification,” BioResources 9(3), 3993-4005. 3993
Relationship between Crystallinity Index and Enzymatic Hydrolysis Performance of Celluloses Separated from Aquatic and Terrestrial Plant Materials
Li Li,a Wenbing Zhou,a,* Hongwei Wu,b,* Yun Yu,b Fen Liu,a and Duanwei Zhu a
Hydrolysis experiments of five cellulose samples (separated from two aquatic plants and three terrestrial plants, respectively) were conducted at various cellulase loadings (7 to 200 FPU/g cellulose). No obvious correlation was found between CrI and hydrolysis performance at low enzyme loadings (e.g. 7 and 28 FPU/g cellulose), as the hydrolysis was controlled by enzyme availability and the differences in cellulose structure were unimportant. At a sufficiently high enzyme loading (e.g. 200 FPU/g cellulose), the yield of reducing sugar was linearly proportional to the CrI value. Therefore, to establish such a correlation between cellulose structure and hydrolysis performance, hydrolysis experiments must be conducted under the conditions where enzyme availability is not a limiting factor. It was found that celluloses from sugarcane bagasse and water hyacinth have low CrI, achieve high sugar yields, exhibit fast reactions during enzymatic hydrolysis at low enzyme loadings, and can potentially be good feedstocks for bio-ethanol production.
Keywords: Cellulose; Crystallinity index; Enzymatic hydrolysis performance; Aquatic/terrestrial plants;
Water hyacinth
Contact information: a: Laboratory of Eco-Environmental Engineering Research, Microelement Research
Center of Huazhong Agricultural University; Key Laboratory of Arable Land Conservation (Middle and
Lower Reaches of Yangtze River), Ministry of Agriculture, Wuhan 430070, China;
b: School of Chemical and Petroleum Engineering, Curtin University, GPO Box U1987, Perth, WA 6845,
Australia;
*Corresponding authors: [email protected] (W.-B. Zhou); [email protected] (H. Wu)
INTRODUCTION
Depletion of fossil fuels, e.g. petroleum and coal that are the dominant sources for
supplying cheap energy for the world’s economy, has prompted recent significant
research efforts in finding viable and sustainable alternatives (Chang et al. 2011). Among
various options, conversion of abundant lignocellulosic biomasses to biofuels has
received significant attention. Currently, bio-ethanol production from corn and sugarcane
has posed a threat to the food supply (Guragain et al. 2011), and the cost of these raw
materials accounts for up to 40 to 70% of the production cost (Quintero et al. 2008).
Lignocellulosic biomass serves as a cheap and abundant feedstock (Balat 2011), in it has
the potential to produce low-cost bio-ethanol at a large scale. Its production does not
compete with food production. Therefore, bio-ethanol from lignocellulose is considered
to be second-generation and sustainable so that it receives considerably wider acceptance
than the first-generation bio-ethanol from crops. The production of bio-ethanol from
lignocellulosic biomass materials consists of four major steps including pretreatment,
hydrolysis, fermentation, and product recovery (Hu et al. 2008). Enzymatic hydrolysis

PEER-REVIEWED ARTICLE bioresources.com
Li et al. (2014). “Crystallinity vs. saccharification,” BioResources 9(3), 3993-4005. 3994
used for cellulose saccharification is a vital step as glucose is released for subsequent bio-
ethanol production via fermentation (Harun and Danquah 2011).
While lignocellulosic biomasses are available from diverse sources at huge
quantities and low costs, the performance of enzymatic saccharification may be strongly
dependent on the diverse species, complex chemical compositions, and structural
characteristics of the feedstock materials. The sugar yields from biomass enzymatic
hydrolysis vary from plant to plant as a result of the differences mainly in cellulose
content (Sukumaran et al. 2009). Terrestrial plants are generally reported to have higher
sugar yields than aquatic plants (Guragain et al. 2011; Sukumaran et al. 2009). The
presence of hemicellulose and lignin is also known to have significant influence on the
enzymatic hydrolysis of the cellulose in the lignocellulosic structure (Hendriks and
Zeeman 2009; Yu et al. 2008). There are several pretreatment methods for improving the
saccharification of cellulose hydrolysis, including pretreatment using dilute acid, lime, or
microwave energy, etc. (Chen et al. 2009, 2012; De Vasconcelos et al. 2013; Xia et al.
2013). These pretreatments can significantly break down the recalcitrance of
lignocellulosic biomass, thus improving the accessibility of cellulase to cellulose and
enhancing the sugar yield from enzymatic hydrolysis of cellulose.
Cellulose crystallinity, usually measured as crystallinity index (CrI), is considered
an important parameter determining the enzymatic hydrolysis susceptibility of cellulose.
The crystallinity has been found to have a greater impact on enzymatic hydrolysis than
other structural characteristics such as the degree of polymerization of the cellulose (DP),
or the specific surface area (SSA) (Peng et al. 2013). Cellulose with a lower CrI is more
susceptible to hydrolysis because of its loose structure (Chen et al. 2011; Hendriks and
Zeeman 2009). For example, during hydrolysis in hot-compressed water (HCW), the
hydrolysis reactions of amorphous cellulose is considerably faster than for crystalline
cellulose (Yu and Wu 2011; Yu and Wu 2010). For enzymatic hydrolysis of
microcrystalline cellulose, it has also been reported that the lower cellulose CrI, the
higher will be the sugar yield and the faster will be the hydrolysis reaction rate (Fan et al.
1981; Peng et al. 2013; Wang et al. 2006). However, besides the intrinsic crystalline
structure of microcrystalline cellulose, the availability of enzymes is also an important
factor that determines the reaction rate of enzymatic hydrolysis of microcrystalline
cellulose. This is of particular importance for the comparison in enzymatic hydrolysis
reaction performance among various substrates with different structures. This is clearly
demonstrated in a recent study on the comparison in enzymatic hydrolysis reaction rates
between raw crystalline cellulose and a mixture of various glucose oligomers (as the
product of the raw cellulose pretreatment using HCW), under the carefully-designed
reaction conditions where the availability of enzymes is not a limiting factor (Zhou et al.
2013). Therefore, to truly establish the linkage between cellulose structural parameter
(e.g. CrI) with its enzymatic hydrolysis susceptibility, the enzymatic hydrolysis reaction
conditions need to be carefully chosen to ensure that the availability of enzymes is not a
limiting factor. Unfortunately, this important factor appeared to be largely overlooked in
the previous studies.
Therefore, this study aims to carry out a systematic study to establish a potential
relationship between CrI of plant biomass originated cellulose and the enzymatic
hydrolysis performance of these substrates, under well-designed conditions where the
availability of enzyme is not a limiting factor. Five different cellulose samples were
prepared from aquatic plants (water hyacinth, i.e., Eichhornia crassipes and water peanut,
i.e., Alternanthera philoxeroides) and terrestrial plants (miscanthus, sugarcane bagasse

PEER-REVIEWED ARTICLE bioresources.com
Li et al. (2014). “Crystallinity vs. saccharification,” BioResources 9(3), 3993-4005. 3995
and metasequoia chips). The enzymatic hydrolysis reactions were carefully examined at a
series of different cellulase loadings, enabling the establishment of the relationship
between the CrI of the celluloses and enzymatic hydrolysis performance. This study also
investigated the differences in the enzymatic hydrolysis performance among celluloses
separated from aquatic and terrestrial plants.
EXPERIMENTAL Materials
Cellulase (T. reesei ATCC 26921, Sigma-Aldrich, USA) as a lyophilized powder
was used for enzymatic hydrolysis of the celluloses separated from various
lignocellulosic biomass materials. The filter paper activity of cellulase was measured
using standard IUPAC procedures (Ghose 1987), and the enzymatic activity of the
cellulose was 0.7 FPU/mg. The cellulase was then dissolved in 50 mM acetic acid-acetate
buffer (pH = 5.0) for use. The glucose standard, and reagents used were purchased from
Sinopharm Chemical Reagent Co., Ltd, China. The lignocellulosic biomass samples used
in this study represented a variety of materials ranging from annual aquatic and terrestrial
herbaceous plants, i.e. water hyacinth (Eichhornia crassipes), water peanut
(Alternanthera philoxeroides), miscanthus and sugarcane bagasse, to woody material,
i.e., metasequoia chips. Water hyacinth and water peanut were obtained from a lake in
Huazhong Agricultural University. Miscanthus and sugarcane bagasse were collected
from Wuhan Botanical Garden and a juice shop in Wuhan, respectively. Chips from
metasequoia as terrestrial woody plant material was provided by a sawmill in Wuhan. All
biomass samples were air-dried, milled, and then sieved to prepare samples of 0.250 to
0.425 mm for subsequent experiments.
Separation of Cellulose from Lignocellulosic Biomass
Separation of cellulose from the five prepared biomass samples was performed
according to a nitric acid-ethanol method detailed elsewhere (Wang and Cheng 2011).
Briefly, the process was carried out in boiling water bath with a condensate reflux pipe.
For each biomass sample, ~1 g of the sample was treated in 25 mL of nitric acid-ethanol
mixture (at a 1:4 volumetric ratio) for one hour and then subjected to filtration using G2
glass sand core tundish. The treatment was repeated 4 times before the obtained cellulose
sample was dried in an oven at 105 °C to a constant weight. The dried cellulose sample
was then milled and sieved to a size range of 0.250 to 0.425 mm for subsequent
experiments.
Determination of Crystallinity Index (CrI)
The CrI of raw materials and prepared cellulose samples were measured by a
powder X-ray diffractometer. The specimen was scanned at 2°/min for 2θ from 5° to 40°
with a step size of 0.05°. The crystallinity index (CrI) were determined based on the
equation shown below (Kim and Holtzapple 2006):
(1) 100002
002
I
IICrI
am

PEER-REVIEWED ARTICLE bioresources.com
Li et al. (2014). “Crystallinity vs. saccharification,” BioResources 9(3), 3993-4005. 3996
where I002 is the intensity of the diffraction from the 002 plane at 2θ=22.6° and Iam is the
intensity of the background scatter measured at 2θ=18.7°. It is known that the I002 peak
corresponds to the crystalline fraction and the Iam peak corresponds to the amorphous
fraction (Wang et al. 2006).
Enzymatic Hydrolysis of the Prepared Cellulose Samples
The enzymatic hydrolysis experiments were conducted at a wide range of
cellulase loadings of 7 to 200 FPU/g cellulose, aiming at determining the suitable
reaction conditions where the availability of enzyme is not the reaction limiting factor. In
a hydrolysis experiment, ~15 mg of a cellulose sample was added into a 50 mL flask with
15 mL of 50 mM acetic acid-acetate buffer (pH = 5.0). The flasks were put in a water
bath that was preheated to 50 °C and continuously stirred at 150 rpm. The cellulase
dissolved by acetic acid-acetate buffer was then added into the flask to start the
experiment. The experiment proceeded at 50 °C in the water bath. Once a desired
reaction time (1, 2, 4, 8, 12, 24, 48, and 72 h, respectively) was reached, the flasks (with
sample) were taken out and immediately immersed in boiling water bath for 5 min to
terminate the reaction. The samples were then collected for further analysis. Blank
experiments without cellulase addition were also performed for each cellulose sample.
All enzymatic hydrolysis reactions were conducted in triplicate.
Determination of Reducing Sugar and Initial Hydrolysis Reaction Rate
The samples collected from each enzymatic hydrolysis experiment were first
filtered by 0.45 μm filters. The supernatant liquid was collected and subjected to
subsequent sugar analysis. The yield of reducing sugar was determined by the DNS
method (Chen et al. 2009) using a Visible Spectrophotometer at a wavelength of 520 nm.
The yield of reducing sugar was calculated as Yield of reducing sugar (g/100g) =
reducing sugar at time of t (g)×100 / initial cellulose sample (g).
A good linear relationship between yield of reducing sugar and hydrolysis time
was obtained using the data collected within 4 h. Thus, the initial hydrolysis reaction rate
(V0, mg/L·h) was calculated as the slope of linear curve fitted by reducing sugar yield
data of 0 (=0), 1, 2, 4 h. This method was used in previous studies (Harun and Danquah
2011; Yeh et al. 2010).
RESULTS AND DISCUSSION Cellulose Contents of Plant Biomass Samples and CrI of the Prepared Cellulose Samples
Figure 1 presents the cellulose contents of various biomass materials used in this
study. It can be found that the cellulose contents of the aquatic plants were significantly
lower than those of the terrestrial plants. For example, the cellulose contents of water
peanut and water hyacinth were 19.55% and 21.78%, while those of sugarcane bagasse,
miscanthus, and metasequoia were 32.06%, 35.45%, and 47.61%, respectively. Such
results are basically consistent with the cellulose contents of similar biomass materials
reported in the literature (Jeon et al. 2010; Nigam 2002; Sasaki et al. 2003).
The CrI of a cellulose sample is an indication of the degree of formed crystallinity
in the sample when the cellulose aggregates. The XRD patterns of different plant samples
and their prepared celluloses are shown in Fig. 2. It can be seen that the peak patterns of

PEER-REVIEWED ARTICLE bioresources.com
Li et al. (2014). “Crystallinity vs. saccharification,” BioResources 9(3), 3993-4005. 3997
aquatic and terrestrial plant samples and their celluloses were similar. However, the peak
intensities of crystalline diffraction (2θ=22.6°) were significantly different between
aquatic (Fig. 2a, ‘Wh’ and ‘Wp’) and terrestrial plant samples (Fig. 2b, ‘Sb’, ‘Mi’ and
‘Mc’). The former were apparently lower than the latter, especially for the ‘Wh’ sample,
i.e., water hyacinth being the lowest one (Fig. 2a, black line), indicating its lowest
absolute crystalline cellulose content.
Note: Wp-Water peanut, Wh-Water hyacinth, Sb-Sugarcane bagasse, Mi-Miscanthus, Mc-Metasequoia chips. Fig. 1. Cellulose contents of different kinds of plant materials
Note: Wp-Water peanut, Wh-Water hyacinth, Sb-Sugarcane bagasse, Mi-Miscanthus, Mc-Metasequoia chips, -C means celluloses prepared from plant materials. Fig. 2. XRD patterns of different plant samples and prepared celluloses. (a) Aquatic and (b) Terrestrial.

PEER-REVIEWED ARTICLE bioresources.com
Li et al. (2014). “Crystallinity vs. saccharification,” BioResources 9(3), 3993-4005. 3998
Table 1. CrI of Different Plant Samples and Prepared Celluloses Plant type Sample CrIB a (%) CrI b (%) Incrementc (%)
Aquatic herbaceous Water peanut 29.6 57.9 95.2
Water hyacinth 32.1 59.9 86.9
Terrestrial herbaceous Sugarcane bagasse 38.7 56.4 45.7
Miscanthus 43.2 61.2 41.6
Terrestrial woody Metasequoia chips 47.0 70.6 50.3 a CrIB is biomass crystallinity index b CrI is cellulose crystallinity index c Increment represents the increase percentage of CrI based on CrIB
The specific CrI values of plant materials and prepared celluloses were then
calculated, and the results are listed in Table 1. The CrI values of aquatic plants (CrIB)
were slightly lower than those of terrestrial plants. Such a finding may be at least partly
related to the lower cellulose contents of these materials (Kim and Holtzapple 2006; Zhu
et al. 2010). Among all the celluloses prepared by the nitric acid-ethanol method, the CrI
of cellulose derived from metasequoia chips was the highest (70.6%), while those of
other types of plant celluloses ranged from 56.4% to 61.2%. The celluloses separated
from aquatic plants exhibited significantly higher CrI values than their parent materials,
and such increases in the CrI were much higher than those for terrestrial plants (Table 1).
This could be explained by two reasons. One is that more amorphous components (e.g.
hemicellulose, lignin, etc.) in the raw materials would have been removed during the
cellulose separation process of the aquatic plants, which have lower cellulose contents
(hence higher contents of amorphous components). The other is that the amorphous
cellulose portions in the aquatic plants are more prone to recrystallization to form
crystalline cellulose, resulting in greater increases in CrI than those for the terrestrial
plants (Lionetto et al. 2012; Satyanagalakshmi et al. 2011).
Yield of Reducing Sugar during Enzymatic Hydrolysis of Celluloses Separated from Various Plants
Figure 3 presents the data on the yields of reducing sugar from the enzymatic
hydrolysis of celluloses as a function of hydrolysis time at various enzyme loadings. At
least three important observations can be made based on the results.
First, the reducing sugar yield increased with hydrolysis time, as expected,
although those of different materials exhibited different patterns of increase. For
example, at an enzyme loading of 200 FPU/g, the reducing sugar yield of celluloses from
water peanut (Fig. 3a), water hyacinth (Fig. 3b), and sugarcane bagasse (Fig. 3c) almost
reached the maximum value after hydrolysis for 24 h, suggesting that further hydrolysis
reactions lead to little sugar production. However, it took 48 h for the hydrolysis of
miscanthus cellulose (Fig. 3d) to reach the maximum. On the other hand, the sugar yield
of metasequoia chips cellulose (Fig. 3e) still exhibited an apparent trend for further slight
increase after hydrolysis for 72 h.
Second, the data demonstrated that the enzyme loading had a significant effect on
cellulose hydrolysis performance. For each sample, an increase of enzyme loading
generally led to an increase in the sugar yield. However, the sugar yields of different
celluloses under a same enzyme loading and their increase extent under elevated enzyme
loadings were strongly dependent on the cellulose materials. For example, at a low
enzyme loading of 7 FPU/g, after hydrolysis for 72 h , the hydrolysis reactions of water

PEER-REVIEWED ARTICLE bioresources.com
Li et al. (2014). “Crystallinity vs. saccharification,” BioResources 9(3), 3993-4005. 3999
hyacinth cellulose (Fig. 3b), sugarcane bagasse cellulose (Fig. 3c), and miscanthus
cellulose (Fig. 3d) had already led to high reducing sugar yields (77.71, 85.72, and 66.52
g/100 g, respectively). Such performances were substantially better than those of the
other two materials: water peanut (Fig. 3a) and metasequoia chips (Fig. 3e). It can also be
seen that at all enzyme loadings, metasequoia chips cellulose showed the lowest reducing
sugar yields, and the cellulose from sugarcane bagasse showed the highest yield after 72
h hydrolysis time.
Meanwhile, it can also be seen that, after hydrolysis for 24 h at enzyme loading of
28 FPU/g, the sugar yield of water hyacinth cellulose (81.23 g/100g, Fig. 3b) was close to
that of sugarcane bagasse cellulose (87.19 g/100g, Fig. 3c) but higher than those of the
other 3 cellulosic materials. The enzymatic hydrolysis of water hyacinth cellulose was
also faster than the other three cellulose materials during the initial hydrolysis stage
(within 24 h) at an enzyme loading of 28 FPU/g. The results suggest that the water
hyacinth cellulose is more available to cellulase than other plant celluloses (except
sugarcane bagasse cellulose) at a relatively low enzyme loading of 28 FPU/g. It is known
that water hyacinth has strong reproductive capacity and high productivity; its
overgrowth has caused many environmental problems, such as blocking of waterways,
loss of water bodies’ ecological function, and pollution of water bodies after
decomposition (Guragain et al. 2011). Therefore, the results presented here suggest that a
high yield of reducing sugar may be achieved at a relatively low enzyme loading via the
enzymatic hydrolysis of water hyacinth cellulose. This points to the potential advantages
in practical application for utilizing water hyacinth as a feedstock for bio-ethanol
production.
Last and importantly, the data in Fig. 3 suggest that an enzyme loading of 200
FPU/g is sufficient to ensure that the hydrolysis reactions take place under conditions
where the availability of enzyme is not a limiting factor. The curves for reducing sugar
yield under enzyme loading of 200 FPU/g were very close to or even overlying those
corresponding to an enzyme loading of 140 FPU/g. In fact, a further increase in enzyme
loading up to 250 or 300 FPU/g led to little further increase or even decrease in the sugar
yield from the hydrolysis of these celluloses (data not shown). A possible reason may be
that an increased enzyme loading results in increased medium viscosity, and the
increased viscosity makes the diffusion of enzymes to the substrate and the leaving of
products from the substrate vicinity more difficult, decreasing the efficiency of the
hydrolysis reaction (Roberts et al. 2011). As a whole, under an enzyme loading of 200
FPU/g, the hydrolysis reactions are no longer limited by enzyme availability so that the
hydrolysis performance is truly determined by the structure of the cellulose materials.
Correlation between CrI and Yield of Reducing Sugar Figure 3 shows that after enzymatic hydrolysis for 72 h, the yield of reducing
sugar for all of the celluloses at various enzyme loadings of 7 to 200 FPU/g reached a
plateau or was about to reach a plateau. Therefore, to display the influence of cellulose
CrI to the yield of reducing sugar, the yield of reducing sugar after enzymatic hydrolysis
for 72 h were used.
Figure 4 shows the correlation between the cellulose CrI and the yield of reducing
sugar in enzymatic hydrolysis time of 72 h at various enzyme loadings of 7 to 200 FPU/g.
The results clearly display that at lower enzyme loadings (e.g. 7 and 28 FPU/g), there was
no apparent correlations between the cellulose CrI and the yield of reducing sugar.

PEER-REVIEWED ARTICLE bioresources.com
Li et al. (2014). “Crystallinity vs. saccharification,” BioResources 9(3), 3993-4005. 4000
Fig. 3. Yields of reducing sugar from enzymatic hydrolysis of five different plant celluloses at various enzyme loadings of 7 to 200 FPU/g: (a) Water peanut, (b) Water hyacinth, (c) Sugarcane bagasse, (d) Miscanthus, (e) Metasequoia chips
PEER-REVIEWED ARTICLE bioresources.com
Li et al. (2014). “Crystallinity vs. saccharification,” BioResources 9(3), 3993-4005. 4001
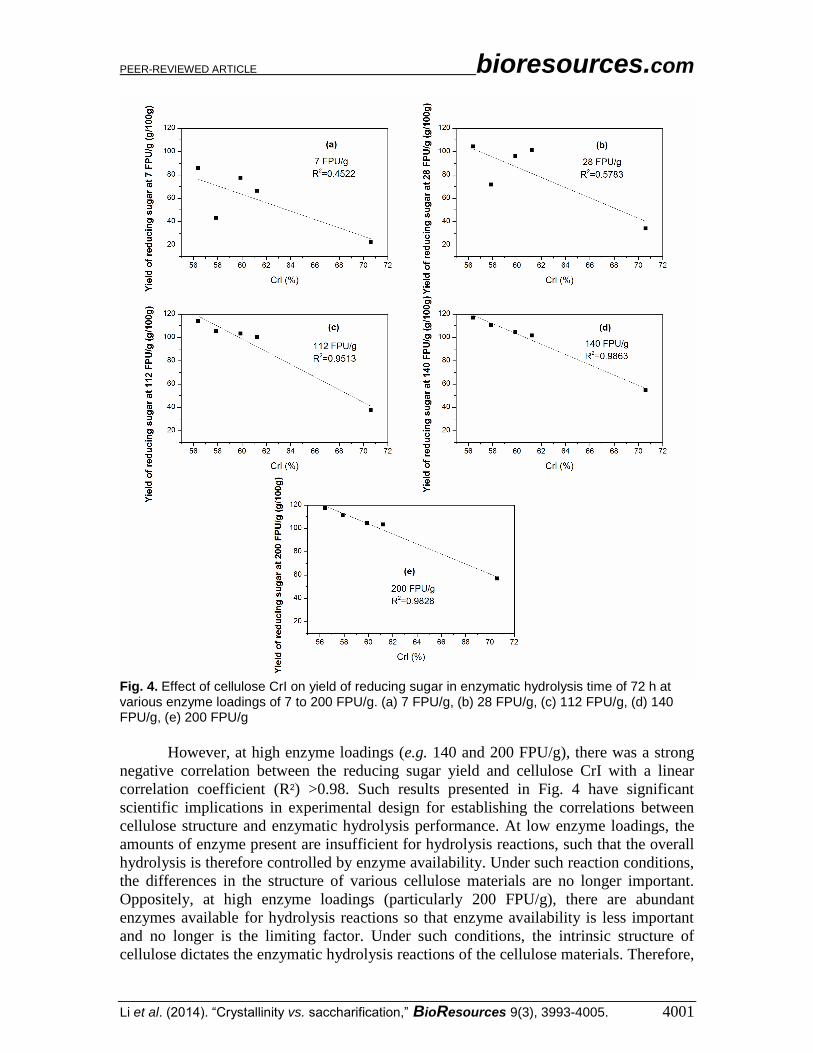
Fig. 4. Effect of cellulose CrI on yield of reducing sugar in enzymatic hydrolysis time of 72 h at various enzyme loadings of 7 to 200 FPU/g. (a) 7 FPU/g, (b) 28 FPU/g, (c) 112 FPU/g, (d) 140 FPU/g, (e) 200 FPU/g
However, at high enzyme loadings (e.g. 140 and 200 FPU/g), there was a strong
negative correlation between the reducing sugar yield and cellulose CrI with a linear
correlation coefficient (R2) >0.98. Such results presented in Fig. 4 have significant
scientific implications in experimental design for establishing the correlations between
cellulose structure and enzymatic hydrolysis performance. At low enzyme loadings, the
amounts of enzyme present are insufficient for hydrolysis reactions, such that the overall
hydrolysis is therefore controlled by enzyme availability. Under such reaction conditions,
the differences in the structure of various cellulose materials are no longer important.
Oppositely, at high enzyme loadings (particularly 200 FPU/g), there are abundant
enzymes available for hydrolysis reactions so that enzyme availability is less important
and no longer is the limiting factor. Under such conditions, the intrinsic structure of
cellulose dictates the enzymatic hydrolysis reactions of the cellulose materials. Therefore,

PEER-REVIEWED ARTICLE bioresources.com
Li et al. (2014). “Crystallinity vs. saccharification,” BioResources 9(3), 3993-4005. 4002
the results presented here clearly demonstrate that in order to establish the correlation
between cellulose structure (such as CrI) and enzymatic hydrolysis performance,
enzymatic hydrolysis experiments should be carefully designed to ensure that the
hydrolysis reactions take place under conditions where enzyme availability is not the
limiting factor.
Effect of CrI on Initial Hydrolysis Reaction Rate The initial hydrolysis reaction rates (V0) of reducing sugar production from
cellulose at various enzyme loadings of 7 to 200 FPU/g are shown in Table 2.
Table 2. Initial Hydrolysis Reaction Rate (V0, 0-4 h) of Different Plant Celluloses at Various Enzyme Loadings of 7 to 200 FPU/g
Sample CrI (%)
V0 (mg/L·h)
E0 (FPU/g)
7 28 112 140 200
Sugarcane bagasse 56.4 56.7 66.2 147.8 186.7 317.5
Water peanut 57.9 10.2 43.7 90.2 111.0 245.1
Water hyacinth 59.9 22.1 47.3 149.0 99.4 337.3
Miscanthus 61.2 20.7 32.3 97.1 139.5 172.1
Metasequoia chips 70.6 0.8 2.2 16.8 15.2 11.1
Note: Wp-Water peanut, Wh-Water hyacinth, Sb-Sugarcane bagasse, Mi-Miscanthus, Mc-Metasequoia chips Fig. 5. Effect of cellulose CrI on initial hydrolysis reaction rate (V0, 0-4 h) of cellulose at enzyme loading of 200 FPU/g.

PEER-REVIEWED ARTICLE bioresources.com
Li et al. (2014). “Crystallinity vs. saccharification,” BioResources 9(3), 3993-4005. 4003
It is noted that the initial hydrolysis rate (V0) of water hyacinth cellulose was even
higher than that of sugarcane bagasse cellulose at 200 FPU/g (337.3 vs. 317.5 mg/L·h,
Table 2). This may be potentially related to the low content of crystalline cellulose in the
raw water hyacinth biomass (see Section 3.1 and Fig. 2a).
As the tabulated data indicate, except in the case of water peanut cellulose, the
initial hydrolysis reaction rates (V0) of other plant celluloses at different enzyme loadings
basically decreased with the increase of CrI, indicating that cellulose CrI is an important
factor limiting the initial rate of hydrolysis reaction. For water peanut cellulose, its initial
hydrolysis reaction rate (V0) was very low at the enzyme loading of 7 FPU/g, i.e., 10
mg/L·h, while it increased by factors of 4.4, 9.0, 11.1, and 24.5 at the enzyme loadings of
28, 112, 140, and 200 FPU/g, respectively. However, a relatively higher enzyme loading
would be required to achieve rapid and effective hydrolysis of water peanut cellulose
compared to other plant celluloses; therefore it is relatively not so favorable to use water
peanut cellulose as a feedstock to produce low-cost bio-ethanol. Following the analysis
given earlier, enzyme availability is not a limiting factor at an enzyme loading of 200
FPU/g. Figure 5 shows that the initial hydrolysis rate (V0) decreased broadly with an
increase in CrI, based on the data obtained at a hydrolysis time within 4 h.
CONCLUSIONS 1. The enzymatic hydrolysis susceptibilities of celluloses separated from five plant
materials was evaluated. The results showed that the hydrolysis efficiency of five
kinds of plant celluloses was in the order of sugarcane bagasse > water hyacinth >
miscanthus > water peanut > metasequoia chips.
2. Significant negative correlation between enzymatic hydrolysis performance of five
plant celluloses and their crystallinity indexes (CrI) was observed, at a sufficiently
high enzyme loading (e.g. 200 FPU/g cellulose) where the intrinsic structure of
cellulose (i.e. CrI) dictates their enzymatic hydrolysis reactions. However, there was
no good correlation at low enzyme loadings (e.g. 7 and 28 FPU/g cellulose), as the
hydrolysis was controlled by enzyme availability at lower concentration.
3. Due to the low CrI, celluloses from sugarcane bagasse and water hyacinth achieve
high sugar yields through fast reactions during enzymatic hydrolysis at low enzyme
loading, and they are potentially good feedstocks for bio-ethanol production.
ACKNOWLEDGMENTS
The authors thank the funding provided by the Fundamental Research Funds for
the Central Universities (grant no. 2011PY113, 2014PY061) and the Wuhan Youth
Science and Technology Chenguang Program (grant no. 2014070404010205) to carry out
this work.

PEER-REVIEWED ARTICLE bioresources.com
Li et al. (2014). “Crystallinity vs. saccharification,” BioResources 9(3), 3993-4005. 4004
REFERENCES CITED Balat, M. (2011). "Production of bioethanol from lignocellulosic materials via the
biochemical pathway: A review," Energy Convers. Manage. 52(2), 858-875.
Chang, K.-L., Thitikorn-amorn, J., Hsieh, J.-F., Ou, B.-M., Chen, S.-H.,
Ratanakhanokchai, K., Huang, P.-J., and Chen, S.-T. (2011). "Enhanced enzymatic
conversion with freeze pretreatment of rice straw," Biomass Bioenerg 35(1), 90-95.
Chen, M., Zhao, J., and Xia, L. (2009). "Comparison of four different chemical
pretreatments of corn stover for enhancing enzymatic digestibility," Biomass
Bioenergy 33(10), 1381-1385.
Chen, W.-H., Pen, B.-L., Yu, C.-T., and Hwang, W.-S. (2011). "Pretreatment efficiency
and structural characterization of rice straw by an integrated process of dilute-acid
and steam explosion for bioethanol production," Bioresour. Technol. 102(3), 2916-
2924.
Chen W.-H., Ye S.-C., and Sheen H.-K.(2012). "Hydrolysis characteristics of sugarcane
bagasse pretreated by dilute acid solution in a microwave irradiation environment,"
Appl. Energy 93, 237-244.
De Vasconcelos S. M., Santos A. M. P., Rocha G. J. M., and Souto-Maior A. M.(2013).
"Diluted phosphoric acid pretreatment for production of fermentable sugars in a
sugarcane-based biorefinery," Bioresour. Technol. 135, 46-52.
Ghose, T. K. (1987). "Measurement of cellulase activities," Pure & Appl. Chem. 59(2),
257-268.
Guragain, Y. N., De Coninck, J., Husson, F., Durand, A., and Rakshit, S. K. (2011).
"Comparison of some new pretreatment methods for second generation bioethanol
production from wheat straw and water hyacinth," Bioresour. Technol. 102(6), 4416-
4424.
Harun, R., and Danquah, M. K. (2011). "Enzymatic hydrolysis of microalgal biomass for
bioethanol production," Chem. Eng. J. 168(3), 1079-1084.
Hendriks, A. T., and Zeeman, G. (2009). "Pretreatments to enhance the digestibility of
lignocellulosic biomass," Bioresour. Technol. 100(1), 10-18.
Hu, G., Heitmann, J. A., and Rojas, O. J. (2008). "Feedstocks pretreatment strategies for
producing ethanol from wood, bark and forest residues," BioResources 3(1), 270-294.
Jeon, Y. J., Xun, Z., and Rogers, P. L. (2010). "Comparative evaluations of cellulosic raw
materials for second generation bioethanol production," Appl. Microbiol. 51(5), 518-
524.
Fan, L. T., Lee, Y.-H., and Beardmore, D. R. (1981). "The influence of major structural
features of cellulose on rate of enzymatic hydrolysis," Biotechnol. Bioeng. XXIII,
419-424.
Kim, S., and Holtzapple, M. T. (2006). "Effect of structural features on enzyme
digestibility of corn stover," Bioresour. Technol. 97(4), 583-591.
Lionetto, F., Del Sole, R., Cannoletta, D., Vasapollo, G., and Maffezzoli, A. (2012).
"Monitoring wood degradation during weathering by cellulose crystallinity,"
Materials 5(12), 1910-1922.
Nigam, J. N. (2002). "Bioconversion of water-hyacinth (Eichhornia crassipes)
hemicellulose acid hydrolysate to motor fuel ethanol by xylose–fermenting yeast," J.
Biotechnol. 97, 107-116.
PEER-REVIEWED ARTICLE bioresources.com
Li et al. (2014). “Crystallinity vs. saccharification,” BioResources 9(3), 3993-4005. 4005
Peng, H. D., Li, H. Q., Luo, H., and Xu, J. (2013). "A novel combined pretreatment of
ball milling and microwave irradiation for enhancing enzymatic hydrolysis of
microcrystalline cellulose," Bioresour. Technol. 130, 81-87.
Quintero, J. A., Montoya, M. I., Sánchez, O. J., Giraldo, O. H., and Cardona, C. A.
(2008). "Fuel ethanol production from sugarcane and corn: Comparative analysis for
a Colombian case," Energy 33(3), 385-399.
Roberts K. M., Lavenson D. M., Tozzi E. J., McCarthy M. J., and Jeoh T. (2011). "The
effects of water interactions in cellulose suspensions on mass transfer and
saccharification efficiency at high solids loadings," Cellulose 18, 759-773.
Sasaki, M., Adschiri, T., and Arai, K. (2003). "Fractionation of sugarcane bagasse by
hydrothermal treatment," Bioresour. Technol. 86(3), 301-304.
Satyanagalakshmi, K., Sindhu, R., Binod, P., Janu, K. U., Sukumaran, R. K., and Pandey,
A. (2011). "Bioethanol production from acid pretreated water hyacinth by separate
hydrolysis and fermentation," J. Sci. Ind. Res. 70, 156-161.
Sukumaran, R. K., Singhania, R. R., Mathew, G. M., and Pandey, A. (2009). "Cellulase
production using biomass feed stock and its application in lignocellulose
saccharification for bio-ethanol production," Renew. Energy 34(2), 421-424.
Wang, L. F., and Cheng, Y. C. (2011). "Determining the content of cellulose by nitric-
acid ethanol method," Chemical Research 22(4), 52-56 (in Chinese).
Wang, L. S., Zhang, Y. Z., Gao, P. J., Shi, D. X., Liu, H. W., and Gao, H. J. (2006).
"Changes in the structural properties and rate of hydrolysis of cotton fibers during
extended enzymatic hydrolysis," Biotechnol. Bioeng. 93(3), 443-456.
Xia A., Cheng J., Song W., Yu C., Zhou J., and Cen K.(2013). "Enhancing enzymatic
saccharification of water hyacinth through microwave heating with dilute acid
pretreatment for biomass energy utilization," Energy 61, 158-166.
Yeh, A. I., Huang, Y. C., and Chen, S. H. (2010). "Effect of particle size on the rate of
enzymatic hydrolysis of cellulose," Carbohydr. Polym. 79(1), 192-199.
Yu, Y., Lou, X., and Wu, H. (2008). "Some recent advances in hydrolysis of biomass in
hot-compressed water and its comparisons with other hydrolysis methods," Energy
Fuels 22(1), 46-60.
Yu, Y., and Wu, H. (2011). "Effect of ball-milling on the hydrolysis of microcrystalline
cellulose in hot-compressed water," AIChE J. 57(3), 793-800.
Yu, Y., and Wu, H. (2010). "Significant differences in the hydrolysis behavior of
amorphous and crystalline portions within microcrystalline cellulose in hot-
compressed water," Ind. Eng. Chem. Res. 49(8), 3902-3909.
Zhou, W. B., Yu, Y., Liu, D. W., and Wu, H. W. (2013). "Rapid recovery of fermentable
sugars for biofuel production from enzymatic hydrolysis of microcrystalline cellulose
by hot-compressed water pretreatment," Energy Fuels 27, 4777-4784.
Zhu, L., O'Dwyer, J. P., Chang, V. S., Granda, C. B., and Holtzapple, M. T. (2010).
"Multiple linear regression model for predicting biomass digestibility from structural
features," Bioresour. Technol. 101(13), 4971-4979.
Article submitted: March 8, 2014; Peer review completed: May 7, 2014; Revised version
received and accepted: May 11, 2014; Published: May 14, 2014.