Fisheries · Undergoing Sex Reversal ... 227 Tagging Black Sea Bass for Sex Change Data Are female...
52
Fisheries Let’s Put on a Show! The Sturgeon Hero Atlantic Sturgeon and Robots Science, Stewardship, and Sturgeon Researching Scaphirhynchus Sturgeon Undergoing Sex Reversal “It’s The Habitat, Stupid!” The Man Who Named Fish Sick Fish, Sick River American Fisheries Society • www.fisheries.org VOL 38 NO 5 MAY 2013 03632415(2013)38(5) SEE INSERT
Transcript of Fisheries · Undergoing Sex Reversal ... 227 Tagging Black Sea Bass for Sex Change Data Are female...

Fisheries
Let’s Put on a Show!The Sturgeon HeroAtlantic Sturgeon and RobotsScience, Stewardship, and SturgeonResearching Scaphirhynchus SturgeonUndergoing Sex Reversal“It’s The Habitat, Stupid!”The Man Who Named FishSick Fish, Sick River
American Fisheries Society • www.fisheries.orgVOL 38 NO 5MAY 2013
03632415(2013)38(5)
SEE INSERT

Corporate Office 360.468.3375 [email protected]
Biological Services 360.596.9400 [email protected]
Northwest Marine Technology, Inc. www.nmt.us Shaw Island, Washington, USA
NMT Research Grants
Northwest Marine Technology (NMT) is pleased to continue our Innovative Research Grants to support fish and wildlife research and management. For 2013, the grants will have a total value of $15,000 in NMT’s products to be distributed to one or more recipients. Whether you are an existing customer or have never used our products before, we encourage you to apply. Applications are welcome from any country and from any agency or institution. A wide range of projects will be considered. We are particularly interested in supporting innovative projects that use our tags in a new way, or use the information gathered from a tagging project in a new way. The grants can be applied only toward the purchase or rental of any product sold by NMT, and have no cash value. Applications will be evaluated on the scientific merits of the research and the innovative use of our products. Grants will be awarded at the sole discretion of NMT. Recipients will be announced at the AFS Annual Meeting in Littlerock. For more details, please visit our website or contact Geraldine Vander Haegen ([email protected]; 360.709.6800).
Up to $15,000 in NMT’s equipment will be distributed to one or more recipients. Apply by Sep 10, 2013.
Visible Implant Elastomer TagsTM
Coded Wire TagsTM
Visible Implant Alpha TagsTM

Fisheries • Vol 38 No 5 • May 2013 • www.fisheries.org 193
228 AFS Genetics Section Members Attend Meeting on “Next Generation” DNA Sequencing for Fisheries Research in Southeast Asia
Marissa Jones
UNIT NEWS
NEW AFS MEMBERS 237
239 North American Journal of Fisheries Management, Volume 33, Number 2, April 2013
JOURNAL HIGHLIGHTS
Contents
Fisheries VOL 38 NO 5 MAY 2013
President’s Hook195 Meeting Our Meeting ResponsibilityHosting an annual meeting of between 1,500 and 4,000 attendees is no simple task.
John Boreman—AFS President
Fish Habitat Connections196 Habitat Connects Us All“It’s the habitat, stupid!” Famous words uttered by Nathaniel Shaw Bingham (1937–1998), a retired commercial fisher turned habitat activist in northern California, in response to a question about how to rebuild depleted fish stocks that were not responding to conventional harvest constraints.
Thomas E. Bigford
Guest Director’s Line235 The Susquehanna River—A Fishery in DeclineHow many diseased smallmouth are necessary for a river to be listed as an impaired water on the 303(d) list?
John A. Arway and Geoffrey Smith
COLUMNS
197 Status of White Sturgeon in the Lower Fraser River, British ColumbiaKey findings from the first 12 years of the Lower Fraser River White Sturgeon Monitoring and Assessment Program.
Troy C. Nelson, William J. Gazey, Karl K. English, and Marvin L. Rosenau
210 Shrinking the Haystack: Using an AUV in an Integrated Ocean Observatory to Map Atlantic Sturgeon in the Coastal OceanA mission demonstrating how underwater robots in an ocean observatory focuses the mosaic of coastal ocean habitats into Atlantic Sturgeon management insights.
Matthew J. Oliver, Matthew W. Breece, Dewayne A. Fox, Danielle E. Haulsee, Josh T. Kohut, John Manderson, andTom Savoy
FEATURES
Cover: Carlin Fenn weighs a sturgeon to monitor growth while Lucas Nelson looks on. Photo credit: Southern Illinois University Carbondale. 240 Fisheries Events
CALENDAR
217Rick Hansen (in boat) and FRSCS volunteer Fred Helmer near Mission, British Columbia, in 2004 with a mature White Sturgeon that has been tagged and measured prior to release back into the Fraser River. Photo credit: FRSCS.
221 Researching the Physiology and Culture of Scaphirhynchus SturgeonIn addition to needing to better understand the Scaphirhynchus sturgeon’s requirements for successful culture and management efforts, this extant genus of fish provides an important perspective into vertebrate evolution.
Brian C. Small and Elliott C. Kittel
RESEARCH
227 Tagging Black Sea Bass for Sex Change DataAre female Black Sea Bass undergoing sex reversal at small-er and smaller sizes to replace males caught by fishermen?
Mikaela Provost
STUDENT ANGLE
224 Constantine Samuel Rafinesque, 1783–1840Ever wondered about the people who named our fishes?
Daniel W. Coble
BIOGRAPHY
Corporate Office 360.468.3375 [email protected]
Biological Services 360.596.9400 [email protected]
Northwest Marine Technology, Inc. www.nmt.us Shaw Island, Washington, USA
NMT Research Grants
Northwest Marine Technology (NMT) is pleased to continue our Innovative Research Grants to support fish and wildlife research and management. For 2013, the grants will have a total value of $15,000 in NMT’s products to be distributed to one or more recipients. Whether you are an existing customer or have never used our products before, we encourage you to apply. Applications are welcome from any country and from any agency or institution. A wide range of projects will be considered. We are particularly interested in supporting innovative projects that use our tags in a new way, or use the information gathered from a tagging project in a new way. The grants can be applied only toward the purchase or rental of any product sold by NMT, and have no cash value. Applications will be evaluated on the scientific merits of the research and the innovative use of our products. Grants will be awarded at the sole discretion of NMT. Recipients will be announced at the AFS Annual Meeting in Littlerock. For more details, please visit our website or contact Geraldine Vander Haegen ([email protected]; 360.709.6800).
Up to $15,000 in NMT’s equipment will be distributed to one or more recipients. Apply by Sep 10, 2013.
Visible Implant Elastomer TagsTM
Coded Wire TagsTM
Visible Implant Alpha TagsTM
230 Gary D. “Dox” Doxtater231 John D. (Jack) McIntyre
IN MEMORIAM
233 Booth Reservation Form234 Continuing Education Program
LITTLE ROCK MEETING UPDATE
217 Rick Hansen: Sturgeon HeroThe White Sturgeon needed rescuing. To the rescue: Rick Hansen—one of our newest AFS members. Famous for his Man In Motion World Tour—as well as one of the torchbear-ers who brought the flame into the stadium to light the torch in the 2010 Winter Olympics—Rick has set out to save the White Sturgeon in the lower Fraser River in British Columbia.
INTERVIEW
Fisheries • Vol 38 No 5 • May 2013• www.fisheries.org 194
MEMBERSHIP TYPE/DUES (Includes print Fisheries and online Membership Directory)
Developing countries I (Includes online Fisheries only): N/A NORTH AMERICA; _____$10 OTHERDeveloping countries II: N/A NORTH AMERICA; _____$35 OTHERRegular: _____$80 NORTH AMERICA; _____$95 OTHERStudent (includes online journals): _____$20 NORTH AMERICA; _____$30 OTHERYoung professional (year graduated): _____$40 NORTH AMERICA; _____$50 OTHERRetired (regular members upon retirement at age 65 or older): _____$40 NORTH AMERICA; _____$50 OTHERLife (Fisheries and 1 journal): _____$1, 737 NORTH AMERICA; _____$1737 OTHERLife (Fisheries only, 2 installments, payable over 2 years): _____$1,200 NORTH AMERICA; _____$1,200 OTHER: $1,200Life (Fisheries only, 2 installments, payable over 1 year): _____ $1,000 NORTH AMERICA; _____$1,000 OTHER
JOURNAL SUBSCRIPTIONS (Optional)
Transactions of the American Fisheries Society: _____$25 ONLINE ONLY; _____$55 NORTH AMERICA PRINT; _____$65 OTHER PRINT North American Journal of Fisheries Management: _____$25 ONLINE ONLY; _____$55 NORTH AMERICA PRINT; _____$65 OTHER PRINT North American Journal of Aquaculture: _____$25 ONLINE ONLY; _____$45 NORTH AMERICA PRINT; _____$54 OTHER PRINT Journal of Aquatic Animal Health: _____$25 ONLINE ONLY; _____$45 NORTH AMERICA PRINT; _____$54 OTHER PRINT Fisheries InfoBase: ____$25 ONLINE ONLY
Recruited by an AFS member? yes noName
EMPLOYERIndustryAcademiaFederal gov’tState/provincial gov’tOther
FisheriesAmerican Fisheries Society • www.fisheries.org
EDITORIAL / SUBSCRIPTION / CIRCULATION OFFICES5410 Grosvenor Lane, Suite 110•Bethesda, MD 20814-2199(301) 897-8616 • fax (301) 897-8096 • [email protected]
The American Fisheries Society (AFS), founded in 1870, is the oldest and largest professional society representing fisheries scientists. The AFS promotes scientific research and enlightened management of aquatic resources for optimum use and enjoyment by the public. It also encourages comprehensive education of fisheries scientists and continuing on-the-job training.
Fisheries (ISSN 0363-2415) is published monthly by the American Fisheries Society; 5410 Grosvenor Lane, Suite 110; Bethesda, MD 20814-2199 © copyright 2013. Periodicals postage paid at Bethesda, Maryland, and at an additional mailing office. A copy of Fisheries Guide for Authors is available from the editor or the AFS website, www.fisheries.org. If requesting from the managing editor, please enclose a stamped, self-addressed envelope with your request. Republication or systematic or multiple reproduction of material in this publication is permitted only under consent or license from the American Fisheries Society. Postmaster: Send address changes to Fisheries, American Fisheries Society; 5410 Grosvenor Lane, Suite 110; Bethesda, MD 20814-2199. Fisheries is printed on 10% post-consumer recycled paper with soy-based printing inks.
2013 AFS MEMBERSHIP APPLICATIONAMERICAN FISHERIES SOCIETY • 5410 GROSVENOR LANE • SUITE 110 • BETHESDA, MD 20814-2199
(301) 897-8616 x203 OR x224 • FAX (301) 897-8096 • WWW.FISHERIES .ORG
PAID:
NAME
Address
City
State/Province ZIP/Postal Code
CountryPlease provide (for AFS use only)Phone
Fax
PAYMENTPlease make checks payable to American Fisheries Society in U.S. currency drawn on a U.S. bank, or pay by VISA, MasterCard, or American Express.
_____Check
_____American Express
Account #______________________________________
Exp. Date _____________
Signature ______________________________________
_____VISA
_____MasterCard
All memberships are for a calendar year. New member applications received Janu-ary 1 through August 31 are processed for full membership that calendar year (back issues are sent). Applications received September 1 or later are processed for full membership beginning January 1 of the following year.
AFS OFFICERSPRESIDENTJohn Boreman
PRESIDENT ELECTRobert Hughes
FIRST VICE PRESIDENTDonna L. Parrish
SECOND VICE PRESIDENTRon Essig
PAST PRESIDENTWilliam L. Fisher
EXECUTIVE DIRECTORGhassan “Gus” N. Rassam
FISHERIES STAFFSENIOR EDITORGhassan “Gus” N. Rassam
DIRECTOR OF PUBLICATIONSAaron Lerner
MANAGING EDITORSarah Fox
EDITORSCHIEF SCIENCE EDITORJeff Schaeffer
SCIENCE EDITORSMarilyn “Guppy” Blair Jim BowkerMason BryantSteven R. ChippsSteven CookeKen CurrensAndy DanylchukMichael R. DonaldsonAndrew H. FayramStephen FriedLarry M. GigliottiMadeleine Hall-ArborAlf Haukenes
DUES AND FEES FOR 2013 ARE:$80 in North America ($95 elsewhere) for regular members, $20 in North America ($30 elsewhere) for student members, and $40 ($50 elsewhere) for retired members.
Fees include $19 for Fisheries subscription.
Nonmember and library subscription rates are $174.
Jeffrey E. HillDeirdre M. KimballJim LongDaniel McGarveyRoar SandoddenJesse TrushenskiUsha Varanasi Jack E. WilliamsJeffrey Williams
BOOK REVIEW EDITORFrancis Juanes
ABSTRACT TRANSLATIONPablo del Monte Luna

Fisheries • Vol 38 No 5 • May 2013 • www.fisheries.org 195
Tours, Transportation, and Information; Spawning Run; and Welcoming and Protocol. Darrell informed me that he has about 70 people volunteering for these committees from the Arkansas chapter and an-ticipates using many more students and other volun-teers at the meeting itself. Hosting an annual meeting is more like orchestrating an epic Cecil B. DeMille production than Mickey Rooney and Judy Garland deciding on the spur of the moment to “put on a show.”
The amount of work involved in hosting an AFS annual meeting seems daunting, as is evidenced by the difficulty se-curing bids from chapters in recent years. With all of the work involved and the number of volunteers necessary to host a suc-cessful meeting, why would a chapter submit a bid? The obvi-ous answer is because of the potential monetary gain. A host chapter gets 20% of the net, which translated to about $20,000 for the Minnesota chapter’s hosting of the 2012 meeting in St. Paul. However, there are other reasons that are perhaps more important.
As an AFS officer for the past four years, I have heard com-plaints from a number of state agency employees about their in-ability to obtain permission to attend scientific meetings outside of their state. When state (and federal) budgets are cut to meet spending targets, travel is usually one of the first line items on the block, and out-of-state travel to scientific meetings is often deemed nonessential. By hosting an AFS annual meeting, a state AFS chapter (and through it the state fisheries agency) has an opportunity to bring a premier international fisheries conference into their state, thus enabling chapter members, state employ-ees, and students at their state universities to take advantage of networking with other scientists and students, enrolling in con-tinuing education courses, and attending the trade show without incurring prohibitive travel costs.
If you plan to attend the 2013 AFS annual meeting, and I hope you will, please remember to personally thank the vol-unteers who have devoted much of their time and energy in the past four years to ensuring that your expectations would be met. You may even consider volunteering to judge a student oral or poster presentation, run a projector for a session, or help out with other meeting logistics. If you decide not to attend the meeting in Little Rock, I’m sure that Darrell and his 70+ all-volunteer team won’t take it personally, but I will.
COLUMNPresident’s Hook
AFS President Boreman may be contacted at: [email protected]
Meeting Our Meeting ResponsibilityJohn Boreman, President
One of the perks of being president-elect and then presi-dent of the American Fisheries Society (AFS) is representing the society’s governance team at division, chapter, and section meetings, as well as at meetings of other fisheries societies. In all cases, the recognition and involvement of students and the overall quality of presentations have been impressive. In many instances I have also had a chance to peek behind the curtain to see how the meetings were organized. The communications, coordination, undertaking of tasks, and general enthusiasm of the meeting volunteers are amazing. The AFS annual meeting is no different; hosting a meeting of between 1,500 and 4,000 potential attendees is no simple task.
Preparations for an AFS annual meeting begin four years in advance of the meeting date. Bids to host the meeting, usu-ally made by AFS chapters with support from their divisions, are submitted to the AFS Time and Place Committee (currently chaired by Amanda Rosenberger). The bids must essentially guarantee a venue for the meeting that can support the antici-pated number of attendees and would be available during the usual time frame in which the annual meetings are conducted (mid-August to mid-September). The venue needs to include adequate meeting facilities, a sufficient number of hotel rooms at or near the meeting at a reasonable cost, and a location that is not too remote. A successful bid may also include provisions for lower cost student housing, day care options, and field trips to local attractions. The Time and Place Committee ranks the bids they receive and makes a recommendation to the incoming governing board, which makes the final decision. If no satisfac-tory bids are received, then AFS staff work with the governing board to select a suitable meeting venue.
After a venue for the annual meeting is selected, the real work begins. The AFS Procedures Manual (http://fisheries.org/docs/about_procedure.doc) contains general guidance for what needs to be done, as well as a suggested timeline, in order to host an annual meeting. The host division or chapter names a general meeting chairperson who establishes commit-tees to handle the various aspects of the meeting. Darrell Bow-man, the general meeting chairperson named by the Arkansas chapter for the upcoming meeting in Little Rock (September 8–12, 2013—afs2013.com), established the following positions and committees to help organize the meeting: AFS Liaison; Budget and Finance; Fundraising; Raffle; Registration; Trade Show; Banquet, Social Activities, and Entertainment; Green (eco-friendly); Breaks; Students; Hospitality (Companion Pro-gram); Child Care; Accommodations; Audio Visual Aids; Com-munications; Printing; Signs; Publicity and Media Relations;
A host chapter gets 20% of the net, which translated to about $20,000 for the Minnesota chapter’s hosting of the 2012 meeting in St. Paul.

Fisheries • Vol 38 No 5 • May 2013• www.fisheries.org 196
Welcome to a new column on fish habitat—those gorgeous wetlands, estuaries, gravel beds, mudflats, and waters that support fish and give
the American Fisheries So-ciety reason to exist. Without habitat there would be no fish, and without fish our reading habits would shift from the rivet-ing pages of Transactions to the not-so-slimy Limnology and Oceanography. In keeping with some vegetated wetlands, this will be an ephemeral column, planned for the coming year be-fore yielding to the next priority. The editors—Sarah Fox on behalf of this magazine, and me on behalf of a series of subject-matter experts—have mapped a dozen articles focused on the full breadth of this topic that connects us all.
This opportunity is well timed. Certainly habitat has been slow to catch on even within a profession where everyone should have at least skimmed an ecology textbook. And now that those ecological lessons are morphing into economic real-ity, it is essential that we as professionals understand the central role of habitat in all that we do.
So what is habitat, and why is it important to AFS members and the fish that bond us? Habitat is the biogeophysical platform on which “fish” depend. That relationship often changes over a lifetime, but habitat is what fish need to survive as individuals, thrive as a healthy population, and provide value to people or in connection with broader ecosystems.
Habitat is experiencing a bit of a resurrection. The impor-tance of “place” is not new. We all know fish need a home. The new perspectives put that home in a landscape or seascape con-text, in an ecosystem shared with other species, in context with economic value and jobs. This trend has been evolving over the course of years. At the AFS conference in Hartford in 1998, Lee Benaka organized a special symposium on “Fish Habitat: Essential Fish Habitat and Rehabilitation” (Benaka 1999). That was followed by creation of the National Fish Habitat Action Plan (now the National Fish Habitat Partnership; fishhabitat.org) in 2006. In 2009, the AFS Fish Habitat Section was created. And building on that theme, in 2011 the NOAA announced the Habitat Blueprint as a rallying theme for improving the status
COLUMNFish Habitat Connections
Habitat Connects Us AllThomas E. BigfordOffice of Habitat Conservation, NOAA/National Marine Fisheries Service, Silver Spring, MD, 20910; AFS member of Fish Habitat Section, Marine Fish Section, and Estuaries Section; current member and past chair of AFS Resource Policy Committee. E-mail: [email protected]
of protected and harvested species (habitat.noaa.gov/habitat-blueprint). Habitat is now a common theme in major fishery management arenas, including Managing Our Nation’s Fisher-ies 3 on May 7–9, 2013, where habitat is one of four primary threads (www.cvent.com/events/managing-our-nation-s-fish-eries-3/event-summary-94ddf325198f4501996ccc62aa396aa2.aspx), and a Fisheries Forum on June 26–29, 2013, on advanced ecosystem-based approaches (fisheriesforum.org/east-coast- forum-2013).
Over the coming months, this column will visit fish habitat from several distinct perspectives. We’ll cover the trends that have fueled what I optimistically refer to as the “habitat resur-rection.” Those changes, both historical and on-going, reveal science gaps and resource management challenges. Our history also informs us about our ability to communicate within our field and to influential stakeholders, such as Congress, about the pieces of this puzzle, including protection and restoration, science and management, small versus larger scale, short and longer term, and so much more.
A common currency in these habitat columns is healthy fish, both individuals and populations. “Habitat” encompasses a range of issues and roles for AFS members and others as we strive for healthy fish stocks. The word and its many meanings convey a depth and breadth that is both daunting and opportu-nistic. We’ll probe that in these columns.
There’s a habitat role for nearly every AFS member, unit, and event. The final program for AFS (Little Rock, AR; Sep-tember 8–12, 2013) will no doubt include plenary talks, special symposia, and technical sessions that reflect the issues you’ll see in future columns. Let’s use the next year to rally around habitat as a unifying theme. Success on the habitat front should trans-late into success in each of our special fields and, ultimately, for AFS and the fish themselves. So get started, or continue to toil, and watch for the second column in the June issue.
REFERENCE
Benaka, L. 1999. Symposium 22: Proceedings of the Sea Grant sym-posium “Fish Habitat: Essential Fish Habitat and Rehabilitation,” August 26-27, 1998, in Hartford, Connecticut. American Fisheries Society, Bethesda, MD.

Fisheries • Vol 38 No 5 • May 2013 • www.fisheries.org 197
FEATURE
Status of White Sturgeon in the Lower Fraser River, British ColumbiaTroy C. NelsonFraser River Sturgeon Conservation Society; TCNelson Consulting, 282 Avalon Rd., Sheldon, Queensland 4157, Australia. E-mail: [email protected]
William J. GazeyW.J. Gazey Research, 1214 Camas Ct., Victoria, BC V8X 4R1, Canada
Karl K. EnglishLGL Limited Environmental Research Associates, 9768 Second St., Sidney, BC V8L 3Y8, Canada
Marvin L. RosenauFish Wildlife and Recreation Program, British Columbia Institute of Technology, 3700 Willingdon Ave., Burnaby, BC V5G 3H2, Canada
Estatus del esturión blanco en el bajo Río Frasier, Columbia BritánicaRESUMEN: en términos generales, los stocks de esturi-ones (Acipenseridae) alrededor del mundo están reducién-dose, e incluso varias poblaciones se encuentran cerca de ser extirpadas. Una especie importante, el esturión blanco (Acipenser transmontanus), cuenta con poblaciones re-productoras que se distribuyen a lo largo de tres cuencas hidrológicas del noroeste americano (ríos Sacramento, Co-lumbia y Fraser), sin embargo ha experimentado reduccio-nes poblacionales en la última década. En 2003, el Comité sobre el Estatus de la Vida Salvaje en Peligro, en Canadá, designó a las seis poblaciones de esturión blanco el estado de “amenazadas”. La Sociedad para la Conservación del Esturión en el Río Fraser desarrolló un programa de evalu-ación y monitoreo con el fin de apoyar las iniciativas de recuperación del esturión en el bajo Río Fraser (Columbia Británica). Se desarrolló un modelo poblacional descrip-tivo para estimar anualmente, y de manera confiable, el tamaño de la población por grupo de talla y edad y por locación, sobre la base de datos de captura-recaptura col-ectados por voluntarios debidamente entrenados. La po-blación estimada para el año 2011 (40-279 cm de longitud furcal) fue de 44,713 (95% de confianza 42,634–46,792). El análisis del tamaño por grupo indica que la reducción de la abundancia ha sido más importante en los juveniles de esturión de menos de 100 cm de longitud furcal. El dec-remento del reclutamiento puede ser el resultado de varios factores que incluyen la destrucción del hábitat de desove y desarrollo de los primeros estadios de vida de la especie; poca abundancia de adultos desovadores debido a la pesca en los ríos; y/o los impactos que tienen la reducción de alimento y otros desbalances ecológicos en los adultos y en los juveniles.
ABSTRACT: Sturgeon (Acipenseridae) stocks worldwide are generally in decline, with many populations close to extirpation. One prominent species, the White Sturgeon (Acipenser trans-montanus), with spawning populations distributed throughout three large, western North American watersheds (the Sacra-mento, Columbia, and Fraser rivers), has experienced popu-lation declines in the past decade. In 2003, the Committee on the Status of Endangered Wildlife in Canada designated all six populations of White Sturgeon in Canada “endangered.” To as-sist sturgeon recovery initiatives in the lower Fraser River (Brit-ish Columbia), a stewardship-based monitoring and assessment program was developed by the Fraser River Sturgeon Conser-vation Society. A descriptive population model was developed to provide reliable annual population estimates by size/age group and location, based on tag release and recapture data collected by trained volunteers. As of January 2011, the population esti-mate (from 40- to 279-cm fork length) was 44,713 (95% confi-dence level 42,634–46,792). Group size analyses suggest that abundance decreases have been greatest for juvenile sturgeon under 100-cm fork length. Recruitment decline may be the result of several factors, including destruction of important spawning and early life history rearing habitats; fewer successful adult spawners due to in-river fisheries; and/or impacts of reduced food supply and ecological imbalances on both early life and adult stages.
INTRODUCTION
Since the early 1900s, White Sturgeon (Acipenser trans-montanus) has been identified as a species of concern in British Columbia (BC; Lane 1991; Echols 1995). From 1995 to 1999, the BC government conducted studies to collect biological and ecological information on White Sturgeon throughout the Fraser River watershed (McKenzie 2000). However, information pro-duced from that study regarding distribution and abundance in the lower Fraser River was viewed as preliminary due to inad-
equate sample sizes. Furthermore, the 1995–1999 study did not include any assessments of White Sturgeon abundance or dis-tribution downstream of the Mission Bridge, an extensive area that includes estuarine habitats and over 80 km of the Fraser River mainstem, plus additional sturgeon-bearing waters in the North Arm and Middle Arm of the Fraser River and Pitt River/Pitt Lake (Figure 1). The lack of reliable population estimates and information on seasonal distribution and migration patterns for White Sturgeon in the lower Fraser River and estuary were acknowledged as serious information gaps by provincial fisher-ies managers (McKenzie 2000).
In response to these information needs, a proposal from the Fraser River Sturgeon Conservation Society (FRSCS), a

Fisheries • Vol 38 No 5 • May 2013• www.fisheries.org 198
not-for-profit registered society with a volunteer-based board of directors, was put forth to the BC provincial government in November 1999 to develop a more comprehensive and scientifi-cally rigorous White Sturgeon population estimate for the lower Fraser River and estuary (Nelson et al. 1999). The two key com-ponents of this proposal were (1) the ability of the FRSCS to successfully secure a large volunteer effort from the public to increase both the volume and geographic coverage of samples and (2) the program’s scientifically and technically rigorous study design. The Lower Fraser River White Sturgeon Moni-toring and Assessment Program began in April 2000 and, as a result of continued success in achieving program objectives, has continued into 2013.
The annual primary objectives of the program are to
1. obtain a population estimate of subadult and adult White Sturgeon in the lower Fraser River, with an emphasis on the section downstream of Hope (Figure 1);
2. produce reliable information regarding seasonal abundance of White Sturgeon, by location, in the lower Fraser River;
3. ascertain seasonal migration and movement patterns of White Sturgeon in the lower Fraser River; and
4. increase public awareness regarding the conservation and preservation of White Sturgeon in British Columbia.
The science-based stewardship program has relied greatly on the in-kind efforts and contributions from angling guides; recreational, commercial, and Aboriginal fishermen; test fishery and enforcement personnel; students and academics; and vari-ous fishery monitors (Photo 1). Volunteers from each of these sectors were trained to perform all sturgeon sampling activities and record, secure, and transfer data (to the field program man-
ager). By January 2012, volunteers had sampled 92,501 stur-geon for the presence of a tag, applied tags to 50,134 sturgeon, and documented 37,179 recapture events of tags applied by the FRSCS program (Nelson et al. 2012).
History of Lower Fraser River White Sturgeon
White Sturgeon are part of the historical fabric of British Columbia. First Nations peoples of the Fraser River have songs and legends associated with the ancient fish, which was not only a welcome food source but one that was available during the en-tire year; many other food sources, such as salmon (Oncorhyn-chus sp.) and Pacific Eulachon (Thaleichthys pacificus), were seasonal. The Fraser River is named after Simon Fraser, the first European explorer to navigate the middle and lower mainstem of the river in 1808; in his journal he wrote that during his first
Figure 1. Map of the study area for the Lower Fraser River White Sturgeon Monitoring and Assessment Pro-gram, 2000–2011, and its location within the Fraser River watershed and British Columbia. Included are the locations of the four sampling regions (A–D) used in the population analyses.
Photo 1. This mature White Sturgeon (338 cm FL) was tagged (PIT tag), sampled, and released by FRSCS volunteers on September 19, 2005, at rkm 82 of the Fraser River near Mission, British Columbia. Thirteen months later, on October 16, 2006, this fish was subsequently recaptured (identified by PIT tag number), sampled, and released by a FRSCS volun-teer at rkm 85. Photo: Curtis Besse, FRSCS.

Fisheries • Vol 38 No 5 • May 2013 • www.fisheries.org 199
encounter with “friendly” Indians near Yale, he and his team of explorers were offered sturgeon meat—undoubtedly White Sturgeon (Lamb 1960).
Intensive commercial fishing pressure in the late 1800s to early 1900s reduced the abundance of White Sturgeon in the lower Fraser River to dangerously low levels (Semakula and Larkin 1968; Echols 1995). Since that time, lower Fraser River White Sturgeon have faced numerous obstacles on the path to population recovery (Committee on the Status of Endangered Wildlife in Canada [COSEWIC] 2003; Hatfield et al. 2004); these include (1) critical habitat degradation/reduction; (2) a reduction in overall food availability, including all salmon spe-cies and Pacific Eulachon (Hay et al. 1999); (3) harvest fisher-ies (commercial, recreational, First Nations) and illegal fishing/poaching; and (4) freshwater and estuarine pollution (Nelson and Levings 1995; Fraser River White Sturgeon Working Group 2005). In 1993 and 1994, an unexplained die-off of over 30 large, mature White Sturgeon occurred in the lower Fraser River over a relatively short period of time. The initial response to implementing population protection and recovery initiatives came from Fraser River First Nations, who called on resource management agencies to eliminate all directed harvest of White Sturgeon in British Columbia. In 1994, the province changed the recreational fishing regulations for sturgeon from limited retention to catch and release (nonretention), and all commercial fisheries (managed federally by Fisheries and Oceans Canada) were required to release all incidentally caught sturgeon. Also in 1994, First Nations imposed voluntary moratoriums on di-rected (Aboriginal) White Sturgeon fisheries and encouraged the live release of White Sturgeon intercepted as bycatch during Aboriginal salmon fisheries. Due to a lack of baseline infor-mation regarding White Sturgeon distribution and abundance in the Fraser River, a watershed-wide research and assessment program was initiated by the provincial government in 1995 (Echols 1995).
In 2003, COSEWIC, in collaboration with the BC Ministry of Environment, concluded a review of the status of White Stur-geon in Canada. The COSEWIC review identified a total of six distinct stocks of White Sturgeon (all of which are in British Co-lumbia) based on both geographic (watershed) separation and genetic distinction: (1) Kootenay River; (2) Columbia River; (3); Nechako River; (4) upper Fraser River; (5) middle Fraser River; and (6) lower Fraser River. Based on numerous crite-ria including abundance and stock status (for each individual stock), the COSEWIC review designated all six stocks of White Sturgeon in Canada as “endangered” (COSEWIC 2003). The lower Fraser River population of White Sturgeon is the largest, by number, of any of the Canadian populations and is the only Canadian population with direct access to the marine environ-ment. Specific threats to the populations identified in the COSE-WIC review included (1) habitat degradation/loss as a result of dams, impoundments, channelization, dyking, and pollution; (2) population limiting as a result of illegal fishing and incidental catch; and (3) additional genetic, health, and ecological risks to wild populations from the developing commercial aquaculture industry (COSEWIC 2003; Hatfield et al. 2004).
FIELD AND ANALYTICAL METHODS
Sturgeon Capture and Handling Procedures
Program staff trained all volunteers who contributed to the tag and recapture database. Volunteers were trained in the field, typically on their own boats, including recreational fishing boats, angling guide boats, First Nations and commercial fishing boats, enforcement (patrol) boats, and test fishery vessels. The sampling and tagging of at least one sturgeon was required to fulfill the training requirements; in most cases, several sturgeon were captured and tagged during training exercises. Volunteers were trained to complete a standard sampling data sheet, scan captured sturgeon for the presence of a passive integrated tran-sponder (PIT) tag, record all tag recapture data (from any PIT tag or external tag), apply new PIT tags, take fork length (FL) and girth measurements, revive and release sturgeon, and se-cure and transfer data. Sturgeon capture, handling, and sampling procedures, designed to minimize stress and injury, were devel-oped in partnership with provincial fishery managers, and vol-unteers were trained to apply those procedures when handling live sturgeon in the field. Volunteers who captured sturgeon by angling were asked to use adequate fishing equipment (strong rods and reels, line test of at least 100-pound breaking strength) and to sample all sturgeon over 1.5 m FL in the water without lifting the fish from the water. Juvenile and subadult sturgeon (less than 1.5 m in length) were placed in a custom sturgeon sling (much like a stretcher) that contained water and supported the fish being sampled. For commercial and First Nations net fishermen involved with the program, emphasis was placed on exercising extreme care when extricating sturgeon from gill nets (including cutting of the net, if needed) and efficient sampling practices to ensure that captured sturgeon were returned to the water as quickly as possible. From 2000 to 2005, some First Nations fishermen, in cooperation with the FRSCS’ Lower Fra-ser River First Nations White Sturgeon Stewardship Program, placed captured sturgeon in floating enclosures (provided by the FRSCS) anchored in close proximity to the fishing locations. Program personnel were responsible for removing and sampling sturgeon from the enclosures on a daily basis.
Documentation of Capture Location
The study area was divided into four sampling regions (two in the tidal section of the river below the Mission Bridge and two upstream; Figure 1). Separate population estimates were produced by sampling region. A simple mapping system was established to assist volunteers in documenting capture loca-tions to the nearest 0.5 river kilometer (rkm). Waterproof maps, delineated with river kilometers, were provided to all volun-teers as part of the tagging equipment kit. Documentation of sturgeon capture location at this level (0.5 rkm) was important to confirm sturgeon presence at specific locations and habitat types by season.
In order to document the general location of applied angler effort and catch, a series of sampling zones (adjacent sections of the river) was established (Table 1). Zone boundaries were

Fisheries • Vol 38 No 5 • May 2013• www.fisheries.org 200
established based mainly on geographical elements (such as channel intersections, bridge crossings, and tributary conflu-ences). Each zone included a unique set of river kilometers and was unique to a specific sampling region. Zones were used in the population model to redistribute available tagged sturgeon for capture for the purpose of population size estimates (see Population Estimation section).
Tagging
The tags used for this study were PIT tags, distributed by Biomark Inc. (Boise, ID). These tags were injected beneath the skin of sturgeon with a specialized handheld syringe and hy-podermic needle. PIT tag types TX1400L and BIO12.A.02 (12 mm long) and TX1405L (14 mm long) were used in this study. These glass-bodied tags are 2 mm in diameter and emit a unique 10-digit alphanumeric code at a frequency of 125 kHz. PIT tags were kept in small glass or plastic jars that contained ethyl alco-hol for sterilization purposes. Hypodermic needles used to apply the tags were also kept in small jars that contained ethyl alcohol.
Sturgeon were tagged with PIT tags inserted at a location just posterior to the bony head plate, left of the dorsal line, near the first dorsal scute. This PIT tag insertion location, referred to as the “head” location, has been used by sturgeon researchers in both Oregon and Washington, and measured tag retention has been close to 100% (T. Rien, Oregon Department of Fish and Game, personal communication). Previous sturgeon tagging studies in the Fraser River watershed applied PIT tags in body locations other than the head location (the dorso-lateral area or body cavity). Sturgeon recaptured during this study that had a PIT tag present in an area of the body other than the head loca-tion received an additional tag in the head location. Tag–recap-ture data for all tags, regardless of tag type or body location, were recorded and entered in the recapture database.
The tag readers (scanners) used for the program were the handheld model MPR (distributed by Biomark Inc.) and the AVID Power Tracker (AVID Canada distributed by PETIDCO, Calgary, Alberta). The 125-kHz readers were battery powered and displayed the tag numbers on a small screen. PIT tags were
detected by the reader at a maximum distance of approximately 15 cm; an audible beep was emitted by the reader when a tag was detected. When a captured sturgeon was ready for sam-pling, a reader was activated and slowly passed over the length of the sturgeon, close to the body. If a tag was detected in the head location, the number was recorded on a data sheet as a head recapture. If a PIT tag was detected in any other location on the sturgeon, the number was recorded and a comment was made regarding the physical location of the tag, and a new PIT tag was applied in the head location. The readers were also used to scan PIT tags prior to tag application (so that the tag num-ber could be recorded) and, once inserted, to confirm the active status and number of the applied PIT tag prior to release of the sturgeon.
Tag Recoveries
An essential element of the population model used in this program was the positive identification and documentation of both tagged and nontagged sturgeon in the sample. PIT tag read-ers were used exclusively to determine the presence of a PIT tag. The only sturgeon used in the mark–recapture population analyses were sturgeon that had been properly scanned for the presence of a PIT tag. In addition, the only recaptures used in the analyses were tags applied in the head location by this pro-gram.
Other sturgeon tagging projects in the Fraser River, the Co-lumbia River, and elsewhere have applied both PIT and various types of external tags to sturgeon. Volunteers were trained to record all PIT tag and external tag information observed; for external tags, they recorded the tag type, color, attachment lo-cation, and all legible text/numbers. Recapture data from tags outside this program were entered into the core program da-tabase, and in many cases original release data were obtained from respective research programs.
Biosampling
All sturgeon included in the sampling program were mea-sured with a flexible measuring tape for
1. fork length to the nearest 0.5 cm, measured from tip of snout to fork in tail, measured along the side (lateral line); and
2. girth to the nearest 0.5 cm, measured around the body with the tape placed beneath the pec-toral fins at a point just posterior to the insertion point of the pectoral fins.
The general condition of each sturgeon was assessed prior to tagging, and a record was made of the condition of each fish at the time of release (ranking of 1 to 5: 1 = vigorous, no bleeding; 2 = vigorous, bleeding; 3 = lethargic, no bleeding; 4 = lethargic, bleeding; and 5 = dead). In addition, all visible wounds, scars, and
Table 1. Sampling regions and zones used for population estimation of White Sturgeon, 2000–2011.
Region Zone River kilometer From To
A Sa 0-25 Garry Point (Steveston) Eastern Annacis Island
B 3, 5b 26-56.5 & P0-P4 Eastern Annacis Island Albion Ferry Crossing
B 6, 7c 56.6-78 Albion Ferry Crossing Mission Bridge
C 8 79-93 Mission Bridge Mouth of Sumas River
C 10 H0-H19 Confluence Fraser River Outlet of Harrison Lake
C 12 94-122 Mouth of Sumas River Agassiz Bridge
C 13 123-158 Agassiz Bridge Hwy 1 Bridge (Hope)
D 14 159-187 Hwy 1 Bridge (Hope) Lady Franklin Rock (Yale)
a Zone S is the Main (South) Arm including Canoe Pass. b Zone 5 includes the lower 4 km of the Pitt River, from the Fraser mainstem to the Hwy 7 Bridge. c Zone 7 is the lower 2 km of the Stave River, downstream of the dam.
Fisheries • Vol 38 No 5 • May 2013 • www.fisheries.org 201
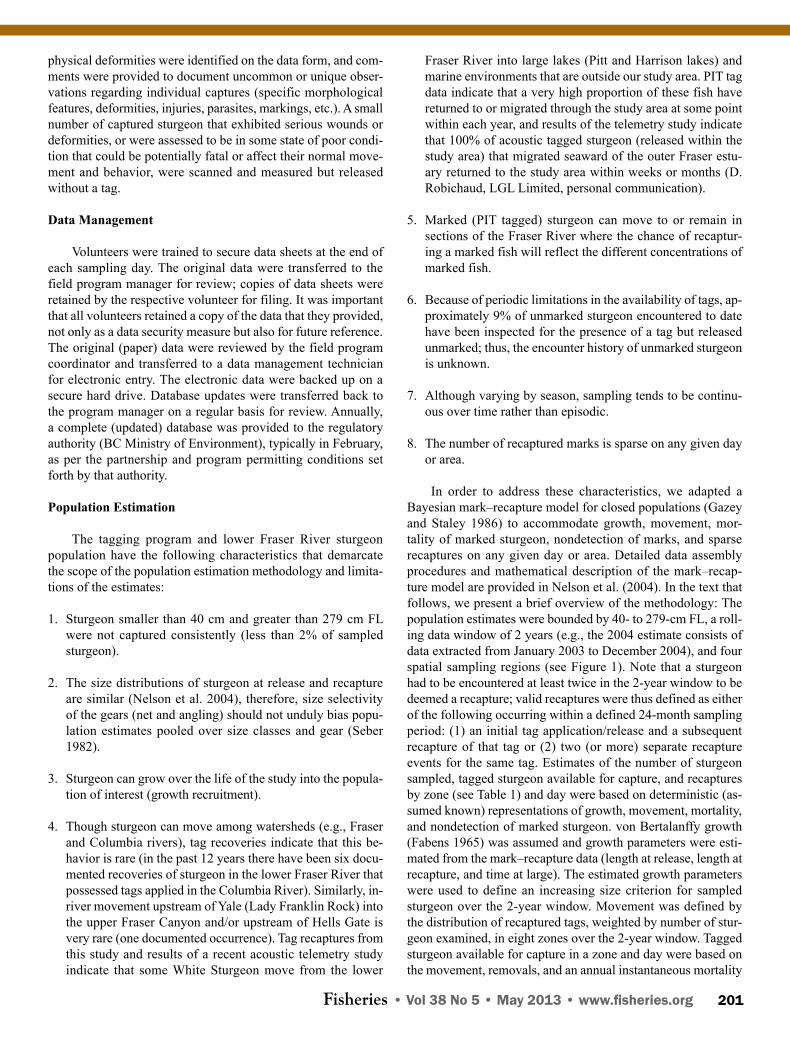
physical deformities were identified on the data form, and com-ments were provided to document uncommon or unique obser-vations regarding individual captures (specific morphological features, deformities, injuries, parasites, markings, etc.). A small number of captured sturgeon that exhibited serious wounds or deformities, or were assessed to be in some state of poor condi-tion that could be potentially fatal or affect their normal move-ment and behavior, were scanned and measured but released without a tag.
Data Management
Volunteers were trained to secure data sheets at the end of each sampling day. The original data were transferred to the field program manager for review; copies of data sheets were retained by the respective volunteer for filing. It was important that all volunteers retained a copy of the data that they provided, not only as a data security measure but also for future reference. The original (paper) data were reviewed by the field program coordinator and transferred to a data management technician for electronic entry. The electronic data were backed up on a secure hard drive. Database updates were transferred back to the program manager on a regular basis for review. Annually, a complete (updated) database was provided to the regulatory authority (BC Ministry of Environment), typically in February, as per the partnership and program permitting conditions set forth by that authority.
Population Estimation
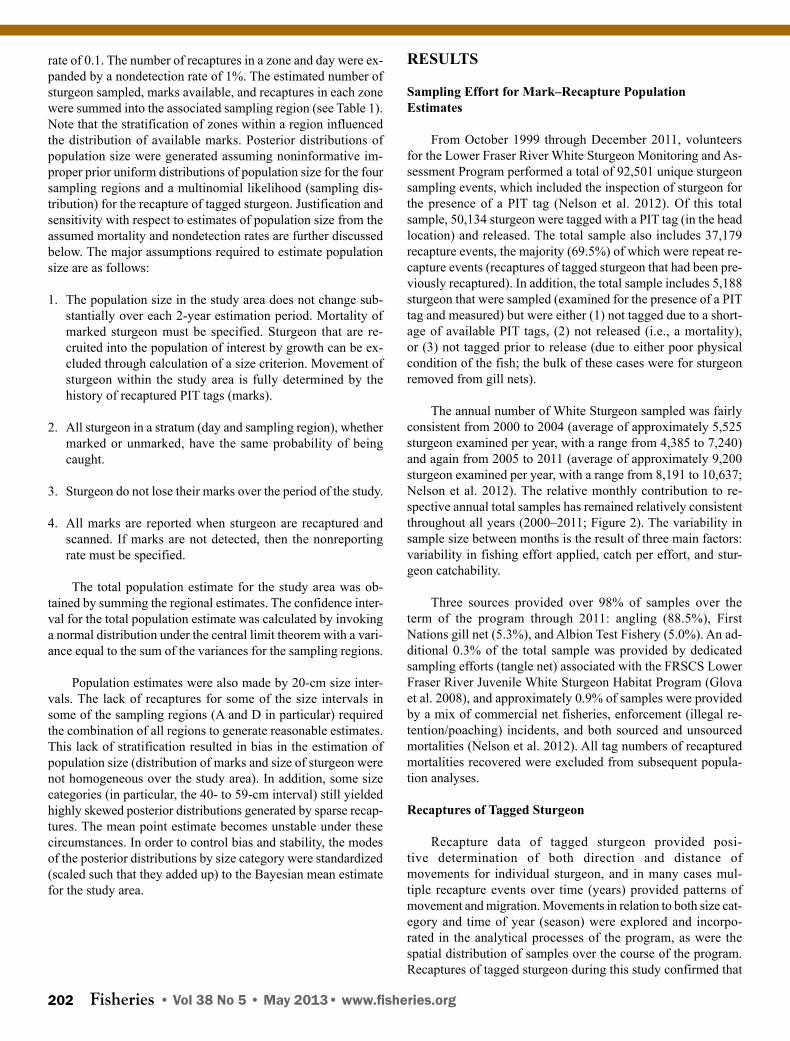
The tagging program and lower Fraser River sturgeon population have the following characteristics that demarcate the scope of the population estimation methodology and limita-tions of the estimates:
1. Sturgeon smaller than 40 cm and greater than 279 cm FL were not captured consistently (less than 2% of sampled sturgeon).
2. The size distributions of sturgeon at release and recapture are similar (Nelson et al. 2004), therefore, size selectivity of the gears (net and angling) should not unduly bias popu-lation estimates pooled over size classes and gear (Seber 1982).
3. Sturgeon can grow over the life of the study into the popula-tion of interest (growth recruitment).
4. Though sturgeon can move among watersheds (e.g., Fraser and Columbia rivers), tag recoveries indicate that this be-havior is rare (in the past 12 years there have been six docu-mented recoveries of sturgeon in the lower Fraser River that possessed tags applied in the Columbia River). Similarly, in-river movement upstream of Yale (Lady Franklin Rock) into the upper Fraser Canyon and/or upstream of Hells Gate is very rare (one documented occurrence). Tag recaptures from this study and results of a recent acoustic telemetry study indicate that some White Sturgeon move from the lower
Fraser River into large lakes (Pitt and Harrison lakes) and marine environments that are outside our study area. PIT tag data indicate that a very high proportion of these fish have returned to or migrated through the study area at some point within each year, and results of the telemetry study indicate that 100% of acoustic tagged sturgeon (released within the study area) that migrated seaward of the outer Fraser estu-ary returned to the study area within weeks or months (D. Robichaud, LGL Limited, personal communication).
5. Marked (PIT tagged) sturgeon can move to or remain in sections of the Fraser River where the chance of recaptur-ing a marked fish will reflect the different concentrations of marked fish.
6. Because of periodic limitations in the availability of tags, ap-proximately 9% of unmarked sturgeon encountered to date have been inspected for the presence of a tag but released unmarked; thus, the encounter history of unmarked sturgeon is unknown.
7. Although varying by season, sampling tends to be continu-ous over time rather than episodic.
8. The number of recaptured marks is sparse on any given day or area.
In order to address these characteristics, we adapted a Bayesian mark–recapture model for closed populations (Gazey and Staley 1986) to accommodate growth, movement, mor-tality of marked sturgeon, nondetection of marks, and sparse recaptures on any given day or area. Detailed data assembly procedures and mathematical description of the mark–recap-ture model are provided in Nelson et al. (2004). In the text that follows, we present a brief overview of the methodology: The population estimates were bounded by 40- to 279-cm FL, a roll-ing data window of 2 years (e.g., the 2004 estimate consists of data extracted from January 2003 to December 2004), and four spatial sampling regions (see Figure 1). Note that a sturgeon had to be encountered at least twice in the 2-year window to be deemed a recapture; valid recaptures were thus defined as either of the following occurring within a defined 24-month sampling period: (1) an initial tag application/release and a subsequent recapture of that tag or (2) two (or more) separate recapture events for the same tag. Estimates of the number of sturgeon sampled, tagged sturgeon available for capture, and recaptures by zone (see Table 1) and day were based on deterministic (as-sumed known) representations of growth, movement, mortality, and nondetection of marked sturgeon. von Bertalanffy growth (Fabens 1965) was assumed and growth parameters were esti-mated from the mark–recapture data (length at release, length at recapture, and time at large). The estimated growth parameters were used to define an increasing size criterion for sampled sturgeon over the 2-year window. Movement was defined by the distribution of recaptured tags, weighted by number of stur-geon examined, in eight zones over the 2-year window. Tagged sturgeon available for capture in a zone and day were based on the movement, removals, and an annual instantaneous mortality
Fisheries • Vol 38 No 5 • May 2013• www.fisheries.org 202
rate of 0.1. The number of recaptures in a zone and day were ex-panded by a nondetection rate of 1%. The estimated number of sturgeon sampled, marks available, and recaptures in each zone were summed into the associated sampling region (see Table 1). Note that the stratification of zones within a region influenced the distribution of available marks. Posterior distributions of population size were generated assuming noninformative im-proper prior uniform distributions of population size for the four sampling regions and a multinomial likelihood (sampling dis-tribution) for the recapture of tagged sturgeon. Justification and sensitivity with respect to estimates of population size from the assumed mortality and nondetection rates are further discussed below. The major assumptions required to estimate population size are as follows:
1. The population size in the study area does not change sub-stantially over each 2-year estimation period. Mortality of marked sturgeon must be specified. Sturgeon that are re-cruited into the population of interest by growth can be ex-cluded through calculation of a size criterion. Movement of sturgeon within the study area is fully determined by the history of recaptured PIT tags (marks).
2. All sturgeon in a stratum (day and sampling region), whether marked or unmarked, have the same probability of being caught.
3. Sturgeon do not lose their marks over the period of the study.
4. All marks are reported when sturgeon are recaptured and scanned. If marks are not detected, then the nonreporting rate must be specified.
The total population estimate for the study area was ob-tained by summing the regional estimates. The confidence inter-val for the total population estimate was calculated by invoking a normal distribution under the central limit theorem with a vari-ance equal to the sum of the variances for the sampling regions.
Population estimates were also made by 20-cm size inter-vals. The lack of recaptures for some of the size intervals in some of the sampling regions (A and D in particular) required the combination of all regions to generate reasonable estimates. This lack of stratification resulted in bias in the estimation of population size (distribution of marks and size of sturgeon were not homogeneous over the study area). In addition, some size categories (in particular, the 40- to 59-cm interval) still yielded highly skewed posterior distributions generated by sparse recap-tures. The mean point estimate becomes unstable under these circumstances. In order to control bias and stability, the modes of the posterior distributions by size category were standardized (scaled such that they added up) to the Bayesian mean estimate for the study area.
RESULTS
Sampling Effort for Mark–Recapture Population Estimates
From October 1999 through December 2011, volunteers for the Lower Fraser River White Sturgeon Monitoring and As-sessment Program performed a total of 92,501 unique sturgeon sampling events, which included the inspection of sturgeon for the presence of a PIT tag (Nelson et al. 2012). Of this total sample, 50,134 sturgeon were tagged with a PIT tag (in the head location) and released. The total sample also includes 37,179 recapture events, the majority (69.5%) of which were repeat re-capture events (recaptures of tagged sturgeon that had been pre-viously recaptured). In addition, the total sample includes 5,188 sturgeon that were sampled (examined for the presence of a PIT tag and measured) but were either (1) not tagged due to a short-age of available PIT tags, (2) not released (i.e., a mortality), or (3) not tagged prior to release (due to either poor physical condition of the fish; the bulk of these cases were for sturgeon removed from gill nets).
The annual number of White Sturgeon sampled was fairly consistent from 2000 to 2004 (average of approximately 5,525 sturgeon examined per year, with a range from 4,385 to 7,240) and again from 2005 to 2011 (average of approximately 9,200 sturgeon examined per year, with a range from 8,191 to 10,637; Nelson et al. 2012). The relative monthly contribution to re-spective annual total samples has remained relatively consistent throughout all years (2000–2011; Figure 2). The variability in sample size between months is the result of three main factors: variability in fishing effort applied, catch per effort, and stur-geon catchability.
Three sources provided over 98% of samples over the term of the program through 2011: angling (88.5%), First Nations gill net (5.3%), and Albion Test Fishery (5.0%). An ad-ditional 0.3% of the total sample was provided by dedicated sampling efforts (tangle net) associated with the FRSCS Lower Fraser River Juvenile White Sturgeon Habitat Program (Glova et al. 2008), and approximately 0.9% of samples were provided by a mix of commercial net fisheries, enforcement (illegal re-tention/poaching) incidents, and both sourced and unsourced mortalities (Nelson et al. 2012). All tag numbers of recaptured mortalities recovered were excluded from subsequent popula-tion analyses.
Recaptures of Tagged Sturgeon
Recapture data of tagged sturgeon provided posi-tive determination of both direction and distance of movements for individual sturgeon, and in many cases mul-tiple recapture events over time (years) provided patterns of movement and migration. Movements in relation to both size cat-egory and time of year (season) were explored and incorpo-rated in the analytical processes of the program, as were the spatial distribution of samples over the course of the program. Recaptures of tagged sturgeon during this study confirmed that

Fisheries • Vol 38 No 5 • May 2013 • www.fisheries.org 203
movements and migrations occur throughout the entire lower Fraser study area. Recapture locations of individuals vary and may be several kilometers apart, even over relatively short time periods. Many individual tagged sturgeon have been recap-tured and sampled numerous times; as examples, by the end of 2011 a total of 2,147 sturgeon had been recaptured 3 times, 110 sturgeon had been recaptured 7 times, and two individuals had been recaptured 16 times (Nelson et al. 2012). Multiple capture events for individual tagged sturgeon can occur on an annual basis, with some fish sampled by FRSCS volunteers up to five times in a single year.
Mark Rates
An illustration of the annual numbers of tags applied and reported number of tag recaptures within the study area is pro-vided in Figure 3. The proportion of recaptures present in sam-ples examined for the presence of a PIT tag (i.e., the mark rate)
steadily increased each year over the 12 years of sampling effort (Figure 3). The proportion of new tag releases that make up the total sample used in a defined 2-year (24 month) sampling pe-riod for a given population estimate has changed considerably over the course of the program as more tags were applied and the pool of tags available for recapture increased. Over 86% of the samples used to produce the 2001 estimate (samples from 2000 and 2001) were new tags applied, whereas only 40% of the samples used to produce the 2011 estimate (samples from 2010 and 2011) were new tags applied (Figure 3).
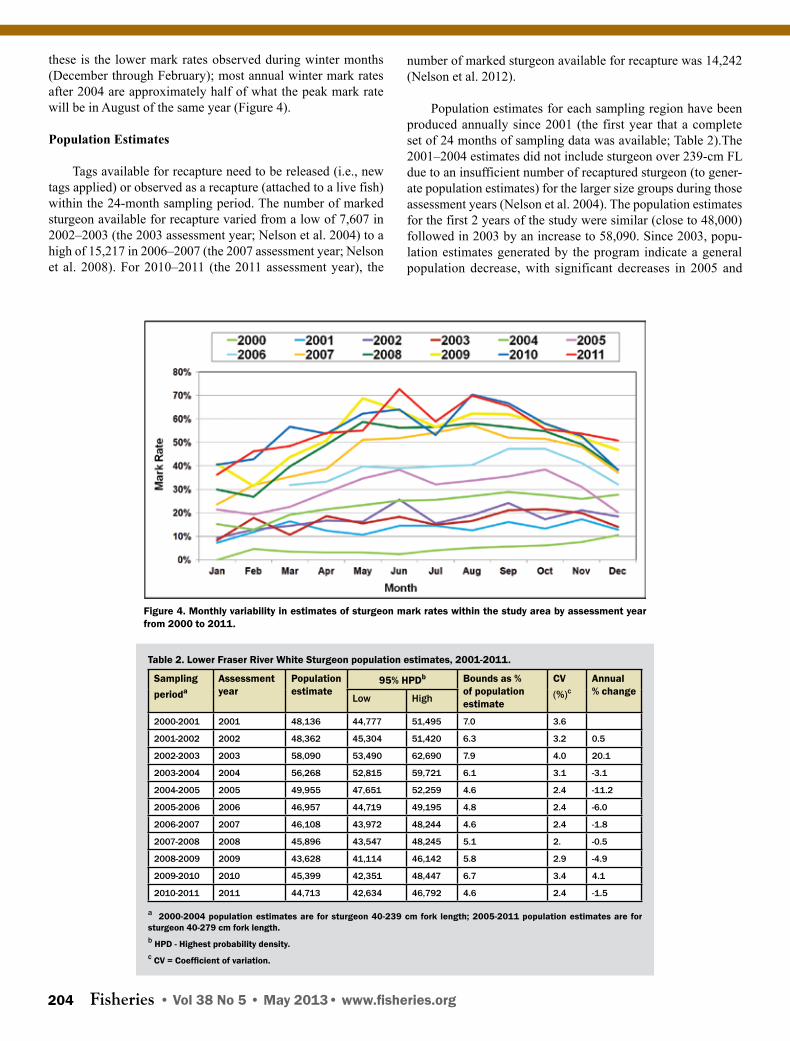
Monthly variation in White Sturgeon mark rates was evi-dent for each of the assessment years (Figure 4). As expected, the lines for each assessment year tend to be consistently higher than in the previous year, given the steadily increasing mark rate in the population (Figure 3); however, patterns of chang-ing mark rates have emerged within years that appear to be influenced by season/month (Figure 4). The most striking of
Figure 2. Number of sturgeon examined for the presence of a PIT tag, by month, for each assessment year from 2000 to 2011.
Figure 3. Number of PIT tags applied, reported number of tags recaptured, and the annual mark rate, within the study area, by assessment year from 2000 to 2011.
Fisheries • Vol 38 No 5 • May 2013• www.fisheries.org 204
these is the lower mark rates observed during winter months (December through February); most annual winter mark rates after 2004 are approximately half of what the peak mark rate will be in August of the same year (Figure 4).
Population Estimates
Tags available for recapture need to be released (i.e., new tags applied) or observed as a recapture (attached to a live fish) within the 24-month sampling period. The number of marked sturgeon available for recapture varied from a low of 7,607 in 2002–2003 (the 2003 assessment year; Nelson et al. 2004) to a high of 15,217 in 2006–2007 (the 2007 assessment year; Nelson et al. 2008). For 2010–2011 (the 2011 assessment year), the
number of marked sturgeon available for recapture was 14,242 (Nelson et al. 2012).
Population estimates for each sampling region have been produced annually since 2001 (the first year that a complete set of 24 months of sampling data was available; Table 2).The 2001–2004 estimates did not include sturgeon over 239-cm FL due to an insufficient number of recaptured sturgeon (to gener-ate population estimates) for the larger size groups during those assessment years (Nelson et al. 2004). The population estimates for the first 2 years of the study were similar (close to 48,000) followed in 2003 by an increase to 58,090. Since 2003, popu-lation estimates generated by the program indicate a general population decrease, with significant decreases in 2005 and
Table 2. Lower Fraser River White Sturgeon population estimates, 2001-2011.
Sampling perioda
Assessmentyear
Populationestimate
95% HPDb Bounds as % of population estimate
CV (%)c
Annual% change
Low High
2000-2001 2001 48,136 44,777 51,495 7.0 3.6
2001-2002 2002 48,362 45,304 51,420 6.3 3.2 0.5
2002-2003 2003 58,090 53,490 62,690 7.9 4.0 20.1
2003-2004 2004 56,268 52,815 59,721 6.1 3.1 -3.1
2004-2005 2005 49,955 47,651 52,259 4.6 2.4 -11.2
2005-2006 2006 46,957 44,719 49,195 4.8 2.4 -6.0
2006-2007 2007 46,108 43,972 48,244 4.6 2.4 -1.8
2007-2008 2008 45,896 43,547 48,245 5.1 2. -0.5
2008-2009 2009 43,628 41,114 46,142 5.8 2.9 -4.9
2009-2010 2010 45,399 42,351 48,447 6.7 3.4 4.1
2010-2011 2011 44,713 42,634 46,792 4.6 2.4 -1.5
a 2000-2004 population estimates are for sturgeon 40-239 cm fork length; 2005-2011 population estimates are for sturgeon 40-279 cm fork length.b HPD - Highest probability density. c CV = Coefficient of variation.
Figure 4. Monthly variability in estimates of sturgeon mark rates within the study area by assessment year from 2000 to 2011.

Fisheries • Vol 38 No 5 • May 2013 • www.fisheries.org 205
again in 2009 (Table 2). The 2011 population estimate (44,713) was 23.0% lower than the 2003 estimate (significant decrease).
As noted previously, total annual population estimates were produced by summing regional population estimates. Because the study area included four sampling regions (A–D; see Fig-ure 1), two of which were located downstream of the Mission Bridge (A–B), the program was able to produce the first ever population estimates of White Sturgeon for the estuarine or tidal section of the lower Fraser River. In 2010–2011 (assessment year 2011), the average abundance of White Sturgeon within the study area downstream of the Mission Bridge (sampling re-gions A and B) was 21,424 (47.9% of the 2011 total population estimate; Nelson et al 2012).
Posterior modes by 20-cm size class were scaled to the overall mean estimate for the study area. White Sturgeon popu-lation estimates and associated 95% highest probability density intervals from 2004 to 2011, by 20-cm size category, are illus-trated in Figure 5.
Growth Analyses
Fork length data for individual recaptured (tagged) stur-geon were analyzed to determine daily growth rates, based on the number of days at large between release and subsequent re-capture events. Daily growth rates were expanded to provide es-timates of annual growth, and these estimates were pooled and averaged by size group for comparative purposes. A comparison
Figure 5. Comparison of mean population estimates of White Sturgeon in the lower Fraser River by 20-cm size category for assessment years 2004 through 2011.
Figure 6. Comparison of average annual growth increments (rates) of White Sturgeon (cm), by 20-cm size groups, in the lower Fraser River during three time periods: 2000–2004, 2005–2009, and 2010–2011. The bars at the top of each estimate show the range of mean annual growth estimates for the years within each time period.

Fisheries • Vol 38 No 5 • May 2013• www.fisheries.org 206
of average annual growth rates of White Sturgeon sampled from 2001 to 2011, by 20-cm size groups, suggests that annual growth rates for most size groups were greater before 2005 than after 2005 (Figure 6). For most size groups, the range in mean growth estimates within a growth period did not overlap with the range of mean growth estimated for other periods (see range bars il-lustrated over respective mean estimates in Figure 6). Average annual growth for all size groups (up to 180 cm) from 2005 to 2009 (3.9 cm/year) represented a 23% decrease from respective previous growth rates from 2000 to 2004 (5.0 cm/year). Aver-age annual growth for all size groups increased in 2010 (4.8 cm/year) and slightly declined in 2011 (4.4 cm/year). The combined average growth rate for 2010–2011 (4.6 cm/year) represented a 19% increase over the 2005–2009 average rate but was still 9% below the pre-2005 rate (Figure 6).
DISCUSSION
Study Design and Sustained Sampling Effort
The products of this long-term, stewardship-led monitoring and assessment program are both novel and useful. They include the first ever estimates of the population of White Sturgeon in the Fraser River downstream of the Mission Bridge and highly precise, reliable estimates of the population (that resides within the study area) on an annual basis. Over time, we have been able to detect trends not only for the total population but also for size categories within the population, which in turn provides insights regarding where to focus activities toward population recovery. The sustained level of sampling effort provided by volunteers over the 12 years of study has been an achievement in its own right. Since 2000, the delivery of continuous sup-port for ongoing data collection, analysis, and annual reporting has been the result of strong program leadership and scientific oversight provided by the FRSCS. The FRSCS has organized a science and technical committee that is composed mostly of fishery science professionals. As a result of this available in-house expertise, FRSCS activities are guided by rigorous study designs and scientific principles.
In April 2000, the start-up program had 15 volunteer an-glers, a test fishery operator, 10 PIT tag readers, and 2,000 PIT tags. By June of 2000, those volunteers had applied tags to over 1,400 White Sturgeon, and additional funds were secured by the FRSCS to purchase additional tags. By the end of 2000, volunteers had sampled 4,844 sturgeon, applied 4,386 PIT tags to live sturgeon, and recorded 218 recapture events. The esti-mated in-kind dollar value of volunteer contributions in 2000 was approximately $290,000 (labor and equipment provided to the program). Given the success of the initial year of the pro-gram, funding was secured to expand in 2001 with the purchase of an additional 10 PIT tag readers and 5,000 more PIT tags. Additional anglers and angling guides were trained to sample and tag White Sturgeon, as were select First Nations fishermen, commercial salmon fishermen, enforcement officers, and post-secondary fishery students. The program continued to raise and subsequently meet its sampling goals, and by the end of 2005 had over 100 trained volunteers and approximately 60 PIT tag
readers in circulation. By the end of 2011 over 120 trained vol-unteers had successfully delivered 92,501 sturgeon samples, re-leased 50,134 live sturgeon with a PIT tag, and recorded 37,179 recapture events. In 2011, the value of in-kind contributions from volunteers was approximately $1.2 million.
Population Estimates
Population estimates presented in this article are estimates of the mean number of White Sturgeon in the 40- to 239-cm FL (2000–2004) and 40- to 279-cm FL (2005–2011) size ranges that resided in the study area over each 2-year period. The very large number of sturgeon tagged and examined for tags each year has resulted in very precise estimates (95% confidence in-tervals ±4.6%–7.9% of the mean; see Table 2). The precision and accuracy of these estimates depend upon the input of point estimates for growth, movement, mortality, and undetected marks.
Nelson et al. (2004) demonstrated through sensitivity analysis that uncertainty associated with growth, mortality, and undetected marks had a small impact on the precision of the population estimates primarily because of high mark rates (over 70% during some months in 2010 and 2011; Figure 4) and sampling rates (greater than 40% of the population sampled in most of the 24-month sampling windows; Nelson et al. 2012). However, the response of population estimates to alternative movement proportions between and within river zones (Table 1) has not been evaluated. It is likely that the capture probabilities for sturgeon are heterogeneous within a region because of spa-tial aggregation (Walters et al. 2005; Whitlock and McAllister 2009) in contradiction to the homogeneous capture probability (multinomial distribution for the recapture of tagged sturgeon) assumed by our population estimation model. On the other hand, the impact of heterogeneity on precision is moderated as the magnitude of the mark rate increases. Again, note that the annual mark rate has increased to approximately 60% over the history of the program (Figure 3). The implication is that the precision reported here should be viewed as minimal (i.e., con-fidence bounds are larger than stated), particularly for the older population estimates (2001–2003).
In addition, Nelson et al. (2004) concluded through sensi-tivity analysis that the most important factors for the accuracy of population estimates were mortality and undetected mark rates. The mortality rate of 0.1 is consistent with that used by Beamesderfer et al. (1995) for lower Columbia River White Sturgeon. For the lower Fraser River, Walters et al. (2005) re-ported that mortality ranged between 0.07 and 0.14, dependent on spatial aggregation. Whitlock and McAllister (2009) esti-mated total mortality from 0.08 to 0.10 depending on size class. Application of the catch-curve methodology described by Nel-son et al. (2004) to the size category estimates greater than 79 cm (see Figure 5) resulted in mortality estimates over the range 0.09–0.13. We estimate that the rate of undetected marks is small because of frequent checking of tag reader operation and the high level of competence of trained volunteers. Nelson et al. (2008) opined that a 2% rate for undetected marks was extreme.

Fisheries • Vol 38 No 5 • May 2013 • www.fisheries.org 207
Mark Rate Variation
The differences in observed annual mark rates among sea-sons suggest a moderate rate of population segregation between winter (low mark rates) and summer–fall (high mark rates). The low number of preferred overwintering habitats may attract sturgeon from a wide area where the fish migrate and forage during the balance of the year; it is probable that sampling ef-fort (i.e., tag applications) is not occurring, or occurring at a low rate, at some of those outer foraging areas, and thus fish from those areas have a lower probability of possessing a tag. When sturgeon from all areas concentrate in overwintering locations, the result is lower mark rates during that season.
Immigration and Emigration
It has been well documented that White Sturgeon are ca-pable of extensive migrations both within and among major watersheds (the Sacramento River watershed in California, the Columbia River watershed of Oregon and Washington, and the Fraser River watershed in British Columbia). Tagging studies have confirmed sturgeon movements among these watersheds (Stockley 1981; Galbreath 1985; DeVore et al. 1995). Substan-tial tagging programs for White Sturgeon in the lower Columbia River have produced recaptures from several coastal bays and inlets of Oregon and Washington, including Puget Sound (lo-cated in Washington, directly south of the Fraser River mouth; see Figure 1; Galbreath 1985). Six White Sturgeon, originally tagged and released in the lower Columbia River, were recap-tured by FRSCS volunteers in the lower Fraser River study area during the course of this program. Four of these recaptured stur-geon were originally tagged and released in the lower Colum-bia River near Astoria, Oregon; the other two were originally captured in the Columbia River below Bonneville Dam prior to being transported upstream and released in the Dalles Reservoir (approximately 340 km upstream from the river entrance; T. Jones, Oregon Department of Fish and Wildlife, personal com-munication).
Analytical techniques that use laser ablation sampling to determine levels of strontium in fin rays of Fraser River White Sturgeon (Vienott et al. 1999) suggest a low frequency of ma-rine migrations for lower Fraser White Sturgeon. However, this work (Vienott et al. 1999) also suggests limited juvenile rear-ing in brackish waters (the Fraser estuary). Preliminary inves-tigations to examine White Sturgeon dispersal behavior found that nonnatal estuaries along the West Coast may contain White Sturgeon originating from each of the three known populations with ocean access (Sacramento, Lower Columbia, Lower Fra-ser; A. Drauch Schreier, Genomic Variation Lab, University of California Davis, personal communication).
Because there will always be a portion of 40- to 279-cm FL lower Fraser River origin White Sturgeon located in marine and freshwater areas outside our core study area, our estimates do not represent the entire population. Freshwater areas acces-sible to lower Fraser River White Sturgeon that are outside our study area include the entire North Arm and adjacent Middle
Arm (north of Lulu Island), Pitt River and Pitt Lake, and Har-rison Lake. All marine waters westward of the entrance points of the Fraser River at Garry Point and Canoe Pass (Figure 1) are outside our study area. Substantial numbers of White Sturgeon have been observed and captured in the bays and mouths of rivers in northern Puget Sound, with additional sightings and captures in the Southern Strait of Georgia and inlets/estuarine habitats on southern and western Vancouver Island. Although the origin (natal river) of White Sturgeon observed in marine waters adjacent to the Fraser estuary is currently unknown, their proximity to the Fraser River suggests that at least some are of Fraser origin. Acoustic telemetry data have shown that a portion of lower Fraser White Sturgeon may migrate to marine areas beyond the Fraser estuary, particularly during summer months (D. Robichaud, LGL Limited, personal communication).
Population Trends
The lower Fraser River White Sturgeon population has de-clined since 2003 (Table 2). A comparison of annual population estimates by 20-cm size categories for 2004–2010 (Figure 5) indicates that since 2004, significant reductions have occurred in the smallest size categories (40–59 cm and 60–89 cm), which suggests reduced levels of juvenile recruitment into the popula-tion (at those sizes) compared to respective recruitment levels before 2004. By 2006, increases in abundance occurred in all size categories above 160 cm; this suggests survival and growth of individual sturgeon over time into larger size categories. Survival of sturgeon into and beyond the 160-cm size category has likely been positively influenced by regulations and broad-based support for nonretention of White Sturgeon in all BC fish-eries since 1994.
Program sampling data provided from the Albion Test Fish-ery, a gill net test fishery conducted at rkm 58 in the lower Fraser River at Albion (Figure 1), has provided additional confirmation that there has been a general decrease in overall abundance and a declining proportion of juvenile White Sturgeon (less than 100 cm FL) over the course of the program.
Prospects for the Recovery of Lower Fraser River White Sturgeon
The data on population size, juvenile recruitment, and growth provided in this article indicate that the abundance of White Sturgeon in the lower Fraser River has been fairly stable over the past 12 years, but the decline in the recruitment of ju-venile White Sturgeon since 2003 is a major concern. Reduced juvenile recruitment may be the result of a suite of factors, including the alteration and destruction of important habitats (spawning, incubation, early-life-history rearing), declines in the number of successful spawners due to interaction with in-river fisheries, and/or the impacts of reduced food supply and ecological imbalances on both early-life and adult stages. The rebuilding of this population will require the successful spawn-ing of adults and subsequent recruitment of juvenile sturgeon over many years. Ensuring successful spawning requires the availability of sufficient, quality spawning habitat, and the pres-

Fisheries • Vol 38 No 5 • May 2013• www.fisheries.org 208
ence of healthy, mature fish prior to and during the spawning period. Recent measures to identify sturgeon spawning areas and subsequently exclude those areas from any plans for de-velopments, gravel extractions, and other activities that would result in habitat loss or alteration are important first steps to-ward the long-term protection of spawning habitat. Likewise, the 2011 voluntary commitment from recreational fishers not to fish in a known spawning area from June 1 to July 15 was another important step toward reducing the stress on sturgeon while on the spawning grounds. Further efforts are required to identify the critical areas and periods to restrict capture impacts (injury and stress) on pre-spawning sturgeon.
The relatively low growth rates observed for all size cat-egories since 2004 is another concern because the number of mature sturgeon, especially females, that spawn each year is likely dependent on their fitness and growth in the years be-tween periodic spawning events. Fluctuations in annual growth rates may reflect natural growth fluctuations for the popula-tion and may indicate that growth rates at the beginning of the program (2000–2004) were good or above average. However, growth rate reductions from 2005 to 2009 (Figure 6) indicate a decrease in the average growth rate. Because sturgeon growth is in part a function of food intake, we can look for changes in the abundance/availability of major food sources over the period from 2000 to 2011. Pacific salmon, in particular Pink Salmon (Oncorhynchus gorbuscha) and Chum Salmon (O. keta), and Pacific Eulachon are important food sources for lower Fraser River White Sturgeon (McKenzie 2000; COSEWIC 2003). Other species of salmon (including Sockeye Salmon, O. nerka), when locally abundant and available, are also important food sources (McAdam 1995). Whereas salmon escapements/abun-dance has fluctuated over this period (and Pink Salmon is only available in odd years), the estimated annual abundance of re-turning Pacific Eulachon has declined substantially in the lower Fraser River over this period (Fisheries and Oceans Canada 2011). A large return of Pink Salmon to the lower Fraser River in 2009, followed by a very high return of Sockeye Salmon stocks in 2010, likely contributed to the measured increase in growth (for all size groups) in 2010 (Figure 6). In addition to population monitoring and assessment, it is important to con-tinue to closely monitor annual growth rates for lower Fraser River White Sturgeon and to track growth against changes in the abundance of important food sources.
Currently, the status of White Sturgeon in British Columbia and the pathways toward population recovery are focal topics at federal, provincial, and community levels. As a result of this attention and concern, the ongoing monitoring and assessment program in the lower Fraser River has had the benefit of con-tinuous funding and, most important, dedicated volunteer com-mitment and involvement. The original study design developed by the FRSCS in 1999 has proven the test of time and is still being implemented. Although the analytical model has been slightly modified and improved over time, the core data inputs remain the same.
The FRSCS is currently focusing its efforts on obtaining broad-based support for the protection of sturgeon spawning habitat, reducing the impact of all fisheries that catch Fraser River White Sturgeon, identifying measures that can be taken to rebuild important food sources for Fraser River White Sturgeon, increasing public awareness of these fish through education pro-grams, and continuing efforts to monitor population status. We are hopeful that the knowledge gained through these ongoing programs will ensure the long-term sustainability and ultimate recovery of lower Fraser River White Sturgeon.
ACKNOWLEDGMENTS
We acknowledge the extensive effort provided by FRSCS volunteers and thank them for their individual contributions to the program. Key organizations that provided volunteers in-clude the Albion Test Fishery, the Fraser Valley Angling Guides Association, the BC Institute of Technology, the BC Ministry of Environment, Fisheries and Oceans Canada, Lower Fraser River First Nations, the Pacific Salmon Commission, Simon Fraser University, and the University of British Columbia. Special acknowledgments go to Jim Rissling for field program coordination and volunteer training (1999–present), Tony Mo-chizuki for database management, and Robin Tamasi for the study area graphics.
Program funding was provided by the Habitat Conservation Trust Foundation, BC Environment, the Willow Grove Foun-dation, and numerous sponsors coordinated by the FRSCS. Support for this article was provided by the FRSCS, the North Growth Foundation, and LGL Limited Environmental Research Associates.
This article is dedicated to Rick Hansen. Rick’s vision, leadership, and commitment to conservation of Fraser River Sturgeon were critical for initiating and maintaining support for the work reported in this article.
REFERENCES
Beamesderfer, R. C. P., T. A. Rien, and A. A. Nigro. 1995. Differences in the dynamics and potential production of impounded and unim-pounded White Sturgeon population in the lower Columbia River. Transactions of the American Fisheries Society 124:857–872.
COSEWIC (Committee on the Status of Endangered Wildlife in Can-ada). 2003. COSEWIC assessment and update status report on the White Sturgeon (Acipenser transmontanus) in Canada. COSE-WIC, Ottawa, Ontario. Available: http://www.sararegistry.gc.ca/status/status_e.cfm.
DeVore, J. D., B. W. James, C. A. Tracy, and D. A. Hale. 1995. Dynam-ics and potential production of White Sturgeon in the Columbia River downstream from Bonneville Dam. Transactions of the American Fisheries Society 124:845–856.
Echols, J. C. 1995. Review of Fraser River White Sturgeon (Acipenser transmontanus). Fisheries and Oceans Canada, Vancouver, Brit-ish Columbia.
Fabens, A. J. 1965. Properties and fitting of the von Bertalanffy growth curve. Growth 29:265–289.
Fisheries • Vol 38 No 5 • May 2013 • www.fisheries.org 209
Columbia. Fraser River Sturgeon Conservation Society, Vancou-ver, British Columbia. Available: http://www.frasersturgeon.com/media/LFRWS-summary-2011.pdf.
Nelson, T. C., W. J. Gazey, M. L. Rosenau, and K. K. English. 2004. Status of White Sturgeon in the lower Fraser River: report on the findings of the lower Fraser River White Sturgeon Monitoring and Assessment Program 1999–2004. Report prepared by LGL Limited, Sidney, British Columbia. Fraser River Sturgeon Con-servation Society, Vancouver, British Columbia. Available: http://www.frasersturgeon.com/media/LFRWS-manuscript-2004.pdf.
Nelson, T. C., and C. D. Levings. 1995. Executive summary. Part I in T. C. Nelson, editor. Studies of the Starry Flounder in the Fra-ser River, 1992–94. Fraser River Estuary Management Program, Water Quality/Waste Management Committee, Technical Report WQM 95-02.
Seber, G. A. F. 1982. The estimation of animal abundance and related parameters, 2nd edition. Edward Arnold, London.
Semakula, S. N., and P. A. Larkin. 1968. Age, growth, food and yield of the White Sturgeon (Acipenser transmontanus) of the Fraser River, British Columbia. Journal of the Fisheries Research Board of Canada 25:2589–2602.
Stockley, C. 1981. Columbia River sturgeon. State of Washington De-partment of Fisheries, Olympia, Washington, Progress Report No. 150.
Vienott, G., T. Northcote, M. Rosenau, and R. D. Evans. 1999. Con-centrations of strontium in the pectoral fin ray of the White Stur-geon (Acipenser transmontanus) by laser ablation–inductively coupled plasma–mass spectrometry as an indicator of marine migrations. Canadian Journal of Fisheries and Aquatic Sciences 56:1981–1990.
Walters, C. J., J. Korman, and S. McAdam. 2005. An assessment of white sturgeon stock status and trends in the lower Fraser River. Canadian Science Advisory Secretariat, Research Document 2005/066, Vancouver, British Columbia.
Whitlock, R., and M. McAllister. 2009. A Bayesian mark–recapture model for multiple-recapture data in a catch-and-release fishery. Canadian Journal of Fisheries and Aquatic Sciences 66:1554–1568.
Fisheries and Oceans Canada. 2011. Pacific region. Integrated fisher-ies management plan: eulachon. April 1, 2011 to March 31, 2012. Regional Headquarters, Vancouver, British Columbia.
Fraser River White Sturgeon Working Group. 2005. Fraser River White Sturgeon conservation plan. Fraser River Sturgeon Conservation Society, Vancouver, British Columbia. Available: http://www.frasersturgeon.com/media/conservation-plan-2005.pdf.
Galbreath, J. L. 1985. Status, life history and management of Columbia River White Sturgeon, Acipenser transmontanus. Pages 119–125 in F. P. Binkowski and S. I. Doroshov, editors. North American sturgeons: biology and aquaculture potential. Dr. W. Junk, Dor-drecht, The Netherlands.
Gazey, W. J., and M. J. Staley. 1986. Population estimation from mark–recapture experiments using a sequential Bayes algorithm. Ecol-ogy 67:941–951.
Glova, G., T. Nelson, K. English, and T. Mochizuki. 2008. A prelimi-nary report on juvenile White Sturgeon habitat use in the lower Fraser River, 2007–2008. Fraser River Sturgeon Conservation Society, Vancouver, British Columbia. Available: http://www.frasersturgeon.com/media/juvenile-habitat-2008.pdf.
Hatfield, T., S. McAdam, and T. C. Nelson. 2004. Impacts to abundance and distribution of Fraser River White Sturgeon. A summary of existing information and presentation of impact hypotheses. Report submitted by Solander Ecological Research, Victoria, BC. Report prepared for Fraser River Sturgeon Conservation Society and the Fraser River White Sturgeon Working Group. Available: http://www.frasersturgeon.com/media/impact-hypotheses-2004.pdf.
Hay, D. E., R. Harbo, K. Southy, J. R. Clarke, G. Parker, and P. B. McCarter. 1999. Catch composition of British Columbia shrimp trawls and preliminary estimates of bycatch—with emphasis on eulachons. Fisheries and Oceans Canada, Ottawa, Canada. Canadian Stock Assessment Secretariat Research Document 99/26.
Lamb, W. K. 1960. The letters and journals of Simon Fraser, 1806–1808. Macmillan Co. of Canada, Toronto.
Lane, E. D. 1991. Status of the White Sturgeon, Acipenser transmon-tanus, in Canada. The Canadian Field Naturalist 105:161–168.
McAdam, S. 1995. Report on the mortalities of Fraser River White Sturgeon (Acipenser transmontanus) during the summer–fall period of 1993–94. Ministry of Environment, Lands and Parks, Victoria, British Columbia.
McKenzie, S. 2000. Fraser River White Sturgeon monitoring program: comprehensive report (1995–1999). Report by RL&L Environ-mental Services Ltd., Edmonton, Alberta, for BC Fisheries, Vic-toria, British Columbia.
Nelson, T. C., K. K. English, and M. L. Rosenau. 1999. Design of a stewardship project to supplement information required to as-sess the status of White Sturgeon in the lower Fraser River. Re-port prepared by LGL Limited, Sidney, British Columbia. Fraser River Sturgeon River Conservation Society and the BC Ministry of Fisheries. Available: http://www.frasersturgeon.com/media/stewardship-design-1999.pdf.
Nelson, T. C., W. J. Gazey, and K. K. English. 2008. Status of White Sturgeon in the lower Fraser River: report on the findings of the lower Fraser River White Sturgeon Monitoring and Assessment Program 2007. Report prepared by LGL Limited, Sidney, British Columbia. Fraser River Sturgeon Conservation Society, Vancou-ver, British Columbia. Available: http://www.frasersturgeon.com/media/LFRWS-manuscript-2007.pdf.
Nelson, T. C., W. J. Gazey, and K. K. English. 2012. Status of White Sturgeon in the lower Fraser River: report on the findings of the lower Fraser River White Sturgeon Monitoring and Assessment Program 2011. Report prepared by LGL Limited, Sidney, British
From the Archives
President Bryant: I give you greeting and assure you of my great satisfac-tion in seeing so many faces that have grown familiar and dear to me, as en-gaged in this work. I congratulate you upon your safe arrival here, and I think in selecting the place for our meeting, the good committee who made this selec-tion and recommended it to our society, builded better than they knew; for cer-tainly it is a charming spot; and one good thing about it is that it is going to be a little difficult for us to get away until our meeting is over.
President E. E. Bryant (1902): Transac-tions of the American Fisheries Society, Transactions of the American Fisheries Society, 31:1,10.

Fisheries • Vol 38 No 5 • May 2013• www.fisheries.org 210
FEATURE
Shrinking the Haystack: Using an AUV in an Integrated Ocean Observatory to Map Atlantic Sturgeon in the Coastal OceanMatthew J. OliverCollege of Earth, Ocean and Environment, University of Delaware, 700 Pilottown Rd., Lewes, DE 19958. E-mail: [email protected]
Matthew W. BreeceCollege of Earth, Ocean and Environment, University of Delaware, 700 Pilottown Rd., Lewes, DE 19958
Dewayne A. FoxDepartment of Agriculture and Natural Resources, Delaware State Univer-sity, 1200 N. DuPont Hwy., Dover, DE 19901
Danielle E. HaulseeCollege of Earth, Ocean and Environment, University of Delaware, 700 Pilottown Rd., Lewes, DE 19958
Josh T. KohutInstitute of Marine and Coastal Sciences, Rutgers University, 71 Dudley Rd., New Brunswick, NJ 08901
John MandersonEcosystems Processes Division, NEFSC/NMFS/NOAA, James J. Howard Marine Laboratory, Highlands, NJ 07732
Tom SavoyConneticut Department of Energy and Environmental Protection, 79 Elm St., Hartford, CT 06106
Encogiendo el pajar: utilización de un Vehículo Autónomo Submarino en un Observatorio Oceánico Integral para Mapear el Esturión del Atlántico en el Océano CosteroRESUMEN: los procesos físicos que ocurren en zona costera del Atlántico medio generan un paisaje complejo y dinámico. La comprensión de cómo los peces costeros responden a tal complejidad ha sido una motivación im-portante para establecer un arreglo de biotelemetría en la franja costera. Muchos de los arreglos costeros maximi-zan la probabilidad de detectar peces mediante el uso de hidrófonos cerca de los cuellos de botella geofísicos. El desarrollo de un observatorio oceánico de monitoreo en tiempo real permite un mapeo sincrónico de estructuras hidrográficas dinámicas que son relevantes para los peces costeros. Estas observaciones bindan el contexto para in-terpretar el impacto que tienen ciertos rasgos oceanográfi-cos en el comportamiento de animales rastreados mediante telemetría. En una misión diseñada para probar este con-cepto, se desplegó el deslizador Slocum en un observato-rio oceánico para demostrar cómo los aparatos móviles de monitoreo pueden ser reubicados de forma dinámica en respuesta a procesos físicos de mesoescala que ocurren en el océano costero. El deslizador Slocum detectó cuatro especímenes de esturión del Atlántico Acipencer oxyrin-chus oxyrinchus encontrados en una masa de agua fresca, somera y relativamente cálida en una región en la que históricamente el esturión del Atlántico ha sido parte de la captura incidental.
ABSTRACT: Physical processes in the coastal Mid-Atlantic create a complex and dynamic seascape. Understanding how coastal fishes respond to this complexity has been a major moti-vation in establishing coastal biotelemetry arrays. Most coastal arrays maximize the probability of fish detection by positioning hydrophones near geophysical bottlenecks. The development of a real-time ocean observatory allows for synchronous mapping of dynamic hydrographic structures important to coastal fishes. These observations provide important context for interpreting the impact of oceanographic features on the behavior of tele-metered animals. In a proof-of-concept mission, we deployed a Slocum glider in a real-time ocean observatory to demonstrate how mobile listening assets could be dynamically reallocated in response to the mesoscale physics of the coastal ocean. The Slocum glider detected four Atlantic Sturgeon Acipencer oxy-rinchus oxyrinchus that were in a shallow, well-mixed, and rela-tively warm and fresh water mass in a region of historic Atlantic Sturgeon bycatch.
INTRODUCTION
Passive acoustic biotelemetry is a widely used tool for understanding the distribution of marine organisms. Acous-tic transmitters placed on or inside an animal transmit coded
messages to listening arrays, allowing researchers to reconstruct movement patterns of individuals and cohorts. Many passive acoustic biotelemetry studies focus fixed listening arrays near coastal embayments or at geophysical bottlenecks along known migration routes (Jackson 2011). For example, participants in the Atlantic Cooperative Telemetry (ACT) Network, Ocean Tracking Network, and the Pacific Ocean Shelf Tracking Proj-ect maintain thousands of passive hydrophones, most of which are closely associated with geographical boundaries in the near-shore coastal environment. Geographic boundaries concentrate telemetered animals near the arrays and increase the probability of their detection. Comparatively few arrays extend to the con-tinental shelf away from geographic barriers, which reduces the probability of detecting telemetered animals. However, within the coastal ocean there are dynamic hydrographic structures that are known to concentrate marine fauna. Sea surface temperature and chlorophyll a fronts serve to aggregate forage species and

Fisheries • Vol 38 No 5 • May 2013 • www.fisheries.org 211
their predators (Fiedler and Bernard 1987; Palacios et al. 2006). In the Mid-Atlantic coastal ocean, these complex fronts along with other dynamic hydrographic processes appear to influence habitat associations in the ocean for several coastal species such as Longfin Inshore Squid Loligo pealeii, Butterfish Pep-rilus triacanthus and Summer Flounder Paralichthys dentatus (Manderson et al. 2011).
Autonomous underwater vehicles (AUVs) are natural ad-ditions to fixed listening arrays (Curtin et al. 1993; Grothues 2009). AUVs have been used in coastal embayments and es-tuaries to measure fine-scale movements and distributions of telemetered organisms (Grothues et al. 2010). For example, an AUV was used to map the fine-scale movements of Atlantic Sturgeon Acipencer oxyrinchus oxyrinchus on their suspected Hudson River spawning grounds (Grothues et al. 2008). AUVs can also be adaptively routed in a changing seascape, allow-ing researchers to strategically place the listening platforms in specific hydrographic features. In a demonstration mission, we show how AUVs fitted with hydrophones could be dynamically reallocated in relation to hydrographic features to detect teleme-tered organisms in the coastal ocean. AUVs deployed in an op-erational observatory provide a synergistic link between coastal ocean dynamics and telemetered organisms that improves our understanding of the distribution and behaviors of coastal spe-cies.
An Integrated Ocean Observatory
Participants in the ACT Network currently have active transmitters in 859 Atlantic Sturgeon and maintain ~400 receiv-ers in Mid-Atlantic embayments and nearshore environments (L. Brown, Delaware State University, personal communica-tion). The ACT Network forms a regional backbone of telemetry receivers and is collocated with the Mid-Atlantic Regional As-sociation Coastal Observing System (MARACOOS), which is the regional component of the U.S. Integrated Ocean Observing System focused on the coastal waters between Cape Hatteras, North Carolina, and Cape Cod, Massachusetts. Weather, high-frequency radar, satellite, and AUV observations are integrated into an ensemble of ocean models in the Mid-Atlantic Bight to support real-time and forecast-based ocean products (http://maracoos.org). The synthesis of these observations and models in near real-time provides the infrastructure to understand and map a dynamic coastal system. Furthermore, these observa-tions have been shown to significantly improve habitat models of Mid-Atlantic organisms (Manderson et al. 2011; Palamara et al. 2012). Real-time oceanographic observations combined with the ACT Network provide a critical link for understanding the distribution of coastal fauna.
Teledyne-Webb Research Slocum glider AUVs are the main platform for gathering in situ data in the MARACOOS region. These battery-powered gliders are buoyancy driven and can maintain a presence in the ocean for approximately 30 days, allowing them to measure the mesoscale physics and optics of the coastal ocean. Gliders convert changes in vehicle buoyancy into forward motion by angling their nose upward or downward,
thus “gliding” on laterally mounted wings in a “sawtooth” pat-tern (Schofield et al. 2007). Gliders and other AUVs are being increasingly utilized and are a stable platform for a variety of in situ observations. For example, between 2005 and 2011, there were 71 Slocum glider missions by the partners of the MARA-COOS observatory. These gliders were deployed for a total of 1,150 days while traveling 24,121 km (Figure 1).
Atlantic Sturgeon
Atlantic Sturgeon are one of nearly 60 telemetered species in the Mid-Atlantic region (VEMCO, personal communication, Denise King) and were recently listed as endangered through-out most of their range (National Oceanic and Atmospheric Administration [NOAA] 2012). Atlantic Sturgeon historically occupied major river systems between Hamilton Inlet, Labra-dor, Canada (Backus 1951), and the St. Johns River, Florida (Vladykov and Greeley 1963). Atlantic Sturgeon spend the vast majority of their life in coastal marine waters, but little is known about this phase in their life history (Atlantic Sturgeon Status Review Team 2007). In the late fall, bycatch of Atlan-tic Sturgeon in commercial fisheries is highest as they move through the coastal oceans of the Mid-Atlantic region (Stein et al. 2004b). Pop-up satellite transmitters on Atlantic Sturgeon show that they use waters within ~100 km of the coastline dur-ing their migration (Erickson et al. 2011). However, the location errors inherent in pop-up satellite transmitters are too large to associate Atlantic Sturgeon with specific coastal hydrographic features during their migration. Acoustic biotelemetry provides location information with high enough spatial resolution to as-sociate their movements with coastal hydrography.
Demonstration Mission
In this study, we mounted a VEMCO Ltd. (Bedford, Nova Scotia) Mobile Transceiver (VMT) on the glider’s exterior dor-sal surface (Figure 1). The VMTs are small, lightweight acoustic transceivers that record the coded acoustic messages transmit-ted by telemetered organisms. Though a single dorsal mount is not ideal, through collaborations among the University of Dela-ware, VEMCO Ltd., and Teledyne-Webb Research (Falmouth, Massachusetts), we integrated two receivers into the dorsal and ventral hull of the glider to maximize the listening capability of the transceiver–glider system for future missions. Our purpose in this limited demonstration is to show how AUVs could be positioned in a dynamic coastal ocean and in the context of an ocean observatory to detect and map Atlantic Sturgeon.
RESULTS
Glider Deployment
On October 18, 2011, we deployed a Slocum glider car-rying a VMT off the coast of southern New Jersey (Figure 1). The glider’s first task was to carry the VMT on a cross-shelf transect to collect in situ data for MARACOOS and then return to focus on the nearshore coastal region where bycatch of Atlan-tic Sturgeon has been recorded (Stein et al. 2004a). The glider
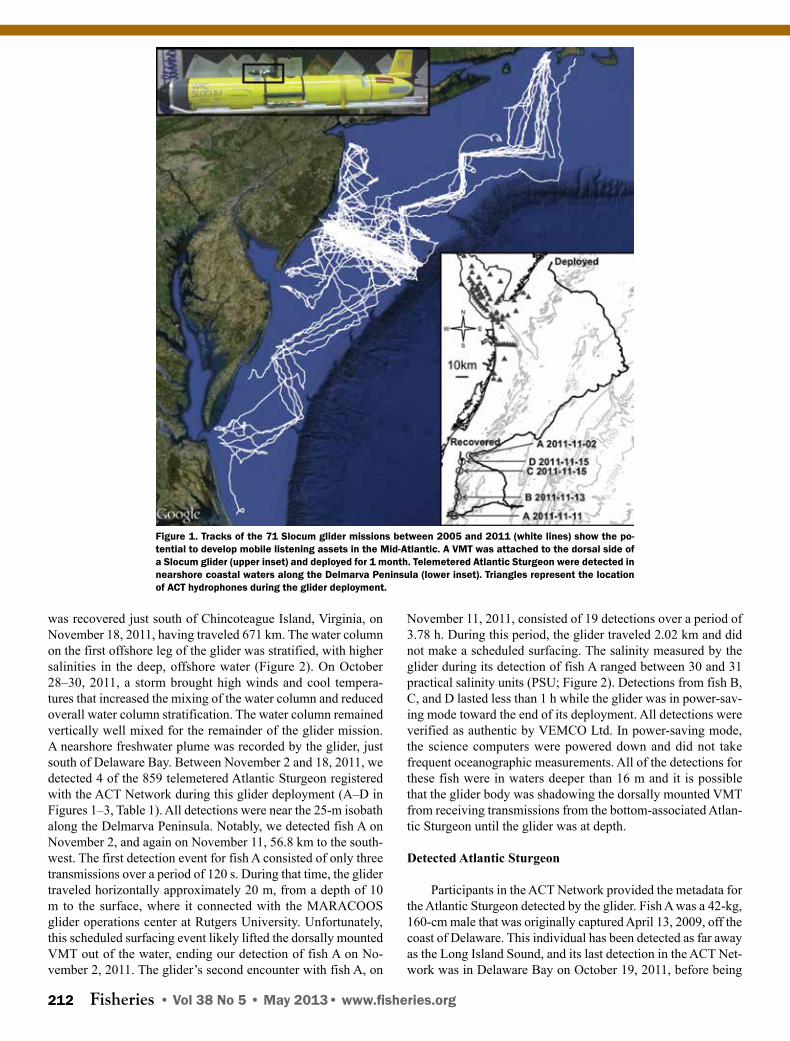
Fisheries • Vol 38 No 5 • May 2013• www.fisheries.org 212
was recovered just south of Chincoteague Island, Virginia, on November 18, 2011, having traveled 671 km. The water column on the first offshore leg of the glider was stratified, with higher salinities in the deep, offshore water (Figure 2). On October 28–30, 2011, a storm brought high winds and cool tempera-tures that increased the mixing of the water column and reduced overall water column stratification. The water column remained vertically well mixed for the remainder of the glider mission. A nearshore freshwater plume was recorded by the glider, just south of Delaware Bay. Between November 2 and 18, 2011, we detected 4 of the 859 telemetered Atlantic Sturgeon registered with the ACT Network during this glider deployment (A–D in Figures 1–3, Table 1). All detections were near the 25-m isobath along the Delmarva Peninsula. Notably, we detected fish A on November 2, and again on November 11, 56.8 km to the south-west. The first detection event for fish A consisted of only three transmissions over a period of 120 s. During that time, the glider traveled horizontally approximately 20 m, from a depth of 10 m to the surface, where it connected with the MARACOOS glider operations center at Rutgers University. Unfortunately, this scheduled surfacing event likely lifted the dorsally mounted VMT out of the water, ending our detection of fish A on No-vember 2, 2011. The glider’s second encounter with fish A, on
November 11, 2011, consisted of 19 detections over a period of 3.78 h. During this period, the glider traveled 2.02 km and did not make a scheduled surfacing. The salinity measured by the glider during its detection of fish A ranged between 30 and 31 practical salinity units (PSU; Figure 2). Detections from fish B, C, and D lasted less than 1 h while the glider was in power-sav-ing mode toward the end of its deployment. All detections were verified as authentic by VEMCO Ltd. In power-saving mode, the science computers were powered down and did not take frequent oceanographic measurements. All of the detections for these fish were in waters deeper than 16 m and it is possible that the glider body was shadowing the dorsally mounted VMT from receiving transmissions from the bottom-associated Atlan-tic Sturgeon until the glider was at depth.
Detected Atlantic Sturgeon
Participants in the ACT Network provided the metadata for the Atlantic Sturgeon detected by the glider. Fish A was a 42-kg, 160-cm male that was originally captured April 13, 2009, off the coast of Delaware. This individual has been detected as far away as the Long Island Sound, and its last detection in the ACT Net-work was in Delaware Bay on October 19, 2011, before being
Figure 1. Tracks of the 71 Slocum glider missions between 2005 and 2011 (white lines) show the po-tential to develop mobile listening assets in the Mid-Atlantic. A VMT was attached to the dorsal side of a Slocum glider (upper inset) and deployed for 1 month. Telemetered Atlantic Sturgeon were detected in nearshore coastal waters along the Delmarva Peninsula (lower inset). Triangles represent the location of ACT hydrophones during the glider deployment.

Fisheries • Vol 38 No 5 • May 2013 • www.fisheries.org 213
detected by the glider on November 2 and again on November 11. These detections indicate that this Atlantic Sturgeon moved south at an average rate of ~7 km per day between October 19 and November 11. Fish B was a 39-kg, 157-cm male originally captured April 10, 2009, in the Delaware coastal ocean. This individual had been detected by the ACT Network as far away as the coast of North Carolina and was last detected by the ACT Network in Delaware Bay on September 26, 2011, before being detected by the glider on November 11, 2011. Fish C was a 43-kg, 159-cm male captured April 19, 2011. This individual was detected as far away as the Hudson River. Prior to its detection by the glider on November 15, 2011, it was last detected in the Delaware Bay on May 2, 2011. Fish D was an 18-kg, 129-cm juvenile tagged August 31, 2010, in Long Island Sound. It was last heard in Delaware Bay on May 10, 2011, before being de-tected by the glider on November 15, 2011.
Satellite and High-Frequency Radar Observations
A composite of satellite and high-frequency radar surface current observations while the glider was detecting Atlantic Sturgeon between November 2 and 15, 2011 provided the spa-tial context for understanding their habitat associations (Figures 2A–2D). During the glider mission, sea surface temperatures of Delaware Bay were much cooler than the coastal ocean, and the warmest waters were near the shelf break, reflecting seasonal mixing of coastal waters (Castelao et al. 2008). The spatial pattern of coastal salinity reflects a typical pattern of a coastally trapped river plume from Delaware Bay (Garvine 1995). These salinity estimates from the National Aeronau-tics and Space Administration’s MODIS-Aqua platform are in agreement with in situ measurements by the glider; however, satellite estimates of coastal salinity are ±2.2 PSU (Geiger et al. 2011). Surface currents showed that this river plume water mass is transported offshore at a rate of 5–13 cm s−1, creating a
Figure 2. In situ salinity profiles from the glider show that Atlantic Sturgeon detections occurred in fresher, well-mixed coastal water.
Table 1. Transmitter identification, dates, total detections, and distance traveled by the glider.
Fish Transmitter ID
Date No. of detections
Detection duration (h)
Distance traveled by the glider (km)
A 54839 11/2/11 3 0.03 0.02
A 54839 11/11/11 19 3.78 2.02
B 11632 11/13/11 10 0.65 0.24
C 20444 11/15/11 8 0.23 0.36
D 47914 11/15/11 3 0.11 0.18

Fisheries • Vol 38 No 5 • May 2013• www.fisheries.org 214
local convergent zone. An analysis of the water mass boundary locations and their gradient strengths derived from sea surface temperature and ocean color (Oliver and Irwin 2008) showed a complex mosaic of water masses in the coastal ocean (Figure 3c). The detections of these four telemetered Atlantic Sturgeon by the glider were clustered along the Delmarva coast in shal-low (14–27 m), relatively warmer (15.1–15.7°C), and fresher waters (28–31 PSU). These individuals were also closely as-sociated with the strongest of water mass fronts in the region (Figure 3c). Interestingly, all sturgeon detections by the glider occurred in the same coastal water mass as determined by tem-perature and ocean color (Figure 3d). These water masses are objectively determined against the global distribution of tem-perature and ocean color and are dynamic in space and time (Oliver and Irwin 2008; Irwin and Oliver 2009). This coastal water mass was nearshore and extended into the Delaware Bay and north along the coast of New Jersey.
DISCUSSION
The recent Endangered Species Act (ESA) listing of the Atlantic Sturgeon creates significant challenges for commercial fishers and resource managers. Large-mesh, sink gillnet and otter trawl fisheries have been identified as significant sources of Atlantic Sturgeon bycatch in the coastal ocean (NOAA 2012). Ironically, the sink gillnet fishery for Monkfish Lophius ameri-canus originated as bycatch in the Atlantic Sturgeon coastal intercept fishery. In the mid-1980s, sturgeon fishers began tran-sitioning to monkfish fishing because sturgeon landings were increasingly restricted and the market for monkfish began to expand prior to the cessation of the Atlantic Sturgeon fishery in 1998 (Fox et al. 2011). It is estimated that monkfish landings are worth up to US$55,000,000 per year (New England Fish-ery Management Council 2011) and are on par with the value in landings of North Atlantic Cod Gadus morhua (Platz et al. 2010). Bycatch in the coastal ocean appears to be a major source of Atlantic Sturgeon mortality and is cited as one of the five factors contributing to their ESA listing (NOAA 2012). There-fore, understanding how Atlantic Sturgeon orient themselves to specific hydrographic features in the coastal Mid-Atlantic is
Figure 3. Glider mission overlaid on the 2-week composite of (a) satellite sea surface temperature, (b) salinity, (c) water mass fronts, and (d) the unique water mass in which the glider detected the Atlantic Sturgeon (November 2–15, 2011). The horizontal banding in salinity is an artifact of the ocean color sensor design. Mean surface cur-rents (grey arrows, b) show the average movement of surface water during fish detections.

Fisheries • Vol 38 No 5 • May 2013 • www.fisheries.org 215
critical for reducing interaction between sink gillnet and otter trawl fisheries.
In this study, Atlantic Sturgeon were observed in shallow, well-mixed, relatively warm freshwater that appears to be as-sociated with the a water mass tied to Delaware Bay (Figure 2). These telemetered individuals were also very close to the edges of a distinct coastal water mass, suggesting aggregation around strong hydrographic and optical fronts. Although this demon-stration mission detected only four individuals, these observa-tions are compatible with previous studies showing that Atlantic Sturgeon remain near shore during their migration (Erickson et al. 2011) and associate with river plumes (Collins and Smith 1997). Association with coastal plumes is a reasonable expecta-tion for an anadromous species that transitions between fresh- and salt water numerous times during their life span. Clearly, more observations are needed to determine the hydrographic habitat associations of Atlantic Sturgeon in the coastal ocean.
The biotelemetry instruments on AUVs provide the capa-bility to traverse the coastal ocean outside fixed listening ar-rays. Undirected, AUVs are searching for the proverbial needle in a haystack. However, real-time ocean observatories provide dynamic mapping of hydrographic features that can influence coastal fish movements. Therefore, integrating the mobility of AUVs with ocean observatories provides a much-needed com-ponent for directing mobile listening assets to hydrographic fea-tures. Dynamic maps of hydrographic features from the ocean observatory can guide the distribution of AUV receiver assets to enhance the detections of telemetered individuals as they move through the coastal ocean.
Though the introduction of AUVs as listening platforms allows for directed searches outside of the boundaries of fixed acoustic arrays, these observations are potentially more difficult to interpret because both the targets and the AUV are moving. Furthermore, the seascape itself is changing as water masses form and move through the coastal ocean. Decorrelation time- and length scales of ocean surface temperatures range from 1 to 7 days and 300 km (Abbott and Letelier 1998; Hosoda and Kawamura 2004), and advection alone is enough to confound standard surveys of fishes (Stenevik et al. 2012). In our demon-stration mission, fish A was detected twice, 8 days and ~60 km apart, in the same water mass, which was probably not indica-tive of independent observations of Atlantic Sturgeon habitat association. Analyzing telemetry observations in a Eulerian framework leads to problems of temporal, spatial, and serial autocorrelation (Aarts et al. 2008). However, what is critical here is that all of the observations occurred in the same water mass that can be detected and tracked by the MARACOOS ob-servatory. The MARACOOS observatory allows researchers to locate and quantify the extent of water masses in the coastal ocean and calculate the AUV sampling effort within and across water masses. Therefore, AUVs can be used in a dynamic sea-scape to explore the relationship between Atlantic Sturgeon and the specific water masses they encounter. We suggest that the ability to track and detect water masses that are best targeted by AUVs creates an objective Lagrangian framework for testing
factorial hypotheses about coastal habitat associations of Atlan-tic Sturgeon. A Lagrangian framework reduces autocorrelation problems inherent in telemetry trajectories (Aarts et al. 2008), thus simplifying analysis of habitat associations by telemetered individuals. The collaborative coupling of AUV biotelemetry within a Lagrangian framework provided by ocean observato-ries holds promise for understanding imperiled resources like Atlantic Sturgeon in the coastal ocean. This approach can in-form management recommendations on the likely hydrographic factors that influence the timing and location of Atlantic Stur-geon encounters, which are now highly regulated under the pro-visions of the ESA.
ACKNOWLEDGMENTS
These efforts were only possible with funding support pro-vided by Charles and Pat Robertson, the DuPont Clear Into the Future Program, and NOAA-NMFS Species Recovery Grants to States and NOAA-NMFS NERO Office of Protected Re-sources. Ocean observing data were provided by the MARA-COOS project funded through the NOAA IOOS program office (NA07NOS4730221).
REFERENCES
Aarts, G., M. MacKenzie, B. McConnell, M. Fedak, and J. Matthio-poulos. 2008. Estimating space‐use and habitat preference from wildlife telemetry data. Ecography 31:140–160.
Abbott, M. R., and R. M. Letelier. 1998. Decorrelation scales of chlo-rophyll as observed from bio-optical drifters in the California cur-rent. Deep-Sea Research Part II: Topical Studies in Oceanography 45:1639–1667.
Atlantic States Marine Fisheries Commission (ASMFC). 2007. Spe-cial report to the ASMFC Atlantic Sturgeon Management Board: Estimation of Atlantic sturgeon bycatch in coastal Atlantic com-mercial fisheries of New England and the Mid-Atlantic. Atlantic States Marine Fisheries Commission, Washington, D.C.
Atlantic Sturgeon Status Review Team (ASSRT). 2007. Status re-view of the Atlantic sturgeon (Acipenser oxyrinchus oxyrinchus). Prepared by the Atlantic Sturgeon Status Review Team for the National Marine Fisheries Service, National Atmospheric and At-mospheric Administration, Northeast Regional Office, Gloucester, Massachusetts.
Backus, R. H. 1951. New and rare records of fishes from Labrador. Copeia 1951:288–294.
Castelao, R., S. Glenn, O. Schofield, R. Chant, J. Wilkin, and J. Kohut. 2008. Seasonal evolution of hydrographic fields in the central Middle Atlantic Bight from glider observations. Geophysical Re-search Letters 35:L03617.
Collins, M. R., and T. I. J. Smith. 1997. Management briefs: distri-butions of Shortnose and Atlantic Sturgeons in South Carolina. North American Journal of Fisheries Management 17:995–1000.
Curtin, T. B., J. G. Bellingham, J. Catipovic, and D. Webb. 1993. Autonomous oceanographic sampling networks. Oceanography 6:86–94.
Erickson, D. L., A. Kahnle, M. J. Millard, E. A. Mora, M. Bryja, A. Higgs, J. Mohler, M. DuFour, G. Kenney, J. Sweka, and E. K. Pikitch. 2011. Use of pop-up satellite archival tags to identify oceanic-migratory patterns for adult Atlantic Sturgeon, Acipenser oxyrinchus oxyrinchus Mitchell, 1815. Journal of Applied Ichthy-ology 27:356–365.

Fisheries • Vol 38 No 5 • May 2013• www.fisheries.org 216
Fiedler, P. C., and H. J. Bernard. 1987. Tuna aggregation and feed-ing near fronts observed in satellite imagery. Continental Shelf Research 7:871–881.
Fox, D. A., L. M. Brown, K. W. Wark, and J. L. Armstrong. 2011. A study on the use of tie-downs and their impact on Atlantic Stur-geon, marine mammal bycatch and targeted catch in the New Jersey monkfish fishery. Completion Report NOAA Bycatch Re-duction Engineering Program, Vol. EA133F-10-RQ-1160. North-east Fisheries Science Center, Gloucester, Massachusetts.
Garvine, R. W. 1995. A dynamical system for classifying buoyant coastal discharges. Continental Shelf Research 15:1585–1596.
Geiger, E. F., M. D. Grossi, A. C. Trembanis, J. T. Kohut, and M. J. Oliver. 2011. Satellite-derived coastal ocean and estuarine salinity in the Mid-Atlantic. Continental Shelf Research.
Grothues, T. M. 2009. A review of acoustic telemetry technology and a perspective on its diversification relative to coastal tracking ar-rays. Tagging and Tracking of Marine Animals with Electronic Devices 9:77–90.
Grothues, T. M., J. Dobarro, and J. Eiler. 2010. Collecting, interpreting, and merging fish telemetry data from an AUV: remote sensing from an already remote platform. Autonomous Underwater Ve-hicles (AUV) 2010 IEEE/OES.
Grothues, T. M., J. Dobarro, J. Ladd, A. Higgs, G. Niezgoda, and D. Miller. 2008. Use of a multi-sensored AUV to telemeter tagged Atlantic Sturgeon and map their spawning habitat in the Hudson River, USA. Autonomous Underwater Vehicles 2008 IEEE/OES.
Hosoda, K., and H. Kawamura. 2004. Global space–time statistics of sea surface temperature estimated from AMSR-E data. Geophysi-cal Research Letters 31:L17202.
Irwin, A. J., and M. J. Oliver. 2009. Are ocean deserts getting larger? Geophysical Research Letters 36: L18609.
Jackson, G. D. 2011. The development of the Pacific Ocean Shelf Tracking Project within the decade long Census of Marine Life. PloS One 6:e18999.
Manderson, J., L. Palamara, J. Kohut, and M. J. Oliver. 2011. Ocean observatory data are useful for regional habitat modeling of spe-cies with different vertical habitat preferences. Marine Ecology Progress 438:1–17.
New England Fishery Management Council. 2011. Monkfish fishery management plan Amendment 5 incorporating stock assessment
and fishery evaluation (SAFE). Federal Register, Vol. 76, Rules and Regulations.
NOAA (National Oceanic and Atmospheric Administration). 2012. Endangered and threatened wildlife; notice of 90-day finding on a petition to list Atlantic Sturgeon as threatened or endangered under the Endangered Species Act (ESA). Federal Registry 77:5880–5912.
Oliver, M. J., and A. J. Irwin. 2008. Objective global ocean biogeo-graphic provinces. Geophysical Research Letters 35:L15601.
Palacios, D. M., S. J. Bograd, D. G. Foley, and F. B. Schwing. 2006. Oceanographic characteristics of biological hot spots in the North Pacific: a remote sensing perspective. Deep Sea Research Part II: Topical Studies in Oceanography 53:250–269.
Palamara, L., J. Manderson, J. Kohut, M. J. Oliver, S. Gray, and J. Goff. 2012. Improving habitat models by incorporating pelagic measurements from coastal ocean observatories. Marine Ecology Progress Series 447:15–30.
Platz, T., D. Allen, and M. Claygon. 2010. Overview of the New Eng-land and Mid-Atlantic monkfish fishery. CapLog Report 2.02. Cap Log Group, LLC, Davis, California.
Schofield, O., J. Kohut, D. Aragon, L. Creed, J. Graver, C. Halde-man, J. Kerfoot, H. Roarty, C. Jones, D. Webb, and S. M. Glenn. 2007. Slocum gliders: robust and ready. Journal of Field Robotics 24:473–485.
Stein, A. B., K. D. Friedland, and M. Sutherland. 2004a. Atlantic Stur-geon marine bycatch and mortality on the continental shelf of the Northeast United States. North American Journal of Fisheries Management 24:171–183.
———. 2004b. Atlantic Sturgeon marine distribution and habitat use along the Northeastern Coast of the United States. Transactions of the American Fisheries Society 133:527–537.
Stenevik, E. K., R. D. M. Nash, F. Vikebø, P. Fossum, and K. Bakke-plass. 2012. The effects of survey design and circulation pattern on the perceived abundance of herring larvae: a case study for Norwegian spring spawning herring (Clupea harengus). Fisheries Oceanography 21:1–10.
Vladykov, V. D., and J. R. Greeley. 1963. Fishes of the western North Atlantic. Vol. 1(3). Sears Foundation for Marine Research, Yale University, New Haven, Connecticut.

Fisheries • Vol 38 No 5 • May 2013 • www.fisheries.org 217
Rick Hansen: Sturgeon HeroRick Hansen is a living hero—a man whose passions for
life and the environment literally pushed him over 40,000 kilo-meters through 34 countries—in a wheelchair. He is best known for his epic “Man in Motion World Tour” that raised millions of dollars and helped to establish the Rick Hansen Foundation to find a cure for spinal cord injuries and create more acces-sible communities; but he is also known as a champion for the endangered Fraser River White Sturgeon, the largest freshwater fish in North America. Rick was the founding chair of the Fra-ser River Sturgeon Conservation Society and was integral to the success of that Society’s initiation and continuation of the Lower Fraser River White Sturgeon Monitoring and Assessment Program (the results of the first 11 years of that program are presented presented in the article on page 197, entitled “Status of White Sturgeon in the Lower Fraser River, British Columbia” by Troy C. Nelson et al.). The following is a recent interview with Rick Hansen.
AFS: How far back do you and sturgeon go?
Hansen: The first time I saw a sturgeon was when I was ten years old, living in Abbotsford, a community on the lower Fraser River in British Columbia. I loved exploring and fish-ing and I was constantly looking for new territory in the local trout streams, new pools just around the corner, and eventually I found a point where the stream emptied into the Fraser River
and I saw this massive fish jump and it was just unbelievable. I actually caught a three-foot sturgeon on that trip and I had absolutely no idea what it was. Since then, I’ve encountered these ancient fish in many places in the Fraser River, and I’ve learned their story. When I was 15, I was simply crazy about being in the out-of-doors and I loved fishing in particular. A few friends and I went on a fishing trip to a wild and magical place on the far West Coast. We were hitchhiking back home, and the truck we were in rolled over. I broke my back and damaged my spinal cord. The journey is ironic; fishing and my passion for the environment contributed to my accident, but it also became part of my rehabilitation.
AFS: How so?
Hansen: At first I felt hopeless, but my desire to get back into the wilds of British Columbia, and especially my yearning to go fishing, motivated me to at least try. My younger brother helped by piggybacking me to our favorite fishing holes and, because of this type of support, I realized I could still do things that I loved. I built my character, but I was driven by the opportunities and curiosities that called to me from the natural environment. After I graduated from university, I realized I could make a dif-ference by wheeling around the world and forming my founda-tion. Fishing and the environment have always been there to inspire me to do the work that I do, and I made a pledge to give back to those things that have given so much to me.
Photo 1. Rick Hansen (in boat) and FRSCS volunteer Fred Helmer near Mission, British Columbia, in 2004 with a mature White Sturgeon that has been tagged and measured prior to release back into the Fraser River. In 2011, the use of tail ropes to secure captured sturgeon was banned. Photo credit: FRSCS.
INTERVIEW

Fisheries • Vol 38 No 5 • May 2013• www.fisheries.org 218
challenged, or worse. In the last cen-tury, Fraser River White Sturgeon have been challenged, as have other species and populations of sturgeon in many parts of the world, where overfishing and human development have been allowed to go unchecked. About 100 years ago, the White Stur-geon population in the lower Fraser River was almost wiped out by an aggressive commercial fishery that targeted large females for their eggs. The fishery eventually crashed due to a rapid decline in available fish, and the remaining sturgeon hung on to slowly rebuild the population. Up until the mid-1990s, the recreational fishery still allowed sturgeon to be harvested, and sturgeon captured incidentally by commercial salmon fishers could be retained. What re-ally pushed the conservation and protection for sturgeon in the lower Fraser River was a die-off of several large, mature sturgeon in the sum-mer of 1993; at least 34 huge fish, mostly females, washed up on the banks of the river and nobody ever figured out exactly why. It happened again in 1994. I had really come to know sturgeon and was really pas-sionate about them, and in spite of being incredibly busy with my work, I decided to assemble a group of like-minded folks to form the FRSCS to find out the real status of these fish and to establish programs to monitor and assist in the recovery of the population, plus we wanted to disseminate this information to the public. The society is now achieving
those objectives through credible science, community steward-ship, and an education program that focuses on youth. (To learn more, visit: www.frasersturgeon.com.)
AFS: And you were successful in your dream.
Hansen: With anything in terms of leadership it’s not only about the dream and the vision; you have to have the clarity of what you’re trying to accomplish, and you have to assemble a good team. I feel incredibly fortunate that I’ve been part of an amaz-ing team of people that were just as passionate about sturgeon as I was. Each of them had strengths that I could never dream of having. We found a biological expert who was incredibly pas-sionate about this fish, who was also personally affected to have the knowledge and the capacity and, ultimately, the talent to re-ally push out on a monitoring and assessment program that en-sured we had the right scientific model to set the protocols and
AFS: Please explain to your fellow members—in a nutshell—about the Fraser River Sturgeon Conservation Society (FRSCS). What it does and why you started it.
Hansen: We’ve spent more than a decade investigating issues that affect the recovery of Fraser River White Sturgeon using data collected through our volunteer-based tag and recapture monitoring program. We’ve also focused our efforts on a cur-riculum-based education program and have generally increased public awareness and understanding of White Sturgeon and the challenges that they face. Sturgeon themselves are a fascinat-ing fish. They’ve outlived dinosaurs and survived multiple ice ages and they are supreme survivors in both fresh and saltwa-ter environments—but the crux is that they can only spawn in freshwater and, of course, our species is famous for our ability to impound, divert, pollute, and critically alter freshwater habi-tats to the point where species such as salmon and sturgeon are
Photo 2. Rick Hansen addresses FRSCS volunteers prior to a sturgeon sampling event near Mission, British Columbia, on the lower Fraser River. Photo credit: FRSCS.
Photo 3. A juvenile White Sturgeon is injected with a passive inductive transponder tag (PIT) as part of the FRSCS Lower Fraser River White Sturgeon Monitoring and Assessment Program. Photo credit: FRSCS.
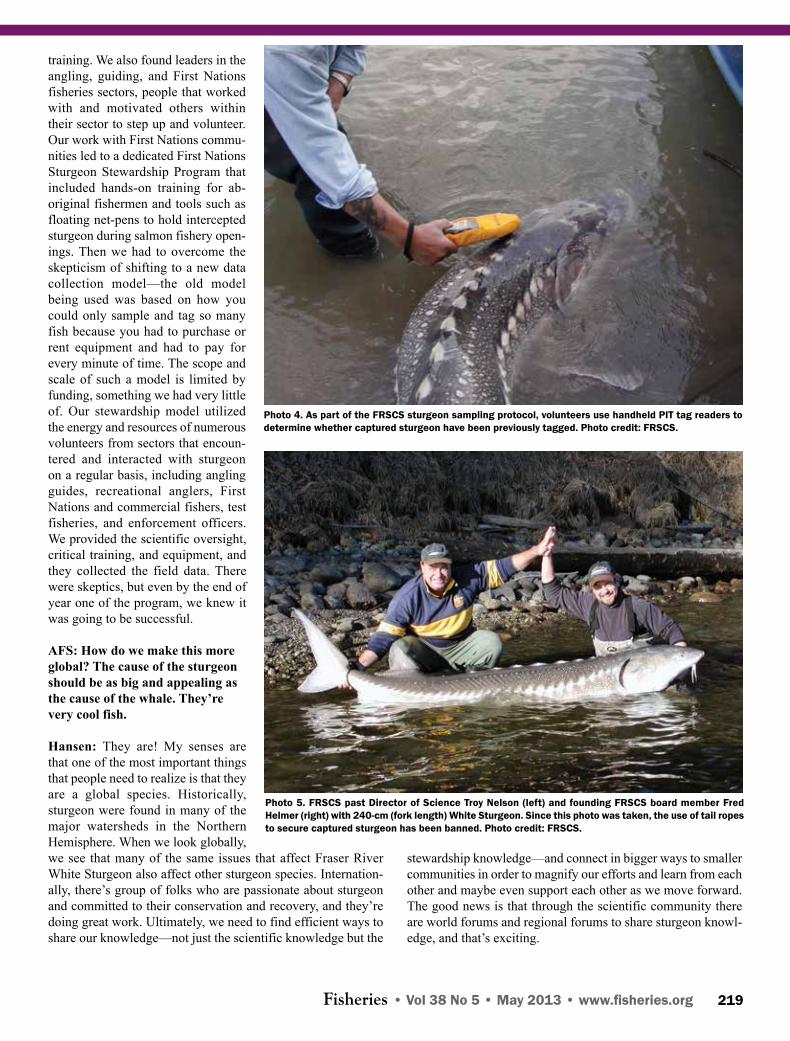
Fisheries • Vol 38 No 5 • May 2013 • www.fisheries.org 219
training. We also found leaders in the angling, guiding, and First Nations fisheries sectors, people that worked with and motivated others within their sector to step up and volunteer. Our work with First Nations commu-nities led to a dedicated First Nations Sturgeon Stewardship Program that included hands-on training for ab-original fishermen and tools such as floating net-pens to hold intercepted sturgeon during salmon fishery open-ings. Then we had to overcome the skepticism of shifting to a new data collection model—the old model being used was based on how you could only sample and tag so many fish because you had to purchase or rent equipment and had to pay for every minute of time. The scope and scale of such a model is limited by funding, something we had very little of. Our stewardship model utilized the energy and resources of numerous volunteers from sectors that encoun-tered and interacted with sturgeon on a regular basis, including angling guides, recreational anglers, First Nations and commercial fishers, test fisheries, and enforcement officers. We provided the scientific oversight, critical training, and equipment, and they collected the field data. There were skeptics, but even by the end of year one of the program, we knew it was going to be successful.
AFS: How do we make this more global? The cause of the sturgeon should be as big and appealing as the cause of the whale. They’re very cool fish.
Hansen: They are! My senses are that one of the most important things that people need to realize is that they are a global species. Historically, sturgeon were found in many of the major watersheds in the Northern Hemisphere. When we look globally, we see that many of the same issues that affect Fraser River White Sturgeon also affect other sturgeon species. Internation-ally, there’s group of folks who are passionate about sturgeon and committed to their conservation and recovery, and they’re doing great work. Ultimately, we need to find efficient ways to share our knowledge—not just the scientific knowledge but the
Photo 4. As part of the FRSCS sturgeon sampling protocol, volunteers use handheld PIT tag readers to determine whether captured sturgeon have been previously tagged. Photo credit: FRSCS.
Photo 5. FRSCS past Director of Science Troy Nelson (left) and founding FRSCS board member Fred Helmer (right) with 240-cm (fork length) White Sturgeon. Since this photo was taken, the use of tail ropes to secure captured sturgeon has been banned. Photo credit: FRSCS.
stewardship knowledge—and connect in bigger ways to smaller communities in order to magnify our efforts and learn from each other and maybe even support each other as we move forward. The good news is that through the scientific community there are world forums and regional forums to share sturgeon knowl-edge, and that’s exciting.

Fisheries • Vol 38 No 5 • May 2013• www.fisheries.org 220
Photo 6. A First Nations fisherman places a juvenile White Sturgeon into a floating holding cage in the lower Fraser River. Under the FRSCS First Nations Sturgeon Stewardship Program, cages such as this were placed near net fishing sites (that targeted salmon); fishermen were asked to transfer any sturgeon bycatch into the cage. All sturgeon were sampled and released on a daily basis. Photo credit: FRSCS.
Photo 7. Provincial conservation officers sampling a large White Sturgeon during an FRSCS training event in the lower Fraser River. FRSCS volunteers included both federal and provincial enforcement officers. Photo credit: FRSCS.
Photo 8. Rick Hansen and friends with a White Sturgeon that was sampled as part of the FRSCS Lower Fraser River White Sturgeon Monitoring and Assessment Program. The FRSCS has devel-oped a sturgeon education program that targets youth at both primary and secondary levels. Photo credit: FRSCS.
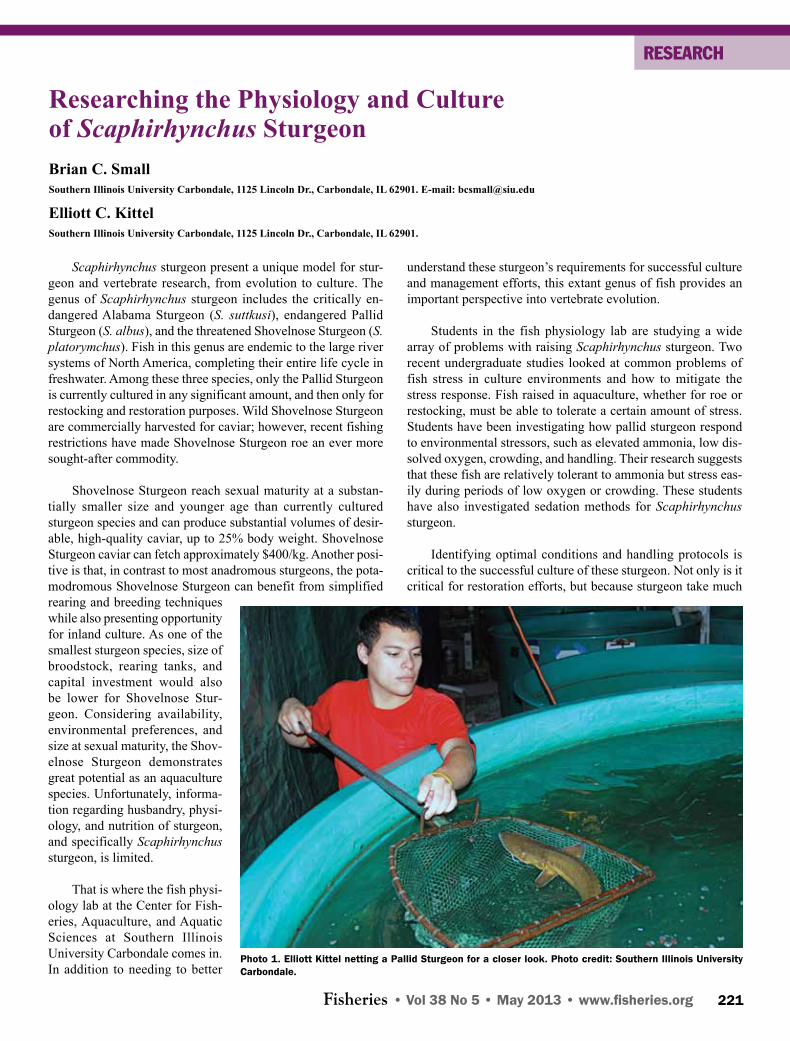
Fisheries • Vol 38 No 5 • May 2013 • www.fisheries.org 221
Researching the Physiology and Culture of Scaphirhynchus SturgeonBrian C. SmallSouthern Illinois University Carbondale, 1125 Lincoln Dr., Carbondale, IL 62901. E-mail: [email protected]
Elliott C. KittelSouthern Illinois University Carbondale, 1125 Lincoln Dr., Carbondale, IL 62901.
Scaphirhynchus sturgeon present a unique model for stur-geon and vertebrate research, from evolution to culture. The genus of Scaphirhynchus sturgeon includes the critically en-dangered Alabama Sturgeon (S. suttkusi), endangered Pallid Sturgeon (S. albus), and the threatened Shovelnose Sturgeon (S. platorymchus). Fish in this genus are endemic to the large river systems of North America, completing their entire life cycle in freshwater. Among these three species, only the Pallid Sturgeon is currently cultured in any significant amount, and then only for restocking and restoration purposes. Wild Shovelnose Sturgeon are commercially harvested for caviar; however, recent fishing restrictions have made Shovelnose Sturgeon roe an ever more sought-after commodity.
Shovelnose Sturgeon reach sexual maturity at a substan-tially smaller size and younger age than currently cultured sturgeon species and can produce substantial volumes of desir-able, high-quality caviar, up to 25% body weight. Shovelnose Sturgeon caviar can fetch approximately $400/kg. Another posi-tive is that, in contrast to most anadromous sturgeons, the pota-modromous Shovelnose Sturgeon can benefit from simplified rearing and breeding techniques while also presenting opportunity for inland culture. As one of the smallest sturgeon species, size of broodstock, rearing tanks, and capital investment would also be lower for Shovelnose Stur-geon. Considering availability, environmental preferences, and size at sexual maturity, the Shov-elnose Sturgeon demonstrates great potential as an aquaculture species. Unfortunately, informa-tion regarding husbandry, physi-ology, and nutrition of sturgeon, and specifically Scaphirhynchus sturgeon, is limited.
That is where the fish physi-ology lab at the Center for Fish-eries, Aquaculture, and Aquatic Sciences at Southern Illinois University Carbondale comes in. In addition to needing to better
understand these sturgeon’s requirements for successful culture and management efforts, this extant genus of fish provides an important perspective into vertebrate evolution.
Students in the fish physiology lab are studying a wide array of problems with raising Scaphirhynchus sturgeon. Two recent undergraduate studies looked at common problems of fish stress in culture environments and how to mitigate the stress response. Fish raised in aquaculture, whether for roe or restocking, must be able to tolerate a certain amount of stress. Students have been investigating how pallid sturgeon respond to environmental stressors, such as elevated ammonia, low dis-solved oxygen, crowding, and handling. Their research suggests that these fish are relatively tolerant to ammonia but stress eas-ily during periods of low oxygen or crowding. These students have also investigated sedation methods for Scaphirhynchus sturgeon.
Identifying optimal conditions and handling protocols is critical to the successful culture of these sturgeon. Not only is it critical for restoration efforts, but because sturgeon take much
Photo 1. Elliott Kittel netting a Pallid Sturgeon for a closer look. Photo credit: Southern Illinois University Carbondale.
RESEARCH

Fisheries • Vol 38 No 5 • May 2013• www.fisheries.org 222
longer to reach market than most aquaculture species, there is a significant investment for the farmer.
Graduate students in the fish physiology laboratory are ad-dressing the nutritional and endocrine regulation of growth in Scaphirhynchus sturgeon. These students have begun to delin-eate the optimal diet composition for maximizing growth in aquaculture and the hormonal mechanisms controlling growth. Two recently completed research projects include the optimiza-tion of dietary protein : energy ratio and utilization of soybean meal in the diet to improve feed sustainability. It turns out that
Photo 3. Close-up of a Scaphirhynchus sturgeon. Photo credit: Southern Illinois University Carbondale.
Scaphirhynchus sturgeon are not as tolerant of soybean meal as certain omnivorous species such as channel catfish.
Larval feeding can also be a problem with these fish. Many state and federal hatcheries feed live and frozen feeds to the larvae from the time they deplete their yolk sacs until the time they are stocked out for restoration purposes. For the farmer, this is impractical and involves transitioning the fish to dry feeds. Feeding protocols are being investigated that use only freeze-dried or prepared dry feeds. The goal is to improve larval survival and successfully wean the fish onto a fry starter feed by 3 months of age.
Photo 2. Carlin Fenn, Patrick Blaufuss, and Elliott Kittel showing off one of their lab sturgeon. Photo credit: Brian Small.

Fisheries • Vol 38 No 5 • May 2013 • www.fisheries.org 223
Photo 4. Lucas Nelson and Carlin Fenn help to collect a blood sample from a sturgeon. Photo credit: Southern Illinois University Carbondale.
Photo 5. Scaphirhynchus sturgeon in a tank. Photo credit: Brian Small.
Evaluating the endocrine regulation of growth in an ancient species such as the Shovelnose Sturgeon can aid in understand-ing the divergence of growth factors among a vast evolutionary span of vertebrates. It is hypothesized that, similar to teleosts and tetrapods, growth hormone mediates and stimulates the ana-bolic actions of insulin-like growth factor I (IGF-I) and insulin-like growth factor II (IGF-II) in sturgeon. Ongoing research in this area has led to the isolation and characterization of the IGF genes and demonstrates conservation of the growth axis. Scaphirhynchus sturgeon appear to differ from teleost fish in the tissue expression of IGF-II, suggesting that sturgeon IGF-II reg-ulation may be more similar to that of tetrapods. This research
aids in our understanding of the regulatory and evolutionary principles of the vertebrate growth.
Scaphirhynchus sturgeon and especially Shovelnose Stur-geon present a unique opportunity for biological, conservation, and aquaculture research. Their environmental preferences and small size at sexual maturity make them ideal for culture systems. Coupled with a relatively short maturation time, this genus of sturgeon can serve as a model for other species and provide insight into vertebrate evolution, while also providing income for U.S. fish farmers.

Fisheries • Vol 38 No 5 • May 2013• www.fisheries.org 224
BIOGRAPHY
Constantine Samuel Rafinesque1783–1840Daniel W. CobleStevens Point, WI 54481. E-mail: [email protected]
Have you ever wondered about the people who named our fishes, especially the people with unusual names? One such man was Constantine Samuel Rafinesque, an “eccentric naturalist.” He was a man of great ambition and energy with encyclopedic interests that included primarily botany, as well as fauna, medi-cine, astronomy, archeology, religion, Native Americans, and banking. He was a voluminous writer in French, Italian, and English. Much has been written about Rafinesque, some erro-neous and some starkly dissimilar. Various 19th-century writers referred to Rafinesque or his works as “in many respects the most gifted man who ever stood in our ranks”; “Like a brilliant meteor”; a man “in the history of science far ahead of his con-temporaries” but also “Much of his work is worthless” and, of his publications, “Most of them are rubbish, pure and simple.”
Born in Constantinople, Rafinesque was taken while an infant to Marseilles, where he began school, and then to Italy to escape the French Revolution. There he acquired Italian and was tutored in English. In 1802 he and his brother sailed to the United States. After landing in Philadelphia, he traveled in the next few years in Pennsylvania, Maryland, Delaware, New Jer-sey, Virginia, and Washington, D.C., collecting plants, animals, and fossils and making geological observations. He met Thomas Jefferson (1743–1846) and corresponded with him in subse-quent years, mainly seeking a professorship in the University of Virginia. In 1805 he returned with his brother and collections to Italy and then Sicily. In the next 10 years he became wealthy in the export business, married (1809, common-law), had a daugh-ter and son, and continued to travel, collect, write for journals, and published two works on fishes of Sicily in 1810.
Figure 1. Constantine Samuel Rafinesque’s descriptive list of specimens collected during a field trip in 1818. This item includes numer-ous detailed drawings of specimens and many hand-drawn maps with location names and topographical information. Rafinesque visited various locations in Pennsylvania, Kentucky, New York, and the District of Columbia. This book is also referred to as “Notes N. 17.” Photo credit: Smithsonian Institution.

Fisheries • Vol 38 No 5 • May 2013 • www.fisheries.org 225
He returned to the United States in 1815. The voyage of more than 100 days was disastrous from the start and culmi-nated with the ship foundering off the coast of Long Island. He lost all of his worldly goods, including collections of 20 years, books, unpublished manuscripts, drawings, and his share of the cargo. In 1815–1817 Rafinesque engaged in private tutoring and maritime trade, took up residence in New York City, collected specimens, and explored the Hudson River. He visited friends in Philadelphia from his previous time in the United States, sought a professorship in the University of Pennsylvania, was invited to become a member of the Academy of Natural Sciences of Philadelphia, and helped found the Lyceum of Natural History of New York. He published works of his own and made enemies from criticism in print of works of his contemporaries.
In the next year he started the first of his western explora-tions in which, when on land, he traveled by stage and horse-back but often on foot because “horses do not suit botanists.” He crossed the Alleghenies and contracted with a bookseller in Pittsburgh to map the Ohio River and his travels before floating down the river, stopping along the way to explore and collect specimens. He traveled overland in Ohio, Indiana, and Illinois to the mouth of the Wabash River and in Kentucky visited John James Audubon (1785–1851) for 8 days. After sending his col-lections of plants, fossils, shells, and preserved fishes to Pitts-burgh, he returned there and to Philadelphia, walking across Ohio and the Alleghenies. In June 1819 he returned to Lexing-ton, Kentucky, via Baltimore, crossed the mountains by a dif-ferent route, delivered the map to the bookseller, received $160, and continued by keelboat down the Ohio River.
Transylvania University in Lexington had been formed in the late 1700s. Although he had never been a college student, Rafinesque obtained a professorship there and for 7 years lec-tured in natural history; botany, including medical botany; and French, Italian, and Spanish while collecting in Kentucky and
Figure 2. Fish drawing from Rafinesque’s 1818 field notes. Photo credit: Smithsonian Institution.
Tennessee and preparing papers for publication, including the elaborate Ichthyologia Ohiensis (1820). By this time in his life he had also developed a great interest in Native Americans and their earthworks and languages.
In 1825 Rafinesque went east collecting as usual and visit-ing many places, including Washington, D.C., where he met President John Quincy Adams (1767–1848), and then returned to Lexington by a different route to close his affairs. He found that his rooms had been invaded and all of his possessions thrown in a pile. He sent his books and collections to Philadel-phia and in 1826 traveled east via Lake Erie, Buffalo, the Erie Canal, Niagara Falls, West Point, and New York City and settled in Philadelphia. He spent the next 14 years of his life traveling in nearly all of the mid-Atlantic states, lectured at the Franklin Institute and Rensselaer school, developed interest in and pro-moted state natural history surveys, and published many papers on a variety of subjects including a monograph of bivalve shells of the Ohio River, which was a continuation of a paper on the same subject he published in French in 1820.
He sold many of his natural history specimens in this period and earned income in two other ways. One was the manufacture and distribution of a proprietary medicine to cure tuberculosis. Rafinesque thought that he had had tuberculosis and had cured it with his own vegetable concoction, whose composition he never revealed. The other was the establishment of a successful bank, which allowed him to move into and occupy a whole house to himself in which he resided for the rest of his life, when he spent all he could spare on publishing his works. In 1836 he published his autobiography in English: A Life of Travels and Researches in North America and South Europe. It, along with his will, contains nearly all that is known of his personal life.
Rafinesque died in 1840 of stomach and liver cancer. In that year he credited himself with having written “220 works,

Fisheries • Vol 38 No 5 • May 2013• www.fisheries.org 226
pamphlets, essays, and tracts.” He was buried in Philadelphia in Ronaldson’s Cemetery. The cemetery was turned into a public playground in 1950 after removal of human remains.
Rafinesque was the first teacher of natural history west of the Appalachians and, along with Charles Alexander LeSueur (1778–1846), mostly on the primitive frontier along the Ohio and Wabash rivers, started North American freshwater ichthy-ology. His keen ability to see relations and differences among biota was matched with an inordinate zeal to find, describe, and name new genera and species. But he worked within the state of knowledge of his time with a paucity of literature on the biota in the new territory and lack of museum collections and of formal scientific training. These limitations, coupled with his taxonomic zeal, led to many descriptions that were hastily and carelessly prepared from field notes and included some of forms that he had not seen but were from descriptions of others. The result was many inaccuracies that have caused much confusion and criticism. Yet many of his classifications of both plants and animals were accurate, and today many of our fishes bear his name.
Figure 3. Enamel miniature of Constantine Samuel Rafinesque: from stip-ple engraving by P. Vaincher of original attributed to Falopi or to William Birch (1755–1834), Transylvania University, Lexington, Kentucky. Photo credit: Smithsonian Institution.
From the Archives
We have received the following letter from the Board of Game and Fish Commis-sioners of the state of Minnesota:
Dear Sir:
This will introduce to you Dr. Ethel-bert F. Greer, who takes a big inter-est in everything pertaining to fish and fish culture. He wishes to become a member of the American Fisheries Society and is leaving our city to attend the meeting. If consistent, I would like him to represent our Min-nesota Game and Fish Commission and anything you can do to make it pleas-ant for the doctor will be very much appreciated. Yours very truly,
SAM. F. FULLERTON,
Executive Agent.
I desire to propose the doctor as a member of this association. He happened to fall in with the Philistines coming down from Detroit this morning, but did not suffer any serious and lasting dam-age from the encounter.
F. B. Dickerson (1902): Transactions of the American Fisheries Society, 31:1, 10.

Fisheries • Vol 38 No 5 • May 2013 • www.fisheries.org 227
Bobbing slowly up and down, I keep my eyes tight on the bright horizon. The hot, sticky fabric of my Grundens brushes against my knees as I bend and brace for each wave. Thirty-five dedicated volunteers stand around me with their rods pointed out and, lines straight down in the water, anxiously anticipate nibbles. Standing at the center of the stern, my nose tickles with the smell of fresh clam bait, when I hear the first “FISH ON!” from Tom, one of our most avid fishing volunteers. All three of us in the fish tagging team leap into action, boat dipping and ris-ing as we stumble across each other’s paths, gathering scalpels, forceps, plastic tags, and data sheets. And again, “FISH ON! It’s a big one!” pierces the breezeless air from starboard side. Then two more “I got one!” shouts come from port side.
Flapping, dark-colored Black Sea Bass (BSB) are gingerly unhooked and tossed into our live well as volunteers look on with approval and pride for their contribution. The tag-team routine is methodical and efficient; we measure length, collect scales, record location, tag, and check sex all in under a few minutes. As I insert the bright orange anchor tag into the last BSB for the day, one of the volunteers leans in and asks me, “Can Black Sea Bass really change sex?”
It’s hard to imagine, but in a matter of weeks mature female BSB can undergo sex change and become fully functioning, ma-ture male fish. Because BSB change sex from female to male, most females are smaller in size and the largest fish are almost always male.
Tagging Black Sea Bass for Sex Change DataMikaela ProvostRutgers University, Institute of Marine and Coastal Sciences, 71 Dudley Road, New Brunswick, NJ 08901. E-mail: [email protected]
You might be wondering, why study sex change in BSB? Every year, from early summer to late fall, fisher-men along the Eastern Coast of the United States dip their hooks and pots into the water for the shimmery black fish. In New Jersey, the BSB commercial fishery generated $995,600 in 2010, the highest among all other East Coast states. Thousands of vacationers flock to the Jersey coast yearly to fish for this popular sport fish.
Since the 1970s, BSB were overfished, but in 2003 the stock had been rebuilt and overfishing eliminated. And yet fishery scientists at the Northeast Fisheries Sci-ence Center are wary about the BSB population, labeling it a “data-poor stock.” Black Sea Bass are data poor be-cause we don’t know how fishing pressure affects sex-changing populations. Again, you might be wondering what sex change and fishing pressure have to do with each other.
In New Jersey, the minimum size limit is 12 inches, which means that fishing mortality is heavier on males than it is on females (because, as I mentioned earlier, most larger fish are males). We know from laboratory experiments that if a male BSB is removed from a group of females, the largest female will change her sex. If sex change is triggered by the absence of male BSB in the population, will fishing pressure have a similar effect? In New Jersey, where fishing pressure is and has been historically high, are female BSB undergoing sex reversal at smaller and smaller sizes to replace males caught by fishermen? Or has the sex ratio of female : male BSB become so skewed (lots of females and very few males) that there is not enough sperm to fertilize all of the eggs? We are interested in these questions and more.
Our project aims to determine when sex change occurs and how prevalent sex change is in BSB off the coast of New Jersey. Local charter boat captains, commercial fishermen, and volunteer fishermen have all helped to tag over 1,500 BSB. Re-captured BSB are checked for sex change. As local fishermen return more and more recaptures we’ll know more about the timing of sex change and how frequently sex change occurs in hermaphroditic populations.
Many of the old-timer fishermen who’ve seen New Jersey’s coast transform and support an influx of people and years of development tell me with certainty that some fish have come and gone, but BSB are still here and people love to fish them. Learning more about sex change and fishing pressure will help make sure BSB are here to stay for many generations to come.
Mikaela Provost out on the water.
STUDENT ANGLE

Fisheries • Vol 38 No 5 • May 2013• www.fisheries.org 228
AFS Genetics Section Members Attend Meeting on “Next Generation” DNA Sequencing for Fisheries Research in Southeast AsiaMarissa Jones School of Aquatic and Fishery Sciences, University of Washington, Seattle, WA 98195. E-mail: [email protected]
UNIT NEWS
Genetic research advances at a fast pace, and as the cost of DNA sequencing decreases, fisheries geneticists repeatedly face the question of whether to jump on board with new technolo-gies. Should a lab invest vast sums of time and money into a new approach that might well be obsolete within a few years, or risk passing up exciting discoveries as peers forge ahead?
Deciding whether and when to adopt new approaches was a central theme at the recent Pan-Pacific Advanced Studies In-stitute (PacASI) conference on genomic applications to marine science and resource management in Southeast Asia. American Fisheries Society Genetics Section members joined a team of
sixty researchers and students from nine different countries around the Pacific Rim to discuss new advances in genetic se-quencing. The ten-day conference in Dumaguete, Philippines was hosted by Silliman University and funded by the United States National Science Foundation.
Traditional genetics typically focuses on a handful of ge-netic markers. It often only takes a few variable loci to tell pop-ulations apart, assess migration, and infer other demographic processes like hybridization and inbreeding. Next generation sequencing (NGS), on the other hand, is an umbrella term for a number of techniques for rapidly obtaining short DNA sequences at thousands of loci. With enough coverage, these short sequences could be assembled into a complete genome, but most biologists who work on wild organisms consider this overkill, not to mention prohibitively expensive. Instead, they use NGS to obtain a representative sample of genome-wide variation in their study species. In addition to discovering more markers that can be used to differentiate populations, NGS of-fers an unprecedented opportunity to study adaptive evolution, with the potential to link specific genetic characteristics to traits under natural selection in the wild. Adaptive evolution is a cen-tral theme in both genetics and ecology, but the fact remains that surprisingly few studies are able to connect specific genetic dif-ferences with adaptive traits and place them a larger ecological
Photo 1. PacASI conference participants were a mix of scientists and students from North America and Southeast Asia. Ready to load the bus to attend tutorials are, left to right: Mudjekeewis D. Santos (National Fisheries Research and Development Institute, Philippines), Bill Cresko* (University of Oregon), Subha Bhassu (University of Malaya), Luiz Rocha (California Academy of Science), Jim Seeb* (University of Washington), Demian Willette (Old Dominion University), Kent Carpenter (Old Dominion University), Marissa Jones* (University of Washington), Menchie Alban-Lagman (De La Salle University), Fred Allendorf* (University of Montana), Lisa Seeb* (University of Washington), Chona Vince Cruz (De La Salle University), Brian Stockwell (Old Dominion University), Rachel Ravago-Gotanco (University of the Philippines). Not pictured: Wes Larson* (Uni-versity of Washington).*AFS Genetics Section Member
Photo 2. Genetics Section Members at PacASI. Left to right: Bill Cresko (University of Oregon), conference co-coordinator Demian Willette (Old Dominion University), Lisa Seeb (University of Washington), Fred Allen-dorf (University of Montana), Marissa Jones (University of Washington), Jim Seeb (University of Washington). Not pictured: Wes Larson (University of Washington).
With enough coverage, these short sequences could be assembled into a complete genome, but most biologists who work on wild organisms consider this overkill, not to mention prohibitively expensive.

Fisheries • Vol 38 No 5 • May 2013 • www.fisheries.org 229
context. This has been something of a holy grail for biologists, and as the costs of sequencing continue to decline, this long-sought goal may finally be within reach.
Conference organizer Dr. Kent Carpenter (Old Dominion University) and members of the organizing committee from the U.S., Philippines, and Vietnam, hoped to provide a “road map” to guide scientists to the appropriate technique for their research questions—and their budget. Presentations fell into two major categories: researchers at the forefront of NGS in fish and other marine organisms shared discoveries and lessons learned; other scientists contributed what they had discovered using traditional genetics and opened up the floor for discussion of how NGS might be applied to resolve lingering questions or expand in new directions.
Some major themes at the meeting were detecting popula-tion structure in species exploited in commercial and artisanal fisheries and determining whether networks of Marine Pro-tected Areas provide sufficient population connectivity. Iden-tifying whether marine fish stocks are genetically homogenous or distinct populations can be challenging because of their large population sizes and geographic ranges. If traditional genetics failed to identify population structure, would NGS be able to detect the signal in the noise? Would it be possible to study adaptive evolution and management concerns simultaneously? These questions are hardly unique to Southeast Asia, but they are magnified in this region, where biodiversity and human use of the marine environment are both at their maximum.
Despite its promise, NGS presents its own hurdles. Inter-preting NGS data is bioinformatically intensive and requires computer programming skills that may be outside of the milieu of most traditional geneticists, ecologists, and managers. Pa-cASI addressed this concern by providing hands-on tutorials, lessons learned from researchers already using the techniques, and breakout sessions for discussing how NGS might aid re-source management in Southeast Asia. The investment in time
and training to get up to speed on new techniques is not trivial. As Dr. Bill Cresko (University of Oregon) cautioned, “Do not underestimate the time it takes just to wrap your head around what it means to work with two hundred million [DNA sequenc-ing] reads.”
Most conference participants agreed that, while NGS is a powerful tool, it is not likely to replace traditional genet-ics entirely. NGS is most appropriate for managing abundant and heavily exploited species such as tuna and sardines, or for smaller studies that have a direct focus on adaptation. How-ever, rather than jumping into the deep end of NGS sequenc-ing, small-scale research on understudied species, such as the thousands of tropical reef fishes that we know almost nothing about, is probably better served by traditional approaches, but only after some basic ecology is understood. Dr. Paul Barber (University of California, Los Angeles) explained, “Doctors have CAT scans and MRIs, but they still take your temperature and use a stethoscope.”
As the epicenter of marine biodiversity, the Philippines was an ideal host nation for PacASI—and fortunately, the conference wasn’t exactly all work and no play. Following presentations about why the Coral Triangle in general and the Philippines in particular are so diverse, conference participants witnessed the phenomenal variety of marine creatures for themselves while diving and snorkeling at nearby Apo Island. Formal and infor-mal meetings sparked conversations on tradeoffs between NGS and traditional methods. While much remains to be learned, this type of collaboration is a key step in navigating the largely uncharted waters of next generation sequencing for fisheries research.
For more information on the meeting, visit http://sci.odu.edu/impa/pacasi/index.html. To learn more about Advanced Studies Institutes in general, go to www.nsf.gov/funding/pgm_summ.jsp?pims_id=5327.
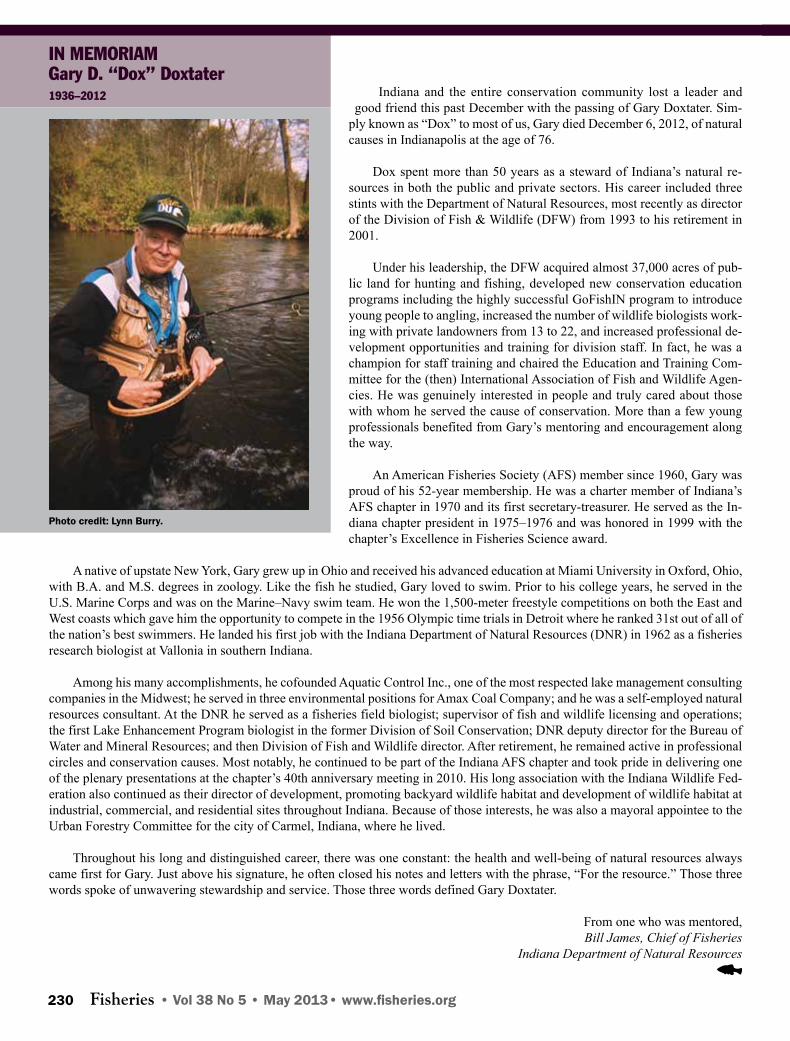
Fisheries • Vol 38 No 5 • May 2013• www.fisheries.org 230
Indiana and the entire conservation community lost a leader and good friend this past December with the passing of Gary Doxtater. Sim-
ply known as “Dox” to most of us, Gary died December 6, 2012, of natural causes in Indianapolis at the age of 76.
Dox spent more than 50 years as a steward of Indiana’s natural re-sources in both the public and private sectors. His career included three stints with the Department of Natural Resources, most recently as director of the Division of Fish & Wildlife (DFW) from 1993 to his retirement in 2001.
Under his leadership, the DFW acquired almost 37,000 acres of pub-lic land for hunting and fishing, developed new conservation education programs including the highly successful GoFishIN program to introduce young people to angling, increased the number of wildlife biologists work-ing with private landowners from 13 to 22, and increased professional de-velopment opportunities and training for division staff. In fact, he was a champion for staff training and chaired the Education and Training Com-mittee for the (then) International Association of Fish and Wildlife Agen-cies. He was genuinely interested in people and truly cared about those with whom he served the cause of conservation. More than a few young professionals benefited from Gary’s mentoring and encouragement along the way.
An American Fisheries Society (AFS) member since 1960, Gary was proud of his 52-year membership. He was a charter member of Indiana’s AFS chapter in 1970 and its first secretary-treasurer. He served as the In-diana chapter president in 1975–1976 and was honored in 1999 with the chapter’s Excellence in Fisheries Science award.
A native of upstate New York, Gary grew up in Ohio and received his advanced education at Miami University in Oxford, Ohio, with B.A. and M.S. degrees in zoology. Like the fish he studied, Gary loved to swim. Prior to his college years, he served in the U.S. Marine Corps and was on the Marine–Navy swim team. He won the 1,500-meter freestyle competitions on both the East and West coasts which gave him the opportunity to compete in the 1956 Olympic time trials in Detroit where he ranked 31st out of all of the nation’s best swimmers. He landed his first job with the Indiana Department of Natural Resources (DNR) in 1962 as a fisheries research biologist at Vallonia in southern Indiana.
Among his many accomplishments, he cofounded Aquatic Control Inc., one of the most respected lake management consulting companies in the Midwest; he served in three environmental positions for Amax Coal Company; and he was a self-employed natural resources consultant. At the DNR he served as a fisheries field biologist; supervisor of fish and wildlife licensing and operations; the first Lake Enhancement Program biologist in the former Division of Soil Conservation; DNR deputy director for the Bureau of Water and Mineral Resources; and then Division of Fish and Wildlife director. After retirement, he remained active in professional circles and conservation causes. Most notably, he continued to be part of the Indiana AFS chapter and took pride in delivering one of the plenary presentations at the chapter’s 40th anniversary meeting in 2010. His long association with the Indiana Wildlife Fed-eration also continued as their director of development, promoting backyard wildlife habitat and development of wildlife habitat at industrial, commercial, and residential sites throughout Indiana. Because of those interests, he was also a mayoral appointee to the Urban Forestry Committee for the city of Carmel, Indiana, where he lived.
Throughout his long and distinguished career, there was one constant: the health and well-being of natural resources always came first for Gary. Just above his signature, he often closed his notes and letters with the phrase, “For the resource.” Those three words spoke of unwavering stewardship and service. Those three words defined Gary Doxtater.
From one who was mentored,Bill James, Chief of Fisheries
Indiana Department of Natural Resources
IN MEMORIAMGary D. “Dox” Doxtater 1936–2012
Photo credit: Lynn Burry.

Fisheries • Vol 38 No 5 • May 2013 • www.fisheries.org 231
The fisheries research and management communities lost a highly respected leader and a consummate professional when Jack McIntyre passed away suddenly on December 3, 2012. Widely published and with important contribu-tions in population biology and conservation management, Jack was something of a legend in the fisheries profession in the Pacific North-west and beyond. All of us (and most especially his loving wife, Mary, and his son, Mike) were deeply saddened by his untimely death.
Jack was born in Jamestown, New York, in 1938. After graduating from New York’s Frews-burg Central School in 1957, Jack and Mary became engaged just as he joined the U.S. Air Force in 1958 (they married in 1960). He served at Lackland Air Base in San Antonio, Texas; in Aurora, Colorado; and in Sumter, South Caro-lina (Shaw AFB), training pilots on simulators. He returned to Colorado to a newly opened Air Force Academy in Colorado Springs in 1961 to train navigators. Always reaching for more by taking evening classes at local col-leges, Jack was accepted into a B.A. program at Cornell after his military discharge. He finished that degree at Colorado State College in Greeley (now the University of Northern Colorado) while deciding on a career in the fish and wildlife sciences, a path that brought him to Corvallis, Oregon, on an M.S. graduate assistantship in fisheries. He completed his M.S. degree in 1967. He also obtained his Ph.D. in fisheries from Oregon State University (in 1970). Both dissertations were completed under the guidance of Dr. Gerald Davis and each dealt with production and behavioral interactions of salmonids in experimental streams. Jack became the assistant leader of the Oregon Cooperative Fisheries Research Unit (led by Dr. Ray Simon) in 1971 and the unit leader in 1973 (as a U.S. Fish and Wildlife Service employee), where he taught and oversaw a diverse fisheries research program (through 1977) with his students. Some can recall Jack as an advisor who could cause palpitations in the hearts of his graduate students. But that tough exterior masked “a heart of gold” and none of us left without great respect for this man and appreciation for his contributions to our educations and careers.
In 1977, Jack transferred to the Seattle National Fisheries Research Center (then administered by the U.S. Fish and Wildlife Service but now the U.S. Geological Survey Western Fisheries Research Center) where he led the Population Ecology Research Section. He was instrumental in the formation of three new field stations (the Columbia River Research Laboratory in Cook, Washington; the Alaska Field Station in Anchorage; and the Reno Field Station, Nevada). He spent a brief period (1978–1979) in Red Bluff, California, during the 13 years he was associated with the Seattle lab. Jack’s forte was salmonid population dynamics. His personal interests were focused on research to clarify the limiting factors behind declines in salmon populations, the effects of hatchery supplementations on wild stocks, the value of conservation genetics for fish population recovery, and innovative ways to formulate these approaches into practical, simple tools for resource managers. His 1982 publication Limitations and Guidelines for the Use of Artificially Propagated Anadromous Salmonids in Management Programs was a prescient examination of the risks posed by certain hatchery supplementation efforts that have come under increasing scrutiny in recent years. Jack was a science writer who insisted on clarity and precision before any contribution could be deemed worthy of publication in the fisheries literature.
Jack joined the U.S. Forest Service’s Intermountain Research Station in Boise, Idaho, in 1990 to lead a new program focused on the conservation biology of native fishes. This leadership role led to important contributions for conserving threatened Bull Trout, Cutthroat Trout, and Chinook salmon and created a model for technology transfer that has been emulated throughout the agency. He retired from federal service in 1994 but remained active in fisheries conservation roles that included monitoring of threatened salmon populations, Forest Service program reviews, exotic species control efforts in Yellowstone National Park, a Washington State Governor’s Panel for Salmon Recovery, and the Independent Science Review Panel for the Northwest Power Planning Council for Columbia River fisheries mitigation. He served as an associate editor for the American Fisheries Society’s North American Journal of Fisheries Management in 1998. Jack was honored with inclusion in Oregon State University’s Registry of Distinguished Gradu-ates in 2001, an accolade reserved for those select few who have made major contributions and achieved noteworthy distinction in natural resource education, research, or management. Jack was also a passionate, expert birder who helped the Audubon Society with many of their annual surveys.
IN MEMORIAMJohn D. (Jack) McIntyre
1938–2012
Jack and Mary (Little) McIntyre at a recent wedding anniversary.
Fisheries • Vol 38 No 5 • May 2013• www.fisheries.org 232
Some of us were his graduate students (R.W. 1972; C.B. 1974; R.R. 1976; and J.H. 1979). All of us were his colleagues and friends. For us and many others, Jack was a mentor in all areas of our professional development (academics, job perfor-mance, and conservation ethics) as well as our personal lives. Most of us would not have had the opportunities or the positions we now cherish were it not for the kind, passionate support we received from Jack McIntyre. He was a top-notch professional who would not hesitate to call any of us onto the carpet if he felt that our science was lacking (something that several of us will recollect from first-hand experience), and we are all the better for it.
A large part of Jack’s legacy was his ability to keep others excited about science and to constantly make us strive to be the very best biologists we could be. He regularly reminded us that we had the best jobs in the world. He embraced change and challenge and he demanded professional excellence—in his students, employees, colleagues, and superiors—but he accom-plished that with love and with a unique sense of humor. We lost a great man in Jack McIntyre’s passing. He was a courageous leader, unafraid to tackle any controversial fisheries research or management issue, whose visionary thinking positively af-fected our contemporary perspectives in fish recovery planning. These sentiments express the collective input and contributions of many of Jack’s close friends and colleagues over the years. He changed us, he inspired us, he challenged us, and he helped make us who we are. His creative thinking and his inspiring style touched us all. He will be missed.
Carl Burger, Bruce Rieman, Reg Reisenbichler, Jack Helle, Richard Wilmot, Carl Schreck, Hiram Li, and Jim Lichatowich

Fisheries • Vol 38 No 5 • May 2013 • www.fisheries.org 233
BOOTH RESERVATION
AFS- Little Rock, AR September 8–12, 2013
Please complete this application in its entirety. Please print or type all information.
Company Name __________________________________________________________________________________________
Address _________________________________________________________________________________________________
City ____________________________________________________ State ________________ Zip _____________________
Phone ____________________________________________________ Fax _________________________________________
Company Contact ______________________________________ Email ___________________________________________
*Please email your company’s description, (approximately 75 words) as you would like it to appear in the meeting program guide. Please also include your address, phone and web-address and forward to [email protected] prior to June 1, 2013.
Due to printing deadlines, descriptions received after this date will not appear in the program guide.
BOOTH FEES
-AFS member firm*: $1,500.00 per 10 x 10 booth-AFS nonmember firm: $1,650.00 per 10 x 10 booth-Crafters/Non-Profit: $550.00 per 10 x 10 booth-Boat Display: $500.00 w/Booth Rental. Multi boat discount available.
* To qualify for member rate, the exhibiting company must hold a sustaining, official, or associate membership with AFS. Please include your verifiable membership number: #__________________.
Number of Booths Total Cost________________ ___________
We would like to be located near_____________________________________________
We would rather not be located near_____________________________________________
AFS reserves the right to assign an alternative choice based on availability.We agree to abide by the AFS 2013 Annual Meeting Booth Reservation Terms and Conditions specified on this booth reservation form, which are made part hereof by reference.
_____________________________________________Signature
PAYMENT
Please send reservation request with full payment, or 50% de-posit of the full payment payable to American Fisheries Society. The balance will be due by July 1, 2013. Applications submitted after July 1, 2013 must be accompanied by full payment.
Cancellations received on or after April 15, 2013 and prior to July 1, 2013 will be assessed a cancellation fee equal to 50% of the total exhibit space rental fee. Cancellations received after July 1, 2013 will be assessed a cancellation fee equal to 100% of the total exhibit space rental fee.
CHECK:
Amount enclosed $__________________.
CREDIT CARD (Circle One) Visa Amex MasterCard
_______________________________________________________Name as it appears on card
_______________________________________________________Card number
_______________________________________________________Exp. Date 3-digit Security Code
_______________________________________________________Signature
RETURN COMPLETED FORM WITH DEPOSIT TOAmerican Fisheries Society, 5410 Grosvenor Lane, Suite 110, Bethesda, MD 20814, Attn: Shawn Johnston
Questions about the Trade Show or Advertising? Please contact Shawn Johnston, AFS Trade Show Coordinator, 301-897-8616 x 230 [email protected] Fax 301-897-8096
Fisheries • Vol 38 No 5 • May 2013• www.fisheries.org 234
The Continuing Education Committee has put together a diverse suite of courses for the 2013 Annual Meeting. The courses cover a variety of topics, ranging from ArcGIS, leadership skills, side-scan sonar mapping, to the implementing compliance of the EPA Clean Water Act §316(b) Existing Facility Rule. When you register for the annual meeting, consider taking one or more of these courses, all of which will help increase your professionalism, perspective, and skill set when you return to your job.
Continuing Education ProgramAmerican Fisheries Society 143rd Annual Meeting, Little Rock 2013 | September 8th–September 12th
LITTLE ROCK MEETING UPDATE
FREE! LEADERSHIP AT ALL LEVELS IN AFSSteve L. McMullin, Virginia Tech; [email protected]
This workshop is designed for new and emerging leaders in AFS; it addresses the need for new and emerging leaders to better understand how AFS functions, the roles of unit leaders in AFS, and how to be an effective leader in an all-volunteer organization such as AFS.
BASIC/INTERMEDIATE GIS FOR FISHERIES BIOLOGISTSJoanna Whittier, University of Missouri; [email protected]: Student $125; Member $220; Non-member $250
This course will provide an overview of basic/intermediate GIS skills for fisheries biologists using ArcGIS, including use of existing data, creating your own data, and review of fundamental concepts for GIS.
ADVANCED GIS FOR FISHERIES BIOLOGISTSJoanna Whittier, University of Missouri; [email protected]: Student $150; Member $220; Non-member $270
Building on the Basic/Intermediate GIS for Fisheries Biologists course, this course will focus on geoprocessing, interpolation, and spatial analysis methods to aid in fisheries monitoring and research.
MAPPING AQUATIC HABITAT OF INLAND FRESHWATER SYSTEMS USING SIDE-SCAN SONARThom Litts, Georgia Department of Natural Resources; [email protected]: Student $100; Member $150; Non-member $200
This course is an introduction to using the inexpensive Humminbird® Side Imaging system to map and quantify benthic habitats at the landscape scale. The course includes a practical session covering techniques for geoprocessing sonar imagery and map development within ArcGIS 9.x.
NEW! EPA CLEAN WATER ACT §316(b) EXISTING FACILITY RULE: FISH AND SHELLFISH PROTECTION AT COOLING WATER INTAKES 101–102Doug Dixon, AFS Bioengineering Section and Electric Power Research Institute; [email protected]: Student $50; Member $100; Non-member $150
On June 27, 2013, the U.S. EPA will release a final rule—in development since 1995—implementing the requirements of Section 316(b) of the Clean Water Act. This Section requires that “… the location, design, construction, and capacity of cooling water intake structures reflect the best technology available for minimizing adverse environmental impact.” The Rule, released on June 27, will specify compliance requirements for protecting fish and shellfish from the processes of impingement and entrainment at cooling water intakes. Implementing the Rule’s requirements will be a challenge for industry, state resource and regulatory agencies, consultants, and the public. All will need information on interpretation of the Rule’s requirements and, more important, information on fish protection technologies and fish sampling methods and data analysis. The AFS Bioengineering Section is ideally suited to provide the information required to implement the Rule’s requirements, as our focus is on technologies for fish protection and fish passage.
NEW! STANDARD METHODS FOR SAMPLING AND COMPARING DATA WITH NORTH AMERICAN STANDARDS IN FISHERIESSTANDARDSAMPLING.ORGNorman Mercado-Silva, AFS Fisheries Management Section and School of Natural Resources and the Environment, University of Arizona/University of Guadalajara, Mexico; [email protected]: Student $100; Member $150; Non-member $200
The program of this course is planned in response to the need to implement AFS standardized methods for sampling freshwater fishes. Implementa-tion of these methods will increase the fisheries professional’s capacity to improve management practices for enhancing freshwater fish populations. Fisheries managers, undergraduate and graduate students, and academics will benefit from learning how to use an online tool developed through the AFS Fish Management Section to easily compare their own fisheries data with ecoregional, national, and continent-wide averages for four dif-ferent fish population indices.
NEW! INTEGRATING HISTORIC AND CONTEMPORARY INVENTORY AND MONITORING DATA WITH ArcGIS, PYTHON, AND R FOR FISHERIES RESTORATION AND HABITAT PLANNINGDavid Galbraith, U.S. Fish & Wildlife Service; [email protected] Tuition: Student $100; Member $150; Non-member $200
Participants will gain knowledge of two habitat monitoring programs widely used in the United States, the PIBO EMP and the EPA’s EMAP. Following field-based data collection, participants will receive data entry guidelines and import information on both R and ESRI ArcMap Software. This will lead to habitat suitability modeling for both native and introduced invasive fish species in the context of fisheries planning and decision support systems. Finally, participants will receive assistance with implementing their own individual study plans in a brief workshop.

Fisheries • Vol 38 No 5 • May 2013 • www.fisheries.org 235
COLUMNGuest Director’s Line
The Susquehanna River—A Fishery in DeclineJohn A. ArwayPennsylvania Fish and Boat Commission, 1601 Elmerton Avenue, Harrisburg, PA 17106. E-mail: [email protected]
Geoffrey SmithPennsylvania Fish and Boat Commission, 1601 Elmerton Avenue, Harrisburg, PA 17106
As fisheries scientists, we were all taught early on in our education that there are two primary components to a fishery. There are the fish, including the sport fish, forage fish, aquatic invertebrates, and other members of the resident biological community that we, as fisheries professionals, study, protect, manage, and conserve. The other part of the fishery definition includes the act of taking fish whether by recreational, com-mercial, or subsistence means. Both parts of the definition are necessary for a fishery to exist.
We have a river in Pennsylvania that once supported a world-class Smallmouth Bass Micropterus dolomieu fishery. The Susquehanna River drains 27,510 mi2, covering half the surface area of Pennsylvania and portions of New York and Maryland. It comprises 43% of the Chesapeake Bay’s drainage area with more than 49,000 miles of flowing waters (Susque-hanna River Basin Commission 2006). Unfortunately, begin-ning in 2005, anglers fishing the river began reporting thousands of dead and dying young bass. Fortunately, our staff scientists have been monitoring young of year Smallmouth Bass for over
30 years. Declining trends in relative abundance of age-0 Small-mouth Bass have been observed in the middle reach of the river (Sunbury to York Haven) since at least 2005 (Figure 1). Poor year classes coupled with bacterial disease–related mortality have caused poor recruitment over time, resulting in substan-tially lower relative abundance of adult bass (Figure 2).
Anglers used to travel from all over the world to fish the Susquehanna, and even we could catch over 100 bass in an af-ternoon of fishing before 2005. Our boat launch parking lots were filled with trucks and boat trailers, and our river guides—including internationally known Lefty Kreh and Bob Clouser—were booked for guided trips all year long. This is no longer the case. Our agency, the Pennsylvania Fish and Boat Commission, has taken action by prohibiting harvest, implementing immedi-ate catch-and-release regulations, and creating a closed season that prohibits anglers from targeting bass during the spawning period (May 1–June 14). However, these actions do not address the causes and sources of the problems that continue to plague the river and our fishery. They are only designed to protect the remaining adult bass while we work on a plan to fix the water-shed’s problems.
Coincidental with the 2005 fish kills, we began observing nuisance blooms of Cladophora spp.—inva-sive green filamentous algae that interfere with recreational fishing and lower dissolved oxygen through nighttime respiration to stressful levels for warmwater fish. Chaplin et al. (2009) and Chaplin and Craw-ford (2012) documented significantly lower minimum dissolved oxygen concentrations in age-0 Smallmouth Bass microhabitats compared to ad-jacent main channel areas. Prior re-search in the Great Lakes has linked Cladophora blooms to high dissolved phosphorus levels, mainly result-ing from human activities such as fertilizing lawns, poorly maintained septic systems, inadequate sewage treatment, agricultural runoff, and detergents containing phosphorus
Figure 1. Relative abundance (fish/50 m) of young-of-year Smallmouth Bass Micropterus dolomieu dur-ing July backpack electrofishing surveys at the Susquehanna River between Sunbury and York Haven, Pennsylvania.
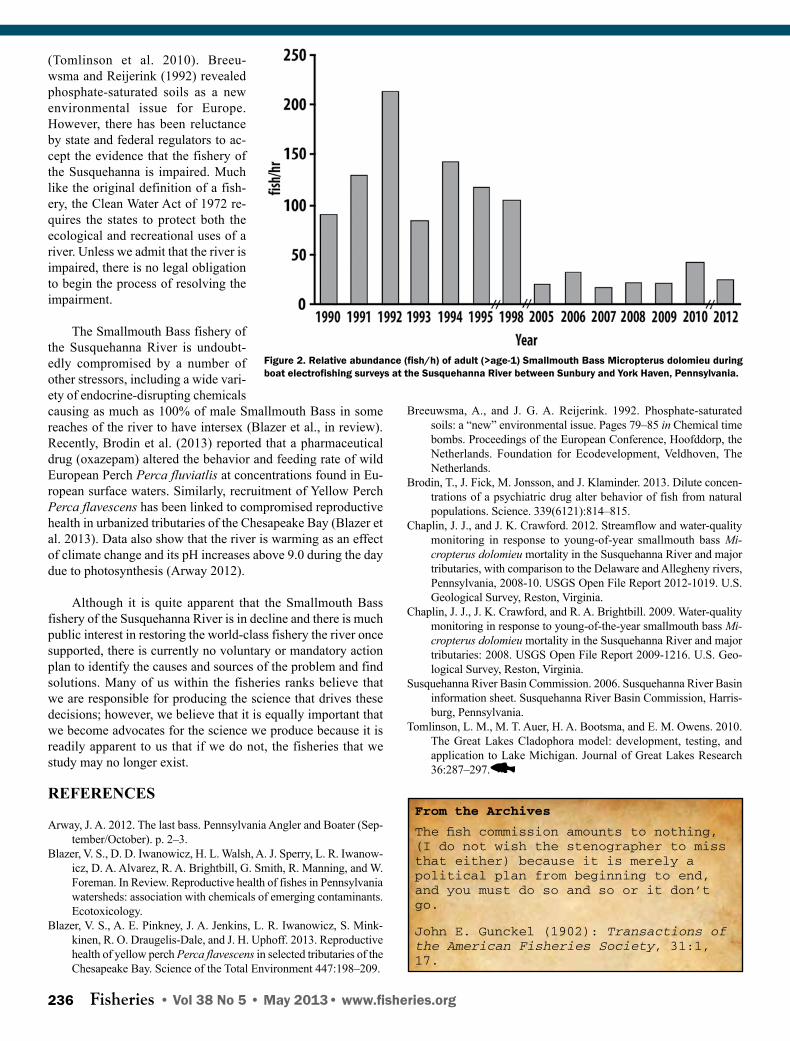
Fisheries • Vol 38 No 5 • May 2013• www.fisheries.org 236
Breeuwsma, A., and J. G. A. Reijerink. 1992. Phosphate-saturated soils: a “new” environmental issue. Pages 79–85 in Chemical time bombs. Proceedings of the European Conference, Hoofddorp, the Netherlands. Foundation for Ecodevelopment, Veldhoven, The Netherlands.
Brodin, T., J. Fick, M. Jonsson, and J. Klaminder. 2013. Dilute concen-trations of a psychiatric drug alter behavior of fish from natural populations. Science. 339(6121):814–815.
Chaplin, J. J., and J. K. Crawford. 2012. Streamflow and water-quality monitoring in response to young-of-year smallmouth bass Mi-cropterus dolomieu mortality in the Susquehanna River and major tributaries, with comparison to the Delaware and Allegheny rivers, Pennsylvania, 2008-10. USGS Open File Report 2012-1019. U.S. Geological Survey, Reston, Virginia.
Chaplin, J. J., J. K. Crawford, and R. A. Brightbill. 2009. Water-quality monitoring in response to young-of-the-year smallmouth bass Mi-cropterus dolomieu mortality in the Susquehanna River and major tributaries: 2008. USGS Open File Report 2009-1216. U.S. Geo-logical Survey, Reston, Virginia.
Susquehanna River Basin Commission. 2006. Susquehanna River Basin information sheet. Susquehanna River Basin Commission, Harris-burg, Pennsylvania.
Tomlinson, L. M., M. T. Auer, H. A. Bootsma, and E. M. Owens. 2010. The Great Lakes Cladophora model: development, testing, and application to Lake Michigan. Journal of Great Lakes Research 36:287–297.
(Tomlinson et al. 2010). Breeu-wsma and Reijerink (1992) revealed phosphate-saturated soils as a new environmental issue for Europe. However, there has been reluctance by state and federal regulators to ac-cept the evidence that the fishery of the Susquehanna is impaired. Much like the original definition of a fish-ery, the Clean Water Act of 1972 re-quires the states to protect both the ecological and recreational uses of a river. Unless we admit that the river is impaired, there is no legal obligation to begin the process of resolving the impairment.
The Smallmouth Bass fishery of the Susquehanna River is undoubt-edly compromised by a number of other stressors, including a wide vari-ety of endocrine-disrupting chemicals causing as much as 100% of male Smallmouth Bass in some reaches of the river to have intersex (Blazer et al., in review). Recently, Brodin et al. (2013) reported that a pharmaceutical drug (oxazepam) altered the behavior and feeding rate of wild European Perch Perca fluviatlis at concentrations found in Eu-ropean surface waters. Similarly, recruitment of Yellow Perch Perca flavescens has been linked to compromised reproductive health in urbanized tributaries of the Chesapeake Bay (Blazer et al. 2013). Data also show that the river is warming as an effect of climate change and its pH increases above 9.0 during the day due to photosynthesis (Arway 2012).
Although it is quite apparent that the Smallmouth Bass fishery of the Susquehanna River is in decline and there is much public interest in restoring the world-class fishery the river once supported, there is currently no voluntary or mandatory action plan to identify the causes and sources of the problem and find solutions. Many of us within the fisheries ranks believe that we are responsible for producing the science that drives these decisions; however, we believe that it is equally important that we become advocates for the science we produce because it is readily apparent to us that if we do not, the fisheries that we study may no longer exist.
REFERENCES
Arway, J. A. 2012. The last bass. Pennsylvania Angler and Boater (Sep-tember/October). p. 2–3.
Blazer, V. S., D. D. Iwanowicz, H. L. Walsh, A. J. Sperry, L. R. Iwanow-icz, D. A. Alvarez, R. A. Brightbill, G. Smith, R. Manning, and W. Foreman. In Review. Reproductive health of fishes in Pennsylvania watersheds: association with chemicals of emerging contaminants. Ecotoxicology.
Blazer, V. S., A. E. Pinkney, J. A. Jenkins, L. R. Iwanowicz, S. Mink-kinen, R. O. Draugelis-Dale, and J. H. Uphoff. 2013. Reproductive health of yellow perch Perca flavescens in selected tributaries of the Chesapeake Bay. Science of the Total Environment 447:198–209.
Figure 2. Relative abundance (fish/h) of adult (>age-1) Smallmouth Bass Micropterus dolomieu during boat electrofishing surveys at the Susquehanna River between Sunbury and York Haven, Pennsylvania.
From the Archives
The fish commission amounts to nothing, (I do not wish the stenographer to miss that either) because it is merely a political plan from beginning to end, and you must do so and so or it don’t go.
John E. Gunckel (1902): Transactions of the American Fisheries Society, 31:1, 17.

Fisheries • Vol 38 No 5 • May 2013 • www.fisheries.org 237
NEW AFS MEMBERSStewart AlcornKevin AlexanderDale AllenArmando AlvarezKrista AndersonZachary AnglinGolala AryaKatherine AstrothCarla AtkinsonAdam AugustineBrian AvilaJeffrey BeardsallJason BiesKatherine BirkettThomas BlandKasey BliesnerMatthew BogaardKatherine BogueBarry BoltonNatalie BorenLogan BoudreauxJustin BrighamStephen BrownJerry Brown`
Barbara ByrneJoshua CaudleMarie ClémentAmber CoatesMarcy CockrellLouise ConradJ. Eurico CyrinoEmmanuel Da CostaSarah DachosDale DavisDenise De CarionLaTreese DensonLance DorseyBruce DrecktrahBrian DuckettWilliam EakinAnne EwertAnna EwingBrett FavaroBenjamin FeltNicholas FrankeChris FrenchKeith FritschieRobert Giarla
Eric GiebelsteinDaphne GilleBen GoodmanRickie GuderianRick HansenDuyen HoDuyen HoDanielle HosickBrian IckesMatthew JamesCallahan JobeJose JohnDanielle JohnsonEben JohnsonJason KaneDoug KenyonSarah KiddKelly KindallKaty KlymusJosh KnopikRyan KnotekKole KubicekKathy LangBriana LangfordJohn Paul LeblancKirsten Leising
Iain MacKenzieBrian MahardjaEdward MaloneElizabeth MandevilleBrett MarshallKatrina MartensDan MartinAllison McCoyRyan McKimMichael McNeilMatthew MichieBrett MillerVanessa Minke-MartinLeopoldo MirandaJason MoakGlen MurrayRichard NelsonCollin NienhausKristin NorrisJill NorthAndrew O’MalleyTyler PeacockKristen PearsonMiles PetersonAaron PilnickJessica Quintana
David RichardsSam RizzaBryce RoholtLeAnne RojasHolly RollsMichael SchuettKirsten SellheimJames SimmonsJillian SlingsbyMichael SmithJustin SmithLaura StegerTyler StubbsLynn TakataKate TaylorNicholas TolopkaJoan TrialOrian TzadikMichael VaskeChristine VossLina WangKim WardKevin WhalenDavid WilkinsE. Eugene WilliamsMitchell Zischke
Native Fishes of IdahoRichard L. Wallace and Donald W. Zaroban
This field guide pro-vides accounts of 44
taxa (species, subspecies, and morphotypes) of fish native to Idaho. Of these, 25 have no defined stud-ies of their distribution or ecological attributes in Idaho. The account for each taxon contains de-scriptions of the physical attributes, distribution, habitat, diet, ecology, and Idaho conservation status.
Includes color illustra-tions of species, distri-bution maps, references, glossary, and index.
TO ORDER:Online: www.afsbooks.orgAmerican Fisheries Societyc/o Books InternationalP.O. Box 605Herndon, VA 20172Phone 703-661-1570Fax: 703-996-1010
213 pages, paper, indexList price: $50.00AFS Member price: $35.00Item Number: 550.71PAvailable April 2013

Fisheries • Vol 38 No 5 • May 2013• www.fisheries.org 238
BIOLOGISTS | PROJECT MANAGERS | ENGINEERS208.275.0011 | [email protected] | ww.biomark.com
A Reputation You Can TrustBiomark specializes in designing, fabricating and installing customized detection arrays to meet your specific project needs. Our systems provide you the peace of mind and data collection reliability that you can expect with 22 years experience of PIT tag system development and implementation.
Leading the industry in product development, manufacturing, implementation and supply.
HPT Tags | Outstanding performance| FDX-B & HDX| Bulk & Pre-loaded| Competitive pricing
Hand Readers| Water resistant & durable| Time/Date stamp| Large memory| Easy memory
download
Specializing in PIT Tag Technology

Fisheries • Vol 38 No 5 • May 2013 • www.fisheries.org 239
The Influence of Release Strategy and Migration History on Capture Rate of Oncorhynchus mykiss in a Rotary Screw Trap. Ian A. Tattam, James R. Ruzycki, Peter B. Bayley, Hiram W. Li, and Guillermo R. Giannico. 33: 237–244.
Delayed Hooking Mortality of Blue Catfish Caught on Juglines. Joseph D. Schmitt and Daniel E. Shoup. 33: 245–252.
Unbiased Methods for Calculating Mortality in Mark-Selective Fisheries Models for Ocean Salmon. Robert Conrad, Angelika Hagen-Breaux, and Henry Yuen. 33: 253–264.
[Management Brief] A Lightweight Battery for Backpack Electrofishing. Eric E. Hockersmith, Gabriel Brooks, Nathan D. Dumdei, and Stephen Achord. 33: 265–268.
Anesthesia of Juvenile Pacific Lampreys with MS-222, BENZOAK, AQUI-S 20E, and Aquacalm. Helena E. Christiansen, Lisa P. Gee, and Matthew G. Mesa. 33: 269–276.
Optimal Effort Intensity in Backpack Electrofishing Surveys. L. W. Stanfield, N. P. Lester, and I. C. Petreman. 33: 277–286.
Stranding of Spawning Run Green Sturgeon in the Sacramento River: Post-Rescue Movements and Potential Population-Level Effects. Michael J. Thomas, Matthew L. Peterson, Nick Friedenberg, Joel P. Van Eenennaam, Joseph R. Johnson, Jan Jeffrey Hoover, and A. Peter Klimley. 33: 287–297.
Effects of Depletion Sampling by Standard Three-Pass Pulsed DC Electrofishing on Blood Chemistry Parameters of Fishes from Appalachian Streams. Christine L. Densmore and Frank M. Panek. 33: 298–306.
Escape Gaps as a Management Strategy for Reducing Bycatch in Net-Covered Traps for the Giant Mud Crab Scylla serrata. Douglas Rotherham, Daniel D. Johnson, William G. Macbeth, and Charles A. Gray. 33: 307–317.
Age at Maturity, Fork Length, and Sex Ratio of Upper Willamette River Hatchery Spring Chinook Salmon. Marc A. Johnson and Thomas A. Friesen. 33: 318–328.
Spawning Substrate Size, Shape, and Siltation Influence Walleye Egg Retention. Derek P. Crane and John M. Farrell. 33: 329–337.
JOURNAL HIGHLIGHTSNorth American Journal of Fisheries ManagementVolume 33, Number 2, April 2013
[Management Brief] Development of an Asian Carp Size Structure Index and Application through Demonstration. Quinton E. Phelps and David W. Willis. 33: 338–343.
Temporal and Regional Trends in Black Bass Release Rates in Minnesota. Daniel A. Isermann, Joshua B. Maxwell, and Michael C. McInerny. 33: 344–350.
Channel Unit Use by Smallmouth Bass: Do Land-Use Constraints or Quantity of Habitat Matter? Shannon K. Brewer. 33: 351–358.
Biological Consequences of the Coaster Brook Trout Restoration Stocking Program in Lake Superior Tributaries within Pictured Rocks National Lakeshore. Jill B. K. Leonard, Wendylee Stott, Delora M. Loope, Paul C. Kusnierz, and Ashwin Sreenivasan. 33: 359–372.
Reproductive Biology of Pacific Ocean Perch and Northern Rockfish in the Aleutian Islands. Todd T. TenBrink and Paul D. Spencer. 33: 373–383.
Contrast of Degraded and Restored Stream Habitat Using an Individual-Based Salmon Model. Steven F. Railsback, Mark Gard, Bret C. Harvey, Jason L. White, and Julie K. H. Zimmerman. 33: 384–399.
[Management Brief] An Evaluation of Liquid Ammonia (Ammonium Hydroxide) as a Candidate Piscicide. David L. Ward, R. Morton-Starner, and Shaula J. Hedwall. 33: 400–405.
Fishery Management Complexes: An Impediment or Aid to Sustainable Harvest? A Discussion Based on the Northeast Skate Complex. Fiona Hogan, Steve Cadrin, and Alyssa Haygood. 33: 406–421.
Ghost Fishing in the Southeast Alaska Commercial Dungeness Crab Fishery. Jacek Maselko, Gretchen Bishop, and Peter Murphy. 33: 422–431.
Genetic Population Structure of Bull Trout in the East Fork Bitterroot River Drainage, Montana. Leslie G. Nyce, Lisa Eby, Christopher G. Clancy, Sally Painter, and Robb F. Leary. 33: 432–445.
[Comment] Comment: Detection and Population Estimation for Small-Bodied Fishes in a Sand-Bed River. Thomas P. Archdeacon and Stephen R. Davenport. 33: 446–452.
[Comment] Detection and Population Estimation for Small-Bodied Fishes in a Sand-Bed River: Response to Comment. Ann M. Widmer, Laura L. Burckhardt, Jon W. Kehmeier, Eric J. Gonzales, C. Nicolas Medley, and Richard A. Valdez. 33: 453–458.

Fisheries • Vol 38 No 5 • May 2013• www.fisheries.org 240
DATE EVENT LOCATION WEBSITE
May 20–24, 2013 AFS Piscicide Class - Planning and Executing Successful Rotenone and Antimycin Projects
Logan, UT fisheriessociety.org/rotenone; Contact: Brian Finlayson at [email protected]
May 30–31, 2013 Annual Meeting for the Louisiana Chapter of the American Fisheries Society
Baton Rouge, LA sdafs.org/laafs/meetings/meeting-registra-tion
June 24–28, 2013 9th Indo-Pacific Fish Conference Okinawa, Japan fish-isj.jp/9ipfc
June 25–27, 2013 2013 International Conference on Engineering & Ecohydrology for Fish Passage
Corvallis, OR fishpassage.umass.eduContact: Dr. Guillermo R. Giannico at [email protected]
July 14–20, 2013 2nd International Conference on Fish Telemetry Grahamstown, South Africa
oceantrackingnetwork.org
July 15–19, 2013 The World Conference on Stock Assessment Methods for Sustainable Fisheries
Boston, MA ices.dk/iceswork/symposia/wcsam.asp
August 19–23, 2013 Aquatic Science at the Interface Hamilton, New Zealand
aquascience.org.nz
August 26–27, 2013 Trout Unlimited's 2013 Utah Single Fly Event - To protect Utah's rivers and fight the spread of aquatic invasive species.
Green River, Dutch John, UT
tu.org/events/2013UTSF
September 23–25, 2013
2nd Annual World Congress of Mariculture and Fisheries-2013 (WCMF-2013)
Hangzhou, China bitconferences.com/wcmf2013/default.asp
September 23–26, 2013
OCEANS ‘13 MTS/IEEE - The Largest Ocean Conference in U.S. History
San Diego, CA oceans13mtsieeesandiego.org.
October 21–27, 2013 3rd International Marine Protected Areas Congress
Marseille, France impac3.org
August 3–7, 2014 International Congress on the Biology of Fish Edinburgh, United Kingdom
icbf2014.sls.hw.ac.uk
CALENDARFisheries Events
To submit upcoming events for inclusion on the AFS web site calendar, send event name, dates, city, state/ province, web address, and contact information to [email protected].
(If space is available, events will also be printed in Fisheries magazine.)
More events listed at www.fisheries.org
Equipment Marking and Recovery
Sonotronics offers Transmitters and Receivers to aid in the recovery of underwater equipment.
Visit our website for a complete list of Equipment Marking products.

Lawrence M. Page, Héctor Espinosa-Pérez, Lloyd T. Findley, Carter R. Gilbert, Robert N. Lea, Nicholas E. Mandrak, Richard L. Mayden, and Joseph S. Nelson
This authoritative reference provides an accurate, up-to-date checklist of common and scientific names for all described and taxonomically valid fish species living in fresh and marine waters
of North America. This edition reflects numerous taxonomic changes that have occurred since 2004, and includes 3,875 species and 260 families. Provides the rationale and methodology for common name allocation, history of changes from the previous edition, and extensive references.Also includes Spanish and French names.
Compiled in cooperation with the American Society of Ichthyologists and Herpe-tologists.
Common and Scientific Names of Fishes from the United States, Canada, and Mexico
7th Edition
243 pages, index, hardcoverList price: $60.00AFS Member price: $42.00Item Number: 510.34CPublished April 2013
TO ORDER:Online: www.afsbooks.org
American Fisheries Societyc/o Books InternationalP.O. Box 605Herndon, VA 20172Phone: 703-661-1570Fax: 703-996-1010

C4HTI AD TO COME
See visual comparisons at www.HTIsonar.com/FMslide