Sex reversal in hatchery fish, a potential explanation for ......Sex reversal in hatchery fish, a...
22
Sex reversal in hatchery fish, a potential explanation for different sex ratios between wild and hatchery steelhead? Neil Thompson, Kassi Cole, Laura McMahon, Melanie Marine and Mike Blouin
Transcript of Sex reversal in hatchery fish, a potential explanation for ......Sex reversal in hatchery fish, a...
Sex reversal in hatchery fish, a potential explanation for different
sex ratios between wild and hatchery steelhead?
Neil Thompson, Kassi Cole, Laura McMahon, Melanie Marine and Mike Blouin
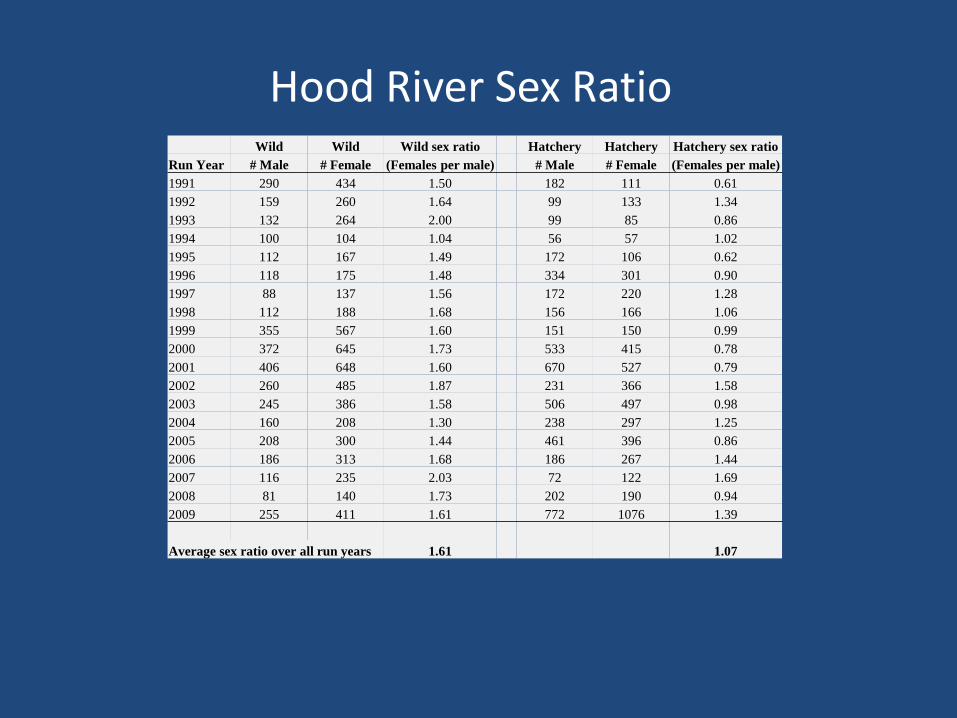
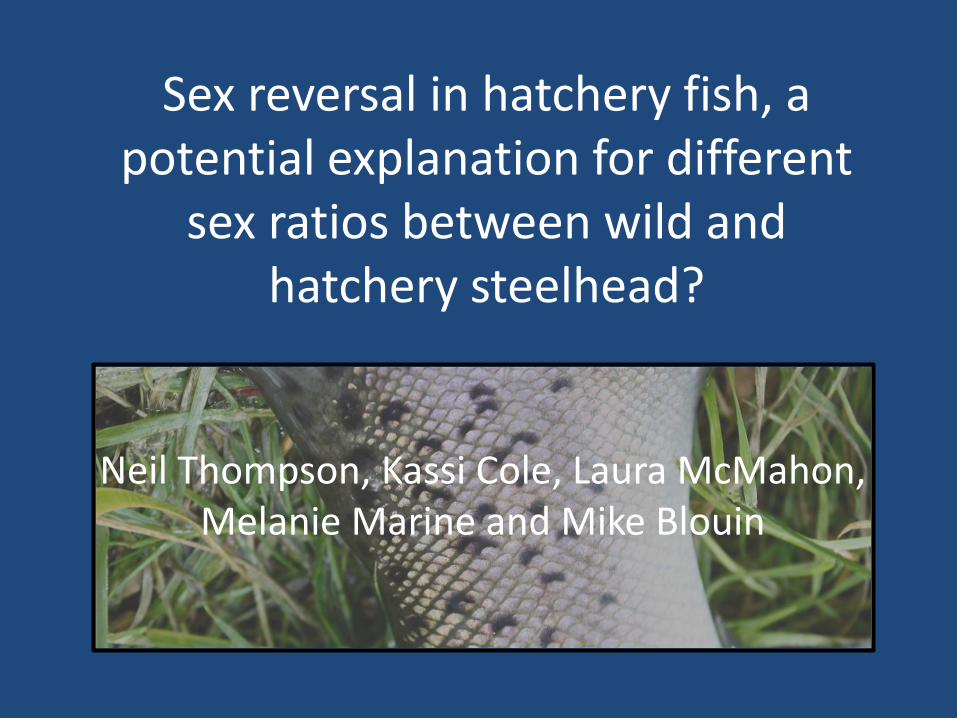
Wild Wild Wild sex ratio Hatchery Hatchery Hatchery sex ratio
Run Year # Male # Female (Females per male) # Male # Female (Females per male)
1991 290 434 1.50 182 111 0.61
1992 159 260 1.64 99 133 1.34
1993 132 264 2.00 99 85 0.86
1994 100 104 1.04 56 57 1.02
1995 112 167 1.49 172 106 0.62
1996 118 175 1.48 334 301 0.90
1997 88 137 1.56 172 220 1.28
1998 112 188 1.68 156 166 1.06
1999 355 567 1.60 151 150 0.99
2000 372 645 1.73 533 415 0.78
2001 406 648 1.60 670 527 0.79
2002 260 485 1.87 231 366 1.58
2003 245 386 1.58 506 497 0.98
2004 160 208 1.30 238 297 1.25
2005 208 300 1.44 461 396 0.86
2006 186 313 1.68 186 267 1.44
2007 116 235 2.03 72 122 1.69
2008 81 140 1.73 202 190 0.94
2009 255 411 1.61 772 1076 1.39
Average sex ratio over all run years 1.61 1.07
Hood River Sex Ratio
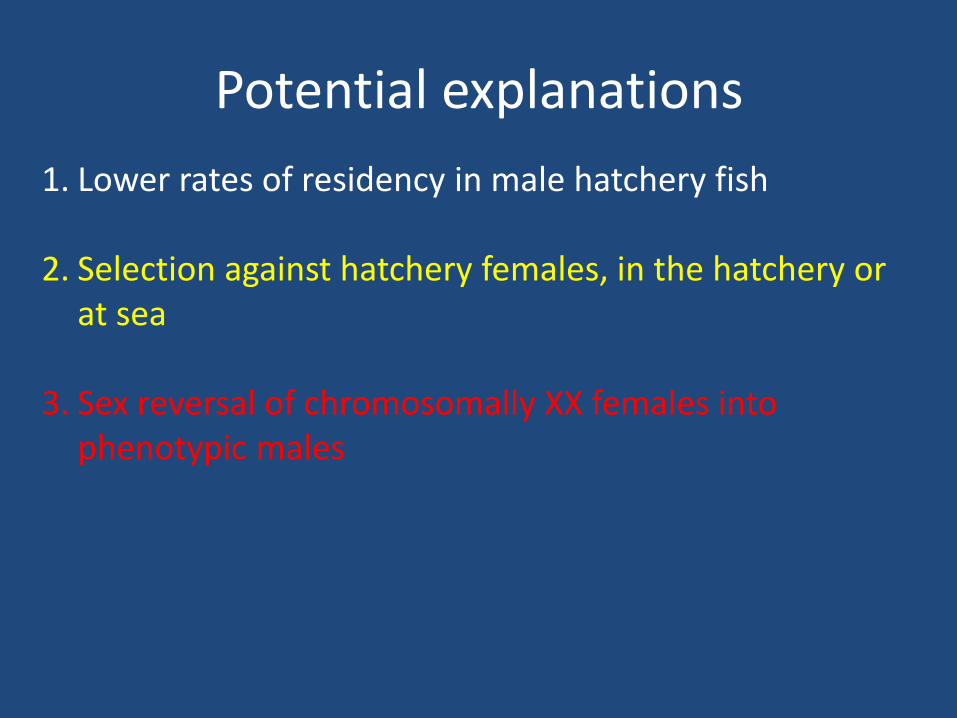
Question: Why is there a difference in sex ratio between wild and hatchery populations?
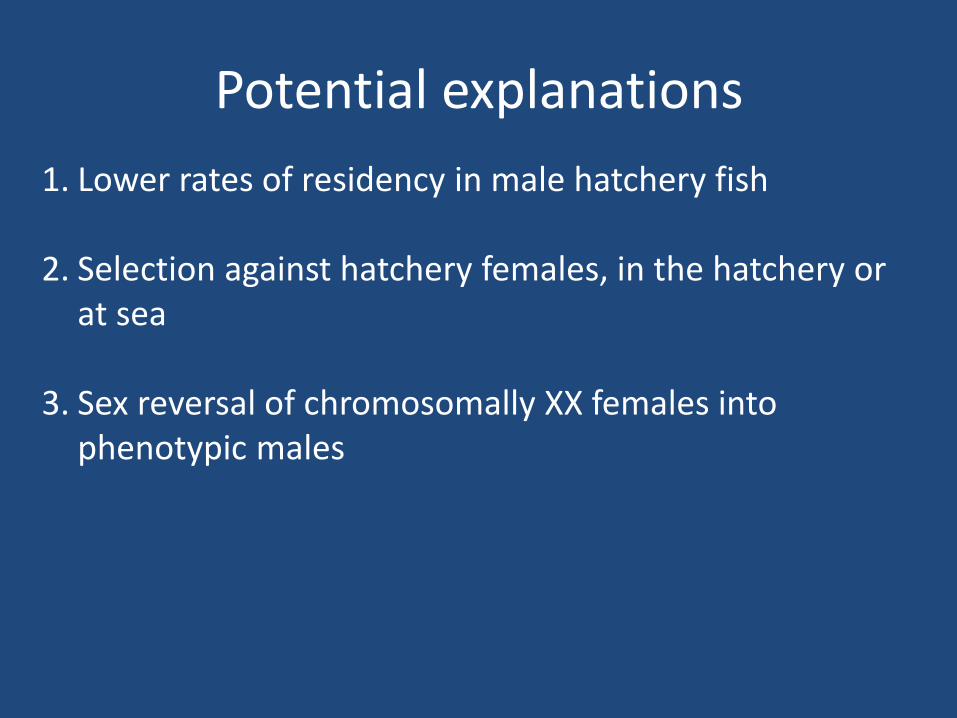
Potential explanations
1. Lower rates of residency in male hatchery fish
2. Selection against hatchery females, in the hatchery or at sea
3. Sex reversal of chromosomally XX females into phenotypic males
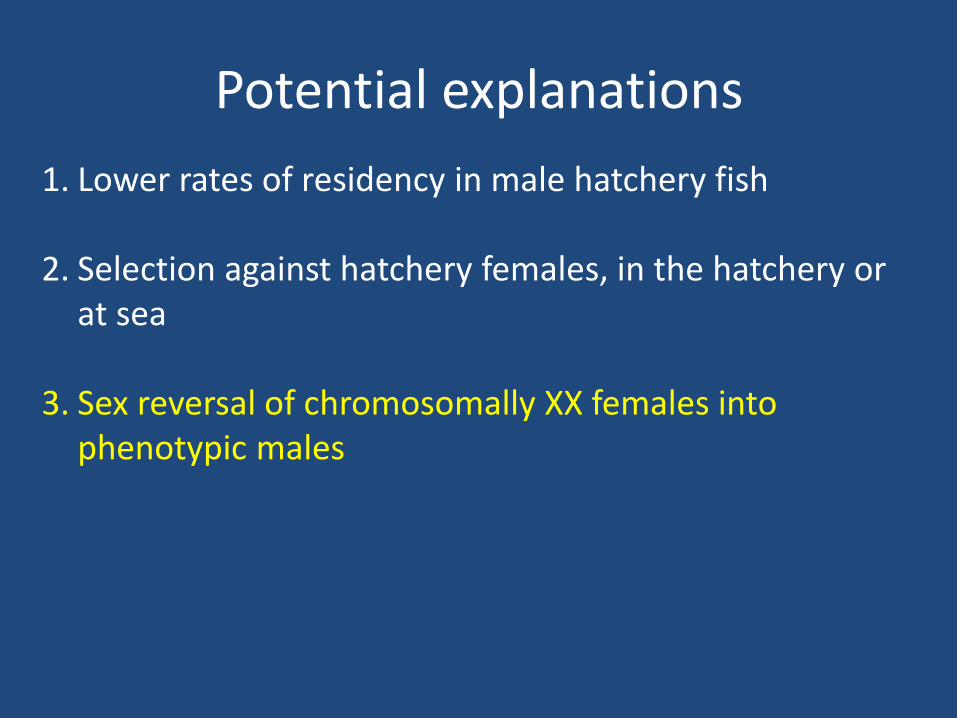
Potential explanations
1. Lower rates of residency in male hatchery fish
2. Selection against hatchery females, in the hatchery or at sea
3. Sex reversal of chromosomally XX females into phenotypic males
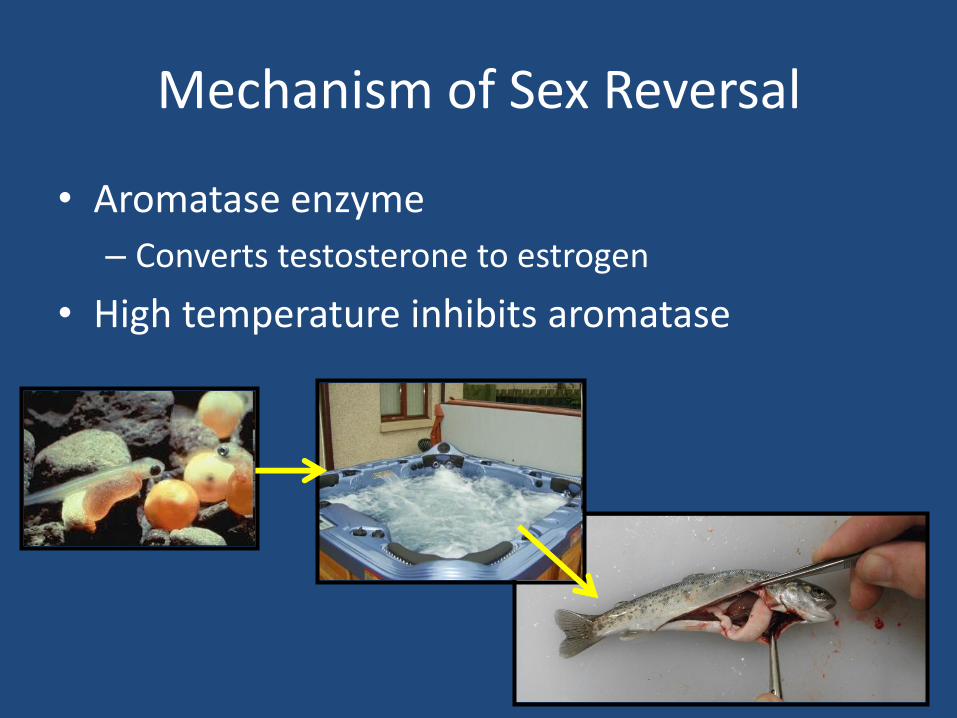
Mechanism of Sex Reversal
• Aromatase enzyme
– Converts testosterone to estrogen
• High temperature inhibits aromatase
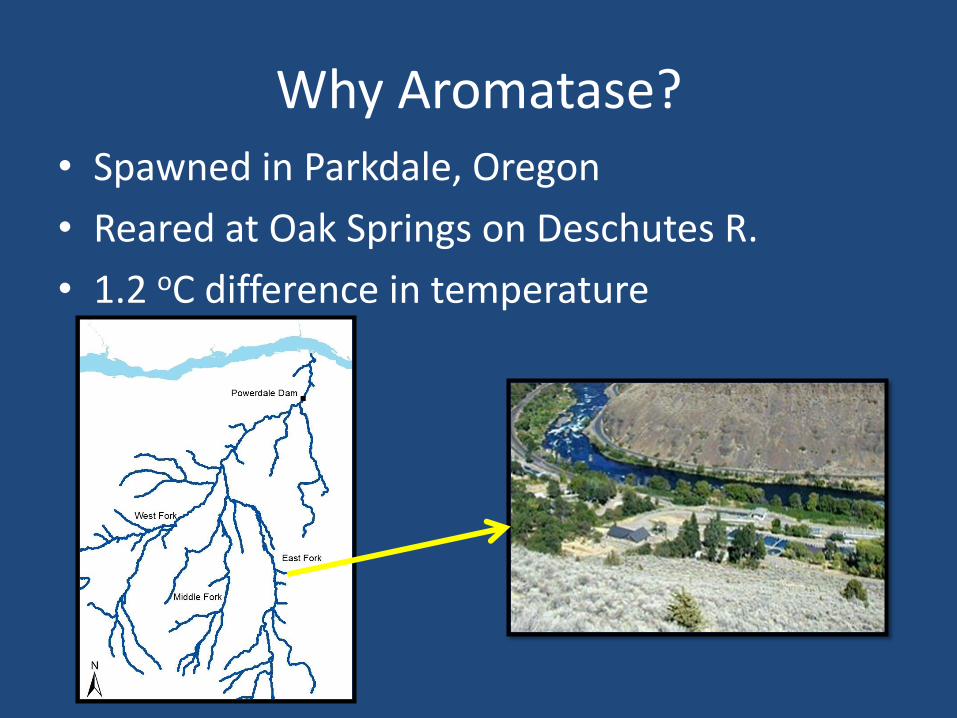
Why Aromatase? • Spawned in Parkdale, Oregon
• Reared at Oak Springs on Deschutes R.
• 1.2 oC difference in temperature

Research question
• Does the chromosomal gender match the phenotypic gender in Hood River steelhead?
– If not, what % is non-matching?
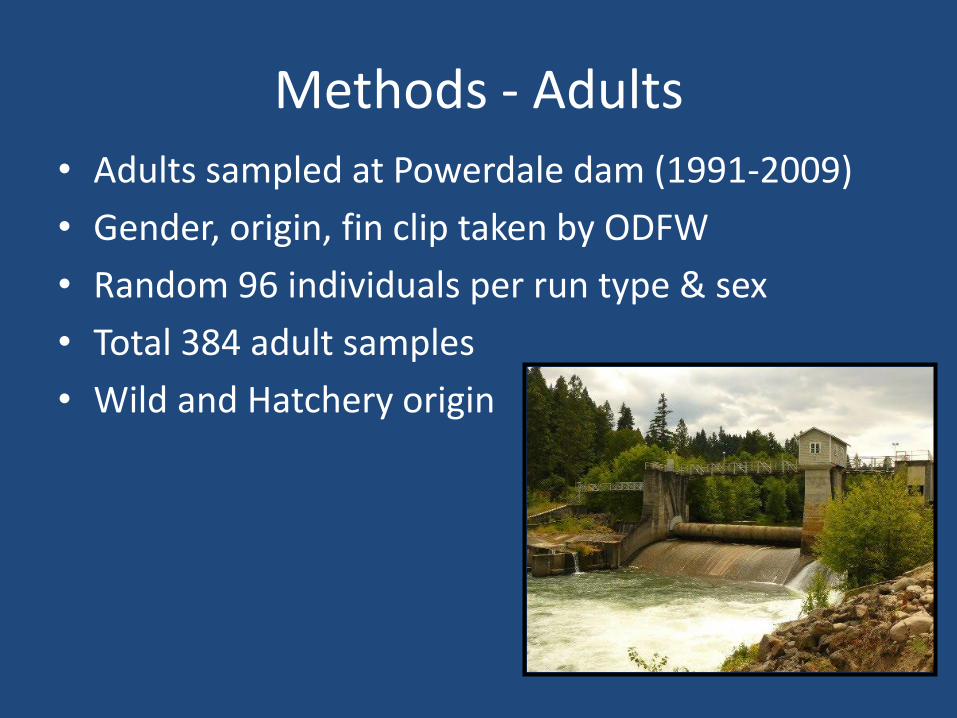
Methods - Adults
• Adults sampled at Powerdale dam (1991-2009)
• Gender, origin, fin clip taken by ODFW
• Random 96 individuals per run type & sex
• Total 384 adult samples
• Wild and Hatchery origin
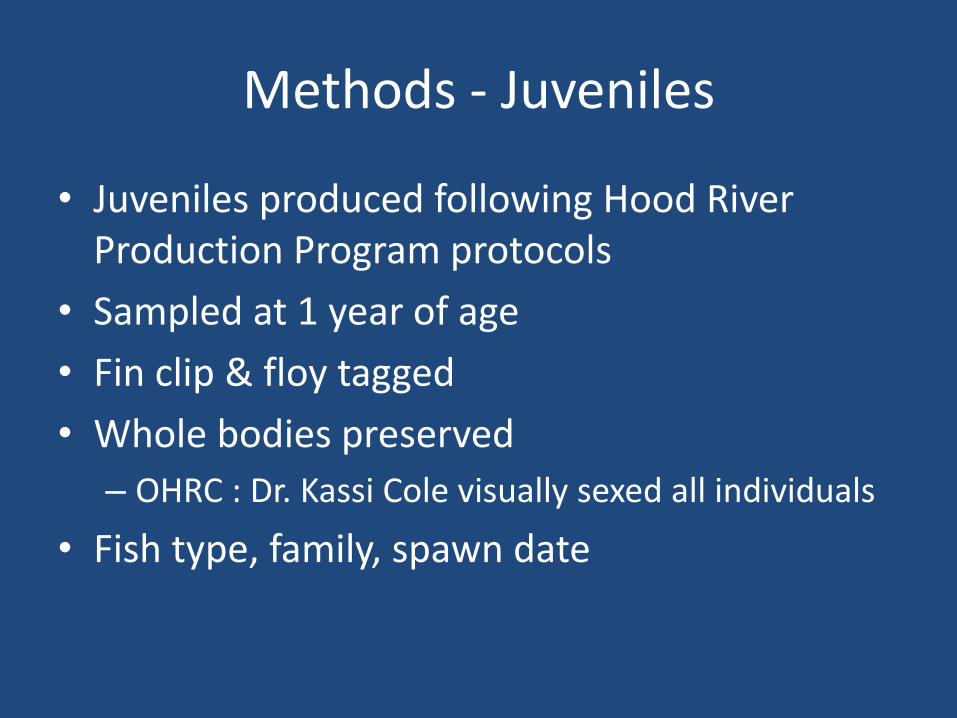
Methods - Juveniles
• Juveniles produced following Hood River Production Program protocols
• Sampled at 1 year of age
• Fin clip & floy tagged
• Whole bodies preserved
– OHRC : Dr. Kassi Cole visually sexed all individuals
• Fish type, family, spawn date
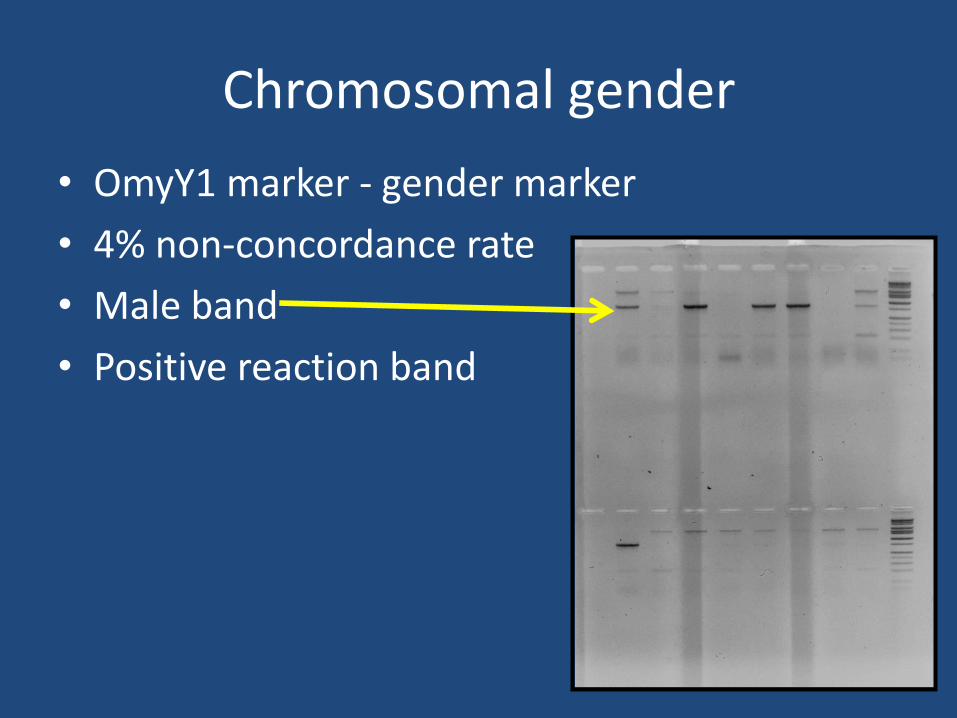
Chromosomal gender
• OmyY1 marker - gender marker
• 4% non-concordance rate
• Male band
• Positive reaction band
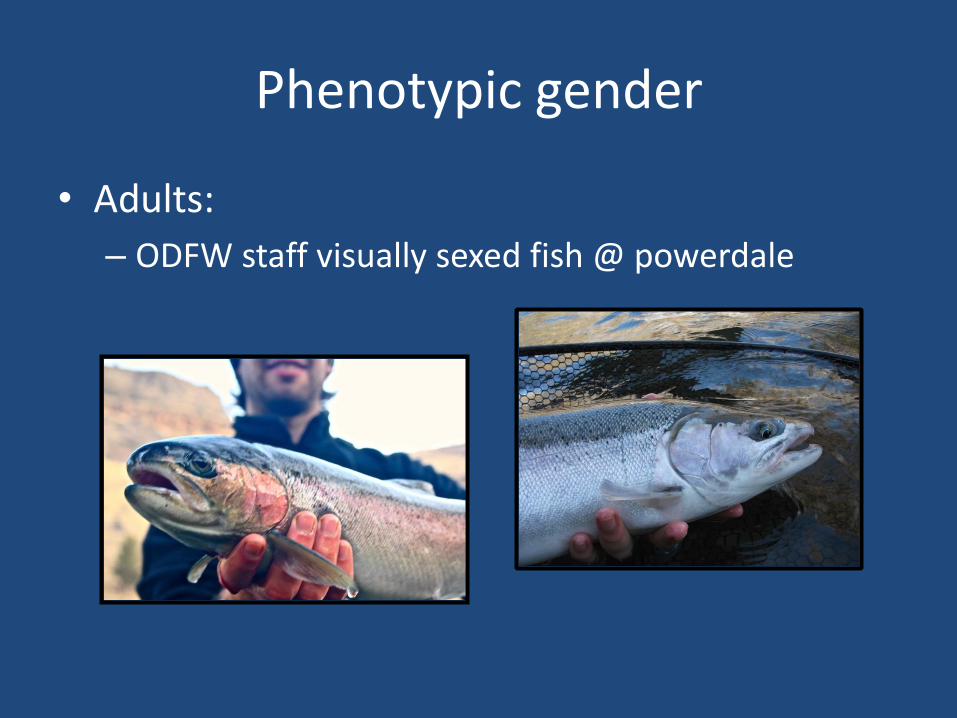
Phenotypic gender
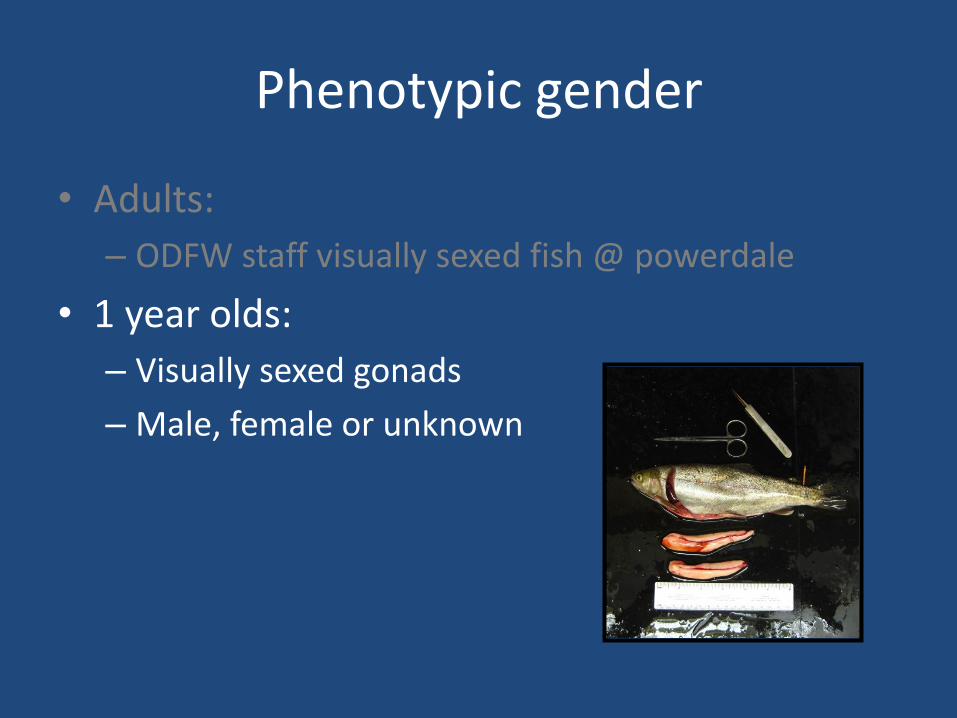
• Adults:
– ODFW staff visually sexed fish @ powerdale
Phenotypic gender
• Adults:
– ODFW staff visually sexed fish @ powerdale
• 1 year olds:
– Visually sexed gonads
– Male, female or unknown
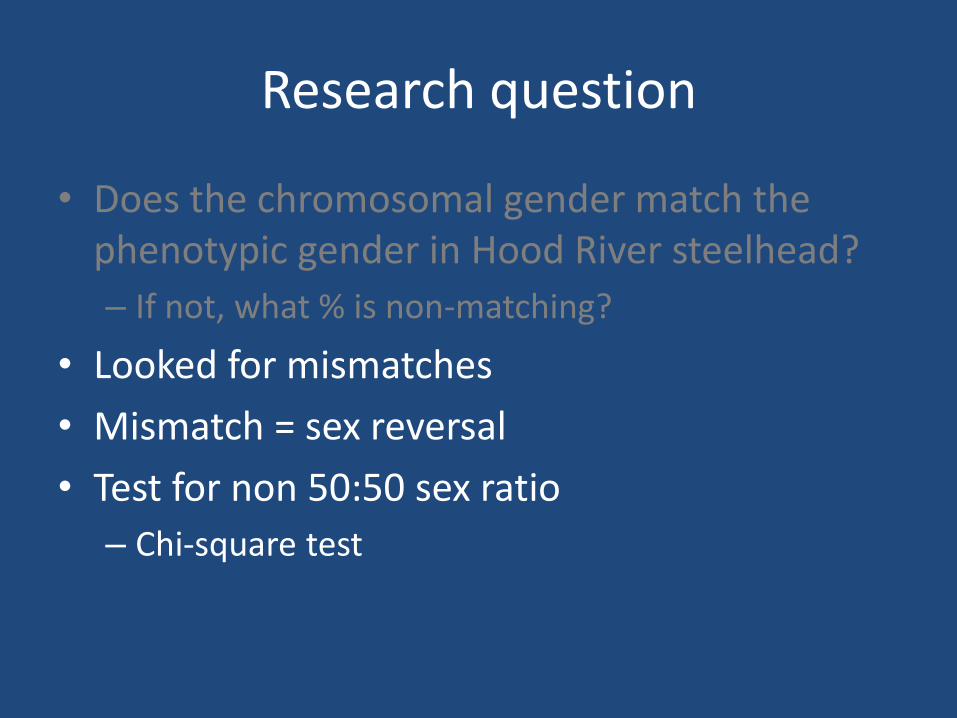
Research question
• Does the chromosomal gender match the phenotypic gender in Hood River steelhead?
– If not, what % is non-matching?
• Looked for mismatches
• Mismatch = sex reversal
• Test for non 50:50 sex ratio
– Chi-square test
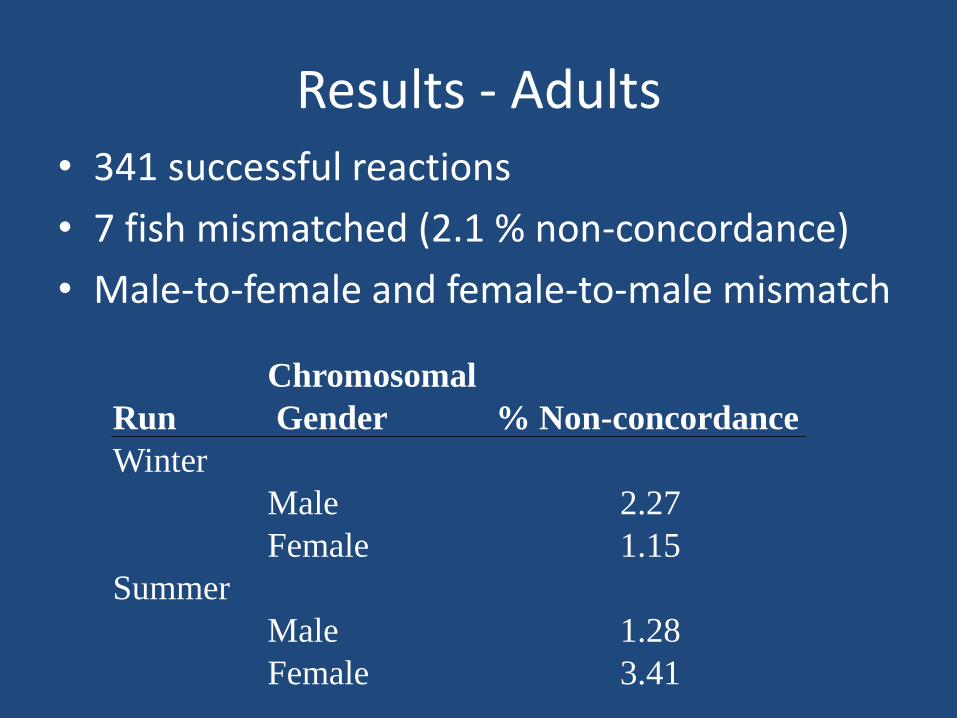
Results - Adults • 341 successful reactions
• 7 fish mismatched (2.1 % non-concordance)
• Male-to-female and female-to-male mismatch
Chromosomal
Run Gender % Non-concordance
Winter
Male 2.27
Female 1.15
Summer
Male 1.28
Female 3.41
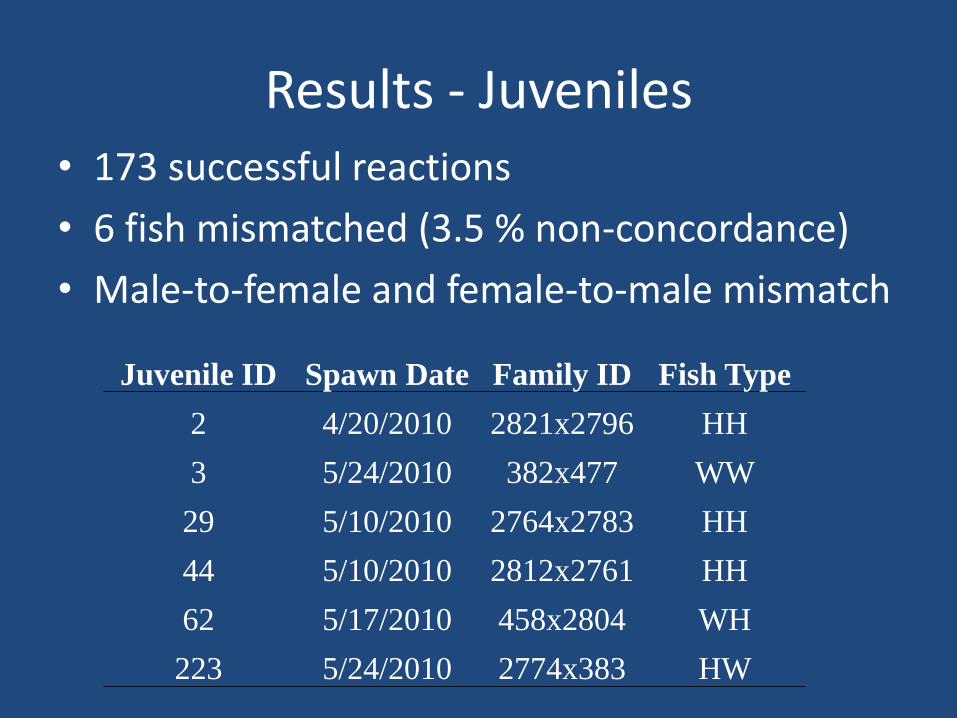
Results - Juveniles • 173 successful reactions
• 6 fish mismatched (3.5 % non-concordance)
• Male-to-female and female-to-male mismatch
Juvenile ID Spawn Date Family ID Fish Type
2 4/20/2010 2821x2796 HH
3 5/24/2010 382x477 WW
29 5/10/2010 2764x2783 HH
44 5/10/2010 2812x2761 HH
62 5/17/2010 458x2804 WH
223 5/24/2010 2774x383 HW
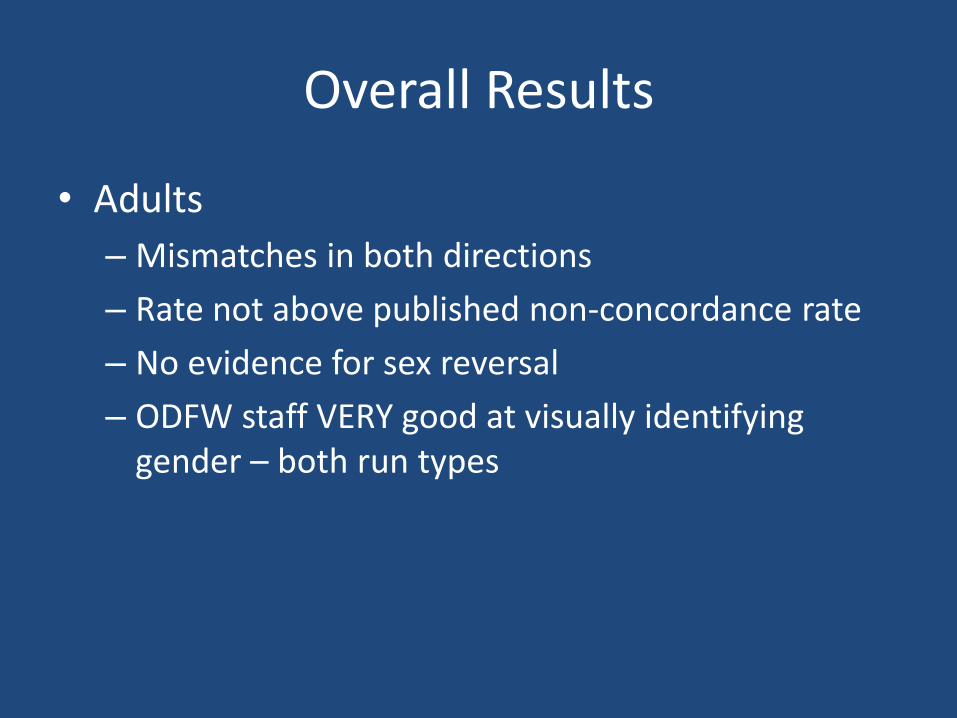
Overall Results
• Adults
– Mismatches in both directions
– Rate not above published non-concordance rate
– No evidence for sex reversal
– ODFW staff VERY good at visually identifying gender – both run types
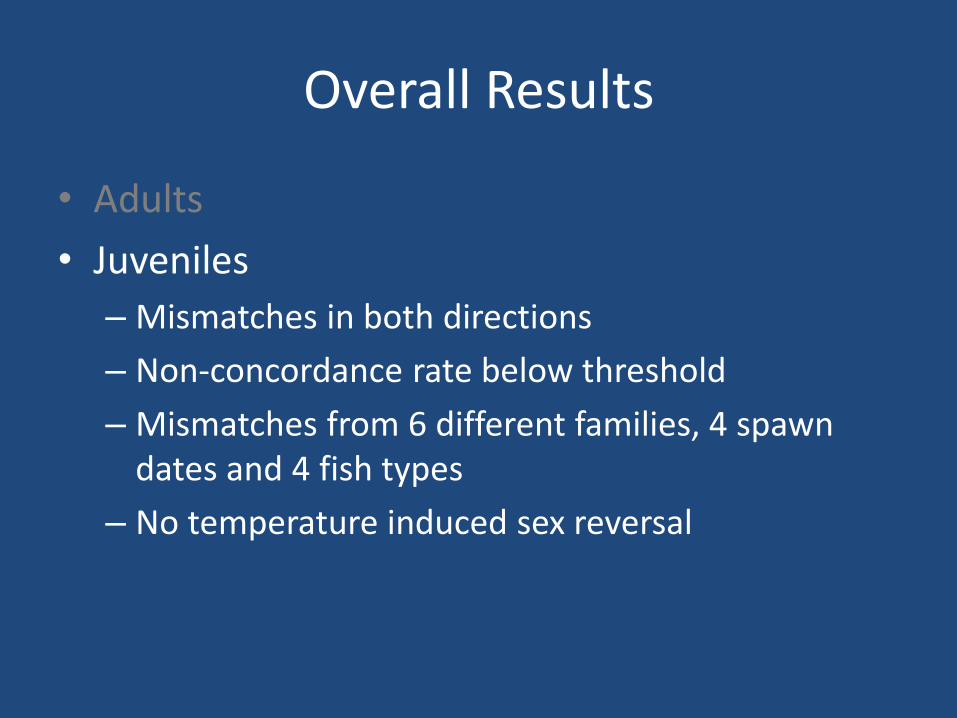
Overall Results
• Adults
• Juveniles
– Mismatches in both directions
– Non-concordance rate below threshold
– Mismatches from 6 different families, 4 spawn dates and 4 fish types
– No temperature induced sex reversal
Potential explanations
1. Lower rates of residency in male hatchery fish
2. Selection against hatchery females, in the hatchery or at sea
3. Sex reversal of chromosomally XX females into phenotypic males
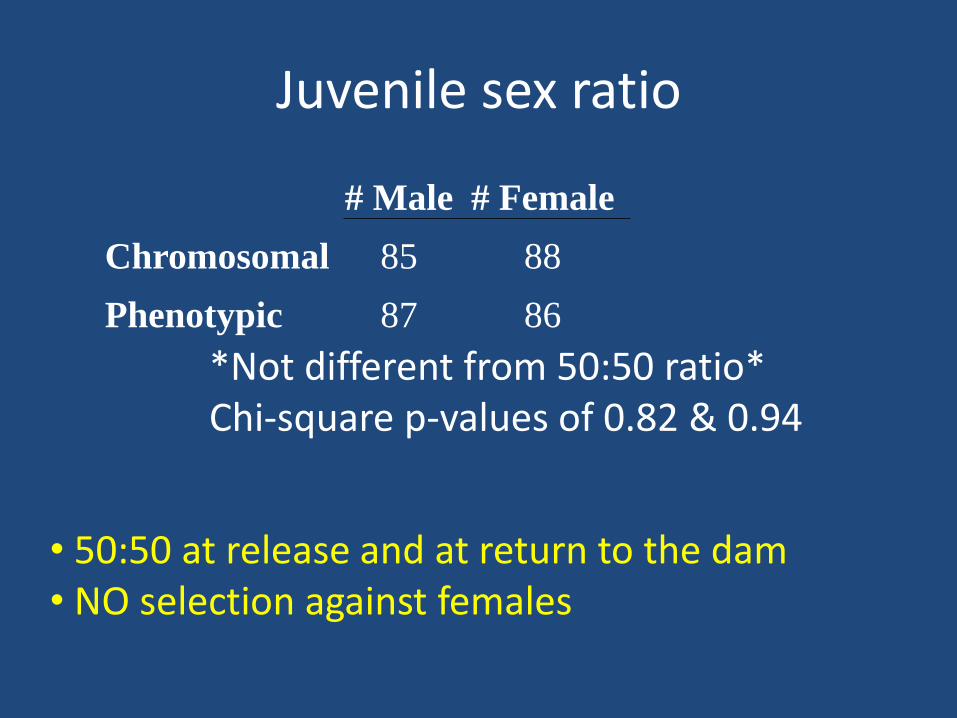
Juvenile sex ratio
# Male # Female
Chromosomal 85 88
Phenotypic 87 86
*Not different from 50:50 ratio* Chi-square p-values of 0.82 & 0.94
• 50:50 at release and at return to the dam • NO selection against females
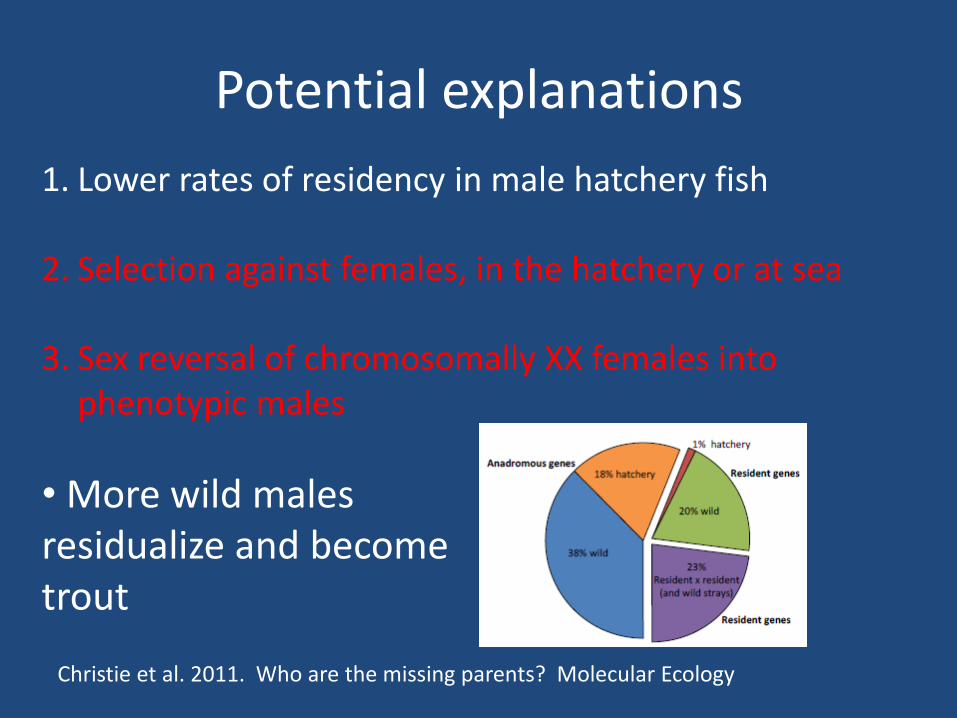
Potential explanations
1. Lower rates of residency in male hatchery fish
2. Selection against females, in the hatchery or at sea
3. Sex reversal of chromosomally XX females into phenotypic males
Christie et al. 2011. Who are the missing parents? Molecular Ecology
• More wild males residualize and become trout

Thank You!
• Jim Gidley & Albert Santos
• Parkdale fish facility
• Lyle Curtis & staff
• Oak Springs hatchery
• Blouin lab