FISHERIES REPORT 18-01 - TN.gov
161
FISHERIES REPORT 18-01 REGION IV TROUT FISHERIES REPORT 2017 Prepared by: James W. Habera Sally J. Petre Bart D. Carter Carl E. Williams Tennessee Wildlife Resources Agency
Transcript of FISHERIES REPORT 18-01 - TN.gov

FISHERIES REPORT
18-01
REGION IV
TROUT FISHERIES REPORT
2017
Prepared by:
James W. Habera
Sally J. Petre
Bart D. Carter
Carl E. Williams
Tennessee Wildlife Resources Agency

Visit TWRA’s website at www.tnwildlife.org., where you can learn more about Tennessee’s trout fisheries across the state.
Cover (and left): Large Rainbow Trout from the Ft. Patrick Henry tailwater near Kingsport. Region 4’s tailwater trout fisheries are monitored each year to obtain data for managing these resources. Photos by G. Loucks (TWRA).

REGION 4
TROUT FISHERIES REPORT 2017
____________
Prepared by:
James W. Habera Sally J. Petre Bart D. Carter
and Carl E. Williams
TENNESSEE WILDLIFE RESOURCES AGENCY
____________
April 2018
This report contains progress and accomplishments for the following TWRA Projects: "Stream Survey".
Development of this report was financed in part by funds from Federal Aid in Fish and Wildlife Restoration
(Public Law 91-503) as documented in Federal Aid Project FW-6 (4350 and 4351)
This program receives Federal Aid in Fish and Wildlife Restoration. Under Title VI of the Civil Rights Act of 1964 and Section 504 of the Rehabilitation Act of 1973, the U.S. Department of the Interior prohibits discrimination on the basis of race, color, national origin, or handicap. If you believe you have been discriminated against in any program, activity, or facility as described above, or if you desire further
information, please write to: Office of Equal Opportunity, U.S. Department of the Interior, Washington, D.C. 20240.

iv
Executive Summary
Long term monitoring streams: Seven trout streams were quantitatively sampled during 2017 field season (June-October) within Region IV. Overall, trout abundance remained below long term averages. This is likely due to the Tennessee River Watershed, particularly in eastern Tennessee, being in abnormally dry to extreme drought from May 2016 to mid-April 2017 according to United State Drought Monitor. Drought throughout the region decreases base stream flow and increase temperatures, which can limit reproductive success and affects overall health of trout. Since mid-April, this Region has been drought free and trout biomass should start to increase in the 2018 and 2019 sampling. Sympatric Brook/Rainbow Trout streams: Relative Brook Trout biomass decreased in both of the streams sampled this year (Briar Creek and Rocky Fork). Data from these stations continue to document long-term co-existence of Brook and Rainbow Trout and that drier periods (particularly 1998-2002; 2007-2008) favor Brook Trout while wetter periods (e.g., 2003-2005, and 2013) or floods (1994) favor Rainbow Trout. Brook Trout DNA sampling: All 42 Brook Trout streams remaining to be sampled as part of the effort to upgrade existing genetics information were visited in 2017. DNA samples were obtained from 1,081 fish representing 40 populations (two were found to no longer have Brook Trout), with sample sizes ranging from 6-39 and averaging 27 fish. Each fish collected for a DNA sample was also checked for gill lice, but none were observed. Results of microsatellite DNA analyses on these fish and those collected in 2016 are pending. Little Jacob Creek Brook Trout enhancement: In the early 2000s Little Jacob Creek was restored after translocating native Brook Trout in the stream and evaluating the population. In 2016 and 2017 the stream was surveyed again and enhanced by an extensive Rainbow Trout removal effort. After the 2016 removal effort, we found no age-0 Rainbow Trout in 2017. This suggests the Rainbow Trout removal, or Brook Trout enhancement project was successful, leaving this section of stream with only Brook Trout. Little Stony Creek Brook Trout Restoration: The Little Stony Creek restoration objective was to restore the historical native population of Brook Trout. In 2014 Rainbow Trout were evaluated and removed through intensive back pack electrofishing and native Brook Trout from Left Prong Hampton Creek were stocked. Rainbow Trout were removed and Brook Trout population assessed in 2015 and again in 2017. Currently, Brook Trout numbers and range have increased since 2014, with both age-0 and adult Brook Trout through the restoration area. Supplemental stocking of Brook Trout may be needed in the lower section of the creek to increase density, where fewer Brook Trout were found. Rainbow Trout range and population decreased, with no age-0 Rainbow Trout found in 2015 or 2017, indicating the removal effort is complete. Boone tailwater: Although the mean electrofishing catch rate for all trout ≥178 mm increased
only slightly in 2017 (to 109 fish/h), catch biomass increased 23% as a result of more large (457 mm or 18 in.) Brown Trout (7 fish/h) than were present in any previous sample. More Brook Trout (19 fish/h) were also captured in 2017 than in any previous sample, although none were >303 mm. Repairs at Boone Dam continued in 2017 and require the drawdown of Boone Lake to an elevation of 412 m (1,352’)—3.1 m (10’) below winter pool (possibly until 2022). TVA water quality monitoring data from the tailwater near the dam indicated dissolved oxygen (DO) often fell below 6 mg/l (TDEC’s criterion for trout waters) during May-July 2016 (occasionally for over 12 h) and on most days in October, but always remained above 3.0 mg/l. The 2017 monitoring results do not indicate that the lower DO levels in 2016 (likely related to drought conditions and reduced

v
flows during summer and fall that year) had any notable effect on the Boone tailwater trout fishery. A management plan is currently in preparation for the Ft. Patrick Henry and Boone tailwater trout fisheries.
Cherokee tailwater: Water temperatures in the Cherokee tailwater were exceptionally warm again during 2017. Minimum daily water temperature near the dam exceeded 21° C for 50 days beginning on 24 August—the longest period with no coldwater habitat observed there except for 2016 (55 days). Minimum daily water temperature at Blue Spring reached 21° C on 18 August and remained above 21° C (no coldwater habitat) for 52 days (exceeded only in 2003). Water temperatures in the Cherokee tailwater typically return to trout-tolerant levels (<21° C) by mid- to late October, and this occurred on 28 October in 2017. Fifteen Rainbow Trout and 7 Brown Trout were captured during monitoring efforts in October 2017, thus the overall mean catch rate (11 fish/h ≥178 mm) increased relative to 2016 (2.5 fish/h). Mean catch rates for larger trout (≥356 mm and ≥457 mm) also increased in 2017. The 2017 catch rate for trout ≥356 mm (9.5 fish/h) exceeded that for any previous monitoring sample.
Ft. Patrick Henry tailwater: The mean catch rate for all trout 178 mm increased slightly (to 106
fish/h) in 2017, although the catch rate for larger trout (356 mm) decreased 34% to 44 fish/h.
The mean catch rate for the largest trout (457 mm or 18 in.) also decreased (to 18 fish/h), but
remained above the long-term average of 10 fish/h. The abundance of trout 457 mm was depressed during 2004-2010 (0 to 4 fish/h), but has improved since then, averaging nearly 18 fish/h. The Ft. Patrick Henry tailwater—like the Boone tailwater upstream—continues to produce large, extremely well-conditioned fish (particularly Rainbow Trout) with relative weights (Wr), often well in excess of 100. The management plan currently being prepared for this trout fishery (and Boone’s) will seek to maintain this feature. Norris tailwater: The mean electrofishing catch rate for trout within the PLR (356-508 mm) was 73 fish/h in 2017 and has remained above 70 fish/h since 2014. The current Norris tailwater management plan (2014-2019) provides a mean PLR catch rate objective of 28 fish/h and is certainly being achieved. The relative stock density of trout 356 mm (14 in.) and larger (RSD-14) has increased from 12 (2009) to over 40 during 2016-17, indicating that trout population size structures have been shifted toward larger fish and maintained, as CPUE for trout ≥178 mm has been relatively stable (150-200 fish/h) and annual stocking rates have been relatively consistent. An RSD-14 value of 50 indicates that 50% of all stock-size trout—those at least 254 mm (10 in.) in length—are 356 mm (14 in.) or larger. Only 2,200 Brook Trout were stocked in 2016 and none were collected during the 2017 sampling efforts. South Holston tailwater: Brown Trout catch declined again in 2017 (219 fish/h), and mean
catch rate for all trout 178 mm fell to 254 fish/h—the lowest level since 2006. However, numerous subadult (≤127 mm) Brown Trout were captured and may indicate a relatively large cohort is entering the population, which could add to existing density-dependent effects on growth and recruitment. There was better recruitment into the size classes approaching the PLR (356 and 381 mm) again in 2017, although the PLR (406-559 mm) catch rate fell slightly to 9.5 fish/h. Relative stock density for all trout ≥406 mm (RSD-16) was unchanged from 2016 (5) and remains well below the 2004-2007 average (15), indicating no current shift toward larger fish—one of the original intents of the PRL. If overall trout abundance remains relatively high (CPUE >200 fish/h) and angler harvest rates for Brown Trout remain low (3.5%), it is unlikely RSD-16 will improve. Therefore, other management actions that can decrease Brown Trout recruitment when necessary, such as altering dam operations (i.e., to produce high flows) could help maintain more stable trout populations with larger adults through relaxed intraspecific competition. A new angler survey was conducted on the South Holston tailwater in 2017 and results will be available for the

vi
2018 report. A majority of anglers (87%) did rate their satisfaction with the trout fishery as good or excellent. Also, when informed that it could help improve Brown Trout population size structure, more anglers (44%) said they would increase harvest than those who said they would not (40%). Whirling disease was confirmed in Rainbow Trout and Brown Trout collected during the 2017 monitoring efforts.
Wilbur tailwater: The overall 2017 mean catch rate for all trout (178 mm) increased 20% (to 296 fish/h) since 2016, primarily as a result of the increasing wild Brown Trout population in the upper half of the tailwater. The new management plan (2015-2020) prescribes developing a wild
Brown Trout fishery throughout the tailwater, with a mean catch rate of 40 fish/h (178 mm) in the lower portion (Stations 8-12). The 2017 Brown Trout catch rate for that area (67 fish/h) achieved that objective. Results from TWRA’s 2016 creel survey indicated that pressure (112,627 h), trips (22,965), and mean trip length (4.9 h), along with estimated trout catch (213,673) and harvest (21,477) increased substantially since the previous (2013) survey. Monitoring data continue to provide no clear indication that the QZ regulations are enhancing abundance of larger trout there,
although they do suggest a general increase in the abundance of trout 356 mm throughout the tailwater since 2005. Because most anglers support the current QZ regulations—even if they do not catch more quality fish there—the QZ’s effectiveness may be relatively unimportant. Whirling disease was confirmed in Rainbow Trout collected during the 2017 monitoring efforts.

vii
TABLE OF CONTENTS Page
EXECUTIVE SUMMARY ..................................................................................... iv
1. INTRODUCTION ................................................................................................. 1
2. WILD TROUT STREAM ACCOUNTS ................................................................. 5
2.1 Sampling Methods ...................................................................................... 5
2.2 Beaverdam Creek....................................................................................... 7
2.3 Doe Creek ................................................................................................ 13
2.4 Left Prong Hampton Creek ....................................................................... 19
2.5 Paint Creek............................................................................................... 27
2.6 Right Prong Middle Branch ....................................................................... 33
2.7 Rocky Fork ............................................................................................... 38
2.8 Sympatric Brook/Rainbow Trout Monitoring Streams ................................ 44
2.8.1 Briar Creek ..................................................................................... 44
2.8.2 Rocky Fork ..................................................................................... 49
2.8.3 Summary ........................................................................................ 52
2.9 Completion of Brook Trout DNA Sampling ................................................ 54
2.10 Little Jacob Creek Brook Trout Enhancement ........................................... 58
2.11 Little Stony Creek Brook Trout Restoration ............................................... 62
3. TAILWATERS ACCOUNTS .............................................................................. 69
3.1 Sampling Methods and Conditions ........................................................... 69
3.2 Tailwater Monitoring ................................................................................. 70
3.2.1 Norris (Clinch River) ....................................................................... 70
3.2.2 Cherokee (Holston River) ............................................................... 81
3.2.3 Wilbur (Watauga River) .................................................................. 94
3.2.4 Ft. Patrick Henry (South Fork Holston River) ................................ 105
3.2.5 Boone (South Fork Holston River) ................................................ 112
3.2.6 South Holston (South Fork Holston River) .................................... 120
REFERENCES ..................................................................................................... 132
APPENDIX A: Quantitative Wild Trout Stream Samples 1991-2017..................... 144
APPENDIX B: Qualitative Stream Surveys 1991-2017 ......................................... 149

1
1. INTRODUCTION
The Tennessee Wildlife Resources Agency (TWRA) manages trout fisheries in a variety of
waters in Tennessee including streams, tailwater rivers, and reservoirs. Together, these
fisheries provide a popular and important set of angling opportunities. The U.S. Fish and
Wildlife Service (USFWS) conducts nationwide surveys every five years to track trends in sport
fishing and other outdoor recreation activities. The most recent survey providing demographic
and economic data for trout angling (2011), estimated that 105,000 resident and non-resident
anglers (age 16 or older) fished for trout in Tennessee (Maillett and Aiken 2015). They made an
estimated 1.4 million trips and represented 15% of all Tennessee anglers (Maillett and Aiken
2015). The estimated total expenditure associated with these trips was approximately $53
million. Compared with the previous survey (2006; Harris 2010), the estimated number of trout
anglers increased 10%, while trips increased 40%. A statewide survey by the University of
Tennessee in 2012 also indicated that 15% of Tennessee’s anglers fished for trout, making an
average of 15 trips (averaging 4 hours) that year (Schexnayder et al. 2014). Most of those
anglers targeted trout in hatchery-supported fisheries. Accordingly, while Agency management
emphasizes habitat preservation and maintenance of wild stocks where they occur, artificially
propagated trout are essential for managing substantial portions of the coldwater resource. In
2017, 624,455 pounds of trout (~1.95 million fish) produced or grown primarily at five state
(TWRA), one municipal (Gatlinburg), and two federal (USFWS) facilities were stocked to
manage Tennessee’s hatchery-supported fisheries (Roddy 2018). Nearly half (276,855 pounds)
was stocked in Region IV waters, with 38% of those trout used to support tailwater fisheries and
another 27% used to provide reservoir fisheries.
The Blue Ridge physiographic province of eastern Tennessee contains about 1,000 km
(621 mi) of coldwater streams inhabited by wild (self-sustaining) populations of Rainbow Trout
Oncorhynchus mykiss, Brook Trout Salvelinus fontinalis, and Brown Trout Salmo trutta. Wild
trout occur in 9 of Region IV’s 21 counties (primarily those that border North Carolina; Figure 1-
1). The Tennessee portion of Great Smoky Mountains National Park (GSMNP) in Cocke,
Sevier, and Blount counties contains another 395 km (245 mi) of wild trout streams. Most of
Region IV’s wild trout resource outside GSMNP is located within the U.S. Forest Service's
(USFS) 253,000-hectare (625,000-acre) Cherokee National Forest (CNF). However, a
substantial portion (~30%) occurs on privately owned lands and includes some of the State's
best wild trout streams.
Rainbow Trout, native to Pacific-drainage streams of the western U.S., and brown trout,
native to Europe, were widely introduced into coldwater habitats during the past century and
have become naturalized in many Tennessee streams. Brook Trout are Tennessee's only
native salmonid and once occurred at elevations as low as 490 m (1,600 ft.) in some streams
(King 1937). They currently occupy about 223 km (139 mi) in 109 streams, or about 24% of the
stream length supporting wild trout outside GSMNP. Brook trout occur allopatrically (no other
trout species are present) in 42 streams totaling 72 km (45 mi.), representing 32% of the Brook

2
Trout resource. Another 13 streams have waterfalls or man-made barriers that maintain Brook
Trout allopatry in most of the 37 km (23 mi.) of habitat they provide.
Wild trout populations reflect the quality and stability of the aquatic systems they inhabit,
as well as associated terrestrial systems. TWRA recognizes the ecological importance of
Tennessee’s wild trout resources (particularly native Brook Trout), their value to anglers, and
the special management opportunities they offer. The Agency’s current statewide trout
management plan (Fiss and Habera 2006) features management goals and strategies designed
to conserve wild trout and their habitat while providing a variety of angling experiences.
Many streams with unregulated flows can support trout fisheries, but are limited by
marginal summer habitat or levels of natural production insufficient to meet existing fishing
pressure. TWRA provides or supplements trout fisheries in 34 such streams in Region IV by
annually stocking hatchery-produced (adult) Rainbow Trout. Some stocked steams (e.g.,
Beaverdam Creek, Doe Creek, Laurel Fork, and Doe River) do support excellent wild trout
populations as well, but the moderate stocking rates employed are considered to pose no
population-level problems for the resident fish (Meyer et al. 2012).
Cold, hypolimnetic releases from five Tennessee Valley Authority (TVA) dams in Region
IV (Norris, Ft. Patrick Henry, South Holston, Wilbur, and Boone) also support year-round trout
fisheries in the tailwaters downstream (Figure 1-1). The habitat and food resources that
characterize these tailwaters provide for higher carrying capacities and allow trout to grow larger
than they normally do in other streams. Tailwaters are typically stocked with fingerlings (~102
mm) in the early spring and adult fish (229-305 mm) throughout the summer. Stocked adult
trout supplement the catch during peak angling season and by fall, fingerlings have begun to
enter these fisheries. Recruitment of natural reproduction (mostly by Brown Trout) contributes
substantially to the fisheries in the South Holston and Wilbur (Watauga River) tailwaters. The
Holston River below Cherokee Reservoir (Figure 1-1) also supports a tailwater trout fishery,
although high water temperatures (>21° C) during late summer and early fall limit survival. No
fingerlings are stocked there, as few would survive the thermal bottleneck to recruit to the
fishery.
Reservoirs that stratify during summer months but have habitat suitable for trout below
depths normally occupied by warmwater species are termed ‘two-story’ fisheries. These
reservoirs must have a zone with water below 21° C and a minimum dissolved oxygen
concentration of 3.0 mg/L (Wilkins et al. 1967). Seven two-story reservoirs in Region IV
(Calderwood, Chilhowee, Tellico, Ft. Patrick Henry, South Holston, Wilbur, and Watauga) have
such zones and create an additional trout resource (Figure 1-1). These reservoirs are stocked
with adult Rainbow Trout during the late fall and winter when reservoir temperatures are
uniformly cold and piscivorous warmwater predators are less active. Watauga and South
Holston reservoirs are also annually stocked with sub-adult Brown Trout and Lake Trout
Salvelinus namaycush, and excellent Lake Trout fisheries have developed in these two
reservoirs.

3
One of TWRA’s core functions identified in its Strategic Plan (TWRA 2014) is outdoor
recreation, and a primary objective is to maintain or improve programs that promote high user
satisfaction for hunters, anglers, and boaters. Tennessee’s trout anglers recently expressed a
high level of satisfaction (89%) with the Agency’s management of the State’s trout fisheries
(Schexnayder et al. 2014). Maintaining this level of satisfaction will require effective
management of existing resources and opportunities—as well as development of new ones.
TWRA’s new statewide trout management plan for the next 10 years (TWRA 2017) addresses
how these goals can be accomplished. This plan includes management guidelines for
Tennessee’s native Brook Trout, particularly in light of new genetics data being acquired for all
Brook Trout populations. Acquisition of trout population status and dynamics data from streams
and tailwaters through standardized stream survey techniques (e.g., abundance trends and size
structures, etc.) will also continue to be an important strategy for managing these fisheries.

4
Region IV Trout Streams, Tailwaters, and Reservoirs
Figure 1-1. Locations of selected Region IV trout fisheries managed by TWRA.

5
2. WILD TROUT STREAM ACCOUNTS
Seven trout streams were quantitatively sampled during 2017 field season (June-
October) within Region IV. Overall, trout abundance remained below long term averages. This
is likely due to the Tennessee River watershed, particularly in eastern Tennessee, being in an
abnormally dry to extreme drought condition from May 2016 to mid-April 2017 according to
United State Drought Monitor. Drought throughout the region decreases base stream flow and
increase temperatures, which can limit reproductive success and affects overall health of trout.
Since mid-April, this Region has been drought free and trout biomass should start to in 2018
and 2019 given more normal flow conditions.
Individual accounts for all wild trout streams sampling during 2017 are provided below.
A list of all streams sampling quantitatively during 1991-2017 is provided in Appendix A.
2.1 SAMPLING METHODS
Wild trout stream sampling was conducted with battery-powered backpack electrofishing
units employing inverters to produce AC outputs. Output voltages were 125-600 VAC,
depending upon water conductivity. All quantitative (three-pass depletion) sampling followed
TWRA’s standard protocols (TWRA 1998). Three-pass depletion sampling provides accurate
trout abundance estimates in typical southern Appalachian streams (Habera et al. 2010), is
endorsed by the Southern Division, American Fisheries Society’s (SDAFS) Trout Committee,
and is widely used by other state and federal agencies in the region. Stocked rainbow trout,
distinguishable by dull coloration, eroded fins, atypical body proportions, and large size (usually
>229 mm), were noted on data sheets but were not included in any analyses. A list of the
common and scientific names of all fish collected during 2017 sampling efforts in wild trout
streams is provided in Table 2-1.
Removal-depletion data were analyzed with MicroFish 4.0 for Windows
(http://microfish.org/) developed by Jack Van Deventer in cooperation with the SDAFS Trout
Committee. Trout 90 mm in length were analyzed separately from those >90 mm. Trout in the
smaller size group tend to have lower catchabilities (Lohr and West 1992; Thompson and Rahel
1996; Peterson et al. 2004; Habera et al. 2010), making separate analysis necessary to avoid
bias. These two groups also roughly correspond to young-of-the-year (YOY or age-0) and
adults.

6
Table 2-1. Common and scientific names of fishes collected during 2017 quantitative trout stream surveys1. Common Name Scientific Name Minnows Cyprinidae Central Stoneroller Campostoma anomalum Warpaint Shiner Luxilus coccogenis River Chub Nocomis micropogon Saffron Shiner Notropis rubricroceus Tennessee Shiner N. leuciodus Blacknose Dace Rhinichthys atratulus Longnose Dace R. cataractae Creek Chub Semotilus atromaculatus Suckers Catostomidae White Sucker Catostomus commersonii Northern Hogsucker Hypentelium nigricans Trouts Salmonidae Rainbow Trout Oncorhynchus mykiss Brown Trout Salmo trutta Brook Trout Salvelinus fontinalis Sculpins Cottidae Mottled Sculpin Cottus bairdii Sunfishes Centrarchidae Rockbass Ambloplites rupestris Bluegill Lepomis macrochirus Perches Percidae Greenfin Darter Etheostoma chlorobranchium Fantail Darter E. flabellare Snubnose Darter E. simoterum Swannanoa Darter E. swannanoa 1Nomenclature follows Page et al. (2013).

7
2.2 BEAVERDAM CREEK Study Area
Beaverdam Creek is one of Tennessee’s best-known wild trout streams. It originates in
Johnson County’s Iron Mountains and flows northeast into Virginia as part of the South Fork
Holston drainage. The watershed is largely forested (much is CNF), although there is
substantial agricultural and residential land use in the Shady Valley area. Shields (1950)
described Beaverdam Creek as providing excellent Rainbow Trout water. However, because
there was no reproduction (except in the tributaries), Shields recommended a stocking program
that included fall fingerling stocking in the Shady Valley section and a permit system for
managing this stream. Shields (1950) made no mention of a Brown Trout fishery at that time.
Later, Bivens (1988) and Bivens and Williams (1990) conducted qualitative surveys of
Beaverdam Creek for TWRA and documented excellent wild Rainbow Trout and Brown Trout
populations. Brook Trout currently inhabit over 29 km in 12 Beaverdam Creek tributaries and
most were determined to be of native heritage based on previous genetic analyses using
allozymes (Strange and Habera 1997). DNA samples from all of these populations were
collected in 2016 and 2017 to update current population genetics information (Section 2-4).
In 1988 a 10-km special regulation section of Beaverdam Creek between Tank Hollow
Road and Birch Branch (located in the CNF) was managed under a 229-mm minimum length
limit, three-trout creel limit, and single-hook, artificial-lures-only restriction to emphasize the wild
trout fishery. Stocking was also discontinued within this area after 1988. In 2013, the 229-mm
length limit was removed and creel limit increased to five trout as part of the revision of special
wild trout regulations to make them more biologically sound. Outside the special regulations
section, about 5,600 catchable Rainbow Trout are stocked each year during March-June.
Brown Trout fingerlings have occasionally been stocked in upper Beaverdam Creek (vicinity of
Hwy. 421 crossing and upstream) to supplement the wild Brown Trout population in that area,
which has limited spawning habitat (Habera et al. 2006).
Two long-term monitoring stations were established in 1991 within the special
regulations section and have been sampled annually since then. Sample site location and effort
details, along with habitat and water quality information are summarized in Table 2-2.
Results and Discussion
Catch data and abundance estimates for trout and all other species collected at the
Beaverdam Creek stations in 2017 are given in Table 2-3. Estimated total trout biomass
remained relatively unchanged from 2016 at both stations, although density declined, primarily
as the result of fewer age-0 Rainbow Trout (Figure 2-1). In fact the 2017 density estimates from
Rainbow Trout ≤90 mm at both stations were among the lowest observed to date. Abundance
estimates (except Station 2 biomass) were below long term averages.
Last year’s (2016) density estimates for Brown Trout ≤90 mm (i.e. age 0) were among
the lowest observed (Figure 2-1), which explains the limited number of age-1 (102-178 mm size
classes) Brown Trout in the 2017 length frequency histogram Figure 2-2). Except for the
reduced abundance of age-0 fish, Rainbow Trout size distributions were relatively well balanced

8
with several fish >229 mm. Beaverdam Creek is well known for its large (>400 mm) Brown
Trout, and these have been present in 20 of 26 annual surveys—including all but one since
2003 (2012).
Management Recommendations
Beaverdam Creek supports one of Tennessee’s best wild trout fisheries, which
management should continue to maintain and emphasize. The current stocking program is
compatible with wild trout management and native fish assemblages (Weaver and Kwak 2013),
but there should be no expansion of the area or number of catchable trout currently stocked.
Based on responses to the 2015 attitude/opinion survey questions, most anglers support the
current regulations (which liberalized creel and size limits), but have not changed their harvest
tendencies as a result of them. Annual monitoring should continue at both stations to increase
our understanding of this important wild trout fishery.
Beaverdam Creek in Cherokee National Forest

9
Table 2-2. Site and sampling information for Beaverdam Creek in 2017.
Location
Station 1
Station 2
Site code
420172801
420172802
Sample date
29 August
30 August
Watershed
S. Fork Holston River
S. Fork Holston River
County
Johnson
Johnson
Quadrangle
Laurel Bloomery 213 SE
Laurel Bloomery 213 SE Lat-Long
36.59176 N, -81.81847 W
36.56576 N, -81.87315 W
Reach number
06010102-23,0
06010102-23,0 Elevation (ft)
2,160
2,440
Stream order
4
4 Land ownership
USFS
USFS
Fishing access
Excellent
Excellent Description
Begins at Tank Hollow
Begins at Hwy. 133 mile
Rd. near Backbone Rock.
marker 5 near Arnold Br.
Effort
Station length (m)
200
177
Sample area (m²)
2620
2248
Personnel
25
19
Electrofishing units
4
4
Voltage (AC)
250
250
Removal passes
3
3
Habitat
Mean width (m)
13.1
12.7
Maximum depth (cm)
100
130
Canopy cover (%)
70
60
Aquatic vegetation
scarce
scarce
Estimated % of site in pools
57
47 Estimated % of site in riffles
43
53
Habitat assessment score
165 (optimal)
162 (optimal)
Substrate Composition
Pool (%) Riffle (%)
Pool (%) Riffle (%)
Silt
10 0
10 0 Sand
5 5
10 5
Gravel
20 25
20 30 Rubble
30 35
20 30
Boulder
15 30
30 30 Bedrock
20 5
10 5
Water Quality
Flow (cfs; visual)
28.4; normal
26.9; normal
Temperature (C)
17.3
16.6
pH
7.3
7.2
Conductivity (μS/cm)
63
78
Dissolved oxygen (mg/L)
N/M
N/M
Alkalinity (mg/L CaCO3)
35
35

10
Table 2-3. Fish population abundance estimates (with 95% confidence limits) for the monitoring
stations on Beaverdam Creek sampled 29 and 30 August 2017.
Population Size Est. Mean
Biomass (kg/ha)
Density (fish/ha)
Total Lower Upper Weight Fish
Lower Upper
Lower Upper
Species Catch Est. C.L. C.L. (g) Wt. (g) Est. C.L. C.L. Est. C.L. C.L.
Station 1
RBT ≤90 mm 20 22 22 30 116 5.2
0.44 0.44 0.60
84 84 115
RBT >90 mm 59 60 60 64 2,678 44.6
10.22 10.21 10.89
229 229 244
BNT ≤90 mm 34 34 24 37 163 4.3
0.62 0.39 0.61
130 92 141
BNT >90 mm 40 40 40 43 3,455 86.2
13.19 13.16 14.15
153 153 164
BKT >90 mm 1 1 1 1 8 8.0
0.03 0.03 0.03
4 4 4
Fantail Darter 82 92 92 106 118 1.3
0.45 0.46 0.53
351 351 405
Tennessee Shiner 7 7 7 13 8 1.1
0.03 0.03 0.05
27 27 50
Greenfin Darter 6 6 6 11 66 11.0
0.25 0.25 0.46
23 23 42
N. Hogsucker 19 19 19 21 2,556 134.5
9.76 9.75 10.78
73 73 80
Snubonse Darter 12 13 13 20 41 3.2
0.16 0.16 0.24
50 50 76
Mottled Sculpin 453 631 631 725 2,317 3.7
8.84 8.91 10.24
2,408 2,408 2,767
Warpaint Shiner 59 65 65 75 175 2.7
0.67 0.67 0.77
248 248 286
Swannanoa Darter 7 7 7 13 33 4.7
0.13 0.13 0.23
27 27 50
Saffron Shiner 159 198 198 232 204 1.0
0.78 0.76 0.89
756 756 885
Blacknose Dace 10 10 10 10 4 0.4
0.02 0.02 0.02
38 38 38
Central Sonteroller 103 104 104 108 2,760 26.5
10.53 10.52 10.92
397 397 412
River Chub 212 225 225 237 1,982 8.8
7.56 7.56 7.96
859 859 905
Longnose Dace 12 12 12 16 168 14.0
0.64 0.64 0.85
46 46 61
Totals 1295 1,546 1,525 1,751 16,852
52.23 64.03 70.18
5,901 4,629 5,758
Station 2
RBT ≤90 mm 18 18 18 20 79 4.4
0.35 0.35 0.39
80 80 89
RBT >90 mm 60 60 60 62 3,341 55.7
14.86 14.87 15.36
267 267 276
BNT ≤90 mm 21 21 21 25 109 5.2
0.48 0.49 0.58
93 93 111
BNT >90 mm 36 36 36 39 5,036 139.9
22.40 22.40 24.27
160 160 173
BKT ≤90 mm 1 1 1 1 5 5.4
0.02 0.02 0.02
4 4 4
Fantail Darter 46 80 80 150 118 1.5
0.52 0.53 1.00
356 356 667
Greenfin Darter 3 3 3 15 22 7.3
0.10 0.10 0.49
13 13 67
N. Hogsucker 10 10 10 12 996 99.6
4.43 4.43 5.32
44 44 53
Snubonse Darter 24 33 33 58 61 1.8
0.27 0.26 0.46
147 147 258
Mottled Sculpin 487 871 871 1106 4,414 5.1
19.64 19.76 25.09
3,875 3,875 4,920
Warpaint Shiner 21 22 22 28 80 3.6
0.36 0.35 0.45
98 98 125
Swannanoa Darter 14 20 20 44 74 3.7
0.33 0.33 0.72
89 89 196
Saffron Shiner 79 94 94 118 153 1.6
0.68 0.67 0.84
418 418 525
Blacknose Dace 12 14 14 25 51 3.6
0.23 0.22 0.40
62 62 111
Central Sonteroller 37 39 39 45 546 14.0
2.43 2.43 2.80
173 173 200
Longnose Dace 6 6 6 13 119 19.8
0.53 0.53 1.15
27 27 58
White Sucker 2 2 2 53 166 83.0
0.74 0.74 19.57
9 9 236
Totals 877 1,330 1,329 1,813 15,370
68.37 68.47 98.89
5,916 5,912 2,845
Note: RBT = Rainbow Trout, BNT = Brown Trout, and BKT = Brook Trout.

11
0
500
1000
1500
2000
2500
'91 '92 '93 '94 '95 '96 '97 '98 '99 '00 '01 '02 '03 '04 '05 '06 '07 '08 '09 '10 '11 '12 '13 '14 '15 '16 '17
Fis
h/h
a
Year
BNT ≤90 mm
BNT >90 mm
RBT ≤90 mm
RBT >90 mm
Mean = 947 fish/ha
0
500
1000
1500
2000
2500
'91 '92 '93 '94 '95 '96 '97 '98 '99 '00 '01 '02 '03 '04 '05 '06 '07 '08 '09 '10 '11 '12 '13 '14 '15 '16 '17
Fis
h/h
a
BNT ≤90 mm
BNT >90 mm
RBT ≤90 mm
RBT >90 mm
0
10
20
30
40
50
60
70
'91 '92 '93 '94 '95 '96 '97 '98 '99 '00 '01 '02 '03 '04 '05 '06 '07 '08 '09 '10 '11 '12 '13 '14 '15 '16 '17
kg
/ha
BNT ≤90 mm
BNT >90 mm
RBT ≤90 mm
RBT >90 mm
0
10
20
30
40
50
60
70
'91 '92 '93 '94 '95 '96 '97 '98 '99 '00 '01 '02 '03 '04 '05 '06 '07 '08 '09 '10 '11 '12 '13 '14 '15 '16 '17
kg
/ha
Year
BNT ≤90 mm
BNT >90 mm
RBT ≤90 mm
RBT >90 mm
Beaverdam Creek
Figure 2-1. Trout abundance estimates for the Beaverdam Creek monitoring stations. BNT = Brown Trout and RBT = Rainbow Trout. Bars indicate upper 95% confidence limits (total).
Density Biomass Station 1
Station 2
Mean = 1,038 fish/ha
Mean = 36.9 kg/ha
Mean = 31.3 kg/ha

12
Beaverdam Creek
Figure 2-2. Length frequency distributions for Rainbow and Brown Trout from the 2017 Beaverdam Creek monitoring stations.
0
10
20
30
40
50
60
25 51 76 102 127 152 178 203 229 254 279 305 330 356 381 406
Nu
mb
er
of
Fis
h
Length Class (mm)
Rainbow
Brown
Rainbow Trout n = 79 69–237 mm Brown Trout n = 74 71–356 mm
0
10
20
30
40
50
60
25 51 76 102 127 152 178 203 229 254 279 305 330 356 381 406
Nu
mb
er
of
Fis
h
Length Class (mm)
Rainbow
Brown
Station 1
Station 2
Rainbow Trout n = 78 64–317 mm Brown Trout n = 57 70–430 mm

13
2.3 DOE CREEK
Study Area
Doe Creek is a large spring-fed tributary to Watauga Reservoir in Johnson County. It flows
through privately-owned land, much of which is being used for agricultural and residential purposes.
Doe Creek is probably best known for the trophy Rainbow Trout fishery it supported during the 1950s
and 1960s. That fishery consisted of an annual run of fall-spawning rainbows from Watauga Reservoir
and probably originated from eggs planted at the mouth of the stream in 1954 (Bivens et al. 1998).
Although the trophy fishery disappeared in the early 1970s, Doe Creek still supports one of
Tennessee’s finest populations of wild Rainbow Trout and some large (>500 mm) Rainbow Trout still
enter Doe Creek each winter from the lake. Adult Rainbow Trout are also stocked during March-June
(about 2,800/year) and general (statewide) trout fishing regulations apply.
Doe Creek was originally surveyed by Shields (1950) and later qualitatively sampled by Bivens
(1989). Ironically, Shields (1950) recommended removal of Doe Creek from the trout stream list
because of its limited trout carrying capacity and lack of potential for reproduction at that time. A 2003
creel survey indicated that Doe Creek had the highest estimated trout catch and harvest rates among
the five streams surveyed and was second only to Doe River (much of which is in Roan Mountain State
Park) in terms of estimated angler effort for trout (Habera et al. 2004).
The current long-term monitoring station on Doe Creek was established in 1993 and has been
sampled annually since then. It is located along Highway 67 and ends at the old dam just below the
confluence with the outflow from Lowe Spring, which is an important source of cold water for Doe
Creek. Sample site location and effort details, along with habitat and water quality information are given
in Table 2-4.
Results and Discussion
Catch data and abundance estimates for all species sampled at the Doe Creek station in 2017
are given in Table 2-5. Estimated Rainbow Trout density and biomass has decreased each year since
2014, and both measures of abundance are below the corresponding long-term averages for this site
(Figure 2-3). Doe Creek previously produced wild Rainbow Trout biomass estimates >100 kg/ha (1993,
1997, and 2004) and that averaged 75 kg/ha prior to 2007 (Figure 2-3). However, wild trout production
in Doe Creek is not typically attaining this former potential. Biomass has averaged just below 60 kg/ha
since 2007 and 2017 biomass and density estimates ranked among the lowest obtained since
monitoring began in 1993. This decline may be a result of drought conditions over the past few years.
The Rainbow Trout cohort was relatively strong, as 60% (136) of the 224 rainbows captured
were in the 70-110 mm size range (age 0). Now, these age-1 fish largely appear in the 127-178 mm
size classes in the length frequency histogram (Figure 2-4). Recruitment into the larger (≥203 mm)
adult size classes (4 fish; Figure 2-4) remained consistent with 2016 (5 fish), including two trout ≥229
mm. With improved habitat conditions in 2017 (higher flow and lower temperature), increased biomass
and density could be expected next year.

14
Management Recommendations
Doe Creek remains one of Tennessee’s most productive wild trout streams and TWRA is
committed to maintaining it. The seasonal hatchery-supported trout fishery in Doe Creek is popular
(Habera et al. 2004), but management of this stream should feature the outstanding wild trout
population. The current stocking program is not incompatible with wild trout management or native fish
assemblages (Weaver and Kwak 2013), but it should not be expanded in scope or scale. Annual
monitoring at the station near Lowe Spring should continue and may help identify any impacts related
to Mountain City’s water withdrawals (0.5 million gallons per day) from the spring, which began in 2002.
Additionally, a new angler survey would help determine if current stocking levels are appropriate.

15
Table 2-4. Site and sampling information for Doe Creek in 2017.
Location
Station 1 Site code
420173001
Sample date
13 September Watershed
Watauga River
County
Johnson Quadrangle
Doe 214 NW
Lat-Long
36.42709 N, -81.93725 W Reach number
06010103-37,0
Elevation (ft)
2,210 Stream order
4
Land ownership
Private Fishing access
Good
Description
Site ends at small dam just below Lowe spring.
Effort Station length (m)
134
Sample area (m²)
924
Personnel
11
Electrofishing units
3
Voltage (AC)
125
Removal passes
3
Habitat
Mean width (m)
6.9
Maximum depth (cm)
60
Canopy cover (%)
45
Aquatic vegetation
scarce
Estimated % of site in pools
32 Estimated % of site in riffles
68
Habitat assessment score
155 (suboptimal)
Substrate Composition
Pool (%) Riffle (%)
Silt
5 0 Sand
5 5
Gravel
25 25 Rubble
20 35
Boulder
20 25 Bedrock
25 10
Water Quality Flow (cfs; visual)
18.3; normal Temperature (C)
14.0
pH
7.5 Conductivity (μS/cm)
151
Dissolved oxygen (mg/L)
N/M Alkalinity (mg/L CaCO3)
85

16
Table 2-5. Fish population abundance estimates (with 95% confidence limits) for the monitoring station
on Doe Creek sampled 13 September 2017.
Population Size
Est. Mean
Biomass (kg/ha)
Density (fish/ha)
Total
Lower Upper
Weight Fish
Lower Upper
Lower Upper
Species Catch Est. C.L. C.L. (g) Wt. (g) Est. C.L. C.L. Est. C.L. C.L.
RBT ≤90 mm 1
1 1 1
RBT >90 mm 137
143 137 151
3,702 25.9
40.07 38.39 42.31
1,548 1,483 1,634
Creek Chub 1
Blacknose Dace 136
147 136 159
650 4.4
7.03 6.50 7.60
1,591 1,472 1,721
Fantail Darter 16
19 16 29
39 2.1
0.42 0.36 0.65
206 173 314
Mottled Sculpin 233
476 234 718
1,698 3.6
18.37 9.03 27.71
5,152 2,532 7,771
C. Stoneroller 56
56 56 58
2,042 36.5
22.10 22.10 22.89
606 606 628
N. Hogsucker 4
6 6 6
371 61.8
4.01 4.01 4.01
65 65 65
Totals 584 848 586 1,122 8,501 92.01 80.39 105.17 9,167 6,331 12,132

17
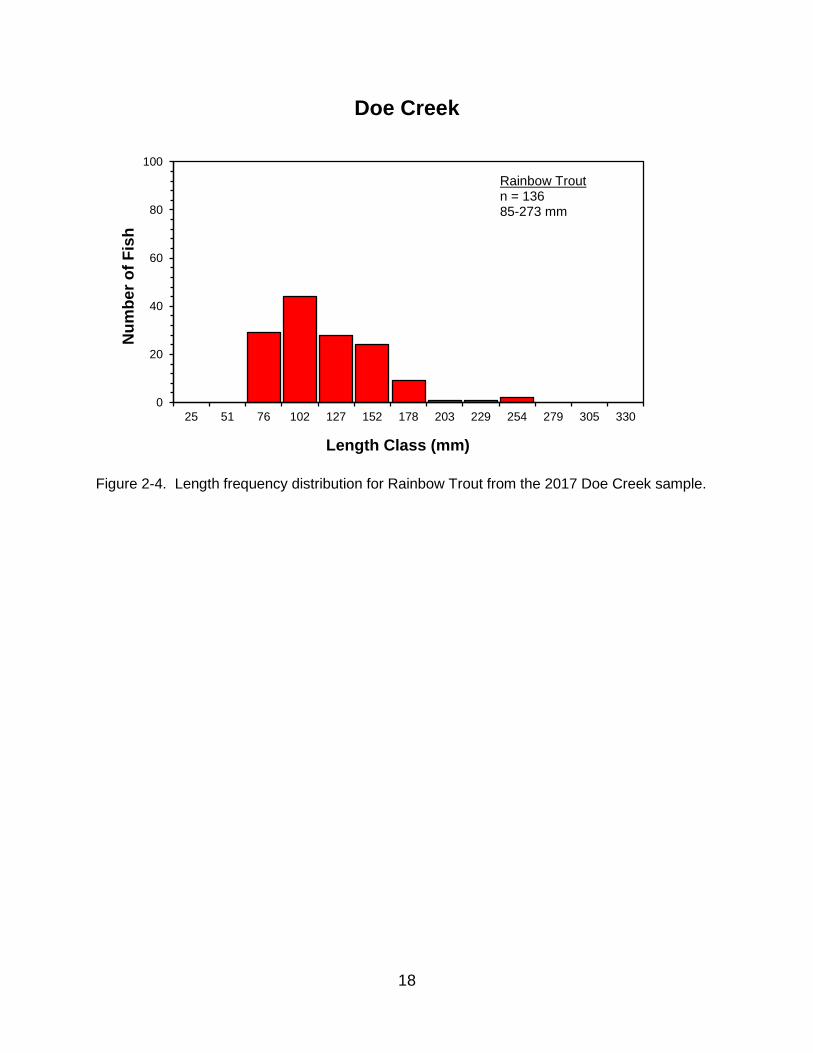
Doe Creek
Figure 2-3. Trout abundance estimates for the Doe Creek monitoring station. RBT =
Rainbow Trout. Bars indicate upper 95% confidence limits (total).
0
1000
2000
3000
4000
5000
6000
'93 '94 '95 '96 '97 '98 '99 '00 '01 '02 '03 '04 '05 '06 '07 '08 '09 '10 '11 '12 '13 '14 '15 '16 '17
Den
sit
y (
fis
h/h
a)
Year
RBT ≤90 mm
RBT >90 mm
0
25
50
75
100
125
150
'93 '94 '95 '96 '97 '98 '99 '00 '01 '02 '03 '04 '05 '06 '07 '08 '09 '10 '11 '12 '13 '14 '15 '16 '17
Bio
ma
ss
(k
g/h
a)
Year
RBT ≤90 mm
RBT >90 mm
Mean = 2,527 fish/ha
Mean = 66.7 kg/ha
18
Doe Creek
Figure 2-4. Length frequency distribution for Rainbow Trout from the 2017 Doe Creek sample.
0
20
40
60
80
100
25 51 76 102 127 152 178 203 229 254 279 305 330
Nu
mb
er
of
Fis
h
Length Class (mm)
Rainbow Trout n = 136 85-273 mm

19
2.4 LEFT PRONG HAMPTON CREEK
Study Area
Left Prong of Hampton Creek (Left Prong) flows through the 281-ha (693-acre) Hampton
Creek Cove State Natural Area in Carter County and is a tributary to Doe and Watauga rivers.
A substantial portion of this area remains as livestock pasture, although fencing prevents
livestock access to the stream. Rhododendron (Rhododendron spp.), which often dominates
the riparian vegetation of other wild trout streams, is absent along Left Prong. Historically, the
stream would have been inhabited by Brook Trout, but TWRA found only an abundant wild
Rainbow Trout population during a 1988 survey (Bivens 1989). Subsequently, Brook Trout
were successfully restored to the upper 2 km of Left Prong during 1999-2000 through a
cooperative, multi-agency effort involving TWRA, Overmountain Chapter TU, USFS, NPS,
Tennessee Department of Environment and Conservation (TDEC), and the Southern
Appalachian Highlands Conservancy. The ineffective modified-culvert fish barrier at the
downstream end of the Brook Trout re-establishment zone was replaced in 2007 with a 2.7 m (9
ft) waterfall (Habera and Carter 2008; Habera et al. 2008). Maintenance on this structure was
completed in 2015 by Overmountain TU and TWRA. Left Prong was placed under special
regulations (three-fish creel limit for Brook Trout; single-hook, artificial lures only) during
establishment period of the new Brook Trout population. It is now managed under TWRA’s
special wild trout regulations, which include a 5-fish creel limit and no minimum size limit.
A long-term monitoring station (Station 1) was established on lower Left Prong in 1994.
Stations 2 and 3 were added in 1996 to better represent the upper portion of the stream, which
has a higher gradient and more canopy cover, but have also served to monitor the Brook Trout
population since 2000. All three stations have been sampled annually since 1996. Sample site
location and effort details, along with habitat and water quality information are summarized in
Table 2-6.
Cook and Johnson (2016) evaluated post-stocking performance in Left Prong for two
cohorts (2013 and 2014) of native Brook Trout fingerlings produced at the Tellico Brook Trout
hatchery and at the Tennessee Aquarium (re-circulating system). They found the overall annual
survival rate for these fish was lower in Left Prong (16.7%) than in Region 3’s Sycamore Creek
(34.7%) and for seven pooled wild Brook Trout populations from GSMNP (29.3%; Kulp 1994).
A possible explanation for the lower survival of stocked fingerlings in Left Prong is that this
stream’s higher Brook Trout density reduced growth—and ultimately survival—of the stocked
fish (Cook and Johnson 2016).
Left Prong is also part of the ongoing multi-agency Tennessee’s Ecologically At-Risk
Streams—Appalachian Mountains (TEARS-AM) project to collect baseline chemical, physical
and biological data on stream sections with naturally reproducing Brook Trout populations within
the CNF and GSMNP. The project goal is to investigate global, regional and/or local influences

20
on stream health such as climate change and atmospheric deposition of mercury. Food chain
dynamics is being assessed by analyzing contaminant concentrations and stable isotopes of
carbon and nitrogen in seven matrices: sediment, periphyton, emergent insects, crayfish,
salamanders, eastern Brook Trout, and tetragnathid spiders.
Results and Discussion
Catch data and abundance estimates for trout and all other species sampled at the three
stations on Left Prong in 2017 are given in Table 2-7. The 2017 density and biomass estimates
for Rainbow Trout at Station 1 continued their overall downward trend, with an all-time low
density of 842 fish/ha and below-average biomass of 23.8 kg/ha (Figure 2-5). Total Rainbow
Trout density at Station 1 declined not only because of the low density of adults, but also a very
small 2017 cohort (fish ≤90 mm, Figure 2-5). The total Rainbow Trout biomass estimate at
Station 1 remained consistent with last year (Figure 2-5), but remains about 40% below the
long-term average (56.7 kg/ha; Figure 2-5). The substantially decreased adult density and
increased adult biomass suggests the fish at Station 1 were larger fish than last year, which is
also supported by the length frequency distribution (Figure 2-6).
Previously (1990s), biomass estimates at Station 1 averaged nearly 100 kg/ha and were
among the highest obtained for wild Rainbow Trout anywhere in Tennessee. However, biomass
has generally declined since 2000 (Figure 2-5) and the recent 10-year average biomass (32.77
kg/ha) and density (2929 fish/ha) are significantly different from the long term average biomass
(56.7 kg/ha) and density (4498 fish/ha) (density: F = 4.12, P = 0.05, df = 33; biomass: F = 6.31,
P = 0.02, df = 33). This was likely in response to the various droughts that prevailed since
2000, although the trend reversed briefly during 2003-2005 with more normal stream flows.
Winter floods in this watershed (particularly in 1998) have also substantially reduced pool
habitat at this site (e.g., by partial or complete filling) and although habitat data doesn’t show
decreasing trends, it is suboptimal. A different method of data collection may be needed to pick
up these changes in habitat. Roghair et al. (2002) and Carline and McCullough (2003) found
that flooding in trout streams caused substantial substrate movement, which then decreased
pool lengths, surface areas, and depths. Pool depth and quality are correlated with trout
abundance (Lewis 1969; Bowlby and Roff 1986), and pools are important trout habitat features
(Matthews et al. 1994; Anglin and Grossman 2013; Davis and Wagner 2016), particularly during
low flows (Elliott 2000; Sotiropoulos et al. 2006) and for adult Brook Trout (Johnson and Dropkin
1996). Pool length or surface area is not one of our habitat assessment variables, although
maximum depth is. However, maximum depth can vary with flow and provides only one data
point per year. Habitat assessment scores decreased from optimal in 1999 through 2001 to
suboptimal thereafter; however this does not correlate with abundance estimates, since
biomass and density trend downward after 2002 and habitat quality remains relatively constant.
Consequently, we hypothesize that unless pool quality improves, it is unlikely that this site will
ever be capable of supporting the trout biomass it once did. However, other variables may be
playing a part in the decrease of biomass that are not well represented in the habitat data

21
collected such as temperature, stream nutrient availability, pH, alkalinity, complexity of habitat,
etc.
Brook Trout abundance at Station 2 was relatively unchanged from 2016, although the
density of fish ≤ 90 mm did decline somewhat, indicating a smaller 2017 cohort (Figure 2-5).
Brook Trout abundance estimates at Station 3 (Figure 2-5) declined relative to 2016, with
current density (2,537 fish/ha) and biomass (36.8 kg/ha) levels well below the long term
averages 4,439 fish/ha and 76.0 kg/ha, respectively. Degraded pool habitat at Station 2 caused
by the 1998 flood (as at Station 1) will likely prevent Brook Trout abundance from reaching the
level previously attained by Rainbow Trout there (78 kg/ha). Sedimentation of the pools in
Station 3 is also becoming increasingly evident and may be responsible for declining abundance
there, even though it is not well-reflected in the habitat data obtained to date. No Rainbow Trout
have been captured at these stations since construction of the new fish barrier in 2007,
indicating that it is effectively preventing encroachment by Rainbow Trout from downstream.
The Rainbow Trout population size structure at Station 1 indicated a poor 2017 cohort,
and limited recruitment to the adult size classes, even after large 2016 cohort (Figure 2-5 and 2-
6). Poor recruitment to larger size classes has been typical of the Rainbow Trout population at
Station 1 during recent years. It is unlikely that the lack of larger fish is a result of harvest, as
fishing pressure on this stream (particularly the Rainbow Trout zone) would be considered
relatively light. Some Brook Trout are typically captured at Station 1, but are likely transients
from upstream of the barrier. Six were captured in 2016, but only two were adults (108-158
mm), indicating little recruitment from the 13 age-0 Brook Trout present in 2015. Only one
Brook Trout was captured this year (109 mm). It will be interesting to determine if a small Brook
Trout population can eventually become established below the barrier, especially given the
reduced level of Rainbow Trout biomass there now. Size structures for the Brook Trout
populations at Stations 2 and 3 also indicated the presence of an adequate 2017 cohort (Figure
2-6), which was typical of other streams sampled in 2017. There was recruitment into the larger
Brook Trout size classes (178 mm; Figure 2-6) at both stations in 2017, which is significant
because none were found at either station in 2016 (the first time this occurred since monitoring
began.
Management Recommendations
Upper Left Prong’s Brook Trout population has made it one of Tennessee’s premier
Brook Trout fisheries. Since fully established in 2003, mean Brook Trout biomass for the upper
station (76 kg/ha) has substantially exceeded the statewide average for other streams (about 21
kg/ha), and is comparable to the mean biomass for the previous Rainbow Trout population (81
kg/ha). Native Brook Trout may be better adapted to and more tolerant of drought conditions
(common during the past decade) than are nonnative Rainbow Trout. Monitoring data from
other streams such as Rocky Fork (Section 2.3.2) and Gentry Creek also indicate Brook Trout
have greater drought tolerance compared to Rainbows Trout. Management of Left Prong

22
should feature its Brook Trout fishery and development of this important database should
continue through annual monitoring at all three sites.
Because of the decreasing biomass and density trends at all three stations, suboptimal
habitat scores, and decreasing quantity and quality pools, a more detailed habitat analysis may
be useful. Deployment of instream water temperature loggers would also help identify any
potential effects on Brook Trout abundance related to temperature.

23
Table 2-6. Site and sampling information for Left Prong Hampton Creek in 2017.
Location
Station 1
Station 2
Station 3
Site code
420172501
420172502
420172503
Sample date
5 July
5 July
5 July
Watershed
Watauga River
Watauga River
Watauga River
County
Carter
Carter
Carter
Quadrangle
White Rocks Mtn. 208 NE
White Rocks Mtn. 208 NE
White Rocks Mtn. 208 NE
Lat-Long
36.15132 N, -82.05324 W
36.14673 N, -82.04917 W
36.13811 N, -82.04473 W
Reach number
06010103
06010103
06010103
Elevation (ft)
3,080
3,240
3,560
Stream order
2
2
2
Land ownership
State (Hampton Cove)
State (Hampton Cove)
State (Hampton Cove)
Fishing access
Good
Good
Good
Description
Begins ~10 m upstream
Begins 50 m upstream of
Begins 880 m upstream of
of the first foot bridge.
the fish barrier.
the upper end of Site 2.
Effort
Station length (m)
106
94
100
Sample area (m²)
392
432
410
Personnel
3
4
4
Electrofishing units
1
1
1
Voltage (AC)
300
400
500
Removal passes
3
3
3
Habitat
Mean width (m)
3.7
4.6
4.1
Maximum depth (cm)
37
NM
60
Canopy cover (%)
NM
90
NM
Aquatic vegetation
Scarce
Scarce
Scarce
Estimated % of site in pools
39
45
NM
Estimated % of site in riffles
61
55
NM
Habitat assessment score
NM
NM
NM
Substrate Composition
Pool (%) Riffle (%)
Pool (%) Riffle (%)
Pool (%) Riffle (%)
Silt
15 0
5 0
25 0
Sand
10 5
10 10
10 5
Gravel
35 40
40 25
20 30
Rubble
35 45
20 45
15 35
Boulder
5 10
25 20
25 25
Bedrock
0 0
0 0
5 5
Water Quality
Flow (cfs; visual)
3.86; high
3.86; high
NM; low
Temperature (C)
17.6
15.8
14.6
pH
7.0
6.8
6.9
Conductivity (μS/cm)
27
26
15.3
Dissolved oxygen (mg/L)
NM
NM
NM
Alkalinity (mg/L CaCO3)
NM
NM
NM

24
Table 2-7. Fish population abundance estimates (with 95% confidence limits) for the monitoring stations
on Left Prong Hampton Creek sampled 5 July2017.
Population Size
Est. Mean
Biomass (kg/ha)
Density (fish/ha)
Total Catch
Lower Upper
Weight Fish
Lower Upper
Lower Upper
Species Est. C.L. C.L. (g) Wt. (g) Est. C.L. C.L. Est. C.L. C.L.
Station 1
RBT ≤90 mm 14
14 12 16
42 3
1.07 0.92 1.22
357 306 408
RBT >90 mm 19
19 17 21
890 46.9
22.70 16.33 25.13
485 434 536
BKT >90 mm 1
1 1 1
12 12.0
0.31 0.31 0.31
26 26 26
Blacknose Dace 65
67 62 72
231 3.4
5.89 5.38 6.24
1,709 1,582 1,837
Fantail Darter 5
7 1 13
32 4.6
0.82 0.12 1.53
179 26 332
Totals 104 108 93 123 1,207 30.80 23.05 34.43 2,755 2,372 3,138
Station 2
BKT ≤90 mm 35
36 31 41
140 3.9
3.24 2.80 3.70
833 718 949
BKT >90 mm 37
37 36 38
1,006 27.2
23.29 22.67 23.93
856 833 880
Totals 72 73 67 79 1,146 26.53 25.47 27.63 1,690 1,551 1,829
Station 3
BKT ≤90 mm 49
51 46 56
118 2.5
2.88 2.80 3.41
1,244 1,122 1,366
BKT >90 mm 53
53 51 55
1,394 26.3
34.00 32.71 35.28
1,293 1,244 1,341
Totals 102 104 97 111 1,512 36.88 35.52 38.70 2,537 2,366 2,707

25
Left Prong Hampton Creek
Station 1
Figure 2-5. Trout abundance estimates for the Left Prong Hampton Creek monitoring stations. RBT = Rainbow Trout and BKT = Brook Trout. Bars indicate upper 95% confidence limits.
0
2,000
4,000
6,000
8,000
10,000
'94 '95 '96 '97 '98 '99 '00 '01 '02 '03 '04 '05 '06 '07 '08 '09 '10 '11 '12 '13 '14 '15 '16 '17
Fis
h/h
a
0
20
40
60
80
100
120
140
'94 '95 '96 '97 '98 '99 '00 '01 '02 '03 '04 '05 '06 '07 '08 '09 '10 '11 '12 '13 '14 '15 '16 '17
kg
/ha
BKT ≤90 mm
BKT >90 mm
RBT ≤90 mm
RBT >90 mm
0
2,000
4,000
6,000
8,000
10,000
'96 '97'98'99'00'01'02'03'04'05'06'07'08'09'10'11'12'13'14'15'16'17
Fis
h/h
a
0
20
40
60
80
100
120
140
160
'96 '97 '98 '99 '00 '01 '02 '03 '04 '05 '06 '07 '08 '09 '10 '11 '12 '13 '14 '15 '16 '17
kg
/ha
0
2,000
4,000
6,000
8,000
10,000
'96'97'98'99'00'01'02'03'04'05'06'07'08'09'10'11'12'13'14'15'16'17
Fis
h/h
a
0
20
40
60
80
100
120
140
160
'96 '97 '98 '99 '00 '01 '02 '03 '04 '05 '06 '07 '08 '09 '10 '11 '12 '13 '14 '15 '16 '17
kg
/ha
Density
Station 2
Station 3
Biomass
Year
Mean = 4,498 fish/ha
Mean = 2,239 fish/ha
Mean = 4,439 fish/ha
Mean = 56.7 kg/ha
Mean = 26.9 kg/ha
Mean = 76.2 hg/ha

26
Left Prong Hampton Creek
Figure 2-6. Length frequency distributions for trout from the 2017 Left Prong Hampton Creek samples.
0
10
20
30
40
50
60
25 51 76 102 127 152 178 203 229 254 279
Brook
Rainbow
0
10
20
30
40
50
60
25 51 76 102 127 152 178 203 229 254 279
0
10
20
30
40
50
60
25 51 76 102 127 152 178 203 229 254 279
Station 2
Station 1
Station 3
Length Class (mm)
Nu
mb
er
of
Fis
h
Rainbow Trout n = 33 53-205 mm Brook Trout n = 1 109 mm
Brook Trout n = 7 59-202 mm
Brook Trout n = 10 51-199 mm

27
2.5 PAINT CREEK
Study Area
Paint Creek begins in the Bald Mountains of Greene County along the North Carolina
border and flows 42 km southwest to its confluence with the French Broad River. Over three
fourths of Paint Creek is located within the CNF, including all of the lower 19 km. The upper
portion of the stream (upstream of Highway 70) is mostly privately owned with residential and
small-scale agricultural land uses. Wild trout populations occupy almost the entire length of
Paint Creek, with rainbows being present in the upper reaches and Brown Trout predominating
downstream.
One tributary (Sawmill Branch) supports 1.8 km of Brook Trout water. These are native,
southern Appalachian fish, but are originally from Stony Creek in the Watauga River watershed
(USFS restoration). The 2.3-km hybrid brook trout population that had inhabited Little Paint
Creek (Strange and Habera 1997) was not relocated during the 2013 distribution survey and
may have been lost as a result of recent droughts. This was a relatively low-elevation Brook
Trout population (beginning at 2,050’), where habitat could become marginal during periods of
low flow and higher temperature. However, the population in nearby Sawmill Branch has a
similar distribution and survived these conditions. Given that no trout are now present upstream
of the man-made barrier on Little Paint Creek, it may be a candidate for restoration of a native
Brook Trout population.
Paint Creek has a long history as a quality trout fishery. Shields (1950) described the
portion of Paint Creek downstream of Highway 70 as “one of the finest [trout] streams of the
upper East Tennessee area”. He noted that Little Paint Creek, Grassy Branch, and Sawmill
Branch provided for excellent reproduction, thus making stocking in that area unnecessary.
Lower Paint Creek’s initial trout fishery probably featured Rainbow Trout (put-and-take), but by
1950 the stream was well known for its large Brown Trout (Shields 1950). Paint Creek’s Brown
Trout were also reproducing by 1950, making it the only self-sustaining Brown Trout population
in the southern Appalachians known to Shields at that time.
Paint Creek continues to support a wild Brown Trout population, although abundance
has declined in recent years—particularly downstream of the USFS campground. To meet
angling demand, the portion from the USFS campground downstream is still managed as a put-
and-take fishery. About 7,800 catchable rainbows are stocked each year, primarily during
February-June. The section (including tributaries) between the campground and the upper
USFS boundary (near Highway 70) was under a 229-mm minimum length limit, three-fish creel
limit, and single-hook, artificial-lures-only restriction during 1994-2012 to emphasize the wild
trout fishery. The 229-mm length limit was removed and the creel limit was increased to five fish
in 2013 as part of the revision of special wild trout regulations to make them more biologically
sound. A delayed harvest area is also in effect downstream of the campground during October-
February. Additional stockings of catchable rainbows are made during this time and only
artificial lures may be used in the designated area (all trout must be released).

28
Paint Creek was qualitatively sampled near the confluence with Little Paint Creek in
1986 (USFS) and 1987 (USFS/TWRA). These efforts were part of a study sponsored by the
American Fisheries Society’s Southern Division Trout Committee to evaluate stocking of half-
wild Brown Trout in North Carolina, Virginia, and Tennessee streams. However, the Tennessee
data were not included in the final report (Borawa 1990). Subsequently, Paint Creek was
quantitatively sampled in 1992 and 1995 by TWRA. The current monitoring stations were
established in 2002 and have been sampled on a three-year rotation since 2008. Site location
and effort details, along with habitat and water quality information are summarized in Table 2-8.
Results and Discussion
Only gamefish—salmonids (trout) and centrarchids (sunfish)—were collected and
processed (weighed and measured) at the Paint Creek stations in 2017; all other species were
noted, but were not collected. A similar procedure has been followed for all samples since 2002.
Catch data and abundance estimates for trout and sunfish sampled at the Paint Creek stations
in 2017 are given in Table 2-9. At Station 1, only one Rainbow Trout was captured in the first of
two passes. A third pass was not attempted and no statistics were calculated based on this one
fish. At Station 1, trout numbers and biomass were the lowest observed since monitoring efforts
began. At Station 2, total trout biomass increased slightly from 2014, indicating some
recruitment into larger size classes. However, total trout biomass at both stations remains
substantially below the 1992/1995 and 2002- 2004 levels (Figure 2-7). The recent droughts are
the most likely cause for the depressed abundance of the wild trout fishery in Paint Creek.
Brown Trout had previously (1996-2014) dominated relative biomass at both stations, but
Rainbow Trout biomass was essentially equal at Station 2 in 2017 and no Brown Trout were
captured at Station 1 (Table 2-9, Figure 2-7). Species composition and relative abundance of
the non-salmonid fish community was similar to what was present during previous surveys.
Size distributions for Paint Creek both rainbow and Brown Trout in 2017 indicated adult
and age-0 size classes were present at Station 2 (Figure 2-8). However, only one Rainbow
Trout and one Brown Trout < 100 mm were captured. This may indicate poor survival of fish
spawned or spawning success over the past years, which again was likely influenced by low
flow and high temperatures from the recent drought. Two Brown Trout ≥229 mm were captured
for the first time since 2008; however no Brown Trout ≥300 mm have been captured since 2004.
Prior to 2004, Paint Creek routinely produced Brown Trout >400 mm.
Management Recommendations
Paint Creek continues to provide one of Tennessee’s few wild trout fisheries that has
predominantly been composed of Brown Trout, although current abundance is substantially
below former levels. It is now likely more popular as a put-and-take and delayed-harvest
(October-February) fishery for Rainbow Trout (particularly downstream of the campground). The
management strategy now in place offers something for most trout anglers, thus no changes are
recommended at this time. The Paint Creek monitoring stations should be sampled every three
years to continue developing this stream’s database. Temperature loggers might also be
deployed to determine if summer/fall water temperatures are potentially limiting trout abundance

29
Table 2-8. Site and sampling information for Paint Creek in 2017.
Location
Station 1
Station 2
Site code
420172901
420172902
Sample date
06 September
06 September
Watershed
French Broad River
French Broad River
County
Greene
Greene
Quadrangle
Hot Springs 182 NE
Hot Springs 182 NE
Lat-Long
35.96560 N, -82.86275 W
35.97094 N, -82.82432 W
Reach number
06010105-71,0
06010105-71,0
Elevation (ft)
1,470
1,890
Stream order
4
3
Land ownership
USFS
USFS
Fishing access
Excellent
Fair
Description
Begins ~300 m upstream
Ends ~20 m upstream of
of Waders Picnic Area
first trail ford below confl.
(old campsite).
with Little Paint Creek.
Effort
Station length (m)
189
206
Sample area (m²)
1,550
1,463
Personnel
12
11
Electrofishing units
3
3
Voltage (AC)
300
300
Removal passes
2 (trout only)
3 (trout only)
Habitat
Mean width (m)
N/M
8.3
Maximum depth (cm)
100
130
Canopy cover (%)
70
40
Aquatic vegetation
scarce
scarce
Estimated % of site in pools
N/M
51
Estimated % of site in riffles
N/M
49
Habitat assessment score
140 (suboptimal)
145 (suboptimal)
Substrate Composition
Pool (%) Riffle (%)
Pool (%) Riffle (%)
Silt
15
10
Sand
10 10
15 15
Gravel
10 20
15 20
Rubble
15 35
15 25
Boulder
15 25
5 15
Bedrock
35 10
40 25
Water Quality
Flow (cfs; visual)
31.1; normal
9.8; normal
Temperature (C)
16.8
17.0
pH
7.0
7.1
Conductivity (μS/cm)
46
53
Dissolved oxygen (mg/L)
N/M
N/M
Alkalinity (mg/L CaCO3)
25
25

30
Table 2-9. Estimated trout and sunfish population sizes, standing crops, and densities (with 95% confidence limits) for two stations on Paint Creek in 2017. No statistics were calculated for RBT >90 mm at Station 1 due to small sample size (n=1).
Population Size
Est. Mean
Standing Crop (kg/ha)
Density (Fish/ha)
Total
Lower Upper
Biomass Fish
Lower Upper
Lower Upper
Species Catch Est. C.L. C.L. (g) Wt. (g) Est. C.L. C.L. Est. C.L. C.L.
Station 1
RBT >90 mm 1
-- -- -- -- --
-- -- --
-- -- --
Rock bass 4
4 4 6
173 43.3
-- -- --
-- -- --
Longnose Dace
Present
Blacknose Dace
Present
Warpaint Shiner
Abundant
Saffron Shiner
Abundant
Tennessee Shiner
Present
Creek Chub
Abundant
River Chub
Abundant
C. Stoneroller
Abundant
Fantail Darter
Common
Greenfin Darter
Common
Swannanoa Darter
Common
N. Hogsucker
Abundant
Totals (trout) 1 1 1 1 30 0.00 0.00 0.00
Station 2
RBT >90 mm 6
6 6 9
396 66.0
2.32 2.32 3.47
35 35 53
BNT >90 mm 6
6 6 9
492 82.0
2.88 2.88 4.32
35 35 53
Bluegill 3
3 3 8
48 16.0
0.28 0.28 0.75
18 18 47
Blacknose Dace
Present
Creek Chub
Common
C. Stoneroller
Abundant
Swannanoa Darter
Common
N. Hogsucker
Common
Totals (trout) 12 12 12 18 888 5.19 5.19 7.79 70 70 105
Note: RBT = Rainbow Trout and BNT = Brown Trout.

31
Paint Creek
Figure 2-7. Annual trout abundance estimates for the Paint Creek 2017 monitoring stations. Note,
starting in 2008, the stream was sampled every third year.
0
10
20
30
40
'92 '93 '94 '95 '96 '97 '98 '99 '00 '01 '02 '03 '04 '05 '06 '07 '08 '09 '10 '11 '12 '13 '14 '15 '16 '17
kg
/ha
Year
BNT ≤90 mm
BNT >90 mm
RBT ≤90 mm
RBT >90 mm
Station 2
Station 1
0
100
200
300
400
500
'92 '93 '94 '95 '96 '97 '98 '99 '00 '01 '02 '03 '04 '05 '06 '07 '08 '09 '10 '11 '12 '13 '14 '15 '16 '17
Fis
h/h
a
Year
0
100
200
300
400
500
'92 '93 '94 '95 '96 '97 '98 '99 '00 '01 '02 '03 '04 '05 '06 '07 '08 '09 '10 '11 '12 '13 '14 '15 '16 '17
Fis
h/h
a
Year
0
10
20
30
40
'92 '93 '94 '95 '96 '97 '98 '99 '00 '01 '02 '03 '04 '05 '06 '07 '08 '09 '10 '11 '12 '13 '14 '15 '16 '17
kg
/ha
Year
Density Biomass

32
Paint Creek
Figure 2-8. Length frequency distributions for Brown and Rainbow Trout from the
2017 Paint Creek samples.
0
2
4
6
8
10
25 51 76 102 127 152 178 203 229 254 279
Nu
mb
er
of
Fis
h
Length Class (mm)
Browns
Rainbows
0
5
10
15
20
25
30
35
40
25 51 76 102 127 152 178 203 229 254 279
Nu
mb
er
of
Fis
h
Length Class (mm)
Browns
Rainbows
Station 1
Station 2
Rainbow Trout n = 1 153 mm
Brown Trout n = 6 98-273 mm Rainbow Trout n = 6 95-238 mm

33
2.6 RIGHT PRONG MIDDLE BRANCH
Study Area
Right Prong Middle Branch is a headwater tributary to the Doe and Watauga rivers. Its Roan
Mountain watershed is forested and located largely within the CNF in Carter County. It supports an
allopatric population of native Brook Trout upstream of State Route 143 first documented by Bivens
(1979). The current monitoring station was first sampled in 1994 (Strange and Habera 1995) and
was added to the monitoring program in 1997 to represent a high-elevation (above 4,000’ or 1,220
m) native Brook Trout population. Sample site location and effort details, along with habitat and
water quality information are summarized in Table 2-10.
Results and Discussion
Catch data and abundance estimates for Brook Trout sampled at the monitoring station in
2017 are given in Table 2-11. Despite some relatively strong cohorts in recent years, biomass has
decreased 59% since 2012 (from 76 kg/ha to 30 kg/ha in 2017; Figure 2-9). Consequently, biomass
is below the long-term mean of about 47 kg/ha (Figure 2-9). Much of the biomass decline can be
related to the presence of fewer large (≥152 mm) Brook Trout. The number of Brook Trout ≥152 mm
captured during 2014-2017 (3-7 fish) has declined compared to the 2011-2013 samples (13 to 19
fish), suggesting reduced recruitment to these larger size classes. The number of large fish did
increase from 3 to 7 during the past year, although total biomass remained relatively unchanged.
No particular habitat changes at this site are apparent (e.g., pool quality degradation), so other
factors may be involved, although excessive harvest seems unlikely due to Right Prong’s relatively
small size and obscurity.
DNA samples were collected from 27 Brook Trout during the 2016 monitoring efforts (Habera
et al. 2017) to confirm the genetic identity of this population and examine relationships with other
populations; results are pending.
Management Recommendations
No special management of Right Prong Middle Branch is suggested at this time other than
protection of the resource. Because of the small size of this stream and its relative obscurity,
angling pressure is probably light. Sampling at the monitoring station should continue in order to
increase our understanding of Brook Trout population dynamics, particular in higher-elevation
streams. Temperature loggers should also be deployed for long-term water temperature monitoring,
particularly summer months.

34
Table 2-10. Site and sampling information for Right Prong Middle Branch in 2017.
Location
Station 1
Site code
420172701
Sample date
18 August
Watershed
Watauga River
County
Carter Quadrangle
Carvers Gap 208 SE
Lat-Long
36.12007 N, -82.09574 W Reach number
06010103
Elevation (ft)
4,070 Stream order
1
Land ownership
USFS Fishing access
Limited
Description
Begins at head of small island
~270 m upstream of Rt. 143.
Effort
Station length (m)
90
Sample area (m²)
324
Personnel
2
Electrofishing units
1
Voltage (AC)
250
Removal passes
3
Habitat
Mean width (m)
3.6
Maximum depth (cm)
70
Canopy cover (%)
95
Aquatic vegetation
scarce
Estimated % of site in pools
43 Estimated % of site in riffles
57
Habitat assessment score
160 (optimal)
Substrate Composition
Pool (%) Riffle (%)
Silt
25 0 Sand
5 5
Gravel
30 30 Rubble
15 30
Boulder
20 35 Bedrock
5 0
Water Quality
Flow (cfs; visual)
3.1; normal
Temperature (C)
13.9
pH
6.9
Conductivity (μS/cm)
42
Dissolved oxygen (mg/L)
NM
Alkalinity (mg/L CaCO3)
NM

35
Table 2-11. Fish population abundance estimates (with 95% confidence limits) for the monitoring station on Right Prong Middle Branch sampled 18 August 2017.
Population Size
Est. Mean
Biomass (kg/ha)
Density (fish/ha)
Total
Lower Upper
Weight Fish
Lower Upper
Lower Upper
Species Catch Est. C.L. C.L. (g) Wt. (g) Est. C.L. C.L. Est. C.L. C.L.
BKT ≤90 mm 37
37 34 40
133 3.6
4.10 3.78 4.44
1,142 1,049 1,235
BKT >90 mm 36
36 33 39
986 27.4
30.43 28.78 32.98
1,111 1,019 1,204
Totals 73 73 67 79 1,119 34.54 32.56 37.43 2,253 2,068 2,438
Note: BKT = Brook Trout.

36
Right Prong Middle Branch
Density
Biomass
Figure 2-9. Trout abundance estimates for the Right Prong Middle Branch monitoring station for 2017. BKT = Brook Trout. Bars indicated upper 95% confidence limits (total).
0
1000
2000
3000
4000
5000
'94 '95 '96 '97 '98 '99 '00 '01 '02 '03 '04 '05 '06 '07 '08 '09 '10 '11 '12 '13 '14 '15 '16 '17
Fis
h/h
a
Year
BKT ≤90 mm
BKT >90 mm
0
20
40
60
80
100
'94 '95 '96 '97 '98 '99 '00 '01 '02 '03 '04 '05 '06 '07 '08 '09 '10 '11 '12 '13 '14 '15 '16 '17
kg
/ha
Year
BKT ≤90 mm
BKT >90 mm
Mean = 2427 fish/ha
Mean = 47 kg/ha

37
Right Prong Middle Branch
Figure 2-10. Length frequency distribution for Brook Trout from the 2017 Right
Prong Middle Branch sample.
0
5
10
15
20
25
30
25 51 76 102 127 152 178 203 229 254 279
Nu
mb
er
of
Fis
h
Length Class (mm)
Brook Trout n = 73 51-203 mm
38
2.7 ROCKY FORK
Study Area
Rocky Fork is a tributary of South Indian Creek in the Nolichucky River basin and is
located within Greene and Unicoi counties. The watershed is mountainous and forested, with
some recent (although limited) logging activity. The lower portion of the stream is contained
within the 825-ha (2,036-acre) Rocky Fork State Park. Planning continues for development of
the Park’s access roads, trail system, welcome center, picnic shelters, and campground. The
remaining 3,000 ha (7,600 acres) of the formerly privately-owned Rocky Fork tract were added
to the CNF. The middle and lower reaches of Rocky Fork support an excellent wild Rainbow
Trout population. The upper portion (above 2,890') has both Brook and Rainbow Trout. Three
tributaries (Blockstand Creek, Broad Branch, and Fort Davie Creek) also contain Brook Trout
populations. Genetically, all four populations (including Rocky Fork) have substantial hatchery
influence from numerous stockings that occurred into the 1980s (Strange and Habera 1997).
New DNA samples were collected from each population in 2016 to evaluate current genetic
characteristics, but results are still pending.
Shields (1950) noted that Rainbow Trout growth and production in Rocky Fork was quite
good and described the portion from Fort Davie Creek downstream (12.9 km) as carrying a
large crop of fish. Despite the Rocky Fork’s capacity for wild trout production, it was intensively
managed as a put-and-take fishery with hatchery-produced rainbow and Brook Trout for many
years (Bivens et al. 1998). That strategy was changed in 1988 to feature wild trout by
discontinuing stocking except in the 1.7-km segment upstream of the confluence with South
Indian Creek. The stocking rate for that portion of Rocky Fork averages ~4,800 adult Rainbow
Trout per year. A three-trout creel limit was also added to the 229-mm minimum length limit and
single-hook, artificial-lures only regulations already in place. Regulations were changed again in
1991 to focus harvest on Rainbow Trout by removing their size limit and raising the creel limit to
seven trout (to include only three Brook Trout). Subsequently, as more data from Rocky Fork
and other wild trout streams have become available, regulations were changed again in 2013 to
make them more biologically relevant. Accordingly, the creel limit was increased to five fish and
minimum size limits were removed (including the 152-mm statewide size limit for Brook Trout).
TWRA qualitatively sampled Rocky Fork in the 1980s (Bivens 1989; Bivens and Williams
1990), which then led to the current quantitative sampling program in 1991 with the
establishment of two long-term monitoring stations. These stations have been sampled annually
since 1991. Site location and effort details, along with habitat and water quality information are
summarized in Table 2-12.
Results and Discussion
Catch data and abundance (biomass) estimates for trout and all other species sampled
at the Rocky Fork stations in 2017 are given in Table 2-13. In general, both stations had
decreased trout density compared to 2016. The total trout biomass estimate at Station 1
decreased (29.21 kg/ha) relative to the past two years and is the third lowest since annual
monitoring began (Figure 2-11). Also, trout biomass dropped below the long-term average of

39
41.23 kg/ha trout. Trout density at Station 1 (1,504 fish/ha) also decreased relative to the past
two years and is below the long-term average (2,331 fish/ha).
The total trout density estimate at Station 2 decreased relative to 2016, primarily as the
result of decreased abundance of age-0 and adult Brook Trout (Figure 2-11). However, total
trout biomass at Station 2 (40.5 kg/ha) increased to the highest level observed since 2011,
although it still remains below the long-term average (44.7 kg/ha; Figure 2-11). A more detailed
discussion of the relative abundance of Brook and Rainbow Trout at Station 2 is provided in
Section 2.8.2.
Abundance of the 2017 Rainbow Trout cohort at Station 1 (age-0 fish) was below
average, although 2017 Rainbow Trout cohorts in most streams were also below average.
Size distributions for Rainbow and Brook Trout at Station 2 are provided and discussed in
Section 2.8.2.
Management Recommendations
Rocky Fork provides a good fishery for wild Rainbow and Brook Trout that management
continues to emphasize. Because the stream is relatively long (>13 km) and access is limited to
foot travel, it provides an ideal setting for anglers seeking a more solitary experience. Monitoring
of the Rocky Fork stations should be conducted annually to maintain the continuity of this
important wild trout database and document any effects related to development of the road/trail
system in the State Park and upstream areas in the CNF.

40
Table 2-12. Site and sampling information for Rocky Fork in 2017.
Location
Station 1
Station 2
Site code
420173101
420171302
Sample date
21 September
21 September
Watershed
Nolichucky River
Nolichucky River
County
Unicoi
Greene
Quadrangle
Flag Pond 190 SE
Flag Pond 190 SE
Lat-Long
36.04801 N, -82.55889 W
36.06758 N, -82.59608 W
Reach number
06010108
06010108
Elevation (ft)
2,360
3,230
Stream order
4
3
Land ownership
State of TN (TDEC)
USFS
Fishing access
Good
Limited
Description
Begins ~100 m upstream of the blue gate.
Ends ~10 m upstream of confl. with Ft. Davie Ck.
Effort
Station length (m)
130
100
Sample area (m²)
871
360
Personnel
12
4
Electrofishing units
2
1
Voltage (AC)
450
600
Removal passes
3
3
Habitat
Mean width (m)
6.7
3.6
Maximum depth (cm)
100
70
Canopy cover (%)
N/M
N/M
Aquatic vegetation
scarce
scarce
Estimated % of site in pools
64
48
Estimated % of site in riffles
36
52
Habitat assessment score
160 (optimal)
164 (optimal)
Substrate Composition
Pool (%) Riffle (%)
Pool (%) Riffle (%)
Silt
5 0 5 0
Sand
10 5 10 5
Gravel
20 15 25 35
Rubble
30 35 30 40
Boulder
20 40 25 20
Bedrock
15 5 5 0
Water Quality
Flow (cfs; visual)
4.9; Normal
2.0; Normal
Temperature (C)
15.8
15.9
pH
6.9
7.0
Conductivity (μS/cm)
20
11.2
Dissolved oxygen (mg/L)
N/M
N/M
Alkalinity (mg/L CaCO3)
15
N/M

41
Table 2-13. Fish population abundance estimates (with 95% confidence limits) for the monitoring
stations on Rocky Fork sampled 21 September 2017.
Population Size
Est. Mean
Biomass (kg/ha)
Density (fish/ha)
Total
Lower Upper
Weight Fish
Lower Upper
Lower Upper
Species Catch Est. C.L. C.L. (g) Wt. (g) Est. C.L. C.L. Est. C.L. C.L.
Station 1
RBT ≤90 mm
19
25 5 44
110 4.6
1.26 0.26 2.32
287 57 505
RBT >90 mm
105
106 102 110
2,429 22.9
27.89 26.82 28.92
1,217 1,171 1,263
BKT >90 mm
1
1 1 1
6 5.6
0.06 0.06 0.06
11 11 11
Longnose Dace
2
2 2 2
51 13.5
0.59 0.59 0.59
23 23 23
Blacknose Dace
128
200 121 279
667 3.3
7.66 4.58 10.57
2,296 1,389 3,203
Mottled Sculpin
93
161 66 256
1,135 7.1
13.03 5.38 20.87
1,848 758 2,939
Totals 348 495 294 689 4,398 52.23 37.05 62.68 5,683 4,629 5,758
Station 2
RBT ≤90 mm
6
6 6 6
34 5.7
0.94 0.95 0.95
167 167 167
RBT >90 mm
24
24 22 26
734 30.6
20.39 18.70 22.10
667 611 722
BKT ≤90 mm
7
7 4 10
30 4.3
0.83 0.48 1.19
194 111 278
BKT >90 mm
27
27 26 28
661 24.5
18.36 17.69 19.06
750 722 778
Totals 64 64 58 70 1,459 40.53 37.82 43.30 1,778 1,611 2,845
Note: RBT = Rainbow Trout and BKT = Brook Trout.

42
Rocky Fork
Figure 2-11. Trout abundance estimates for Rocky Fork monitoring stations RBT = Rainbow Trout and BKT =
Brook Trout. Bars indicated upper 95% confidence limits (total).
0
1000
2000
3000
4000
5000
6000
7000
8000
'91'92'93'94'95'96'97'98'99'00'01'02'03'04'05'06'07'08'09'10'11'12'13'14'15'16'17
Fis
h/h
a
Year
BKT ≤90 mm
BKT >90 mm
RBT ≤90 mm
RBT >90 mm
0
1000
2000
3000
4000
5000
6000
7000
8000
'91'92'93'94'95'96'97'98'99'00'01'02'03'04'05'06'07'08'09'10'11'12'13'14'15'16'17
Fis
h/h
a
Year
RBT ≤90 mm
RBT >90 mm
0
20
40
60
80
100
120
'91'92'93'94'95'96'97'98'99'00'01'02'03'04'05'06'07'08'09'10'11'12'13'14'15'16'17
kg
/ha
Year
BKT ≤90 mm
BKT >90 mm
RBT ≤90 mm
RBT >90 mm
0
20
40
60
80
100
120
'91'92'93'94'95'96'97'98'99'00'01'02'03'04'05'06'07'08'09'10'11'12'13'14'15'16'17k
g/h
a
Year
RBT ≤90 mm
RBT >90 mm
Station 1
Station 2
Biomass Density
Mean = 2,331 fish/ha
Mean = 2,487 fish/ha
Mean = 41.2 kg/ha
Mean = 44.8 kg/ha
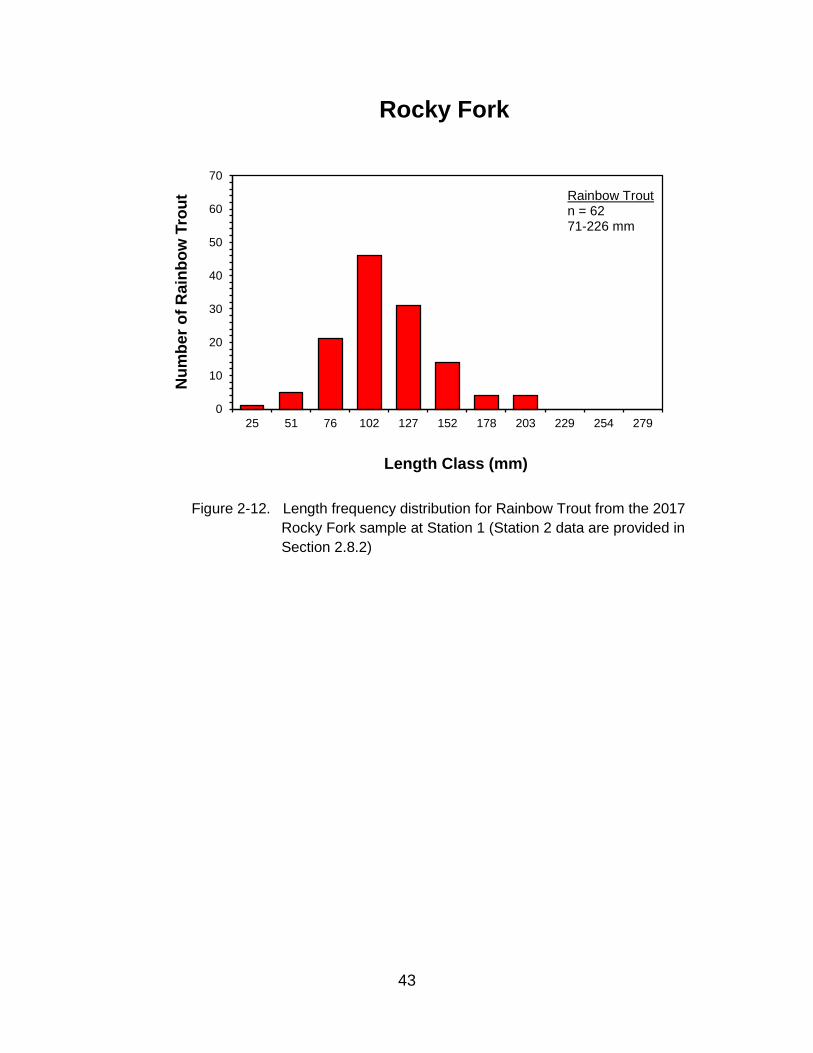
43
Rocky Fork
Figure 2-12. Length frequency distribution for Rainbow Trout from the 2017
Rocky Fork sample at Station 1 (Station 2 data are provided in
Section 2.8.2)
0
10
20
30
40
50
60
70
25 51 76 102 127 152 178 203 229 254 279
Nu
mb
er
of
Ra
inb
ow
Tro
ut
Length Class (mm)
Rainbow Trout n = 62 71-226 mm

44
2.8 SYMPATRIC BROOK/TRAINBOW TROUT MONIORING STREAMS
Four streams (upper Rocky Fork, Briar Creek, Birch Branch, and Gentry Creek) are
currently being monitored annually with the objective of documenting how (or if) Rainbow Trout
eventually replace Brook Trout in areas where the two species occur sympatrically. Briar and
Rocky Fork were sampled again in 2017 to continue tracking changes and trends in the relative
abundance of each species over time. Gentry Creek and Birch Branch (typically sampled
during June and July) were not sampled in 2017 because of extensive Brook Trout DNA
sampling efforts during that time frame.
2.8.1 Briar Creek
Study Area
Briar Creek is a Nolichucky River tributary in Washington County that flows from Buffalo
Mountain through a forested watershed located within the CNF. It contains 4.7 km of native
Brook Trout water beginning at an elevation of about 657 m (2,140'). Rainbow Trout are
present throughout the stream to its confluence with Dry Creek. Brook Trout were re-introduced
to Briar Creek in 1983 and the existing Rainbow Trout population was thinned in the 1.37-km
introduction zone during 1983-1986 (Nagel 1986). A total of 114 native Brook Trout (mixed
ages) were translocated from East Fork Beaverdam Creek, George Creek, and Tiger Creek
during 1983-1984 (Nagel 1986). A reproducing Brook Trout population became established in
the introduction zone by 1986, and then expanded into areas from which no Rainbow Trout
were removed (Nagel 1991). Currently, Brook Trout inhabit 4.7 km of Briar Creek, all of which
remains sympatric with Rainbow Trout. DNA samples were obtained from 30 fish in 2016 to
confirm their genetic identity and obtain other population genetics information (Section 2.4);
results are pending. Briar Creek is currently subject to general, statewide trout angling
regulations.
A station at 662 m (2,170') elevation was quantitatively sampled in 1992 to check the
Brook Trout population status in the original introduction zone (Strange and Habera 1993). This
site contained 27% Brook Trout, but several were removed for genetic analyses (Kriegler et al.
1995). Therefore, a new site was established at 671 m (2,200') and annual monitoring began in
1995 (Strange and Habera 1996). Site location and effort details, along with habitat and water
quality information are summarized in Table 2-14.
Results and Discussion
Catch data and abundance estimates for trout and all other species sampled at the Briar
Creek station in 2017 are given in Table 2-15. Briar Creek has been impacted by droughts
since 1998, resulting in August flows typically well below 1 cfs. Only six fish (two Brook Trout)
were captured in 2010 (Habera et al. 2011), but better flow conditions by 2014 and 2015 led to a
substantial increase in trout abundance (>100 fish) with numerous age-0 fish of both species
(Habera et al. 2015a and 2016). However, trout numbers were reduced by extremely dry
conditions and low stream flows again in 2016 and declined further in 2017 (Figure 2-13). Only
eight Brook Trout (all age-0) were captured this year.
45
Total trout biomass at the Briar Creek monitoring station generally declined from the late
1990s through 2013 in conjunction with the previously-mentioned droughts during that time
(Figure 2-14). Following the improvement to 32 kg/ha in 2014, biomass has consistently
declined again to 10 kg/ha in 2017 (Figure 2-14).
Brook Trout relative biomass (compared to Rainbow Trout) generally increased at the
Briar Creek monitoring station during 1997-2002, exceeding 50% during the drought years of
1998-2002 (Figure 2-14). However, it has generally declined since then, falling to 12% in 2010
and 10% in 2017 (Figure 2-14). Given its persistence over the past three decades, this Brook
Trout population is obviously resilient and has been capable of withstanding a combination of
environmental and competitive challenges.
Management Recommendations
Upper Briar Creek typically supports a good wild trout fishery featuring Brook Trout
except when reduced by droughts. Fortunately, wild trout populations (particularly Brook Trout
in Briar Creek) tend to be resilient and this fishery will likely recover from recent drought-related
impacts. Annual sampling at the monitoring station should continue in order to learn more about
Brook Trout and Rainbow Trout populations under sympatric conditions, particularly their
responses to abiotic events (droughts and floods). No efforts to remove Rainbow Trout or
enhance Brook Trout should occur in upper Briar Creek while this monitoring is underway so
that only natural processes can be studied.
The culvert at the upper road crossing (FR 188; above the monitoring station), which had
a perched downstream lip, was recently replaced by the USFS and TU with a new structure that
will improve connectivity with the upstream Brook Trout population upstream, which is more
abundant than downstream. A temperature logger may also be deployed for long term water
temperature monitoring, particularly summer months.

46
Table 2-14. Site and sampling information for Briar Creek in 2017.
Location
Station 1
Site code
420172601
Sample date
3 August
Watershed
Nolichucky River
County
Washington
Quadrangle
Erwin 199 NW Lat-Long
36.22825 N, -82.38883 W
Reach number
06010108 Elevation (ft)
2,200
Stream order
3 Land ownership
USFS
Fishing access
Good Description
This site is located along the adjacent road (USFS 188). The lower end is marked
Effort
Station length (m)
145
Sample area (m²)
450
Personnel
2
Electrofishing units
1
Voltage (AC)
400
Removal passes
3
Habitat
Mean width (m)
3.1
Maximum depth (cm)
84
Canopy cover (%)
85
Aquatic vegetation
scarce
Estimated % of site in pools
45 Estimated % of site in riffles
55
Habitat assessment score
151 (suboptimal)
Substrate Composition
Pool (%) Riffle (%)
Silt
0 0 Sand
15 5
Gravel
40 35 Rubble
30 45
Boulder
10 15 Bedrock
5 0
Water Quality
Flow (cfs; visual)
NM; low
Temperature (C)
17.7
pH
6.9
Conductivity (μS/cm)
27
Dissolved oxygen (mg/L)
NM
Alkalinity (mg/L CaCO3)
NM

47
Table 2-15. Fish population abundance estimates (with 95% confidence limits) for the monitoring station on Briar Creek sampled 3 August 2017.
Population Size
Est. Mean
Biomass (kg/ha)
Density (fish/ha)
Total
Lower Upper
Weight Fish
Lower Upper
Lower Upper
Species Catch Est. C.L. C.L. (g) Wt. (g) Est. C.L. C.L. Est. C.L. C.L.
RBT ≤90 mm 8
8 5 11
26 3.2
0.58 0.36 0.78
178 111 244
RBT >90 mm 11
11 9 13
366 33.3
8.13 6.66 9.62
244 200 289
BKT ≤90 mm 7
7 5 9
36 5.1
0.80 0.57 1.02
156 111 200
BKT >90 mm 1
1 1 1
7 7.3
0.16 0.16 0.16
22 22 22
Blacknose Dace 228
235 227 243
538 2.3
11.96 11.60 12.42
5,222 5,044 5,400
Totals 255 262 247 277 973 21.62 19.35 24.00 5,822 5,489 6,156
Note: RBT = Rainbow Trout and BKT = Brook Trout.

48
Briar Creek
Figure 2-13. Length frequency distribution for Rainbow Trout and Brook Trout from the
2017 Briar Creek sample.
Figure 2-14. Total biomass and relative Brook Trout abundance at the Briar Creek
monitoring station. Bars indicate upper 95% confidence limits.
0
5
10
15
20
25
25 51 76 102 127 152 178 203 229 254 279 305
Nu
mb
er
of
Fis
h
Length Class (mm)
Rainbow
Brook
Rainbow Trout n = 19 65-203 mm Brook Trout n = 8 73-91 mm
0
20
40
60
80
100
120
140
160
180
200
220
240
0
10
20
30
40
50
60
70
80
90
100
'95 '96 '97 '98 '99 '00 '01 '02 '03 '04 '05 '06 '07 '08 '09 '10 '11 '12 '13 '14 '15 '16 '17
To
tal tr
ou
t b
iom
as
s (
kg
/ha)
Bro
ok t
rou
t re
lati
ve
ab
un
dan
ce
(%
)
Year
Total biomass
% BKT (density)
% BKT (biomass)
Drought
Drought
49
2.8.2 Rocky Fork
Study Area
Rocky Fork is part of the general long-term wild trout monitoring program and was
described in Section 2.7. The upper portion of Rocky is primarily in Greene County and
contains 3.2 km of Brook Trout water beginning at approximately 914m (3,000 ft) elevation
(Strange and Habera 1997). Sample site location and effort details along with habitat and water
quality information were previously provided in Section 2.7.
Results and Discussion
Catch and abundance estimates for trout sampled at Station 2 on Rocky Fork in 2017
are given in Table 2-13 (Section 2.7). Total trout biomass remained relatively unchanged from
2016 (Figure 2-11; Section 2.7), there was a shift in favor of Rainbow Trout, causing Brook
Trout relative biomass to fall below 50% (Figure 2-16). Brook Trout relative density, however
remained above 50% in 2017 (Figure 2-16).
Population size structures indicated relatively weak 2017 cohorts (Figure 2-15).
Rainbow Trout are typically more abundant than Brook Trout in the larger size classes (≥178
mm), but this was not the case at Station 2 in 2016 or 2017 (Figure 2-16). Nagel and Deaton
(1989) questioned the size advantage Rainbow Trout were thought to hold over Brook Trout in
Rocky Fork’s headwaters (Whitworth and Strange 1983) and elsewhere. However, monitoring
data from Rocky Fork and other streams have generally verified the tendency of Rainbow Trout
to grow larger than Brook Trout in a variety of sympatric situations. This advantage may be lost
at times during droughts such as in 2008, (Habera et al. 2009a), 2015, and 2016, when survival
and recruitment appear to be impacted more for Rainbow Trout than for Brook Trout.
Brook Trout relative abundance (biomass) was quite stable at about 40% from 1991
through 1993, but declined rapidly after the flood in early 1994 (Figure 2-26) and associated
Brook Trout year-class failure (Strange and Habera 1995). Brook Trout relative abundance
recovered to the pre-flood level in 1996, then surpassed 50% in 2000 and 60% in 2001 (Figure
2-16) during the dry years of 1998-2002 (Habera et al. 2003). Brook Trout relative abundance
(biomass) generally increased again with the next drought, surpassing 60% in 2015 and 2016
(Figure 2-16). In fact, Brook Trout relative abundance (biomass) in 2015 and 2016 was the
highest observed during the 26 years this station has been monitored. Consequently, it is
clearly evident in Rocky Fork (and elsewhere) that Brook Trout can exist—and even thrive—in
sympatry with Rainbow Trout for long periods of time. Brook Trout appear to be favored during
droughts in the sense that competitive pressure is reduced as Rainbow Trout are more
markedly impacted. However, cumulative drought effects on recruitment may reach a level
where the abundance of both species is reduced to the point that relative abundance
percentages have little meaning. This occurred in Briar Creek in 2009-2011 (Section 2.8.1),
Rocky Fork in 2010, and Birch Branch in 2008-2010.

50
Management Recommendations
Upper Rocky Fork continues to provide an example of the resiliency of wild trout
populations (particularly Brook Trout) in southern Appalachian streams. Despite large
reductions in abundance related to droughts and floods, the Brook Trout population has
demonstrated the ability to recover, even in the presence of Rainbow Trout. Future
management should protect and emphasize this important fishery. Annual monitoring should
continue at Station 2 to further develop our understanding of sympatric Brook and Rainbow
Trout interactions and assess the ability of Rainbow Trout to replace Brook Trout over time. It is
recommended that no efforts to removed Rainbow Trout or enhance Brook trout be initiated in
upper Rocky Fork while this monitoring is underway so that only natural processes can be
studied. Temperature loggers may be placed in the stream to monitor water temperatures
during the summer months.
Upper Rocky Fork (Station 2).

51
Rocky Fork
Figure 2-15. Length frequency distributions for Brook and Rainbow Trout from the 2017
sample at the upper monitoring station (2) on Rocky Fork.
Figure 2-16. Total biomass and relative Brook Trout abundance at the upper monitoring
station (2) on Rocky Fork. Bars indicate upper 95% confidence limits.
0
20
40
60
80
100
120
140
160
180
200
220
240
0
10
20
30
40
50
60
70
80
90
100
'91 '92 '93 '94 '95 '96 '97 '98 '99 '00 '01 '02 '03 '04 '05 '06 '07 '08 '09 '10 '11 '12 '13 '14 '15 '16 '17
To
tal tr
ou
t b
iom
as
s (
kg
/ha)
Bro
ok
Tro
ut
Re
lati
ve
Ab
un
da
nc
e (
%)
Year
Total biomass
% BKT (density)
% BKT (biomass)
Drought
Drought
0
5
10
15
20
25
25 51 76 102 127 152 178 203 229 254 279
Nu
mb
er
of
Fis
h
Length Class (mm)
Rainbow
Brook
Brook Trout n = 34 73-189 mm Rainbow Trout n = 30 77-178 mm

52
2.3.3 Summary
Appalachian streams historically had Brook Trout, however in the 1900s Rainbow Trout
were stocked throughout many of the streams and Brook Trout have become extirpated from
many streams for various reasons. Currently, four streams with both wild Brook Trout and wild
Rainbow Trout are being monitored long term with the objective of documenting how (or if)
Rainbow Trout replace Brook Trout.
Clark and Rose (1997) recognized conventional theory—a niche shift induced by the
presence of a superior competitor—did not explain replacement of Brook Trout by Rainbow
Trout. Their modeling emphasized the importance of year-class failures (e.g., those caused by
floods), but predicted that Rainbow Trout would not replace Brook Trout if such failures occurred
infrequently (intervals of 10-20 years). Even with much more frequent year-class failures (3-
year intervals), it still required 80 years for a simulated Brook Trout population to be eliminated.
Simulated year-class failures included both species, even though typical late-winter/early-spring
floods could impact year-class strength of Brook Trout (fall spawners) much more severely than
Rainbow Trout (Strange and Habera 1995, 1996; Warren et al. 2009). Additionally, these and
subsequent (Clark et al. 2001) model simulations did not include droughts, which can be
frequent and are clearly more detrimental to Rainbow Trout survival and recruitment in
sympatric Tennessee populations. However, both floods and droughts would be expected to
occur over several decades and their effects on relative abundance can be offsetting.
Many studies observed long-term density fluctuations of native and introduced trout, but
not total elimination of the native trout (Larson et al. 1995; Adams et al. 2002). However, larger
and longer-lived Brown Trout have been shown to limit Brook Trout growth, recruitment, and
abundance (Hoxmeier and Dieterman 2013; 2016) or essentially replace them (Waters 1999) in
Minnesota streams. Complete replacement of Brook Trout by Rainbow Trout in Tennessee
streams might be possible only through unusual circumstances, such as a succession of late
winter/early spring floods or drought that severely weaken or eliminate multiple Brook Trout year
classes. Conversely, data from all four monitoring streams indicate that droughts (particularly
1998-2002 and 2006-2008, where the drought periods were less severe during fall and early
spring) can offset Brook Trout declines related to previous floods by reducing Rainbow Trout
relative abundance. Extended drought, however, may eliminate Brook Trout populations in
marginal habitats regardless of the presence of any sympatric salmonids (Habera et al. 2014a).
Moreover, timing of the drought may affect species differently; similar to how late-winter/early-
spring floods could impact year-class strength of Brook Trout more so than Rainbow Trout. For
example if the drought occurs during the fall into the spring compared to in the summer, this
may impact the trout differently.
Although Brook Trout relative abundance has fluctuated over the years at the monitoring
stations, it appears that Rainbow Trout have no particular competitive advantage, thus these
species can coexist for many years at some general equilibrium. Strange and Habera (1998)
and Habera et al. (2001a; 2014a) found no broad-scale loss of distribution or inexorable

53
replacement by Rainbow Trout in sympatric populations. Furthermore, Brook Trout have gained
distribution (2 km or more in some cases) in the presence of Rainbow Trout in several streams
since the 1990s (Habera et al. 2014a; Section 2.10). Additional monitoring data will be useful
for identifying any conditions that may eventually enable Rainbow Trout to eliminate brook trout.
These could include landscape alterations (Hudy et al. 2008; Stranko et al. 2008) and climate
change (Trumbo et al. 2010; Myers et al. 2014; DeWeber and Wagner 2015). Interestingly,
Trumbo et al. (2010) found that their direct measurement of paired air and water temperatures
in Virginia identified more Brook Trout watersheds that would be resistant to predicted air
temperature increases—and with potential refugia existing at lower elevations—than predicted
by previous modelling. Additionally, Stitt et al. (2014) found that among Brook Trout strains,
thermal tolerance was highest for the one with the most southern ancestry. Verhille et al. (2016)
observed the same characteristic for wild Rainbow Trout at the southern limit of distribution
within their native range. This would potentially provide Brook Trout additional flexibility for
adjusting to changing climatic conditions and some resistance to replacement by Rainbow Trout
in thermally stressed environments. In mainstem habitats, competition for thermal refugia,
rather than food, is likely more important for Brook Trout and would be heightened under current
climate change scenarios, especially in the presence of exotic salmonids (Huntsman and Petty
2014). To monitor these changes and help explain fluctuations in Brook and Rainbow Trout
abundances, temperature monitoring loggers will be placed in these streams.

54
2.9 COMPLETION OF BROOK TROUT DNA SAMPLING
The 42 Brook Trout populations remaining to be sampled as part of the effort to upgrade
existing genetics information (Habera et al. 2017) were visited during May-July 2017. The Little
Stony Creek population, which is the focus of an ongoing restoration project, was included.
Brook Trout were not relocated
in two streams during 2017
(Bitter End Branch and Vaught
Creek; Table 2-16), although
both had populations during the
most recent distribution survey.
Target sample size for each
population was 30 fish
representing as much of the
existing distribution as possible.
A single pelvic fin clip was taken
from each fish and stored in
95% ethanol. Age-0 fish were
avoided if possible, as was the
collection of more than one fish
per pool (to avoid siblings).
Overall, DNA samples were
obtained from 1,081 fish
representing 40 populations,
with sample sizes ranging from
6-39 and averaging 27 (24
samples included ≥30 fish;
Table 2-16). Mean length of the
collection zone in each stream
was 790 m and samples were
collected upstream of major
waterfalls where present.
Streams with relatively short
distributions and low
abundances produced the
smaller samples sizes (≤15),
although in these cases a high
percentage of the existing
population was sampled.
Sampling in 2017 focused on
streams in the Watauga and South Fork Holston basins and with completion of those efforts,
DNA samples from all 109 known Brook Trout populations in Tennessee (outside GSMNP) have
now been obtained. These samples are being analyzed using microsatellite DNA at the U.S.
Collecting a Brook Trout DNA sample (fin clip) during 2017 (C. Chapman, UT
TWRA intern assisting).
A set of Brook Trout DNA samples from Hoot Owl Hollow (Johnson Co.)
obtained during 2017
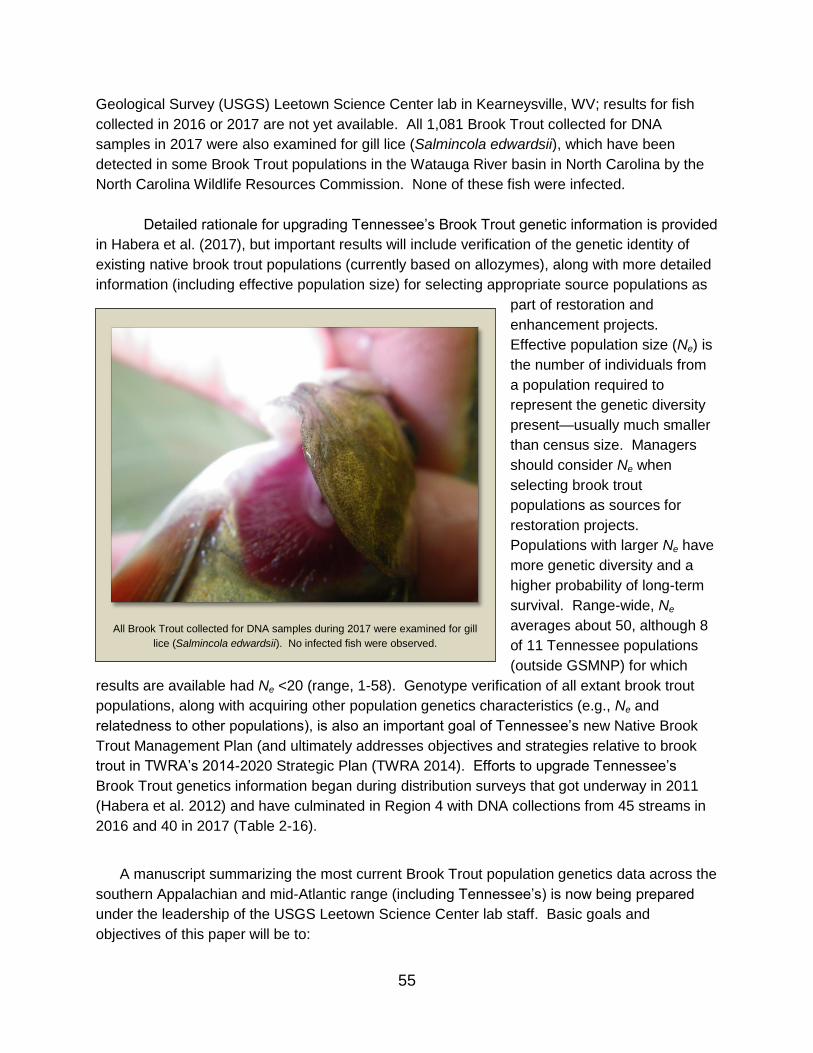
55
Geological Survey (USGS) Leetown Science Center lab in Kearneysville, WV; results for fish
collected in 2016 or 2017 are not yet available. All 1,081 Brook Trout collected for DNA
samples in 2017 were also examined for gill lice (Salmincola edwardsii), which have been
detected in some Brook Trout populations in the Watauga River basin in North Carolina by the
North Carolina Wildlife Resources Commission. None of these fish were infected.
Detailed rationale for upgrading Tennessee’s Brook Trout genetic information is provided
in Habera et al. (2017), but important results will include verification of the genetic identity of
existing native brook trout populations (currently based on allozymes), along with more detailed
information (including effective population size) for selecting appropriate source populations as
part of restoration and
enhancement projects.
Effective population size (Ne) is
the number of individuals from
a population required to
represent the genetic diversity
present—usually much smaller
than census size. Managers
should consider Ne when
selecting brook trout
populations as sources for
restoration projects.
Populations with larger Ne have
more genetic diversity and a
higher probability of long-term
survival. Range-wide, Ne
averages about 50, although 8
of 11 Tennessee populations
(outside GSMNP) for which
results are available had Ne <20 (range, 1-58). Genotype verification of all extant brook trout
populations, along with acquiring other population genetics characteristics (e.g., Ne and
relatedness to other populations), is also an important goal of Tennessee’s new Native Brook
Trout Management Plan (and ultimately addresses objectives and strategies relative to brook
trout in TWRA’s 2014-2020 Strategic Plan (TWRA 2014). Efforts to upgrade Tennessee’s
Brook Trout genetics information began during distribution surveys that got underway in 2011
(Habera et al. 2012) and have culminated in Region 4 with DNA collections from 45 streams in
2016 and 40 in 2017 (Table 2-16).
A manuscript summarizing the most current Brook Trout population genetics data across the
southern Appalachian and mid-Atlantic range (including Tennessee’s) is now being prepared
under the leadership of the USGS Leetown Science Center lab staff. Basic goals and
objectives of this paper will be to:
All Brook Trout collected for DNA samples during 2017 were examined for gill
lice (Salmincola edwardsii). No infected fish were observed.

56
1. Describe baseline genetic attributes of Brook Trout populations across the southern
portion of their distribution and compare/contrast differences:
i. in genetic diversity within and genetic differentiation among drainages,
ii. relative to population size, spatial distance, drainage,
iii. related to stocked and unstocked populations,
iv. in population segments with/without movement barriers,
v. between genetic attributes of populations found north and south of New
River watershed, VA/NC.
2. Describe the evolutionary relationships among brook trout populations at the population
and phylogeographic scale across their range.
3. Identify patterns in most recent common ancestry within/among streams, drainages, and
regions.
4. Determine if there is evidence of effective genetic migration of populations within/among
watershed(s) (i.e., panmictic populations vs. isolated gene flow vs. isolated fragmented
populations).
5. Assess genetic signature and degree of introgression within/among hybrid populations
exposed to single vs. repeated stocking of hatchery Brook Trout.
6. Determine if repeated removals of Brook Trout from source streams for translocation to
restored stream segments has caused significant declines in genetic metrics.
7. Define management units based upon genetic metrics and hydrological patterns.
The SDAFS Trout Committee will then use this information to update their position statement on
managing southern Appalachian Brook Trout (Habera and Moore 2005). Consequently, Brook
Trout conservation and management strategies throughout the region can be refined,
particularly with respect to Brook Trout restoration and enhancement projects.

57
Table 2-16. Brook Trout streams from which DNA samples were collected during 2017 (May-July).
Sample collection zone
Stream County Basin Date Samples Lower Lat.
Lower Long.
Upper Lat.
Upper Long.
Distance (km)
Leonard Branch Carter Watauga 6/6/2017 30 36.24119 -82.08323 36.23901 -82.08949 0.68
Wagner Branch Carter Watauga 6/13/2017 30 36.23970 -82.07484 36.24849 -82.06406 1.79
Moreland Branch Carter Watauga 6/13/2017 30 36.23644 -82.07496 36.23342 -82.08083 0.76
White Rocks Br. Carter Watauga 6/6/2017 6 36.23098 -82.06922 36.23042 -82.06796 0.15
Camp 15 Br. Carter Watauga 6/5/2017 30 36.22549 -82.05173 36.22268 -82.05424 0.52
Bitter End Branch Carter Watauga 6/5/23017 No BKT -- -- -- -- 0.30
Hays Branch Carter Watauga 6/8/2017 10 36.23038 -82.03356 36.23271 -82.03128 0.31
Tiger Creek Carter Watauga 5/25/2017 27 36.16359 -82.17514 36.15891 -82.16537 1.07
Roberts Hollow Carter Watauga 6/1/2017 30 36.17002 -82.18287 36.16822 -82.18900 0.64
Bill Creek Carter Watauga 5/30/2017 30 36.16372 -82.17506 36.16264 -82.18120 0.71
Fall Branch Carter Watauga 5/25/2017 30 36.16176 -82.17293 36.15491 -82.17432 0.83
Ruins Branch Carter Watauga 5/30/2017 23 36.16172 -82.17129 36.15887 -82.16875 0.45
Roaring Ck. (upper) Carter Watauga 6/1/2017 15 36.16695 -82.14892 36.16688 -82.15508 0.90
No-Name (Andy) Ck. Carter Watauga 6/1/2017 21 36.17496 -82.14414 36.18403 -82.14591 1.19
Heaton Creek Carter Watauga 5/23/2017 27 36.12862 -82.06953 36.12301 -82.07053 0.67
Middle Branch Carter Watauga 5/22/2017 30 36.12972 -82.09474 36.11996 -82.09113 1.16
Panther Branch Carter Watauga 5/18/2017 25 36.14285 -82.11887 36.14667 -82.12042 0.47
Cove Creek Carter Watauga 5/18/2017 36 36.13248 -82.11659 36.12646 -82.12317 0.92
Little Cove Creek Carter Watauga 5/22/2017 30 36.13520 -82.11473 36.12851 -82.11168 0.85
Little Laurel Branch Carter Watauga 6/14/2017 39 36.25685 -81.99355 36.24612 -82.00161 1.58
Morgan Branch Carter Watauga 6/15/2017 27 36.24522 -82.00146 36.24220 -82.00628 0.66
Little Stony Ck. (lake trib.) Carter Watauga 7/6 & 8/16/17 32 36.29180 -82.06680 36.28348 -82.06850 1.11
Roan Creek Johnson Watauga 6/21/2017 30 36.34523 -81.72935 36.34473 -81.72278 0.63
Mill Creek Johnson Watauga 6/21/2017 12 36.35771 -81.86082 36.35503 -81.85915 0.39
Vaught Creek Johnson Watauga 6/19/2017 No BKT -- -- -- -- 0.33
Furnace Creek Johnson Watauga 6/19/2017 30 36.37790 -81.81341 36.37014 -81.80441 1.21
Corn Creek Johnson Watauga 6/26/2017 28 36.49638 -81.85843 36.50089 -81.85929 0.53
Cress Branch Johnson Watauga 6/26/2017 22 36.49622 -81.85836 36.49702 -81.86202 0.34
Steve Phillippi Br. Johnson Watauga 6/26/2017 17 36.49853 -81.84345 36.50314 -81.84737 0.65
Forge Creek Johnson Watauga 6/27/2017 31 36.50080 -81.70377 36.50957 -81.70281 1.06
Tank Hollow Johnson S. Fork Holston 6/28/2017 30 36.58361 -81.82011 36.57914 -81.81309 0.82
Chalk Branch Johnson S. Fork Holston 6/29/2017 30 36.58146 -81.83353 36.57426 -81.82413 1.17
Maple Branch Johnson S. Fork Holston 6/29/2017 30 36.57946 -81.83662 36.59338 -81.83544 0.71
Fagall Branch Johnson S. Fork Holston 7/18/2017 31 36.57096 -81.85557 36.56033 -81.85629 1.44
Parks Branch Johnson S. Fork Holston 7/19/2017 27 36.54977 -81.87799 36.53899 -81.86947 1.49
Johnson Blevins Br. Johnson S. Fork Holston 7/19/2017 27 36.53017 -81.89432 36.52722 -81.88926 0.64
Jim Wright Branch Johnson S. Fork Holston 7/20/2017 31 36.50219 -81.91977 36.50024 -81.91499 0.58
E. F. Beaverdam Ck. Johnson S. Fork Holston 7/18/2017 31 36.49242 -81.92599 36.49010 -81.92170 0.55
W. F. Beaverdam Ck. Johnson S. Fork Holston 7/20/2017 23 36.49430 -81.94041 36.48877 -81.94367 0.73
Valley Creek Johnson S. Fork Holston 6/28/2017 30 36.61056 -81.68159 36.60626 -81.68311 0.56
Hoot Owl Hollow Johnson S. Fork Holston 6/27/2017 33 36.53867 -81.79425 36.54720 -81.80154 1.20
Rockhouse Run Sullivan S. Fork Holston 7/21/2017 30 36.60291 -81.89132 36.59964 -81.88749 0.57

58
2.10 LITTLE JACOB CREEK BROOK TROUT ENHANCEMENT
Native Brook Trout were reintroduced to Little Jacob Creek—a South Holston Lake
tributary on the CNF in Sullivan Co.(Figure 2-17)—in September 2000 by translocating 180 fish
from Fagall Branch, Heaberlin Branch, and East Fork Beaverdam Creek (Habera et al. 2001b).
All three source populations are Beaverdam Creek tributaries in the South Fork Holston River
watershed. Brook Trout were released into the 970-m stream reach between 756 m and 817 m
elevation (see Brook Trout introduction zone Figure 2-17) without removing the existing wild
Rainbow Trout population in this area (2,735 fish/ha; 31 kg/ha). Successful Brook Trout
reproduction was verified in
August 2001 (22 age-0 fish
collected) and again in August
2003. The 2003 survey
produced 24 Brook Trout
(including 12 age-0 fish) within
the introduction zone, as well as
six age-0 Brook Trout further
downstream, thus Brook Trout
were considered successfully
established in Little Jacob Creek
at that time (Habera et al. 2004).
Brook Trout were present
throughout the introduction zone
in November 2010, with 17 adults and 43 age-0 fish collected at five qualitative sample points.
A cascade series (see photo) at 689 m (2,260’) was also located in 2011 that could serve as a
Rainbow Trout barrier and permit conversion of the 1.6-km reach upstream to allopatric native
Brook Trout. Brook Trout distribution had gained ~260 m by July 2011, extending down to 730
m (2,390’), or just below the rock house (Figure 2-18). Total Brook Trout distribution in Little
Jacob Creek in 2011 was 1.2 km, although most of it was shared with Rainbow Trout.
Extremely low stream flows in 2016 and 2017 provided an excellent opportunity to
enhance the Little Jacob Creek Brook Trout population by extending it down to the cascade
barrier and removing sympatric Rainbow Trout (by electrofishing) throughout the 1.6 km area
upstream. About 400 Rainbow Trout were removed in 2016 and nearly 50 Brook Trout were
also observed. Two separate removals were conducted in 2017 (June and October). No age-0
Rainbow Trout were found from the cascade through the introduction zone during the June
effort, while 49 adult Rainbow Trout were removed from that area and 27 Brook Trout were
observed. Additionally, 122 Rainbow Trout were removed from the 300-m reach extending from
the cascade barrier down to the culvert at the USFS road (FR 4002) crossing. One Brook Trout
was also captured in that area. Three electrofishing passes in October 2017 removed 33 adult
and 4 age-0 Rainbow Trout from the culvert up to the cascade barrier. Only two adult Rainbow
Rainbow Trout were removed from 1.6 km of Little Jacob Creek upstream of
this series of cascades in 2016-2017.

59
Trout (no age-0) and 10 adult Brook Trout were found above the cascade barrier in a single
electrofishing pass up to the cave.
This year’s work suggests efforts to remove Rainbow Trout from the 1.6-km reach
above the cascade and transition that area to an allopatric Brook Trout population were
successful. Rainbow Trout reproduction there was eliminated following the 2016 effort and
remaining adult Rainbow Trout were removed in 2017. However, Brook Trout abundance
decreased in Little Jacob Creek in 2017, as it did in most other streams, likely as a result of the
severe drought in 2016. Additional Brook Trout from the original source streams (Fagall
Branch, Heaberlin Branch and East Fork Beaverdam Creek) should be collected in August or
September (pre-spawn) and translocated to supplement the existing population, particularly in
the lower section (cave to road crossing). An additional Rainbow Trout removal effort in reach
between the road crossing and the cascade barrier will be made in 2018, followed by periodic
monitoring to determine the effectiveness of the culvert as a barrier. Instream temperature
loggers will also be deployed within the next five years to monitor water temperatures during the
summer months.
The cave or “rockhouse” along Little Jacob Creek (elevation 735 m or 2,410’).

60
Figure 2-17. Map of Little Jacob Creek management area denoted by black rectangular box.
!( !(
Little Jacob Creek
Roads
South Holston Reservoir
!( Introduction zone
0 4 82 Miles

61
Figure 2-18. Distribution of Rainbow Trout (black line), Rainbow Trout and Brook Trout (dashed black and white line), and Brook Trout from pre-2000 to 2017 in Little Jacob Creek. Pre-2000 is before the Brook Trout were translocated into Little Jacob Creek. Stream (cascade) barrier is denoted by a white square. The cave or rock house, just below the introduction zone (stream area between white circles) is denoted by a gray triangle.
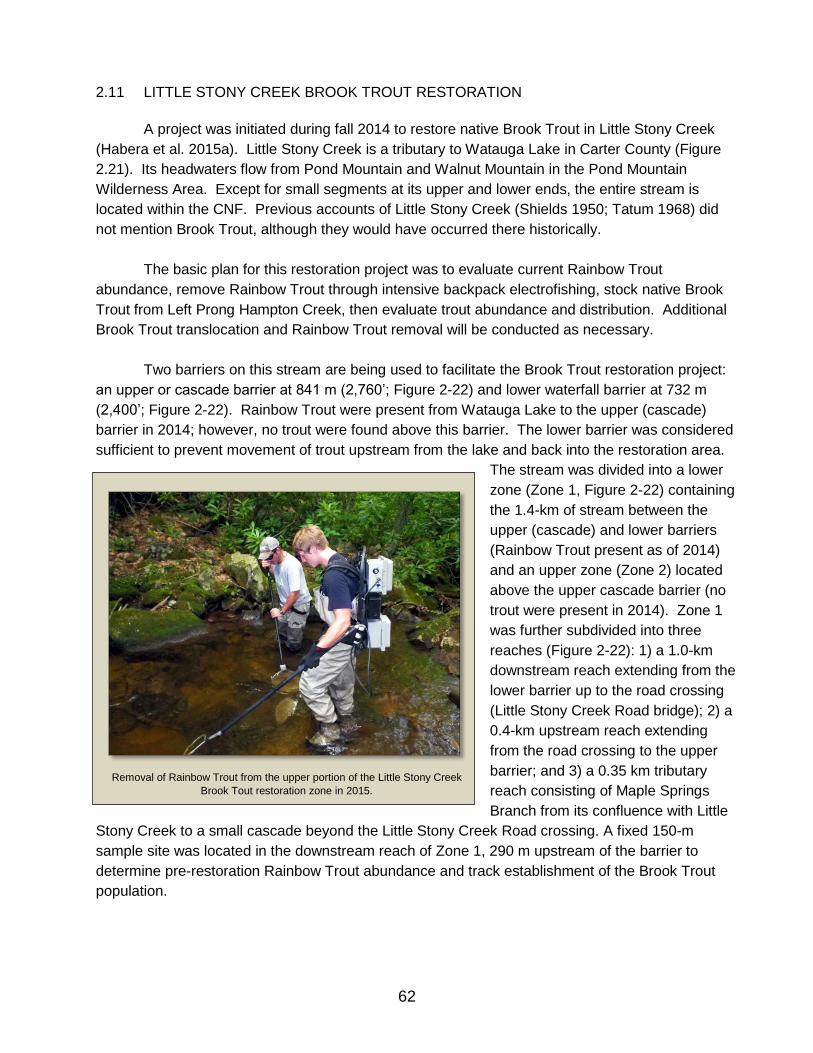
62
2.11 LITTLE STONY CREEK BROOK TROUT RESTORATION
A project was initiated during fall 2014 to restore native Brook Trout in Little Stony Creek
(Habera et al. 2015a). Little Stony Creek is a tributary to Watauga Lake in Carter County (Figure
2.21). Its headwaters flow from Pond Mountain and Walnut Mountain in the Pond Mountain
Wilderness Area. Except for small segments at its upper and lower ends, the entire stream is
located within the CNF. Previous accounts of Little Stony Creek (Shields 1950; Tatum 1968) did
not mention Brook Trout, although they would have occurred there historically.
The basic plan for this restoration project was to evaluate current Rainbow Trout
abundance, remove Rainbow Trout through intensive backpack electrofishing, stock native Brook
Trout from Left Prong Hampton Creek, then evaluate trout abundance and distribution. Additional
Brook Trout translocation and Rainbow Trout removal will be conducted as necessary.
Two barriers on this stream are being used to facilitate the Brook Trout restoration project:
an upper or cascade barrier at 841 m (2,760’; Figure 2-22) and lower waterfall barrier at 732 m
(2,400’; Figure 2-22). Rainbow Trout were present from Watauga Lake to the upper (cascade)
barrier in 2014; however, no trout were found above this barrier. The lower barrier was considered
sufficient to prevent movement of trout upstream from the lake and back into the restoration area.
The stream was divided into a lower
zone (Zone 1, Figure 2-22) containing
the 1.4-km of stream between the
upper (cascade) and lower barriers
(Rainbow Trout present as of 2014)
and an upper zone (Zone 2) located
above the upper cascade barrier (no
trout were present in 2014). Zone 1
was further subdivided into three
reaches (Figure 2-22): 1) a 1.0-km
downstream reach extending from the
lower barrier up to the road crossing
(Little Stony Creek Road bridge); 2) a
0.4-km upstream reach extending
from the road crossing to the upper
barrier; and 3) a 0.35 km tributary
reach consisting of Maple Springs
Branch from its confluence with Little
Stony Creek to a small cascade beyond the Little Stony Creek Road crossing. A fixed 150-m
sample site was located in the downstream reach of Zone 1, 290 m upstream of the barrier to
determine pre-restoration Rainbow Trout abundance and track establishment of the Brook Trout
population.
Removal of Rainbow Trout from the upper portion of the Little Stony Creek
Brook Tout restoration zone in 2015.

63
A three-pass depletion sample in September 2014 at the fixed site produced a Rainbow
Trout biomass estimate of 23 kg/ha—similar to the 27 kg/ha estimate for a site ~800 m
downstream of the lower barrier in 1993 (Strange and Habera 1994). Rainbow Trout were then
removed by three electrofishing efforts (using two units) throughout Zone 1 during September and
October 2014. Native Brook Trout propagated at the Tennessee Aquarium Conservation Institute
(TNACI) from adults collected from Left Prong Hampton Creek were then stocked into Zones 1 and
2. About 350 Brook Trout (mostly
fingerlings) were released into
Zone 1 in October 2014, January
2015, and April 2015. Another 150
fingerlings were stocked in Zone 2
in April 2015
Brook Trout survival was
evaluated in June 2015 and
another Rainbow Trout removal
effort was made. Only 27 Rainbow
Trout (all sub-adults and adults)
were captured in 2015, most of
which (n = 19) were in the
downstream reach, indicating the
effectiveness of the 2014 removal
efforts. Brook Trout survival was
good in the upstream reach, as 64
Brook Trout of varying sizes were collected. Brook Trout (n = 10) also colonized the tributary reach
for about 350 m (Figure 2-23) and two additional Rainbow Trout were removed there. A small
cascade near the end of Brook Trout colonization may limit further upstream movement in this
reach. In the future, some fish could be moved upstream of the small cascade to make additional
habitat available. Only 32 Brook Trout were captured in the downstream reach, although the initial
stocking density in this longer reach (1 km) was lower than the upper reach. Consequently, 80
surplus Brook Trout fingerlings produced at the TNACI were stocked in this reach in July 2015. No
evaluation of Zone 2 was conducted in 2015, nor was there any evaluation of the entire project
area in 2016.
Brook Trout survival, reproduction, and distribution were evaluated again in 2017 and
remaining Rainbow Trout were removed from Zones 1 and 2 in July and October using single pass
electrofishing. Only one adult Brook Trout was found in the fixed monitoring site in July, thus no
abundance estimate sample was conducted. Rainbow Trout were found only in the downstream
reach and, as in 2015, no age-0 Rainbow Trout were captured. Two electrofishing passes were
made in the downstream reach, with 10 adult Rainbow Trout removed during the July effort and 5
removed in October. This indicates that Rainbow Trout removal from Zone 1 is essentially
complete.
A native Brook Trout from the restored population in Little Stony Creek.

64
Overall, the number of Brook Trout collected in Zones 1 and 2 increased compared to the
2015 survey (Figure 2-19). However, Brook Trout density in the lower half of the downstream
reach of Zone 1 remains low and only one fish was captured in the 450-m reach above the lower
barrier. This may be due to original stocking densities or other factors, but additional Brook Trout
from Left Prong Hampton Creek will be necessary to complete establishment of the population in
the downstream reach, particularly the area downstream of the monitoring site.
An 870-m reach within Zone 2 (elevation 3170’ to 3090’) that extended upstream and
downstream of the original stocking location was surveyed in October 2017. Both adult and age-0
Brook Trout were captured throughout this area, indicating successful reproduction and
recruitment. Brook Trout distribution in Zone 2 should continue to expand through the remaining
0.7 km downstream until it connects with the population in Zone 1. No further stocking in Zone 2 is
anticipated at this time.
Given the low density of the Brook Trout population in the lower portion of the Little Stony
Creek restoration area, supplemental stocking will be necessary to complete the project in a timely
manner. Therefore, about 25 pairs of adult Brook Trout were collected from Left Prong Hampton
Creek in October 2017 to be spawned at TNACI. These fish and their progeny will be stocked in
Little Stony Creek in 2018 to help establish a Brook Trout population in the current low-density
reach. A check for any remaining Rainbow Trout in the lower half of the downstream reach of
Zone 1 should also be made in 2018, followed by quantitative sampling at the monitoring site in
2019 and periodically thereafter. Instream temperature loggers might also be deployed within the
next five years to monitor water temperatures, particularly during the summer months.

65
Figure 2-19. Number of Brook Trout caught at each location in 2015 and 2017.
Figure 2-20. Number of Rainbow Trout caught at each location in 2015 and 2017.
0
10
20
30
40
50
60
70
2015 2017 2015 2017 2015 2017 2015 2017
Downstream Tributary Upstream Zone 2
Nu
mb
er o
f Fi
sh
Year and Location
Adult
Sub-adult
YOY
0
2
4
6
8
10
12
14
16
18
20
2015 2017 2015 2017 2015 2017 2015 2017
Downstream Tributary Upstream Zone 2
Nu
mb
er o
f Fi
sh
Year and Location
Adult
Sub-adult
YOY

66
Figure 2-21. Location of Little Stony Creek in Eastern Tennessee.
Little Jacob Creek
Little Stony Creek

67
¯
Figure 2-22. Location of the Brook Trout restoration zones on Little Stony Creek.
Zone 1
Zone 2
Downstream
Tributary
Upstream
Road
Stream
" Barrier
0 0.5 10.25 Kilometers

68
Figure 2-23. Distribution of adult and young of year Rainbow and Brook trout in 2014 (pre-restoration), 2015 (post-stocking of Brook Trout) and 2017 (evaluation).
2017 Evaluation
2015 Post stocking
"
" "
"
" "
"
" "
"
" "
"
" "
¯0 1 20.5 Km
Young of Year
Adult
2014 Pre restoration
Rainbow Trout
Brook and Rainbow
Brook Trout
Stream
Road
" Barrier
"
" "

69
3. TAILWATER ACCOUNTS
Region IV’s tailwater trout fisheries present unique fishery management problems and
opportunities for which no standard solutions or practices apply (Hill 1978). The problems inherent
in sampling tailwaters, such as their large size, fluctuating flows, and the lack of any practical
means for maintaining closed populations, make it difficult at best to collect quantitative data from
these systems. Additionally, natural reproduction is typically insignificant, so most tailwater trout
populations are also largely hatchery-supported, with abundances and size/age-class densities
related to stocking rates. In two cases however (the South Holston and Wilbur tailwaters), natural
reproduction is substantial, requiring a different set of management strategies. Annual tailwater
monitoring in Region IV began in 1991 (Bivens et al. 1992), but the initial efforts (prior to 1999)
provided limited information. Consequently, TWRA sponsored more intensive studies focusing on
assessment of trout abundance, the fate of stocked fish, natural reproduction, movements, and
angler use in the Norris, South Holston, and Wilbur tailwaters (e.g., Bettoli and Bohm 1997; Bettoli
1999; Bettoli et al. 1999; Bettinger and Bettoli 2000; Bettoli 2002; Bettoli 2003a; Bettoli 2003b; Hutt
and Bettoli 2003; Meerbeek and Bettoli 2005; Bettoli 2006; Holbrook and Bettoli 2006; Bettoli 2007;
Damer and Bettoli 2008).
3.1 SAMPLING METHODS AND CONDITIONS
Sampling effort for the Norris, Cherokee, South Holston, and Wilbur tailwaters annually
consists of 600-s (pedal time) runs at each of 12 monitoring stations with boat-mounted
electrofishing systems (120 pulses/s DC, 4-5 amps). The smaller Ft. Patrick Henry and Boone
tailwaters are sampled using 900-s runs at 4 stations. Electrofishing on these tailwaters (except
Norris) is conducted during the day with generation by one unit (turbine). Only trout are collected
during these efforts. Tailwater sampling conditions and effort are summarized below:
Table 3-1. Tailwater sampling conditions and efforts.
Tailwater
Year
annual
monitoring
began Sample time Stations Approximate flow Total effort (h)
Norris 1999 Night 12 114 m3/s (4,000 cfs) 2.0
Cherokee 2003 Day 12 114 m3/s (4,000 cfs) 2.0
Ft. Patrick Henry 2002 Day 4 88 m3/s (3,100 cfs) 1.0
Wilbur 1999 Day 131 71 m
3/s (2,500 cfs) 2.0
2
Boone 2009 Day 4 88 m3/s (3,100 cfs) 1.0
South Holston 1999 Day 12 71 m3/s (2,500 cfs) 2.0
1An extra site was added in 2010 to help evaluate the Quality Zone.
2Does not include effort (600 s) at the additional QZ site.

70
3.2 TAILWATER MONITORING
Six Region IV tailwater trout fisheries (Norris, Cherokee, Wilbur, Ft. Patrick Henry, Boone,
South Holston; Figure 1-1) are monitored annually. Updated management plans have been
finalized for the Norris, Wilbur, and South Holston tailwaters (Habera et al. 2014b; 2015b; 2015c).
Sampling is conducted each year in late February or March (except Cherokee) to provide an
assessment of the overwintering trout populations present before stocking begins. The Cherokee
tailwater (Holston River) stations are sampled in the fall (October), as trout survival over the
summer is a more important issue for that fishery. Catch per unit effort (CPUE) for each species at
each site (fish/h), as well as means for each tailwater, are calculated annually to monitor trout
abundance trends.
3.2.1 Norris (Clinch River)
Study Area
The Clinch River originates in southwestern Virginia and enters Tennessee in Hancock
County. Norris Dam impounds the Clinch River 197 km (122 mi) downstream in Anderson County,
forming 13,846-ha (34,213-acre) Norris Reservoir. Hypolimnetic discharges created coldwater
habitat and rainbow trout were stocked in the tailwater shortly after completion of the dam in 1936
(Tarzwell 1939). The Tennessee Game and Fish Commission stocked trout during 1950-1970 and
managed the river as a year-round fishery (Swink 1983). Chronic low dissolved oxygen levels and
a lack of minimum flow limited development of the trout fishery (Boles 1980; Yeager et al. 1987)
and were addressed by TVA’s Reservoir Release Improvements Program (TVA 1980). Dissolved
oxygen concentrations were improved initially by fitting the turbines with a hub baffle system
(Yeager et al. 1987). Later (1995 and 1996), both turbines were replaced with a more efficient
autoventing system (Scott et al. 1996), which maintains dissolved oxygen around 6 mg/L. A
minimum flow of 5.7 m3/s (200 CFS) was established in 1984 and has been maintained since then
by a re-regulation weir located about 3.2 km (2 mi) downstream of the dam (Yeager et al. 1987).
The weir was upgraded in 1995 to increase its holding capacity and improve public access (Bettoli
and Bohm 1997).
Improvements in dissolved oxygen and minimum flows in the Norris tailwater increased the
abundance and distribution of benthic invertebrates, as well as trout carrying capacity and trout
condition (Yeager et al. 1987; Scott et al. 1996). The tailwater currently supports a popular 20-km
(12.5-mi) fishery for Rainbow Trout, Brown Trout, and Brook Trout. Put-and-take and put-and-grow
management is accomplished by annually stocking both fingerling and adult trout (Habera et al.
2014). Bettoli and Bohm (1997) documented a small amount of natural reproduction by rainbow
trout, but recruitment to the tailwater fishery was considered to be minimal. Some of this natural
reproduction may come from Clear Creek, which large rainbow trout enter to spawn each winter.
Banks and Bettoli (2000) and Holbrook and Bettoli (2006) attributed the lack of Brown Trout
reproduction in the Norris tailwater to poor or dewatered spawning substrate and unsuitable flows
and water temperatures during spawning season. Some of these factors probably limit successful
rainbow trout reproduction as well.

71
The first intensive study of the Norris tailwater trout fishery (1995-1997) produced an
overwinter biomass estimate of 112 kg/ha composed of about 80% rainbow trout and 20% Brown
Trout (Bettoli and Bohm 1997). Tennessee’s only other tailwaters with higher trout biomass
estimates at that time were South Holston and Wilbur (Bettoli 1999). Bettoli and Bohm (1997) also
reported a relatively low return rate for stocked rainbow trout (19%) and very few Brown Trout were
observed in the creel. Most adult (208-330 mm) rainbow trout cohorts stocked in the tailwater were
found to be limited more by natural mortality than by angler harvest. Trout stocked as adults
exhibited energetically inefficient behaviors (e.g., rapid, long-range movements) which led to poor
creel-return rates and survival (Bettinger and Bettoli 2002). Consequently, the fishery is primarily
supported by fingerling rainbow trout stocking (Bettoli and Bohm 1997; Bettinger and Bettoli 2000).
High growth rates of fingerling-stocked rainbow trout (about 20 mm/month) allow the tailwater to
produce quality-sized fish within a relatively short time (Bettoli and Bohm 1997). Growth of stocked
Brown Trout is slower (12 mm/month; Meerbeek and Bettoli 2005).
The locations of TWRA’s 12 monitoring stations on the Norris tailwater, sampled on 22
February 2017, are provided in Figure 3-1. Additional sample location and effort details are
summarized in Table 3-1. Sampling at Station 12 was discontinued after 488 s because of
extreme fog.
Results and Discussion
The 2017 Norris tailwater sample produced 451 trout weighing nearly 165 kg (Table 3-2).
The catch included 388 Rainbow Trout (86%) and 63 Brown Trout (14%); no Brook Trout were
captured again in 2017, but none were available for stocking in 2015 and only 2,200 were stocked
in 2016. Relative abundances of rainbow and Brown Trout by weight were 76% and 24%,
respectively. Total catch and relative abundances of Rainbow Trout and Brown Trout (number and
weight) were similar to corresponding values for 2016 (Habera et al. 2017), although mean weight
decreased 17% for Rainbow Trout (to 323 g/fish) and 2% for Brown Trout (to 628 g/fish) relative to
2016.
Rainbow Trout ranged from 117-577 mm and Brown Trout ranged from 155-680 mm (Table
3-2). The atypical numbers of Rainbow Trout in the 102-mm and 127-mm size classes (Figure 3-2)
were the result of stocking most of the 2017 fingerling allocation in November 2016 (133,000)
because of deteriorating water quality conditions at Dale Hollow National Fish Hatchery. Over one-
third (37%) of Rainbow Trout >178 mm were in the 356-508 mm (14-20 in.) protected length range
or PLR (Figure 3-2). A smaller proportion of Brown Trout >178 mm (26%) was within the PLR, but
nine Brown Trout >508 mm were also captured, along with two rainbows in this size range. These
larger fish were primarily present at stations 7-12 (Table 3-2).
The 2017 mean electrofishing catch rates for all trout 178 mm (201 fish/h), as well as for
Rainbow Trout (173 fish/h) and Brown Trout (31 fish/h) individually were almost unchanged from
2016 (Figure 3-3). The mean catch rate for Brown Trout 178 mm has relatively stable at 25-35
fish/h since 2012 (Figure 3-3). The mean electrofishing catch rate for trout within the PLR (356-
508 mm) reached 80 fish/h in 2014-2016 and declined only slightly to 73 fish/h in 2017 (Figure 3-

72
3). The current Norris tailwater management plan (Habera et al. 2014b) maintains a mean PLR
catch rate objective of 28 fish/h for 2014-2019 and is certainly being achieved. The increasing
relative stock density of trout 356 mm (14 in.) and larger (RSD-14) indicates that trout population
size structures have been shifted toward larger fish since 2010 (Figure 3-4), as CPUE for trout
178 mm has been relatively stable (150-200 fish/h) and annual stocking rates have been relatively
consistent (see below). An RSD-14 value of 50 indicates that 50% of all stock-size trout—those at
least 254 mm (10 in.) in length—are 356 mm (14 in.) or larger and would be double the pre-PLR
average of 25.
Typically, Norris has the highest stocking rate of any Tennessee tailwater. It was stocked
with 216,000 trout during calendar year 2017 (Figure 3-5). About 64% (139,000) of these were
Rainbow Trout, most of which (100,000) were fingerlings. The remainder was Brown Trout
(40,000; 19%) and Brook Trout (37,500; 17%). Because of deteriorating water quality conditions at
Dale Hollow National Fish Hatchery in November 2016 (drought related), it was necessary to stock
much of the 2017 fingerling Rainbow Trout allocation early. Consequently, the 2016 fingerling
Rainbow Trout stocking rate substantially exceeded the rate prescribed in the Norris tailwater
management plan (160,000; Habera et al. 2014b), thus the 2017 stocking rate was reduced
(Figure 3-5). Recent Brook Trout shortages at Dale Hollow were such that none were stocked in
Norris in 2015 and only 2,000 were stocked in 2016. Generally, though, stocking rates have been
consistent since 2010 (Figure 3-5).
Roving creel surveys conducted by TWRA in 2013 (Black 2014) and 2015 (Black 2015)
indicated that pressure, trips, and catch increased somewhat during that two-year period while
harvest and mean trip length declined slightly:
aValues in parentheses are percentages represented by Rainbow Trout. Brook Trout were 19% of the catch and 15%
of harvest in 2013, but only 1% of the catch and 0.1% of harvest in 2015.
The average trout catch rate was similar in 2013 (1.08 fish/h) and 2015 (1.15 fish/h), while
average catch per trip decreased from just over to just under 4 fish. Catch rates over 0.7 fish/h are
generally considered representative of good fishing (McMichael and Kaya 1991; Wiley et al. 1993).
Average harvest was low in 2013 (0.98 fish/trip) and decreased to 0.60 fish/trip in 2015. Catch and
harvest of Brook Trout declined significantly from 2013 to 2015, but none were available for
stocking in 2015. Norris tailwater anglers overwhelmingly (76%) supported the PLR regulation and
85% rated TWRA’s management of this fishery as good or excellent during the 2013 survey. A
new angler survey was conducted on the Norris tailwater in 2017 and results will be available for
inclusion in the 2018 report.
Mean
Year Pressure (h) Trip length (h) Trips Catcha Harvest
a
2013 48,317 3.94 12,249 52,114 (56) 11,946 (55)
2015 56,427 3.25 17,348 65,098 (70) 10,237 (73)

73
Management Actions and Recommendations
TWRA’s management goal for the Norris tailwater focuses on maintaining the quality trout
fishery that has developed there since 2008 (Habera et al. 2014b). Accordingly, the primary
strategy for attaining this goal is to maintain the abundance of quality-sized (≥356 mm or 14 in.)
trout through the 356-
508 mm (14-20 in.)
protected length range
(PLR or ‘slot limit’)
regulation. Slot limits
promote growth of
smaller fish by reducing
competition through
angler harvest
(Anderson 1976), which
may be more easily
accomplished in
tailwater fisheries
maintained by stocking
(e.g., Norris), where
‘year class strength’ can
be controlled. Slot limits
have been shown to improve size structures of sport fish populations including Largemouth Bass
Micropterus salmoides (Wilde 1997) and trout (Luecke et al. 1994; Power and Power 1996).
Accordingly, the Norris tailwater PLR regulation has successfully improved (and maintained) trout
population size structure, and anglers have recognized this by overwhelmingly expressing their
support for the PLR (2013 survey). The status of the Norris tailwater trout fishery should be
tracked through continued annual electrofishing surveys and periodic creel surveys.
Norris tailwater angler (photo by Paul Shaw, TWRA).

74
Figure 3-1. Locations of the Norris tailwater (Clinch River) monitoring stations.
Norris Tailwater
10
11
12
9
8
7
6
5 4
3
2
1

75
Table 3-1. Location and sampling information for the 12 stations on the Norris tailwater, 22 February 2017.
Station Site Code County Quadrangle Coordinates Reach Number River Mile
Effort (s) Output
1 420170101 Anderson Norris 137 NE 36.22222N-84.09250W 06010207-19,1 79.7 600 150 V DC
120 PPS, 4 A
2 420170102 Anderson Norris 137 NE 36.20466N-84.08651W 06010207-19,1 77.2 600 530 V DC
120 PPS, 5 A
3 420170103 Anderson Norris 137 NE 36.20370N-84.10006W 06010207-19,1 76.3 600 530 V DC
120 PPS, 5 A
4 420170104 Anderson Norris 137 NE 36.20654N-84.12265W 06010207-19,1 75.6 600 530 V DC
120 PPS, 5 A
5 420170105 Anderson Lake City 137 NW 36.20433N-84.12580W 06010207-19,0 74.4 600 530 V DC
120 PPS, 5 A
6 420170106 Anderson Lake City 137 NW 36.19722N-84.12778W 06010207-19,0 74.1 600 150 V DC
120 PPS, 4 A
7 420170107 Anderson Norris 137 NE 36.18611N-84.11667W 06010207-19,0 73 600 150 V DC
120 PPS, 5 A
8 420170108 Anderson Norris 137 NE 36.17500N-84.11806W 06010207-19,0 72.2 600 150 V DC
120 PPS, 4 A
9 420170109 Anderson Norris 137 NE 36.16028N-84.12028W 06010207-19,0 70.4 600 150 V DC
120 PPS, 4 A
10 420170110 Anderson Norris 137 NE 36.14681N-84.11853W 06010207-19,0 69.5 600 530 V DC
120 PPS, 5 A
11 420170111 Anderson Norris 137 NE 36.14306N-84.11750W 06010207-19,0 69.1 600 150 V DC
120 PPS, 4 A
12 420160312 Anderson Lake City 137 NW 36.13151N-84.12628W 06010207-19,0 67.2 488 530 V DC
120 PPS, 5 A

76
Table 3-2. Catch data for the12 electrofishing stations on the Norris tailwater sampled 22 February 2017.
%
%
Total
Size range
Total
Abundance
Abundance
Station Species catch (mm) weight (g) (number) (weight)
1
Rainbow
6
190-440
2,314
35
29
Brown
11
176-515
5,756
65
71
Totals 17 8,070 100 100
2
Rainbow
62
117-450
8,912
89
85
Brown
8
155-300
1,579
11
15
Totals 70 10,491 100 100
3
Rainbow
59
130-443
16,932
76
73
Brown
19
240-459
6,353
24
27
Totals 78 23,285 100 100
4
Rainbow
26
120-470
8,219
96
98
Brown
1
250
172
4
2
Totals 27 8,391 100 100
5
Rainbow
37
168-477
14,767
97
91
Brown
1
531
1,428
3
9
Totals 38 16,195 100 100
6
Rainbow
22
306-483
11,136
92
96
Brown
2
227-333
466
8
4
Totals 24 11,602 100 100
7
Rainbow
29
153-577
12,812
83
59
Brown
6
265-608
8,790
17
41
Totals 35 21,602 100 100
8
Rainbow
41
186-463
13,752
91
91
Brown
4
229-410
1,340
9
9
Totals 45 15,092 100 100
9
Rainbow
25
240-515
11,030
89
68
Brown
3
384-635
5,108
11
32
Totals 28 16,138 100 100
10
Rainbow
29
150-479
10,400
85
66
Brown
5
278-680
5,288
15
34
Totals 34 15,688 100 100
11
Rainbow
23
191-445
6,294
100
100
Totals 23 6,294 100 100
12
Rainbow
29
150-424
8,659
91
73
Brown
3
391-562
3,254
9
27
Totals1 32 11,913 100 100
Total Rainbow
388
117-577
125,227
86
76
Total Brown
63
155-680
39,534
14
24
Overall 451 164,761 100 100
1Sample at Station 12 was ended early (488 s) because of extreme fog.

77
0
10
20
30
40
50
60
102 127 152 178 203 229 254 279 305 330 356 381 406 432 457 483 508 533 559 584 610 635 660 686
Nu
mb
er
of
Fis
h
Length Class (in.)
Rainbow
Brown
Norris Tailwater
Figure 3-2. Length frequency distributions for trout from the Norris tailwater monitoring stations in 2017.
Rainbow n = 388 117-577 mm Brown n = 63 155-680 mm
356-508 mm PLR

78
0
50
100
150
200
250
300
'96 '97 '98 '99 '00 '01 '02 '03 '04 '05 '06 '07 '08 '09 '10 '11 '12 '13 '14 '15 '16 '17
CP
UE
(fi
sh
/h)
Year
Rainbow
Brown
All
0
20
40
60
80
100
120
'96 '97 '98 '99 '00 '01 '02 '03 '04 '05 '06 '07 '08 '09 '10 '11 '12 '13 '14 '15 '16 '17
CP
UE
(fi
sh
/h)
Year
Rainbow
Brown
All
Trout 356-508 mm (14-20 in.)
Figure 3-3. Mean trout CPUEs for the Norris tailwater samples. Bars indicate 90% confidence intervals. The 356-508 mm PLR regulation was established in 2008.
Trout 178 mm (7 in.)
Norris Tailwater
2014-2019 Mgt. Plan objective (mean = 28 fish/h for all trout)

79
0
10
20
30
40
50
60
70
80
90
100
0
25
50
75
100
125
150
175
200
225
250
'96 '97 '98 '99 '00 '01 '02 '03 '04 '05 '06 '07 '08 '09 '10 '11 '12 '13 '14 '15 '16 '17
RS
D 1
4
CP
UE
(fi
sh
/h)
Year
CPUE ≥7 in.
RSD 14 All Trout
Norris Tailwater
Figure 3-4. RSD-14 Norris tailwater trout compared with corresponding CPUE for fish ≥178 mm. Dashed line indicates an RSD-14 of 50—50% of all stock-size trout (≥254 mm or 10 in.) are ≥356 mm (14 in.).

80
0
100
200
300
400
500
'90 '91 '92 '93 '94 '95 '96 '97 '98 '99 '00 '01 '02 '03 '04 '05 '06 '07 '08 '09 '10 '11 '12 '13 '14 '15 '16 '17
Nu
mb
er
sto
ck
ed
(x
10
00
)
Year
Fingerling Rainbow
Adult Rainbow
Brown Trout
Brook Trout
Norris Tailwater
Norris Tailwater
Figure 3-5. Recent trout stocking rates for the Norris tailwater. Current management plan stocking allocations are 160,000 fingerling Rainbow Trout, 37,000 adult Rainbow Trout, 20,000-40,000 Brown Trout, and 20,000 Brook Trout annually (~237,000 trout/year). Most of the 2017 fingerling Rainbow Trout allocation was stocked in November 2016 (133,000) because of deteriorating water quality conditions at Dale Hollow National Fish Hatchery. The 2017 stocking rate was reduced to 100,000.
1990-2001 average (255,000 total)

81
3.2.2 Cherokee (Holston River)
Study Area
Cherokee Dam impounds 12,272-ha (30,300-acre) Cherokee Reservoir on the Holston
River near Jefferson City. The dam is located about 83 km (52 mi.) upstream of the confluence of
the Holston and French Broad
rivers in Knoxville and the reservoir
has an 8,879-km2 (3,428-mi.2)
watershed. Historically, low
dissolved oxygen (DO) levels
(Higgins 1978) and the lack of a
minimum flow in the Cherokee
tailwater impacted its aquatic
communities. TVA established a
minimum flow of 9.2 m3/s (325 cfs)
in 1988 as part of its release
improvements program, then
began to address low DO levels in
1995 (Scott et al. 1996). Dissolved
oxygen levels in the tailwater were
improved by installation of a liquid
oxygen injection system in the
forebay area of the reservoir and through turbine venting aided with hub baffles (Scott et al. 1996).
These improvements have helped TVA meet the DO target of 4.0 mg/L in the tailwater and as a
result, fish and macroinvertebrate communities have substantially improved.
Seasonal temperature regimes, in addition to water quality and quantity problems, were an
impediment to fisheries management in the Cherokee tailwater for many years (Hill and Brown
1980). Pfitzer (1962) characterized temperatures as being too cold for warmwater fishes in the
spring and too warm for trout in the summer. However, it was generally regarded as supporting a
warmwater fish community (Scott et al. 1996; Hill and Brown 1980). TWRA stocked trout
infrequently, releasing 39,000 Rainbow, Brown, and Brook Trout (fingerlings and adults) during
1951-1955, and 16,000 Brown Trout in 1974. All of these efforts likely had limited success as they
took place prior to TVA’s water quality improvements. Trout stocking became more consistent
after 1995 and stocking rates were increased as water quality improved.
The upper 30 km (18.8 mi.) of the Cherokee tailwater, from the dam downstream to the
vicinity of Nance Ferry, is now being managed as a put-and-take and put-and-grow trout fishery. It
has become popular among area anglers and has drawn some pressure away from other Region
IV tailwaters (particularly the Clinch River). Because of the warmer water and abundant food
supply (particularly caddis flies), trout grow extremely well, providing the potential for a quality
fishery. However, late summer temperatures can exceed and remain above 21° C (70° F) for
weeks, creating a thermal ‘bottleneck’ that severely limits trout survival (i.e., carryover). Along with
Cherokee tailwater.

82
the relative scarcity of trout in October electrofishing surveys, the abundance of warmwater species
(e.g., Buffalo Ictiobus sp., Gizzard Shad Dorosoma cepedianum, and Channel Catfish Ictalurus
punctatus) indicate that the Cherokee tailwater provides marginal trout habitat during summer and
early fall.
The 12 electrofishing monitoring stations on the Cherokee tailwater (Figure 3-6) were
sampled again in October 2017 to evaluate the trout fishery following the elevated temperatures of
late summer and early fall. Sample site locations and effort details are summarized in Table 3-3.
Temperature data were also collected (measured hourly by Onset TidbiT® v2 loggers) near
Cherokee Dam and at Blue Spring during June-November 2017.
Results and Discussion
The 12 Cherokee tailwater electrofishing stations produced 22 trout (15 Rainbow Trout, 7
Brown Trout) from six stations in 2017 (Table 3-4). The overall mean catch rate for all trout 178
mm (11.0 fish/h; Figure 3-7) improved from 2016 and exceeded the long-term (2003-2017)
average of 8.3 fish/h. The mean catch rates for trout 356 mm (9.5 fish/h) and 457 mm (2.0
fish/h) also increased relative to 2016 (Figure 3-7). The 2016 catch rates were substantially
depressed because of the exceptionally warm water temperatures in the tailwater (Habera et al.
2017). Most Rainbow Trout (70%) collected during monitoring efforts in the Cherokee tailwater
have been in the 330-406 mm (13-16 in.) size classes (including the 2017 sample), while most
Brown Trout (70%) have been in the 229-279 mm (9-11 in.) range (Figure 3-8). It is evident that
some trout of both species survive the September/October thermal bottleneck at least once, given
the presence of fish >457 mm (18 in.) in most years (Figures 3-7 and 3-8).
Water temperatures near Cherokee Dam were exceptionally warm again in 2017—only
exceed by those recorded in 2013 and 2016. Maximum daily water temperature reached 21° C on
7 August—18 days earlier than in 2016 and earlier than in any preceding year except 2013 (25
July). Maximum daily temperature remained above 21° C for 78 consecutive days (through 26
October; Figure 3-9), which again was more than any preceding year except 2013 (79). On
average, (2005-2017), mean maximum temperature at this site reached 21° C on 26 August and
remained above 21° C for 57 days (through mid-October; Figure 3-9). Although the daily maximum
temperature often exceeded 25° C and occasionally reached 26° C in 2016, it reached 24° C only
three times in 2017. Minimum water temperature reached 21° C on 24 August and exceeded 21°
C for 50 of the next 55 days (Figure 3-9), thus there was no coldwater habitat during that period—
longer than in any preceding year except 2016. During 2005-2017, minimum temperature
exceeded 21° C an average of 23 days each year. Mean minimum temperature for the 13-year
period reached or closely approached 21° C during a 19-day period (19 September through 7
October; Figure 3-9).
Maximum daily water temperature at the Blue Spring site (13 km below Cherokee Dam)
reached 21° C on 17 June—earlier than in any year since monitoring began (2003) and over two
months earlier than in 2016 (23 August). It often exceeded 21° C during 17 June through 4
August, then subsequently remained above 21° C for 81 consecutive days (through 24 October;

83
Figure 3-10). The 101 days that maximum daily temperature >21° C in 2017 exceeded the total for
any previous monitoring year. Although maximum daily temperatures above 24° C (40 days) and
25° C (20 days) were relatively common in 2016, 24° C was exceeded on only 10 days in 2017.
Overall (2003-2017), maximum daily temperature at this site reached 21° C on 16 August and
remained above 21° C for 67 days (through 21 October; Figure 3-10). Minimum water
temperature reached 21° C on 18 August in 2017—12 days earlier than in 2016—and remained
above 21° C for 51 of the next 58 consecutive days (through October 15; Figure 3-10), thus there
was essentially no coldwater habitat during that period. While minimum daily temperature
exceeded 22° C on 42 days in 2016, this occurred on only 11 days in 2017. Overall (2003-2017),
the Blue Spring area typically has no coldwater habitat (daily minimum water temperature is >21°
C) during September and the first week of October (Figure 3-10). Water temperatures in the
Cherokee tailwater typically return to trout-tolerant levels (<21° C) by mid- to late October (28
October in 2017; Figures 3-9 and 3-10).
The Cherokee tailwater received 17,000 adult Rainbow Trout and 35,000 Brown Trout in
2017 (Figure 3-11). Stocking rates have averaged 18,000 adult Rainbow Trout and 28,000 Brown
Trout (159-214 mm) annually during the past three years. Although Rainbow Trout stocking rates
have been lower during 2015-2016 (Figure 3-11), electrofishing catch rates appear to be generally
correlated with water temperature, which in turn is related to variability in flow from Cherokee Dam
during June-October. Above average precipitation in some years (e.g., 2003, 2013, and 2017)
results in higher average flows from Cherokee Dam, earlier depletion of cold water stored in the
reservoir, and unsuitably warm tailwater temperatures for long periods of time. The reverse is true
during dry years such as 2007 and 2008. Consequently, there is a relatively strong (R2 = 0.66)
inverse relationship (2nd order polynomial) between the number of days where minimum water
temperature was ≥22° C at the Blue Spring site and the electrofishing catch rate (log10-transformed
+1; Figure 3-12). In turn, there is also a relatively strong (R2 = 0.52) positive relationship (2nd order
polynomial) between higher water temperatures (expressed as the number of days where the
minimum was ≥21° C at Blue Spring) and higher mean flow for March – August (Figure 3-13).
There may also be a relationship (e.g., in 2016) where extended periods of low flows and high air
temperatures in late summer combine to raise water temperatures to levels that impact trout
survival.
Management Recommendations
Trout in the Cherokee tailwater are subject to, on average, about a month (typically
September) each year without coldwater habitat: minimum temperatures exceed 21° C and
maximums often reach 24-25° C. Consequently, most survive less than a year, even with a
relatively low harvest rate (Habera et al. 2015). However, some trout that are able to find thermal
refugia such as groundwater upwellings or cooler tributaries (Baird and Krueger 2003) can survive
through at least one summer/early fall—evident by the large (≥457 mm) fish that are captured in
most years (Figure 3-8). Current stocking policy excludes the use of fingerling rainbows because
of their low recruitment potential and avoids July-October because of high water temperatures
(>21° C) during those months.

84
Despite limited trout carry-over caused by extended periods with water temperatures
exceeding 21° C, the Cherokee tailwater is well worth managing as a trout fishery. Even with the
summer/fall thermal bottleneck, trout angling opportunities are available during most months. The
thermal regime and benthic community of the Cherokee tailwater make it more like a natural trout
stream than other Tennessee tailwaters. The abundance of trichopterans (particularly
Cheumatopsyche spp.; Habera et al. 2004) undoubtedly enhances trout growth and prolific mayfly
and caddis hatches during the spring provide excellent flyfishing opportunities. Cherokee tailwater
trout anglers caught an estimated 0.63 fish/h and 2.89 fish/trip in 2014 (88% Rainbow Trout), while
harvesting 0.27 fish/h and 1.21 fish/trip (Black 2015).
Current angling regulations (i.e., general statewide for trout) are appropriate for maintaining
this fishery. A majority of Cherokee tailwater anglers (72%) rated TWRA’s management of this
fishery as good or excellent during the 2014 survey (Habera et al. 2016). Anglers occasionally
request special regulations (minimum size or slot limits), but they would be of little value as few fish
protected by such measures would survive the summer thermal bottleneck. The 12 existing
monitoring stations should be sampled annually to further develop the trout fishery database and
annual water temperature monitoring (summer and fall) should also be continued to provide
additional understanding of the relationship among temperature, flow, and trout abundance. These
basic recommendations, along with stocking rate annual stocking rates, will be incorporated into a
management plan for this tailwater (in preparation during 2018) to ensure its potential as a trout
fishery is maximized.
Cherokee tailwater.

85
Cherokee Tailwater
Figure 3-6. Locations of the Cherokee tailwater (Holston River) monitoring stations.
8 1
2
3 4
5
6
7
9
10
11
12

86
Table 3-3 Location and sampling information for the 12 stations on the Cherokee tailwater, 24 October 2017.
Station Site Code County Quadrangle Coordinates Reach Number
River Mile
Effort (s) Output
1 42017320
1 Grainger
/ Joppa 155
NE 36.16864N-83.50461W 06010104-3,4 51.8 600 530 V DC
Jefferson
120 PPS, 5-6 A
2 42017320
2 Grainger Joppa 155
NE 36.17589N-83.51183W 06010104-3,4 51.2 600 175 V DC
120 PPS, 4-6 A
3 42017320
3 Grainger Joppa 155
NE 36.17858N-83.51667W 06010104-3,4 50.9 600 530 V DC
120 PPS, 5-6 A
4 42017320
4 Grainger
/ Joppa 155
NE 36.16244N-83.52933W 06010104-3,4 49.5 600 175 V DC
Jefferson
120 PPS, 4-6 A
5 42017320
5 Jefferson Joppa 155
NE 36.16767N-83.53564W 06010104-3,4 49.0 600 530 V DC
120 PPS, 5-6 A
6 42017320
6 Grainger
/ Joppa 155
NE 36.17978N-83.55542W 06010104-3,4 47.0 600 175 V DC
Jefferson
120 PPS, 4-6 A
7 42017320
7 Jefferson Joppa 155
NE 36.18825N-83.56036W 06010104-3,4 46.2 600 530 V DC
120 PPS, 5-6 A
8 42017320
8 Jefferson Joppa 155
NE 36.17658N-83.56161W 06010104-3,4 44.7 600 175 V DC
120 PPS, 4-6 A
9 42017320
9 Jefferson Joppa 155
NE 36.16733N-83.56281W 06010104-3,4 44.0 600 530 V DC
120 PPS, 5-6 A
10 42017321
0 Grainger
/ Joppa 155
NE 36.16633N-83.57314W 06010104-3,4 43.5 600 175 V DC
Jefferson
120 PPS, 4-6 A
11 42017321
1 Grainger Joppa 155
NE 36.16458N-83.58286W 06010104-3,4 42.7 600 530 V DC
120 PPS, 5-6 A
12 42017321
2 Grainger Joppa 155
NE 36.15339N-83.60217W 06010104-3,4 39.5 600 175 V DC
120 PPS, 4-6 A
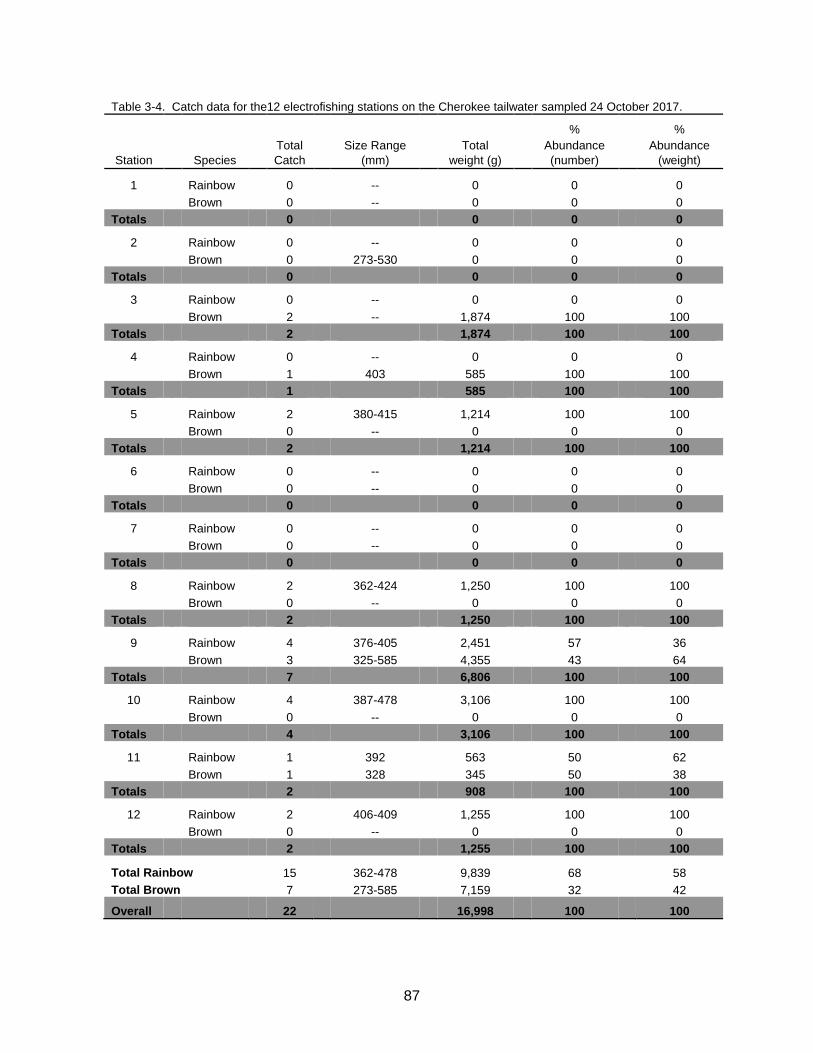
87
Table 3-4. Catch data for the12 electrofishing stations on the Cherokee tailwater sampled 24 October 2017.
%
%
Total
Size Range
Total
Abundance
Abundance
Station Species Catch (mm) weight (g) (number) (weight)
1
Rainbow
0
--
0
0
0
Brown
0
--
0
0
0
Totals 0 0 0 0
2
Rainbow
0
--
0
0
0
Brown
0
273-530
0
0
0
Totals 0 0 0 0
3
Rainbow
0
--
0
0
0
Brown
2
--
1,874
100
100
Totals 2 1,874 100 100
4
Rainbow
0
--
0
0
0
Brown
1
403
585
100
100
Totals 1 585 100 100
5
Rainbow
2
380-415
1,214
100
100
Brown
0
--
0
0
0
Totals 2 1,214 100 100
6
Rainbow
0
--
0
0
0
Brown
0
--
0
0
0
Totals 0 0 0 0
7
Rainbow
0
--
0
0
0
Brown
0
--
0
0
0
Totals 0 0 0 0
8
Rainbow
2
362-424
1,250
100
100
Brown
0
--
0
0
0
Totals 2 1,250 100 100
9
Rainbow
4
376-405
2,451
57
36
Brown
3
325-585
4,355
43
64
Totals 7 6,806 100 100
10
Rainbow
4
387-478
3,106
100
100
Brown
0
--
0
0
0
Totals 4 3,106 100 100
11
Rainbow
1
392
563
50
62
Brown
1
328
345
50
38
Totals 2 908 100 100
12
Rainbow
2
406-409
1,255
100
100
Brown
0
--
0
0
0
Totals 2 1,255 100 100
Total Rainbow
15
362-478
9,839
68
58
Total Brown
7
273-585
7,159
32
42
Overall 22 16,998 100 100

88
Cherokee Tailwater
0
5
10
15
20
25
2003 2004 2005 2006 2007 2008 2009 2010 2011 2012 2013 2014 2015 2016 2017
CP
UE
(fi
sh
/h)
Year
Rainbows
Browns
All
0
5
10
15
20
25
2003 2004 2005 2006 2007 2008 2009 2010 2011 2012 2013 2014 2015 2016 2017
CP
UE
(fi
sh
/h)
Year
Rainbows
Browns
All
0
1
2
3
4
5
6
7
8
9
10
2003 2004 2005 2006 2007 2008 2009 2010 2011 2012 2013 2014 2015 2016 2017
CP
UE
(fi
sh
/h)
Year
Rainbows
Browns
All
Trout 457 mm (18 in.)
Figure 3-7. Mean trout CPUEs for the Cherokee tailwater samples. Bars indicate 90% confidence intervals.
Trout 356 mm (14 in.)
Trout 178 mm (7 in.)

89
Cherokee Tailwater
0
5
10
15
20
25
30
35
40
102 127 152 178 203 229 254 279 305 330 356 381 406 432 457 483 508 533 559 584 610
Nu
mb
er
of
Fis
h
Length Class (mm)
2017 Rainbow
All Rainbow
0
5
10
15
20
25
30
35
40
102 127 152 178 203 229 254 279 305 330 356 381 406 432 457 483 508 533 559 584 610
Nu
mb
er
of
Fis
h
Length Class (mm)
2017 Brown
All Brown
Figure 3-8. Length frequency distributions for trout from the Cherokee tailwater monitoring stations (2003-2017).

90
0
5
10
15
20
25
30Te
mp
era
ture
(C
)
Date
Maximum
Minimum
0
5
10
15
20
25
30
Tem
pe
ratu
re (
C)
Date
Mean Max.
Mean Min.
Range
Cherokee Tailwater
Figure 3-9. Daily temperature maxima and minima for June-November near Cherokee Dam (~1.6 km below the dam) in 2017 (upper graph) and 2005-2017 means (lower graph, with range).
Near Cherokee Dam 2017
Maximum temperature consistently >21° C (70° F)
Near Cherokee Dam 2005-2017
Minimum temperature typically >21 C (70 F)

91
0
5
10
15
20
25
30T
em
pe
ratu
re (
C)
Date
Maximum
Minimum
0
5
10
15
20
25
30
Te
mp
era
ture
(C
)
Date
Mean Max.
Mean Min.
Range
Cherokee Tailwater
Maximum temperature >21° C (70° F)
Blue Spring 2017
Figure 3-10. Daily temperature maxima and minima for June-November at Blue Spring (~13 km below the dam) in 2017 (upper graph) and 2003- 2017 means (lower graph, with range).
Blue Spring 2003-2017
No coldwater
habitat
Minimum temperature
typically >21° C
(70° F)

92
0
25
50
75
100
125
150
175
'03 '04 '05 '06 '07 '08 '09 '10 '11 '12 '13 '14 '15 '16 '17
Nu
mb
er
sto
cked
(x1000)
Year
Fingerling Rainbow
Adult Rainbow
Brown Trout
Cherokee Tailwater
Figure 3-11. Recent trout stocking rates for the Cherokee tailwater. About 18,000 adult Rainbow Trout and 28,000 Brown Trout have been stocked annually since 2015.

93
y = -0.0002x2 - 0.005x + 1.0543R² = 0.6643
0
0.2
0.4
0.6
0.8
1
1.2
1.4
0 10 20 30 40 50
Lo
g10
Ca
tch
Ra
te +
1 (
fis
h/h
≥1
78
mm
)
Days with Minimum Temp. >22 C
y = 0.431x2 + 26.051x + 1738.4R² = 0.5183
0
1000
2000
3000
4000
5000
6000
7000
8000
0 10 20 30 40 50 60 70 80
Me
an
Flo
w M
arc
h-A
ug
ust
(CF
S)
Days with Min. Temp. ≥21 C
Cherokee Tailwater
Figure 3-12. Inverse relationship between temperature (days during June-Oct. with minimum >22 C at Blue Spring) and October electrofishing catch rate for the Cherokee tailwater.
Figure 3-13. Relationship between mean flow (March-August) and temperature (days during June-October with minimum ≥21 C at Blue Spring) for the Cherokee tailwater.
2016
94
3.2.3 Wilbur (Watauga River) Study Area
The Watauga River originates in the mountains of northwestern North Carolina and is
impounded near Hampton, Tennessee (Carter County), forming Watauga Reservoir (2,603 ha).
Most of the reservoir’s watershed (1,213 km2) is forested and much of the Tennessee portion lies
within the CNF. Wilbur Dam is located 4.2 km (~2.6 mi.) downstream of Watauga Dam and
impounds a small (29 ha or 72 acre) reservoir. The dam was completed in 1912 and is the
second oldest in the TVA system (Ocoee No. 1 is the oldest). Despite its long history of
degradation (Bivens 1988), the Watauga River between Elizabethton and Boone Reservoir
supported one of the finest trout fisheries in the state by the 1990's through a combination of
TVA’s water quality improvements and TWRA’s stocking program.
Bettoli (1999) estimated that the capacity of the Wilbur tailwater to overwinter trout (122
kg/ha) was second only to the South Holston tailwater. The trout fishery in the 16-km (10-mile)
river section downstream of Elizabethton was severely damaged by toxic runoff associated with a
fire at the North American Corporation in February 2000 (Habera et al. 2001b). Restoration of the
trout fishery began immediately and was complete by 2005 (Habera et al. 2006).
The Wilbur tailwater currently supports a 26-km (16-mi.) fishery for rainbow and Brown
Trout. Surface area of the tailwater at base flow is 135 ha (Bettoli 1999). Put-and-take and put-
and-grow fisheries are provided by annually stocking fingerling and adult Rainbow Trout.
Additionally, successful
natural reproduction (Banks
and Bettoli 2000; Holbrook
and Bettoli 2006) has led to
the development of a
substantial wild Brown Trout
fishery, particularly in the
upper half of the tailwater.
Brown Trout stocking was
discontinued throughout the
tailwater in 2015. General
trout angling regulations
apply except in a ‘Quality
Zone’ (QZ) extending 4.2 km
(2.6 mi.) between Smalling
Bridge and the CSX Railroad Bridge near Watauga (Figure 3-9). A two-fish creel limit and 356-
mm minimum size limit are in effect within the QZ and only artificial lures are permitted. A 2013
TWRA creel survey indicated that Wilbur tailwater trout anglers catch an average of 1.68 fish/h
and 6 fish/trip, while harvesting 0.89 fish/trip. (Black 2014).
The 13 monitoring stations on the Wilbur tailwater (Figure 3-14) were sampled on 9 March
2017. The purpose of the additional station (10.5; Figure 3-14) is to help evaluate the QZ as
Upper Wilbur tailwater.

95
prescribed in the previous Wilbur tailwater management plan (Habera et al. 2009b). Data from
this station are used only for comparing electrofishing catch rates inside and outside the QZ.
Location and sampling effort details for all stations are provided in Table 3-5.
Results and Discussion
The 12 Wilbur tailwater monitoring stations produced 645 trout weighing over 145 kg in
2017 (Table 3-6)—the largest sample collected since monitoring began in 1999. Total catch
increased 20% relative to 2016 as the result of further increases in the number of Brown Trout
captured throughout the tailwater (Table 3-6). Total biomass for the 2017 sample increased 34%,
reflecting increases in both the overall catch and the catch of larger trout (356 mm). The 2017
catch included 516 Brown Trout (Table 3-4) —the most captured in any sample to date and the
highest proportion of the sample (80%) since 2000. Bettoli (1999) estimated that Brown Trout
represented 60% of overwintering trout density in the Wilbur tailwater during 1998-1999. Since
2001, the relative abundance of Brown Trout has been in the 65-78% range. Most Brown Trout
(79%) and Rainbow Trout (76%) in 2017 were in the 178-305 mm size range (Figure 3-15) and
were most likely age-1 and age-2 fish.
The mean catch rate for
all trout 178 mm nearly
reached 300 fish/h in 2017
(Figure 3-16). The increase
relative to 2016 was the result of
a 60% increase in the Brown
Trout catch rate (Figure 3-16).
The new Wilbur tailwater
management plan (Habera et al.
2015b) prescribes developing a
wild Brown Trout fishery
throughout the tailwater by
discontinuing all Brown Trout
stocking (effective in 2015).
This strategy will be considered
successful if a mean Brown
Trout catch rate of 40 fish/h (178 mm) can be maintained in the lower portion of the tailwater
(Stations 8-12) during 2015-2020 (Habera et al. 2015b). The 2017 Brown Trout catch rate in that
area was 67 fish/h and has averaged 46 fish/h since 2015.
The mean catch rate for larger trout (356 mm) in 2017 exceeded 20 fish/h again (Figure
3-16)—the long-term average since restoration was considered complete in 2005. The mean
catch rate for the largest trout (457 mm) remained at 4.0 fish/h in 2017 (Figure 3-16). Most of
the trout in this size range are browns, as few Rainbow Trout 457 mm have been captured to
date. Weiland and Hayward (1997) observed that failure of Rainbow Trout to reach large sizes in
some tailwaters may be related to diet overlap among size class and limited capacity to intra-
Wilbur tailwater sampling.
96
specifically partition food resources (in contrast to Brown Trout). Dodrill et al. (2016) found that
prey size, as well as abundance and quality, limits maximum size for drift-foraging Rainbow Trout
in tailwaters. Bioenergetically, larger Rainbow Trout would prefer to select larger prey items, but
these can be scarce in tailwater systems (Dodrill et al. 2016). Flinders and Magoulick (2017)
observed that large Rainbow Trout (>400 mm) in Arkansas tailwaters experienced a food-
availability bottleneck during winter that caused daily ration to fall below minimum maintenance
requirements, even with lower water temperatures and reduced metabolic costs.
Recently, mean catch rates for trout 356 mm in the QZ (Stations 10, 10.5, and 11) have
been somewhat higher than corresponding catch rates at the other 10 stations. (Figure 3-17).
However, there has been substantial overlap of the 90% confidence limits for both areas in most
years (Figure 3-17) because of substantial catch rate variability among the QZ sites related to
habitat quality. While not conclusive, these data provide no clear indication that the QZ
regulations are enhancing abundance of larger trout in that area, although they do suggest a
general increase in the electrofishing catch rate of trout 356 mm throughout the tailwater since
2005. The most recent angler harvest rate for the Wilbur tailwater was relatively low (0.94
fish/trip), but separate data were not available for the QZ. However, focusing harvest on larger
trout size classes through minimum length limits (rather than protecting them) may actually
promote recruitment and growth overfishing (Sánchez-Hernández 2016) and thereby limit
attainment of management objectives.
The Wilbur tailwater was stocked with 41,000 adult Rainbow Trout during 2017 (Figure 3-
18) as basically directed in the current management plan (Habera et al. 2015b). The prescribed
annual fingerling Rainbow Trout stocking rate is 50,000, but an additional 53,000 fingerlings were
inadvertently stocked in 2017 (Figure 3-18). Brown Trout stocking was discontinued in 2015 and
Brook Trout stocking was discontinued in 2009 (after eight years) because of extremely low
survival (0.1 – 4.4% over 100 d), slow growth (4-15 mm per month), and excessive predation by
Brown Trout (Damer and Bettoli 2008).
Roving creel surveys on the Wilbur tailwater conducted by TWRA in 2013 (Black 2014)
and 2016 (Black 2017) indicated that pressure, trips, and mean trip length, along with estimated
catch and harvest increased substantially during that three-year period:
aValues in parentheses are percentages represented by Rainbow Trout.
The average trout catch rate also increased from 1.67 fish/h in 2013 to 1.90 fish/h in 2016,
while average catch per trip increased from 6.5 in 2013 to 9.3 per trip in 2016. By comparison,
catch rates over 0.7 fish/h are generally considered representative of good fishing (McMichael
Mean
Year Pressure (h) Trip length (h) Trips Catcha Harvest
a
2013 61,764 3.88 15,909 103,233 (68) 14,234 (86)
2016 112,627 4.90 22,965 213,673 (71) 21,477 (88)

97
and Kaya 1991; Wiley et al. 1993). Average harvest was low in 2013 (0.89 fish/trip) and
remained below 1 fish/trip in 2016 (0.94/trip). Rainbow Trout and Brown Trout abundance were
relatively stable during 2013-2016 (Figure 3-16), and proportions of both species represented in
catch and harvest estimates remained relatively unchanged.
A majority of Wilbur tailwater anglers interviewed in 2013 (67%) expressed their support
for the QZ regulations and 60% opposed replacing it with a tailwater-wide PLR (slot limit) with no
bait restrictions (Habera et al. 2015a). A substantial majority (98%) also rated TWRA’s
management of the Wilbur tailwater trout fishery as good or excellent at that time. In 2016, 273
Wilbur tailwater anglers were asked if they fished in the QZ during the past three years and if so,
whether or not they caught more large (≥356 mm) trout there than elsewhere in the tailwater.
Anglers who had fished the QZ were also asked if they would favor changing regulations there to
a PLR (e.g., 356-457 mm or 14-18 in.) with no bait restrictions and a 7-fish creel (with one >457
mm). Ninety anglers (33%) reported that they had fished the QZ since 2013, with 44% of those
indicating that they did catch more large trout there. Even though a majority of anglers did not
experience a higher catch rate for large trout in the QZ, most (81%) did not support the proposed
regulation change. This opinion differed little between those who did catch more large fish in the
QZ (83% un-supportive) and those who did not (80% unsupportive). A new angler survey will be
conducted on the Wilbur tailwater in 2018 and results will be available for inclusion in the 2019
report.
Management Recommendations
The goal of the current (2015-2020) Wilbur tailwater management plan is to maintain a
quality trout fishery throughout the tailwater capable of providing a variety of opportunities to the
anglers who enjoy this resource (Habera et al. 2015b). Two of its basic objectives—managing for
a wild Brown Trout fishery throughout the tailwater and maintaining Rainbow Trout stocking rates
(and the Rainbow Trout fishery)—are being achieved. The third—consideration of a regulation
change in the QZ to a PLR—has also been addressed and currently most anglers do not support
a regulation change (e.g., to a PLR), even if they do not experience higher catch rates for larger
trout.
Because of the presence of whirling disease Myxobolus cerebralis in nearby Virginia and
North Carolina trout fisheries and the popularity of the Wilbur tailwater with anglers from those
areas, 60 Rainbow Trout and 12 Brown Trout captured during 2017 were submitted to the U.S.
Fish and Wildlife Service’s Fish Health Lab in Warm Springs, GA to be screened for this
pathogen. Whirling disease was confirmed in both species and TWRA will move forward with
information and education efforts directed at preventing the spread of spores and infected fish, as
well as screening of additional trout fisheries in 2018.

98
Figure 3-14. Locations of the Wilbur tailwater (Watauga River) monitoring stations. Station 10.5 was added in 2010 to help evaluate the Quality Zone (which also includes stations 10 and 11).
CSX RR
Doe River
Stony Creek
Watauga River Wataug
a River
Siam Bridge
Hunter Bridge
Smalling Bridge
Quality Zone (special regs. apply)
1 2
3 4 5
6
8
9
10
11 7
12
Wilbur Tailwater
Watauga
River
Watauga
River
10.5
Carter Co.
Wash.
Co.

99
Table 3-5. Location and sampling information for the 13 electrofishing stations on the Wilbur tailwater, 9 March 2017.
Station Site Code County Quadrangle Coordinates Reach Number River Mile
Effort (s) Output
1 420170301 Carter Elizabethton 207 SW 36.35194N-82.13306W 06010103-19,0 33.0 600 400 V DC
120 PPS, 4 A
2 420170302 Carter Elizabethton 207 SW 36.34806N-82.14861W 06010103-19,0 32.0 600 884 V DC
120 PPS, 5 A
3 420170303 Carter Elizabethton 207 SW 36.36361N-82.15444W 06010103-19,0 30.3 600 400 V DC
120 PPS, 4 A
4 420170304 Carter Elizabethton 207 SW 36.36833N-82.16861W 06010103-18,0 29.5 600 884 V DC
120 PPS, 5 A
5 420170305 Carter Elizabethton 207 SW 36.35833N-82.17944W 06010103-18,0 28.4 600 400 V DC
120 PPS, 4 A
6 420170306 Carter Elizabethton 207 SW 36.35500N-82.20333W 06010103-18,0 27.0 600 884 V DC
120 PPS, 5 A
7 420170307 Carter Elizabethton 207 SW 36.36028N-82.22694W 06010103-12,2 25.9 600 400 V DC
120 PPS, 4 A
8 420170308 Carter Johnson City 198 SE 36.33222N-82.26694W 06010103-12,2 22.4 600 884 V DC
120 PPS, 5 A
9 420170309 Carter Johnson City 198 SE 36.33389N-82.26917W 06010103-12,0 21.8 600 400 V DC
120 PPS, 4 A
10 420170310 Carter Johnson City 198 SE 36.34556N-82.28306W 06010103-12,0 20.0 600 884 V DC
120 PPS, 5 A
10.5 420170311 Carter Johnson City 198 SE 36.35150N-82.28730W 06010103-12,0 19.4 600 400 V DC
120 PPS, 4 A
11 420170312 Carter Johnson City 198 SE 36.35750N-82.29056W 06010103-10,0 18.7 600 400 V DC
120 PPS, 4 A
12 420170313 Carter Johnson City 198 SE 36.37361N-82.30250W 06010103-10,0 17.3 600 884 V DC
120 PPS, 5 A
Station 10.5 was added in 2010 to help evaluate the Quality Zone (also includes Stations 10 and 11).
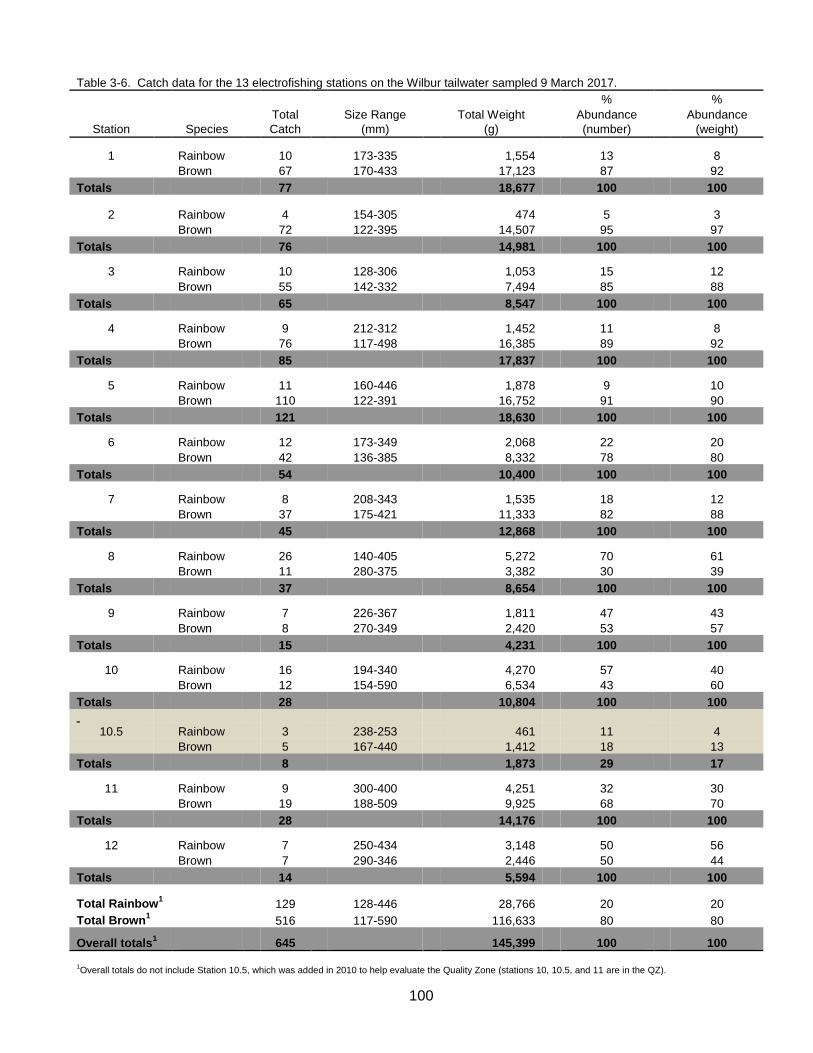
100
Table 3-6. Catch data for the 13 electrofishing stations on the Wilbur tailwater sampled 9 March 2017.
%
%
Total
Size Range
Total Weight
Abundance
Abundance
Station Species Catch (mm) (g) (number) (weight)
1
Rainbow
10
173-335
1,554
13
8
Brown
67
170-433
17,123
87
92
Totals 77 18,677 100 100
2
Rainbow
4
154-305
474
5
3
Brown
72
122-395
14,507
95
97
Totals 76 14,981 100 100
3
Rainbow
10
128-306
1,053
15
12
Brown
55
142-332
7,494
85
88
Totals 65 8,547 100 100
4
Rainbow
9
212-312
1,452
11
8
Brown
76
117-498
16,385
89
92
Totals 85 17,837 100 100
5
Rainbow
11
160-446
1,878
9
10
Brown
110
122-391
16,752
91
90
Totals 121 18,630 100 100
6
Rainbow
12
173-349
2,068
22
20
Brown
42
136-385
8,332
78
80
Totals 54 10,400 100 100
7
Rainbow
8
208-343
1,535
18
12
Brown
37
175-421
11,333
82
88
Totals 45 12,868 100 100
8
Rainbow
26
140-405
5,272
70
61
Brown
11
280-375
3,382
30
39
Totals 37 8,654 100 100
9
Rainbow
7
226-367
1,811
47
43
Brown
8
270-349
2,420
53
57
Totals 15 4,231 100 100
10
Rainbow
16
194-340
4,270
57
40
Brown
12
154-590
6,534
43
60
Totals 28 10,804 100 100
10.5 Rainbow 3 238-253 461 11 4
Brown 5 167-440 1,412 18 13
Totals 8 1,873 29 17
11
Rainbow
9
300-400
4,251
32
30
Brown
19
188-509
9,925
68
70
Totals 28 14,176 100 100
12
Rainbow
7
250-434
3,148
50
56
Brown
7
290-346
2,446
50
44
Totals 14 5,594 100 100
Total Rainbow1
129
128-446
28,766
20
20
Total Brown1
516
117-590
116,633
80
80
Overall totals1 645 145,399 100 100
1Overall totals do not include Station 10.5, which was added in 2010 to help evaluate the Quality Zone (stations 10, 10.5, and 11 are in the QZ).

101
0
20
40
60
80
100
76 102 127 152 178 203 229 254 279 305 330 356 381 406 432 457 483 508 533 559 584 610 635 660 686
Nu
mb
er
of
Fis
h
Length Class (mm)
Rainbow
Brown
Wilbur Tailwater
Figure 3-15. Length frequency distributions for trout from the Wilbur tailwater monitoring stations in 2017 (excluding Station 10.5).
Rainbow n = 129 128-446 mm
Brown n = 516 117-590 mm

102
0
50
100
150
200
250
300
350
400
'99 '00 '01 '02 '03 '04 '05 '06 '07 '08 '09 '10 '11 '12 '13 '14 '15 '16 '17
CP
UE
(fi
sh
/h)
Year
Rainbows
Browns
All
0
10
20
30
40
50
'99 '00 '01 '02 '03 '04 '05 '06 '07 '08 '09 '10 '11 '12 '13 '14 '15 '16 '17
CP
UE
(fi
sh
/h)
Year
Rainbows
Browns
All
0
2
4
6
8
10
12
14
'99 '00 '01 '02 '03 '04 '05 '06 '07 '08 '09 '10 '11 '12 '13 '14 '15 '16 '17
CP
UE
(fi
sh
/h)
Year
Rainbows
Browns
All
Trout 178 mm (7”)
Figure 3-16. Mean trout CPUEs for the Wilbur tailwater samples. Bars indicate 90% confidence intervals.
Trout 356 mm (14”)
Trout 457 mm (18”)
Wilbur Tailwater
Fish Kill Stations 8-12
Fish Kill Stations 8-12
Fish Kill Stations
8-12

103
0
10
20
30
40
50
60
70
80
'99 '00 '01 '02 '03 '04 '05 '06 '07 '08 '09 '10 '11 '12 '13 '14 '15 '16 '17
CP
UE
(fi
sh
/h)
Year
Quality Zone
Other sites
Wilbur Tailwater
Fish Kill (Stations 8-12)
Wilbur Tailwater
Figure 3-17. Mean trout CPUEs for trout ≥356 mm from the Quality Zone (QZ; sites 10, 10.5, and 11) and the other ten sites on the Wilbur tailwater. Bars indicate 90% upper confidence limits.
Fish Kill (Station 8-12)

104
0
50
100
150
200
'90 '91 '92 '93 '94 '95 '96 '97 '98 '99 '00 '01 '02 '03 '04 '05 '06 '07 '08 '09 '10 '11 '12 '13 '14 '15 '16 '17
Nu
mb
er
sto
ck
ed
(x
10
00
)
Year
Fingerling RBT
Adult RBT
Browns
Brook
Wilbur Tailwater
Fish kill
Figure 3-18. Recent trout stocking rates for the Wilbur tailwater. Annual stocking rates under the current management plan (2015-2020)
are 40,000 adult rainbow trout and 50,000 fingerling rainbows. .

105
3.2.4 Fort Patrick Henry (South Fork Holston River)
Study Area
Ft. Patrick Henry Dam impounds a small (362 ha) reservoir (Ft. Patrick Henry Lake) on the
South Fork of the Holston River near Kingsport. TVA maintains a minimum flow of 11.3 m3/s (400
cfs) downstream of the dam, where the river provides an important industrial water supply. The
upper 4.7 km (2.9 mi.) of the Ft. Patrick Henry tailwater (Figure 3-19) is managed as a put-and-take
and put-and-grow trout fishery with annual stockings of adult and fingerling Rainbow Trout and
sub-adult (152-178 mm) Brown Trout. Sample site locations and effort details are summarized in
Table 3-7.
Results and Discussion
The four Ft. Patrick Henry tailwater electrofishing stations produced 115 trout weighing over
61 kg in 2017 (Table 3-8). Trout biomass for 2017 decreased from the 2016 total (79 kg), which
exceeded all previous monitoring samples. Fewer large (356 mm) Rainbow Trout in the 2017
sample caused the decrease. Rainbow Trout ranged from 232-554 mm and fish in the 229-279
mm (9-11 in.) and 381-432 mm (15-17 in.) size classes were most abundant (Figure 3-20). More
Rainbow Trout 508 mm (20 in.) were captured in 2016 (16) than in any earlier sample (maximum
was 8 in 2015), but only three
were captured in 2017. The 29
Brown Trout captured in 2017
ranged from 140-392 mm and
made up only 5% of the
sample biomass (Table 3-8).
Brown Trout 457 mm (18 in.)
are occasionally present in Ft.
Patrick Henry monitoring
samples, but only one has
been captured since 2013.
The mean catch rate
for all trout 178 mm increased
slightly to 106 fish/h in 2017
(Figure 3-21), which is well
above the long-term (2002-
2015) average of 77 fish/h. However, the catch rate for trout 356 mm decreased to 44 fish/h and
the mean catch rate for the largest trout (457 mm or 18 in.) declined again to 18 fish/h (Figure 3-
21), but remained above the long-term average of 10 fish/h. The abundance of trout 457 mm had
been substantially depressed during 2004-2010 (0 to 4 fish/h), but has improved since then,
averaging nearly 18 fish/h (Figure 3-21).
Sampling the Ft. Patrick Henry tailwater (G Loucks, TWRA).

106
Stocking rates have been more stable since 2008 (Figure 3-22), with 5,300 adult Rainbow
Trout, 7,500 fingerling Rainbow Trout, and 25,000 Brown Trout stocked in 2017. Overall, an
average of 11,000 adult Rainbow Trout, 6,800 fingerling Rainbow Trout, and 19,500 Brown Trout
has been stocked during the previous five years (Figure 3-22).
An angler survey was conducted on the Ft. Patrick Henry tailwater in 2017 and results
(including estimated pressure, catch, and harvest) will be available for inclusion in the 2018 report.
As part of this survey, anglers were asked to rate their satisfaction with the trout fishery on a scale
of 1 (poor) to 5 (excellent). Interestingly, over one third (37%) of the 276 anglers responding to this
question offered no opinion, and several mentioned that they did not know what TWRA does to
manage the fishery. The majority (57%), however, rated the fishery as good or excellent.
Management Recommendations
Despite its relatively small size, the Ft. Patrick Henry tailwater provides an excellent trout
fishery that consistently produces large, extremely well-conditioned trout. Mean relative weight
(Wr) is 107 (SE=0.47) for Rainbow Trout and 107 (SE=0.97) for Brown Trout, with numerous fish of
both species exceeding 130. This fishery is currently subject to statewide trout angling regulations
and no changes are recommended at this time. The current adult Rainbow Trout and Brown Trout
stocking rates should at least be maintained. Also, the four sampling stations should be sampled
annually to obtain information useful for the future management of this fishery. These basic
recommendations are being incorporated into a trout fishery management plan for the Ft. Patrick
Henry and Boone tailwaters (in preparation during 2017-2018) to ensure that they continue to
achieve their potential for providing exceptional angling opportunities for quality-sized trout.
Ft. Patrick Henry tailwater anglers (G. Loucks, TWRA).

107
Figure 3-19. Location of the Ft. Patrick Henry tailwater (South Fork Holston River) monitoring stations.
Ft. Patrick Henry Tailwater
1
2
3 4
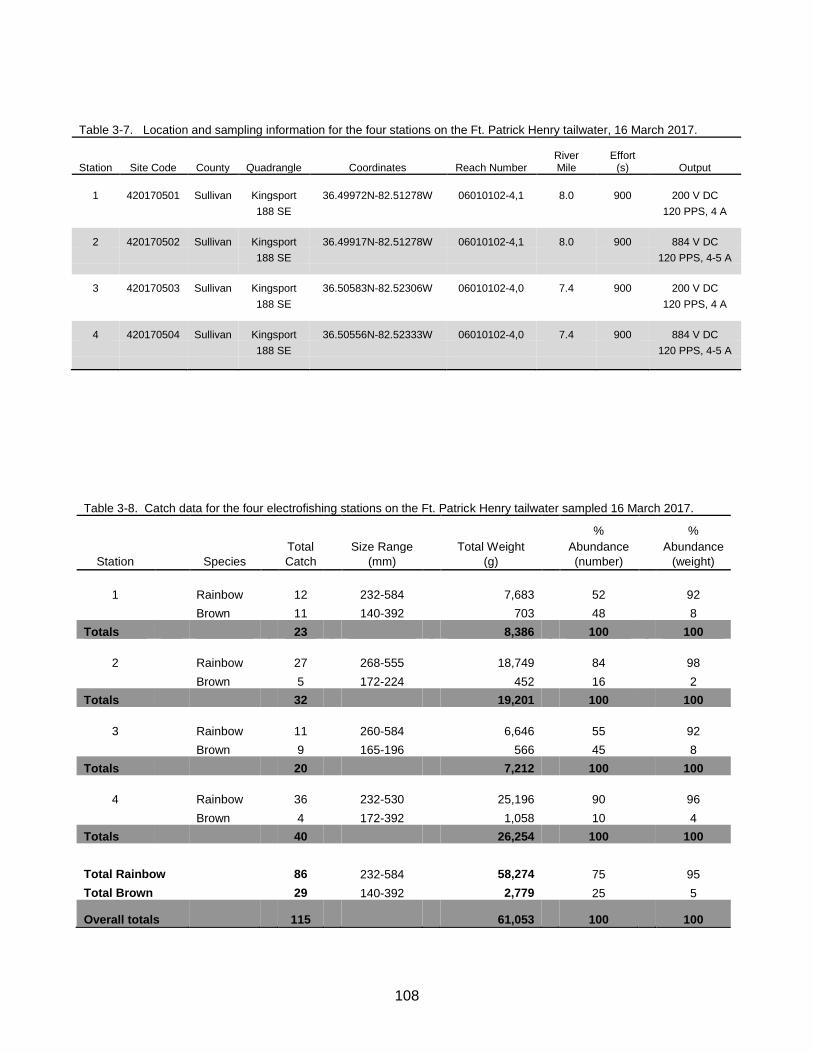
108
Table 3-7. Location and sampling information for the four stations on the Ft. Patrick Henry tailwater, 16 March 2017.
Station Site Code County Quadrangle Coordinates Reach Number River Mile
Effort (s) Output
1 420170501 Sullivan Kingsport 36.49972N-82.51278W 06010102-4,1 8.0 900 200 V DC
188 SE
120 PPS, 4 A
2 420170502 Sullivan Kingsport 36.49917N-82.51278W 06010102-4,1 8.0 900 884 V DC
188 SE
120 PPS, 4-5 A
3 420170503 Sullivan Kingsport 36.50583N-82.52306W 06010102-4,0 7.4 900 200 V DC
188 SE
120 PPS, 4 A
4 420170504 Sullivan Kingsport 36.50556N-82.52333W 06010102-4,0 7.4 900 884 V DC
188 SE
120 PPS, 4-5 A
Table 3-8. Catch data for the four electrofishing stations on the Ft. Patrick Henry tailwater sampled 16 March 2017.
%
%
Total
Size Range
Total Weight
Abundance
Abundance
Station Species Catch (mm) (g) (number) (weight)
1
Rainbow
12
232-584
7,683
52
92
Brown
11
140-392
703
48
8
Totals 23 8,386 100 100
2
Rainbow
27
268-555
18,749
84
98
Brown
5
172-224
452
16
2
Totals 32 19,201 100 100
3
Rainbow
11
260-584
6,646
55
92
Brown
9
165-196
566
45
8
Totals 20 7,212 100 100
4
Rainbow
36
232-530
25,196
90
96
Brown
4
172-392
1,058
10
4
Totals 40 26,254 100 100
Total Rainbow
86
232-584
58,274
75
95
Total Brown
29
140-392
2,779
25
5
Overall totals 115 61,053 100 100
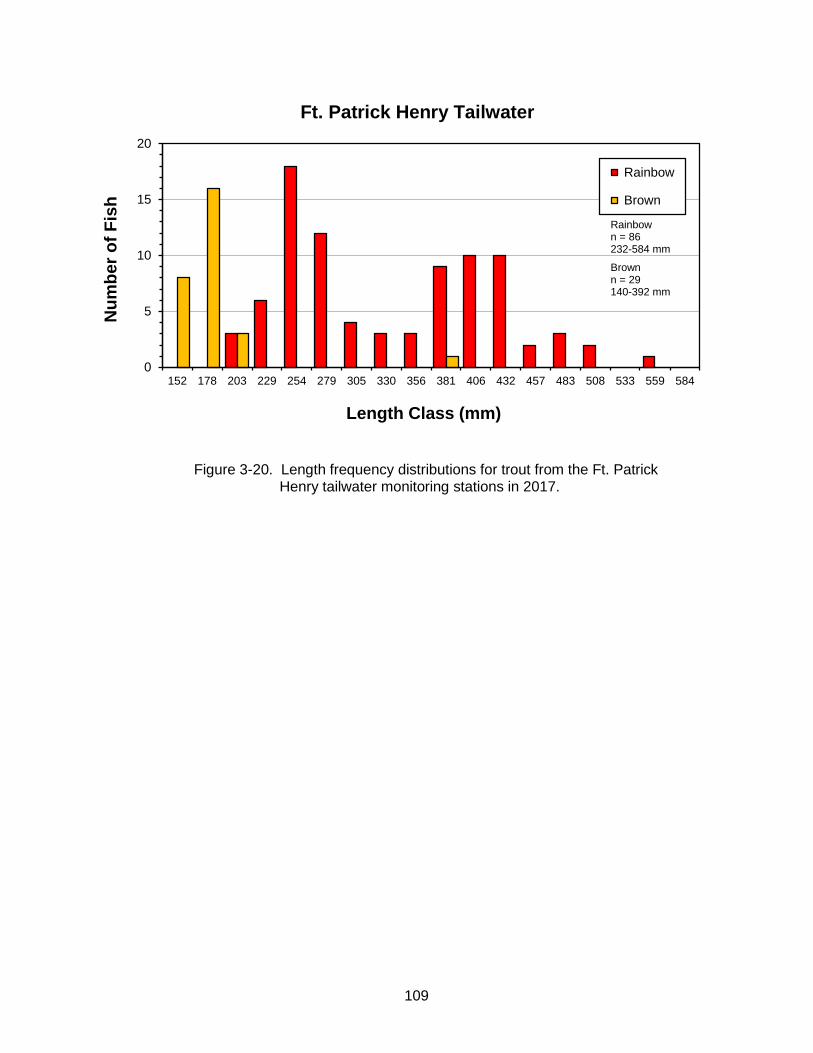
109
0
5
10
15
20
152 178 203 229 254 279 305 330 356 381 406 432 457 483 508 533 559 584
Nu
mb
er
of
Fis
h
Length Class (mm)
Rainbow
Brown
Ft. Patrick Henry Tailwater
Rainbow Trout n = 64 Range: 208-525 mm
n = 8 Range: 270-355 mm
Rainbow Trout
n = 72 Range: 208-525 mm
Brown Trout
Ft. Patrick Henry Tailwater
Ft. Patrick Henry Tailwater
Figure 3-20. Length frequency distributions for trout from the Ft. Patrick Henry tailwater monitoring stations in 2017.
Rainbow n = 86 232-584 mm
Brown n = 29 140-392 mm

110
0
40
80
120
160
200
'02 '03' '04 '05 '06 '07 '08 '09 '10 '11 '12 '13 '14 '15 '16 '17
CP
UE
(fi
sh
/h)
Year
Rainbow Trout
Brown Trout
All
0
20
40
60
80
100
'02 '03' '04 '05 '06 '07 '08 '09 '10 '11 '12 '13 '14 '15 '16 '17
CP
UE
(fi
sh
/h)
Year
Rainbow Trout
Brown Trout
All
0
10
20
30
40
50
'02 '03' '04 '05 '06 '07 '08 '09 '10 '11 '12 '13 '14 '15 '16 '17
CP
UE
(fi
sh
/h)
Year
Rainbow Trout
Brown Trout
All
Trout 178 mm (7 in.)
Trout 356 mm (14 in.)
Trout 457 mm (18 in.)
Ft. Patrick Henry Tailwater
Figure 3-21. Mean trout CPUEs for the Ft. Patrick Henry tailwater samples. Bars indicate 90% confidence intervals.
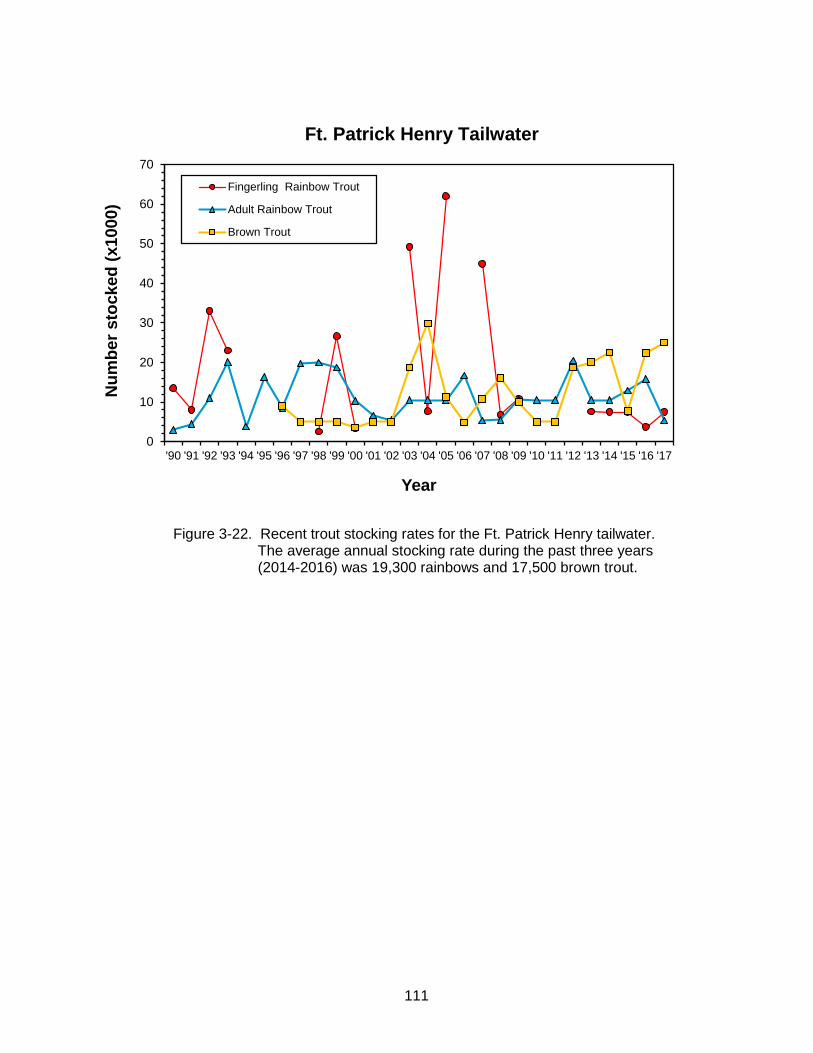
111
0
10
20
30
40
50
60
70
'90 '91 '92 '93 '94 '95 '96 '97 '98 '99 '00 '01 '02 '03 '04 '05 '06 '07 '08 '09 '10 '11 '12 '13 '14 '15 '16 '17
Nu
mb
er
sto
cked
(x1000)
Year
Fingerling Rainbow Trout
Adult Rainbow Trout
Brown Trout
Ft. Patrick Henry Tailwater
Figure 3-22. Recent trout stocking rates for the Ft. Patrick Henry tailwater. The average annual stocking rate during the past three years
(2014-2016) was 19,300 rainbows and 17,500 brown trout.

112
3.2.5 Boone (South Fork Holston River)
Study Area
Boone Dam impounds a 1,782 ha (4,400 acre) reservoir (Boone Lake) on the South Fork of
the Holston and Watauga rivers in Sullivan and Washington counties near Johnson City and
Kingsport. Both the South Holston and Wilbur tailwaters, which support two of Tennessee’s
premier trout fisheries, flow into Boone Lake. A short (~1 km) tailwater exists downstream of
Boone Dam at the upper end of
Ft. Patrick Henry Lake. The dam
has three autoventing turbines
which help improve dissolved
oxygen levels in the water
released from Boone Dam. This
tailwater and Ft. Patrick Henry
Lake provide coldwater habitat
that was historically stocked with
adult Rainbow Trout. TWRA’s
preliminary investigations of this
tailwater in 2008 indicated the
presence of a good Rainbow
Trout fishery along with a few
Brown Trout, which likely were
migrants from the South Holston
or Wilbur tailwaters upstream.
Evidence of some natural
reproduction by Rainbow Trout (58-85 mm fish) was also detected in 2008 during sampling at base
flow. Accordingly, four electrofishing stations (Figure 3-23) were established in 2008 and the
Boone tailwater was added to the annual monitoring program in 2009. Sample site locations and
effort details are summarized in Table 3-9.
Results and Discussion
The four Boone tailwater monitoring stations produced 109 trout (61 Rainbow Trout, 29
Brown Trout, and 19 Brook Trout) weighing over 49 kg in 2017 (Table 3-10). More Brook Trout
were captured in 2017 than in all previous samples (one in 2013, 2014, and 2015). Total trout
catch increased 20% relative to 2016 and catch biomass increased 23%. The biomass increase
was the primarily the result of more large Brown Trout in the 2017 sample (mean weight 723 g vs.
555 g in 2016). Brown Trout up to 722 mm (28.4 in.) were captured in 2017 (Figure 3-24), and 7
fish were >457 mm (18 in.)—the most in any sample since monitoring began in 2008. Brown Trout
were added to the stocking program in 2008 and while they have not become abundant, several
fish over 600 mm (23.6 in.) have been captured in previous samples, indicating that those browns
that do survive have excellent growth potential in this tailwater. Rainbow Trout have typically
exhibited a bimodal size distribution, and the 279-305 mm (11-12 in.) and 356-381 mm (14-15 in.)
A large Brown Trout captured during 2017 Boone tailwater monitoring.

113
size classes were most abundant in 2017 (Figure 3-24). However, no Rainbow Trout ≥406 mm
(16 in.) were captured for the first time since monitoring began in 2008. Brook trout, stocked in
2009, 2012, 2014, and 2017 have also grown exceptionally well (three fish >356 mm or 14 in. have
been captured), but none >303 mm were captured in 2017 (Figure 3-24).
The mean electrofishing catch rate for all trout ≥178 mm from the Boone tailwater increased
again in 2017 to 109 fish/h (Figure 3-25), which is above the long-term average of 77 fish/h. The
lack of Rainbow Trout ≥406 mm caused a decline in the catch rate for trout ≥356 mm to 21 fish/h in
2017—the lowest catch rate obtained for these fish except for the 2014 sample (Figure 3-25). The
increased catch of large Brown Trout in 2017 resulted in a higher catch rate for trout ≥457 mm (7
fish/h; Figure 3-25).
Historically, only adult
Rainbow Trout were stocked in
the Ft. Patrick Henry Lake (Boone
tailwater) at annually-variable
rates, averaging 9,700/year
during 1990-2007 (Figure 3-26).
Since 2007, adult Rainbow Trout
stocking rates have averaged
8,600, although only 4,000 were
stocked in 2017 (Figure 3-26).
Fingerling Rainbow Trout were
added to the stocking program in
2008 and have been stocked
most years since then (Figure 3-
26), although their effectiveness
here or in the Ft. Patrick Henry tailwater has not yet been evaluated. Given the Boone tailwater’s
potential to produce large fish, Brown Trout were also added to the program in 2008 and since
then, ~14,000 (primarily 203 mm) have been stocked annually, including 30,000 in 2017 (Figure 3-
26). Brook trout have been stocked occasionally since 2009 (Figure 3-26) and so far have shown
limited survival, but good growth potential.
Repairs to address seepage at the earthen portion of Boone Dam continued in 2017 and
require the extended drawdown of Boone Lake to an elevation of 412 m (1,352’)—3.1 m (10’)
below winter pool. TVA maintains a monitoring station in the tailwater near the dam that records
several water quality parameters at 5-min. intervals. There were no issues with elevated water
temperatures in 2015 or 2016 (Habera et al. 2016, Habera et al. 2017). The Boone tailwater reach
of the South Fork Holston River is listed under TDEC’s water usage classifications (Chapter 0400-
40-04; TDEC 2013) and water quality standards (Chapter 0400-40-03; TDEC 2015) as trout water
with a minimum dissolved oxygen (DO) criterion of 6 mg/l. Although there were no DO issues in
2015 (Habera et al. 2016), DO levels below 6.0 mg/l occurred on all but 7 days during May-July
2016 (often for over 12 h) and on most days in October. Dissolved oxygen did not fall below 3.0
mg/l in 2016, but it was in the 4 mg/l range on 46 days during May-July. Despite these DO
A Brook Trout from the 2017 Boone tailwater sample.
114
depressions in 2016 (likely related to drought conditions and reduced flows during summer and fall
2016), the 2017 trout fishery monitoring results do not indicate any particular effect on the Boone
tailwater trout fishery. TVA’s 2017 water quality monitoring results indicated no particular issues
with water temperature. Daily high temperatures exceeded 21°C during the afternoon of 17 July
and briefly on only four other days. Dissolved oxygen levels were generally better than in 2016,
with observations <6 mg/l occurring on 20 days in July, but only nine days during August-October.
Dissolved oxygen fell below 4.0 mg/l on one day in 2017 (to 3.8 mg/l on 5 July) and was in the 4
mg/l range on only 6 days during July. These conditions are unlikely to have had any notable
effects on the trout fishery. TVA projects that repairs to the dam will be completed sometime
during 2020-2022.
Management Recommendations
The Boone tailwater supports a relatively small trout fishery, but one that consistently—like
the Ft. Patrick Henry tailwater downstream—produces large, well-conditioned trout. Mean Wr is
106 for Rainbow Trout (SE=0.57), 109 for Brown Trout (SE=1.61), and 96 for Brook Trout (SE=
2.89). This fishery is currently subject to statewide trout angling regulations and no changes are
recommended at this time. The current trout stocking rates should be adjusted as more is learned
about this tailwater (particularly survival and recruitment of fingerling Rainbow Trout) and then
maintained. Brook Trout should also be included when possible, as trophy-sized fish can clearly
be produced—an option not available with most other Brook Trout fisheries available to the public.
Additionally, the four monitoring stations should be sampled annually to obtain information
necessary for the future management of this fishery. These basic recommendations will be
incorporated into a trout management plan for the Boone and Ft. Patrick Henry tailwaters (in
preparation during 2017-2018) to ensure that they continue to achieve their potential to provide
exceptional angling opportunities for quality-sized trout. TWRA will also continue to work
cooperatively with TVA to ensure that the Boone Lake drawdown does not impact the tailwater
trout fishery (or the other sport fisheries in the lake).

115
Figure 3-23. Location of the Boone tailwater (South Fork Holston River) monitoring stations.
Boone Tailwater
1 2
3 4

116
Table 3-9 Location and sampling information for the four stations on the Boone tailwater, 16 March 2017.
Station Site Code County Quadrangle Coordinates Reach
Number River Mile
Effort (s) Output
1 420170401 Sullivan Boone Dam 36.44302N-82.43746W 06010102-5,1 18.5 900 200 V DC
198 NW
120 PPS, 4 A
2 420170402 Washington Boone Dam 36.44344N-82.43823W 06010102-5,1 18.5 900 884 V DC
198 NW
120 PPS, 5 A
3 420170403 Sullivan Boone Dam 36.44589N-82.43883W 06010102-5,1 18.2 900 200 V DC
198 NW
120 PPS, 4 A
4 420170404 Sullivan Boone Dam 36.44589N-82.43887W 06010102-5,1 18.2 900 884 V DC
198 NW
120 PPS, 5 A
Table 3-10. Catch data for the four electrofishing stations on the Boone tailwater sampled 16 March 2017.
%
%
Total
Size Range
Total Weight
Abundance
Abundance
Station Species Catch (mm) (g) (number) (weight)
1
Rainbow
4
275-324
1,191
18
11
Brown
11
173-602
7,891
50
76
Brook
7
209-303
1,329
32
13
Totals 22 10,411 100 100
2
Rainbow
17
246-400
8,208
52
77
Brown
8
169-314
902
24
8
Brook
8
236-295
1,518
24
14
Totals 33 10,628 100 100
3
Rainbow
12
284-393
5,245
52
36
Brown
9
178-722
8,945
39
62
Brook
2
248-252
332
9
2
Totals 23 14,522 100 100
4
Rainbow
28
268-400
9,976
90
73
Brown
1
676
3,240
3
24
Brook
2
247-290
420
6
3
Totals 31 13,636 100 100
Total Rainbow
61
246-400
24,620
56
50
Total Brown
29
169-722
20,978
27
43
Total Brook
19
209-303
3,599
17
7
Overall totals 109 49,197 100 100

117
0
5
10
15
20
152 178 203 229 254 279 305 330 356 381 406 432 457 483 508 533 559 584 610 635 660 686 711
Nu
mb
er
of
Fis
h
Length Class (mm)
Rainbow
Brown
Brook
Boone Tailwater
Figure 3-24. Length frequency distributions for trout from the Boone tailwater monitoring stations in 2017.
Rainbow n = 61 246-400 mm
Brown n = 29 169-722 mm
Brook n = 19 209-303

118
0
50
100
150
200
250
2008 2009 2010 2011 2012 2013 2014 2015 2016 2017
CP
UE
(fi
sh
/h)
Year
Rainbow Trout
Brown Trout
Brook Trout
All
0
25
50
75
100
125
2008 2009 2010 2011 2012 2013 2014 2015 2016 2017
CP
UE
(fi
sh
/h)
Year
Rainbow Trout
Brown Trout
All
0
10
20
30
40
2008 2009 2010 2011 2012 2013 2014 2015 2016 2017
CP
UE
(fi
sh
/h)
Year
Rainbow Trout
Brown Trout
All
Boone Tailwater
Trout 178 mm (7 in.)
Trout 356 mm (14 in.)
Trout 457 mm (18 in.)
Figure 3-25. Mean trout CPUEs for the Boone tailwater samples. Bars indicate 90% confidence intervals.
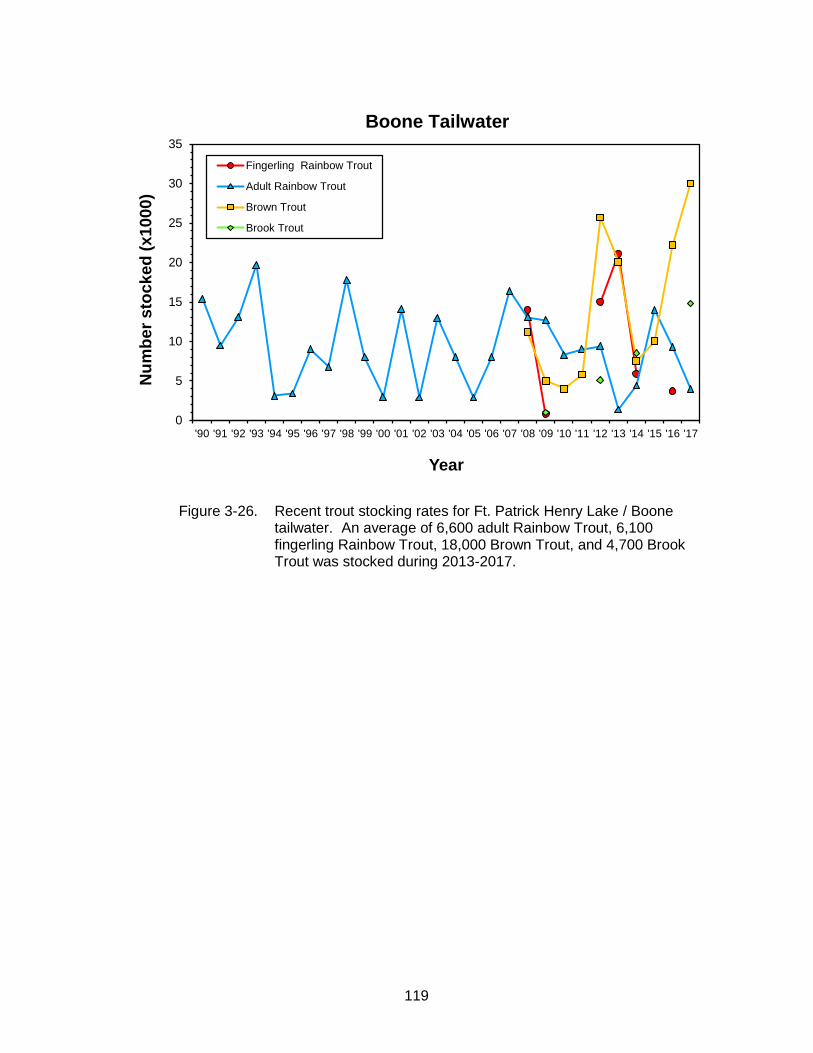
119
0
5
10
15
20
25
30
35
'90 '91 '92 '93 '94 '95 '96 '97 '98 '99 '00 '01 '02 '03 '04 '05 '06 '07 '08 '09 '10 '11 '12 '13 '14 '15 '16 '17
Nu
mb
er
sto
ck
ed
(x1
00
0)
Year
Fingerling Rainbow Trout
Adult Rainbow Trout
Brown Trout
Brook Trout
Figure 3-26. Recent trout stocking rates for Ft. Patrick Henry Lake / Boone tailwater. An average of 6,600 adult Rainbow Trout, 6,100 fingerling Rainbow Trout, 18,000 Brown Trout, and 4,700 Brook Trout was stocked during 2013-2017.
Boone Tailwater

120
3.2.6 South Holston (South Fork Holston River)
Study Area
The South Holston tailwater extends ~22.5 km (13.7 mi.) from South Holston Dam to Boone
Reservoir. The tailwater was created in 1951 when TVA completed construction of the dam at
South Fork Holston River Mile (SFHRM) 49.8 in Sullivan County, Tennessee. The reservoir
upstream of the dam has a drainage area of 1,821 km2 and extends upstream for 38.1 km into
Washington County, Virginia. Much of the watershed is forested and includes portions of the CNF
(Tennessee) and the Jefferson National Forest (Virginia). The tailwater has an average width of 61
m and a surface area of about 137 ha.
TVA addressed low DO levels during summer and fall and a lack of minimum flow in the
tailwater by constructing an aerating labyrinth weir at SFHRM 48.5 in 1991 as part of its Reservoir
Releases Improvement Program. The weir maintains a minimum flow of 2.55 m2/s (90 CFS) and
recovers approximately 40-50% of the oxygen deficit as water passes over it (Yeager et al. 1993).
The turbine is typically pulsed twice daily to maintain the weir pool and these releases are aerated
via turbine venting aided with hub baffles. The weir and turbine improvements combine to help
maintain the target DO concentration of 6 ppm.
The first trout stockings in the South Holston tailwater occurred in 1952 and included
fingerling and adult Rainbow Trout and Brook Trout. Subsequently, annual stockings of adult and
fingerling Rainbow Trout, as well as sub-adult Brown Trout maintained put-and-take and put-and-
grow fisheries. Investigations conducted for TWRA by Bettoli et al. (1999) documented substantial
natural reproduction (particularly by Brown Trout) and an overwintering biomass (80% Brown
Trout) of 170-232 kg/ha. Later, Meerbeek and Bettoli (2005) measured an overwintering Brown
Trout biomass of 207 kg/ha during 2003-2004 (highest among all Tennessee tailwaters). Mork’s
(2011) study of large (>460 mm) Brown Trout movement in the Boone Lake system verified that
some South Holston fish use the reservoir in winter and spring (but not fish from the Wilbur
tailwater) and that there was no intermingling of fish from those two populations. No Brown Trout
have been stocked in the South Holston tailwater since 2003 because of the excellent wild Brown
Trout fishery that has developed. Rainbow Trout continue to be managed as both a put-and-take
and put-and-grow fishery by stocking 40,000 adults and 50,000 fingerlings annually (Habera et al.
2015c).
Management strategy for the South Holston tailwater shifted to a focus on the wild Brown
Trout fishery with better biological information and corresponding angler support. All snagging was
banned in 1999 and two major trout spawning areas were closed to fishing during November-
January. These measures were taken to protect large Brown Trout during the spawning season
and to facilitate development of a self-sustaining fishery. A 406-559 mm (16-22 in.) protected
length range (PLR) or “slot limit” was established for the entire tailwater in 2000 with the goal of
shifting population structure toward larger fish and protecting spawners (primarily Brown Trout).
Slot limits of this type have been shown to be effective at improving trout population size structures
(Luecke et al. 1994; Power and Power 1996).
A large South Holston brown from the 2003 sample.

121
TWRA established two monitoring sites on the South Holston tailwater in 1995 (Bivens et
al. 1996) and sampled these annually during the summer (at base flow) to begin compiling a
database on the existing trout fishery. These sites were replaced in 1999 with the 12 stations
(Figure 3-27) and protocol established by Bettoli et al. (1999). Current sample site location and
effort details are summarized in Table 3-11.
Results and Discussion
The 12 South Holston tailwater monitoring stations produced 584 trout weighing 160 kg in
2017 (Table 3-12). Brown Trout catch declined again—11% relative to 2016—and biomass
decreased 10%. Brown Trout represented 88% of the sample by number and 87% by biomass in
2017, which is similar to samples from recent years. Thirty-two sub-adult Brown Trout ≤127 mm
were captured in 2017—the most since 2012. This relatively crude indicator of year class strength
(for the preceding year) suggests that a relatively large cohort may be entering the population,
which contributes to density-dependent effects on growth and recruitment, particularly given the
low levels of angler exploitation.
Brown Trout exhibited a bimodal length frequency distribution, with modes at the 152- and
279-mm classes (Figure 3-28). Fish in the 229-330 mm (9-13 in.) size classes represented 59% of
the total Brown Trout sample in 2016 and again in 2017 (Figure 3-28), which is down from the peak
average of 69% during 2011-2015. There was also better recruitment into the size classes
approaching the PLR (356 and 381 mm) again in 2017, although the catch for fish in the PLR
decreased from 20 in 2016 to 15 in 2017 (Figure 3-28). The average PLR catch for 2010-2017 is
20 fish, but was twice as high (48) during 2004-2009.
Relative stock density for all trout ≥406 mm (RSD-16) —based on a stock size of 254 mm
(Willis et al. 1993)—declined slightly to 4 in 2017, but has remained at ≤5 since 2010 (Figure 2-29).
Prior to any influence from the PLR regulations (1997, 1999-2000) RSD-16 averaged 15 with a
corresponding mean CPUE of 106 fish/h (178 mm). Following establishment of the PLR, RSD-16
reached 18 in 2006 (Figure 2-29), but has declined since then (Figure 2-29) as total CPUE has
generally ranged from 250-400 fish/h (178 mm). Current trout population size structures,
therefore, do not indicate a shift toward larger fish—one of the original intents of the PRL. The
Norris tailwater PLR (356-508 mm or 14-20 in.), by comparison, has successfully altered trout
population size structures in favor of lager fish and maintained that shift (see Section 3.2.1).
Recent angler surveys indicate that the trout harvest rate for both tailwaters is low (Norris, 0.98
fish/trip; South Holston, 1.04 fish/trip), with pressure at Norris (12,249 trips) about half that
estimated for South Holston (24,285 trips; Black 2014, 2015).
Mean CPUE for trout 178 mm (total) declined again to 254 fish/h in 2017—the lowest level
since 2006 (Figure 3-30). The 2017 mean catch rate for Brown Trout 178 mm (219 fish/h; Figure
3-30) also decreased again, but still somewhat exceeds the range considered in the new
management plan to be more conducive to recruitment into the PLR (150-200 fish/h; Habera et al.
2015c). The mean catch rate for Rainbow Trout 178 mm was 35 fish/h in 2017 (Figure 3-30) and
43 fish/h for the past three years—relatively close to the current management plan objective is ≥50

122
fish/h (Habera et al. 2015c). Trout 356 mm are considered to be “quality”-sized fish and the mean
catch rate for these fish peaked at 72 fish/h in 2005, but has generally declined since then,
although there has been an increase from 23 to 43 fish/h during the past two years (Figure 3-30).
The catch rate for trout in the PLR (406-559 mm) has also declined from its peak of 29 fish/h in
2006, averaging 12 fish/h since 2009 (Figure 3-30).
The substantial (3- to 4-fold) increase in trout abundance since the late 1990s (particularly
for wild browns) appears to have affected growth (Bohlin et al. 2002; Vøllestad et al. 2002; Lobon-
Cervia 2007) and recruitment (Walters and Post 1993)—particularly to larger size classes—as
increasing numbers of fish compete for food resources that tend to limit salmonid populations in
tailwaters and unregulated streams (e.g., Filbert and Hawkins 1995; Ensign et al. 1990; Korman et
al. 2017). Although mean relative weights (Wr) for Brown Trout in the size classes immediately
below the PLR (305-405 mm) were typically >90 prior to 2007, there was a general decline through
2015 as overall abundance increased (Figure 3-31). The effect of overcrowding is particularly
evident for fish in the 300-400 mm size range based on the relationship of Wr and total length
(Figure 3-32). Mean Wr for Brown Trout in the PLR has also generally declined since 2005,
reaching its lowest level in 2017 (85; Figure 3-31). This suggests that the abundance of trout in the
river has affected condition and thereby limited growth and recruitment into the PLR. Korman et al.
(2017) related poor condition of larger Rainbow Trout in the Glen Canyon tailwater (AZ) to low
fall/winter survival rates. Yard et al. (2015) observed that the highest growth and relative condition
for Rainbow Trout in Glen Canyon tailwater (AZ) occurred in areas with lower densities. Similarly,
McKinney et al. (2001) reported that increased abundance of Rainbow Trout in the Lee’s Ferry
tailwater, AZ (resulting from higher, more stable flows) was accompanied by reduced relative
condition, particularly for fish ≥305 mm. Dibble et al. (2015) also found that Brown Trout length
declined when large cohorts recruited to adult size in western tailwaters. Additionally, Fox and
Neal (2011) saw depressed largemouth bass Micropterus salmoides Wr at intermediate sizes as
the population—managed with a 356-508 mm PLR—became overcrowded.
Management Recommendations
The South Holston’s exceptional wild Brown Trout fishery provides the primary means for
attaining the tailwater’s management goal, which continues to be providing a high-quality trout
fishery and the variety of angling opportunities it offers (Habera et al. 2015c). These fish have
undoubtedly helped produce the high angler catch rates and satisfaction levels mentioned above.
Rainbow Trout are also an important part of the fishery, which is being sustained through
consistent annual stocking rates for adults and fingerlings.
The mean PLR catch rate during 2009-2014 (13 fish/h) did not achieve the corresponding
management plan objective (25 fish/h; Habera et al. 2009c). Currently, density-dependent factors
continue to limit Brown Trout growth, condition, and recruitment into the larger size classes (i.e.,
the PLR), thus there is no enhancement of population size structure relative to pre-PLR conditions.
Dreves et al. (2016) used a 508-mm (20-in.) minimum size limit and 1 fish/day creel limit to improve
the size structure of Brown Trout (particularly for fish ≥381 mm) in the Lake Cumberland tailwater
(KY) without incurring density-dependent impacts to growth and condition. Although overall Brown

123
Trout CPUE there increased 3-fold over 10 years, it remained relatively low (89 fish/h) and most
likely below the carrying capacity of the tailwater (Dreves et al. 2016); density-dependent
responses, therefore, were not triggered. Additionally, the Cumberland Lake tailwater Brown Trout
fishery is hatchery supported, thus providing essentially stable recruitment annually (as in the
Norris tailwater). Ultimately, if food availability and fish growth are limited in tailwater trout fisheries
(e.g., in high abundance populations), then restrictive angling regulations may be unsuccessful
(Flinders and Magoulick 2017).
When overall trout abundance in the South Holston tailwater is relatively high (CPUE >200
fish/h) and the angler harvest rate for Brown Trout remains extremely low (3.5%; Black 2015), it is
unlikely that RSD-16 will improve much. In fact, current trout abundance would require doubling
the 2017 catch for trout ≥406 mm or 16 in. from 20 to 42 to raise RSD-16 to 10, which would still be
below the pre-PLR mean of 15. Although RSD target values have not been defined for balanced
Brown Trout populations (Pedicillo et al. 2010), RSD-16 for South Holston tailwater Brown Trout
has reached the 15-20 range both before and after (2005-2007) establishment of the PLR
regulation. Achieving and maintaining an RSD-16 of ~15 (mostly composed of Brown Trout) would
more closely align with the basic management goal of providing a high-quality trout fishery (Habera
et al. 2015c).
Factors that impact trout year-class strength, such as high flows, can reduce density-
dependent effects on growth, condition, and recruitment. Any such events in the South Holston
tailwater have had minimal effects on Brown Trout year-class strength, as cohorts produced during
the past several years have been sufficient to substantially increase abundance—even with
declining numbers of large spawners. Brown Trout spawning activity in the South Holston tailwater
begins during early November and peaks in mid to late-December (Banks and Bettoli 2000). A
somewhat earlier spawning season (mid-October through November) was observed for Brown
Trout in the White River (AR) tailwater, with emergence there beginning at the end of February
(Pender and Kwak 2002). Fry emergence in the South Holston tailwater has not been studied, but
likely occurs in March or early April (based on spawning period). Dibble et al. (2015) observed that
Brown Trout recruitment was affected most by flow velocity, and that high levels of recruitment
indirectly reduce fish size. Therefore, management actions that can decrease Brown Trout
recruitment when necessary, such as altering dam operations (i.e., to produce high flows) could
help maintain more stable trout populations with larger adults through relaxed intraspecific
competition (Dibble et al. 2015) and avoidance of boom-and-bust cycles (Korman et al. 2017).
Pender and Kwak (2002) observed age-0 tailwater Brown Trout using gravel interstices as refugia
from high velocities at the onset of water releases, so velocities would have to be high enough or
the fish vulnerable enough for high flows to be effective. This timeframe would likely occur just
after emergence (March-April) in the South Holston tailwater, although it coincides with the refill
period on TVA’s guide curve for South Holston Lake. Interestingly, extended marginally-high flows
(20-50% above average) actually improved development of large cohorts or Rainbow Trout in the
Glen Canyon tailwater (Avery et al. 2015).
Angler catch rates for Brown Trout (137,000 total, 5.6/trip in 2014; Black 2015) appear high
enough that harvest could help control population size and improve growth, condition, and

124
recruitment into the PLR, thus anglers are encouraged to harvest 229-305 mm (9-12 inch) Brown
Trout. Harvesting fish below the lower boundary of a PLR is necessary to prevent overcrowding;
without sufficient exploitation, stockpiling occurs and the regulation becomes ineffective (Wilde
1997; Noble and Jones 1999; Fox and Neal 2011). However, if anglers are generally satisfied with
the increased Brown Trout abundance and higher associated catch rates that exist now, then they
may not be concerned by the current ineffectiveness of the PLR.
A new roving creel survey was conducted on the South Holston tailwater during 2017.
During this survey, anglers were asked to rate their satisfaction with the trout fishery on a scale of 1
(poor) to 5 (excellent). A majority (87%) of the 454 anglers responding rated their satisfaction as
good or excellent (4 or 5), while another 10% gave a rating of 3 (o.k.). These anglers were also
informed that 9-12 inch Brown Trout had become very abundant in the fishery over the past
several years, that the overall angler harvest rate was low (<5%), and that PLR regulations work
best when fish below the ‘slot’ are harvested. They were then asked if they would increase their
harvest of smaller (9-12 inch) fish given that it would help improve the size structure of the Brown
Trout population. Although there was not a majority position, more anglers (44%) said they would
increase Brown Trout harvest than those who said they would not (40%), while 16% offered no
opinion. Additional results, including estimated angling pressure, catch, and harvest rates, will be
available for inclusion in the 2018 report.
Because of the presence of whirling disease Myxobolus cerebralis in Virginia and nearby
North Carolina trout fisheries—and the popularity of the South Holston tailwater with anglers from
those areas, 53 Rainbow Trout and 13 Brown Trout captured during 2017 were submitted to the
U.S. Fish and Wildlife Service’s Fish Health Lab in Warm Springs, GA to be screened for this
pathogen. Whirling disease was confirmed in Rainbow Trout and TWRA will move forward with
information and education efforts directed at preventing the spread of spores and infected fish, as
well as screening of additional trout fisheries in 2018.

125
South Holston Tailwater
Figure 3-27. Locations of the South Holston tailwater (South Fork Holston River) monitoring stations.
Bottom Creek
Spawning area closed to fishing
Nov.-Jan.
Spawning area closed to fishing
Nov.-Jan.
Webb Bridge
Weaver Pike Bridge
Labyrinth Weir
12
11
10
9
8
7
6
5
4
3
2
1
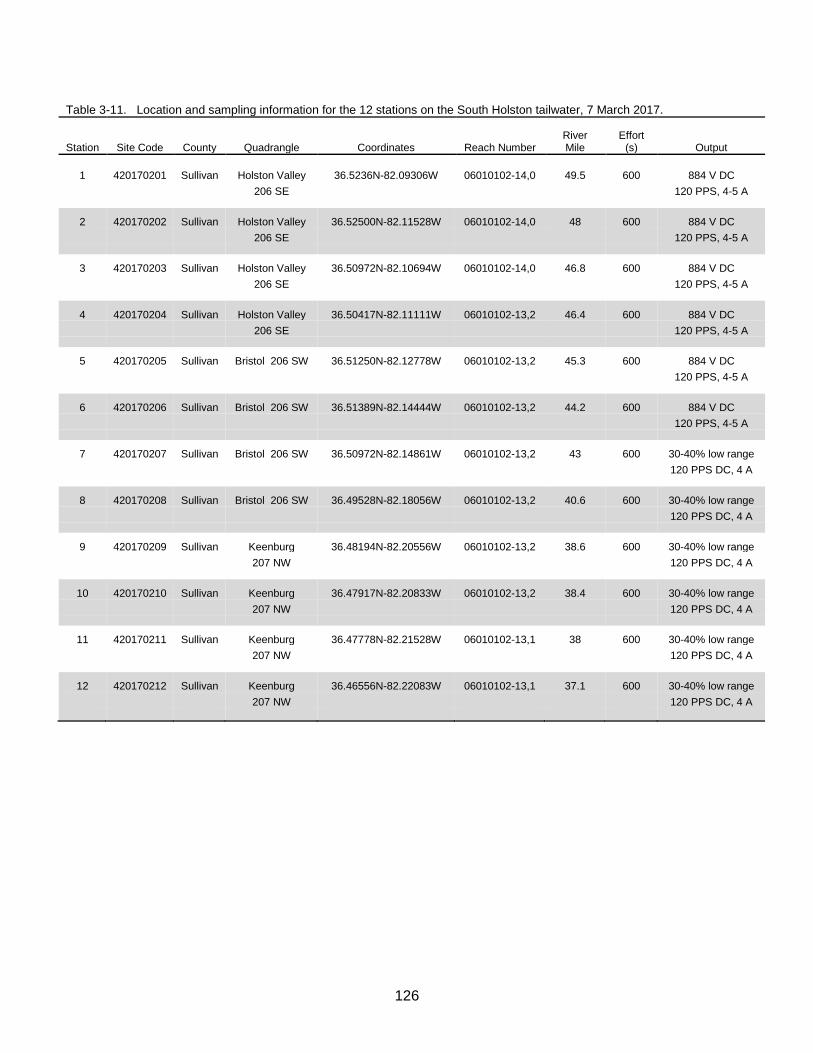
126
Table 3-11. Location and sampling information for the 12 stations on the South Holston tailwater, 7 March 2017.
Station Site Code County Quadrangle Coordinates Reach Number River Mile
Effort (s) Output
1 420170201 Sullivan Holston Valley 36.5236N-82.09306W 06010102-14,0 49.5 600 884 V DC
206 SE
120 PPS, 4-5 A
2 420170202 Sullivan Holston Valley 36.52500N-82.11528W 06010102-14,0 48 600 884 V DC
206 SE
120 PPS, 4-5 A
3 420170203 Sullivan Holston Valley 36.50972N-82.10694W 06010102-14,0 46.8 600 884 V DC
206 SE
120 PPS, 4-5 A
4 420170204 Sullivan Holston Valley 36.50417N-82.11111W 06010102-13,2 46.4 600 884 V DC
206 SE
120 PPS, 4-5 A
5 420170205 Sullivan Bristol 206 SW 36.51250N-82.12778W 06010102-13,2 45.3 600 884 V DC
120 PPS, 4-5 A
6 420170206 Sullivan Bristol 206 SW 36.51389N-82.14444W 06010102-13,2 44.2 600 884 V DC
120 PPS, 4-5 A
7 420170207 Sullivan Bristol 206 SW 36.50972N-82.14861W 06010102-13,2 43 600 30-40% low range
120 PPS DC, 4 A
8 420170208 Sullivan Bristol 206 SW 36.49528N-82.18056W 06010102-13,2 40.6 600 30-40% low range
120 PPS DC, 4 A
9 420170209 Sullivan Keenburg 36.48194N-82.20556W 06010102-13,2 38.6 600 30-40% low range
207 NW
120 PPS DC, 4 A
10 420170210 Sullivan Keenburg 36.47917N-82.20833W 06010102-13,2 38.4 600 30-40% low range
207 NW
120 PPS DC, 4 A
11 420170211 Sullivan Keenburg 36.47778N-82.21528W 06010102-13,1 38 600 30-40% low range
207 NW
120 PPS DC, 4 A
12 420170212 Sullivan Keenburg 36.46556N-82.22083W 06010102-13,1 37.1 600 30-40% low range
207 NW
120 PPS DC, 4 A

127
Table 3-12. Catch data for the12 electrofishing stations on the South Holston tailwater sampled 7 March 2017.
%
%
Total
Size Range
Total Weight
Abundance
Abundance
Station Species Catch (mm) (g) (number) (weight)
1
Rainbow
8
278-480
4,411
100
100
Brown
0
--
0
0
0
Totals 8 4,411 100 100
2
Rainbow
10
250-479
3,698
14
21
Brown
60
112-410
13,711
86
79
Totals 70 17,409 100 100
3
Rainbow
5
173-298
960
6
7
Brown
72
110-360
12,755
94
93
Totals 77 13,715 100 100
4
Rainbow
4
329-351
1,431
7
9
Brown
55
94-412
13,808
93
91
Totals 59 15,239 100 100
5
Rainbow
9
166-390
1,987
24
27
Brown
29
119-565
5,292
76
73
Totals 38 7,279 100 100
6
Rainbow
5
231-335
1,368
9
9
Brown
49
172-370
13,714
91
91
Totals 54 15,082 100 100
7
Rainbow
5
233-325
1,195
11
9
Brown
41
141-498
12,500
89
91
Totals 46 13,695 100 100
8
Rainbow
11
214-347
2,166
27
16
Brown
30
180-487
11,744
73
84
Totals 41 13,910 100 100
9
Rainbow
0
--
0
0
0
Brown
66
123-478
16,994
100
100
Totals 66 16,994 100 100
10
Rainbow
0
--
0
0
0
Brown
22
151-400
7,660
100
100
Totals 22 7,660 100 100
11
Rainbow
7
163-334
1,290
13
8
Brown
45
168-536
14,858
87
92
Totals 52 16,148 100 100
12
Rainbow
7
255-417
2,554
14
14
Brown
44
214-406
16,178
86
86
Totals 51 18,732 100 100
Total Rainbows
71
163-480
21,060
12
13
Total Browns
513
94-565
139,214
88
87
Overall totals 584 160,274 100 100

128
0
20
40
60
80
100
76 102 127 152 178 203 229 254 279 305 330 356 381 406 432 457 483 508 533 559
Nu
mb
er
of
Fis
h
Length Class (mm)
Rainbow
Brown
Brown Trout n = 513 Range: 94-565 mm
Figure 3-28. Length frequency distributions for trout from the South Holston tailwater monitoring stations in 2017.
Rainbow Trout n = 71 Range: 163-480 mm
South Holston Tailwater
Protected slot: 406-559 mm
(16-22”); n = 19

129
0
10
20
30
40
50
0
100
200
300
400
500
'97 '98 '99 '00 '01 '02 '03 '04 '05 '06 '07 '08 '09 '10 '11 '12 '13 '14 '15 '16 '17
RS
D -
16
CP
UE
(f
ish
/h)
Year
CPUE ≥178 mm
RSD-16 All Trout
South Holston Tailwater
Figure 3-29. Comparison of mean CPUE (fish/h) for all trout ≥178 mm and RSD-16 (all trout) for the South Holston tailwater.

130
0
100
200
300
400
500
'97 '98 '99 '00 '01 '02 '03 '04 '05 '06 '07 '08 '09 '10 '11 '12 '13 '14 '15 '16 17
CP
UE
(fi
sh
/h)
Year
Rainbows
Browns
All
0
20
40
60
80
100
'97 '98 '99 '00 '01 '02 '03 '04 '05 '06 '07 '08 '09 '10 '11 '12 '13 '14 '15 '16 '17
CP
UE
(fi
sh
/h)
Year
Rainbows
Browns
All
0
10
20
30
40
50
'97 '98 '99 '00 '01 '02 '03 '04 '05 '06 '07 '08 '09 '10 '11 '12 '13 '14 '15 '16 17
CP
UE
(fi
sh
/h)
Year
Rainbows
Browns
All
South Holston Tailwater
Trout 178 mm (7”)
Trout 356 mm (14”)
Trout 406-559 mm (16-22”)
PLR (406-559 mm)
established
Figure 3-30. Mean trout CPUEs for the South Holston tailwater samples. Bars indicate 90% confidence intervals.

131
70
80
90
100
110
'97 '98 '99 '00 '01 '02 '03 '04 '05 '06 '07 '08 '09 '10 '11 '12 '13 '14 '15 '16 '17
Me
an
Wr
Year
Brown PLR (16-22 in.)
Brown under PLR (12-16 in.)
y = 0.0001x2 - 0.1019x + 110.39 R² = 0.0602
0
20
40
60
80
100
120
140
160
180
0 100 200 300 400 500 600 700 800
Bro
wn
Tro
ut
Wr
Length (mm)
Figure 3-31. Mean relative weights (Wr) for brown trout from the South Holston tailwater. Bars indicate 90% confidence intervals.
South Holston Tailwater
Figure 3-32. Relative weights (Wr) for brown trout from the South Holston Tailwater (2009-2016). Solid curved line is polynomial trend line and dashed line is optimum Wr of 100.
N =8,595

132
REFERENCES
Adams, S. B., C. A. Frissell, and B. E. Rieman. 2002. Changes in distribution of nonnative brook
trout in an Idaho drainage over two decades. Transactions of the American Fisheries
Society 131:561-568.
Anderson, R. O. 1976. Management of small warm water impoundments. Fisheries 1(6):561-568.
Anglin, Z. W., and G. D. Grossman. 2013. Microhabitat use by southern brook trout (Salvelinus
fontinalis) in a headwater North Carolina stream. Ecology of Freshwater Fish 22:567-577.
Avery, L. A., J. Korman, and W. R. Persons. 2015. Effects of increased discharge on spawning and
age-0 recruitment of Rainbow Trout in the Colorado River at Lees Ferry, Arizona. North
American Journal of Fisheries Management 35:671-680.
Baird, O. E., and C. C. Krueger. 2003. Behavioral thermoregulation of brook and Rainbow Trout:
comparison of summer habitat use in an Adirondack river, New York. Transactions of the
American Fisheries Society 132:1194-1206.
Banks, S. M., and P. W. Bettoli. 2000. Reproductive potential of Brown Trout in Tennessee
tailwaters. Fisheries Report No. 00-19. Tennessee Wildlife Resources Agency, Nashville,
Tennessee.
Bettinger, J. M., and P. W. Bettoli. 2000. Movements and activity of Rainbow Trout and Brown
Trout in the Clinch River, Tennessee, as determined by radio-telemetry. Fisheries Report
No. 00-14. Tennessee Wildlife Resources Agency, Nashville, Tennessee.
Bettoli, P. W. 1999. Creel survey and population dynamics of salmonids stocked into the Watauga
River below Wilbur Dam. Fisheries Report No. 99-41. Tennessee Wildlife Resources
Agency, Nashville, Tennessee.
Bettoli, P. W. 2002. Clinch River creel survey results: March-October 2001. Fisheries Report No.
02-01. Tennessee Wildlife Resources Agency, Nashville, Tennessee.
Bettoli, P. W. 2003a. Survey of the trout fishery in the Watauga River: March-October 2002.
Fisheries Report No. 03-05. Tennessee Wildlife Resources Agency, Nashville, Tennessee.
Bettoli, P. W. 2003b. Survey of the trout fishery in the South Fork of the Holston River, March-
October 2002. Fisheries Report No. 03-06. Tennessee Wildlife Resources Agency,
Nashville, Tennessee.
Bettoli, P. W. 2006. Clinch River creel survey results: April-October 2005. Fisheries Report No.
06-08. Tennessee Wildlife Resources Agency, Nashville, Tennessee.

133
Bettoli, P. W. 2007. Surveys of the trout fisheries in the Watauga River and South Fork of the
Holston River: March-October 2005. Fisheries Report No. 07-07. Tennessee Wildlife
Resources Agency, Nashville, Tennessee.
Bettoli, P. W., and L. A. Bohm. 1997. Clinch River trout investigations and creel survey. Fisheries
Report No. 97-39. Tennessee Wildlife Resources Agency, Nashville, Tennessee.
Bettoli, P. W., S. J. Owens, and M. Nemeth. 1999. Trout habitat, reproduction, survival, and growth
in the South Fork of the Holston River. Fisheries Report No. 99-3. Tennessee Wildlife
Resources Agency, Nashville, Tennessee.
Bivens, R. D. 1979. Survey of brook trout streams on the Unaka and Nolichucky Ranger Districts,
Cherokee National Forest. Internal project report, U.S. Department of Agriculture Forest
Service, Cleveland, Tennessee.
Bivens, R. D. 1988. Region IV stream fishery data collection report: 1986-1987. Tennessee
Wildlife Resources Agency, Nashville, Tennessee.
Bivens, R. D. 1989. Region IV stream fishery data collection report: 1988. Tennessee Wildlife
Resources Agency, Nashville, Tennessee.
Bivens, R. D., and C. E. Williams. 1990. Region IV stream fishery data collection report: 1989.
Tennessee Wildlife Resources Agency, Nashville, Tennessee.
Bivens, R. D., M. T. Fagg, and C. E. Williams. 1992. Region IV trout fishery data collection report:
1991. Fisheries Report No. 93-17. Tennessee Wildlife Resources Agency, Nashville,
Tennessee.
Bivens, R. D., B. D. Carter, and C. E. Williams. 1996. Region IV trout fisheries report: 1995.
Fisheries Report No. 96-5. Tennessee Wildlife Resources Agency, Nashville, Tennessee.
Bivens, R. D., B. D. Carter, and C. E. Williams. 1998. Region IV trout fisheries report: 1997.
Fisheries Report 98-3. Tennessee Wildlife Resources Agency, Nashville, Tennessee.
Black, W. P. 2014. Tennessee Statewide Creel Survey: 2013 Results. Final report, Tennessee
Wildlife Resources Agency, Nashville, Tennessee.
Black, W. P. 2015. Tennessee Statewide Creel Survey: 2014 Results. Final report, Tennessee
Wildlife Resources Agency, Nashville, Tennessee.
Black, W. P. 2017. Tennessee Statewide Creel Survey: 2016 Results. Fisheries Report 17-07.
Tennessee Wildlife Resources Agency, Nashville, Tennessee.
Bohlin, T., L. F. Sundström, J. I. Johnsson, J. Höjesjö, and J. Pettersson. 2002. Density-dependent
growth in Brown Trout: effects of introducing wild and hatchery fish. Journal of Animal
Ecology 71:683-692.

134
Boles, H. D. 1980. Clinch River (Norris tailwater) trout fishery investigations 1971-1977. Fisheries
Resources Internal Report (Interim Summary Report). U. S. Department of Interior, Fish and
Wildlife Service.
Borawa, J. C. 1990. Field evaluation of domestic versus half-wild brown trout fingerling stockings.
Pages 72-78 in J. C. Borawa, ed. Brown trout workshop: biology and management.
American Fisheries Society, Southern Division, Trout Committee, Asheville, North Carolina.
Bowlby, J. N., and J. C. Roff. 1986. Trout biomass and habitat relationships in southern Ontario
streams. Transactions of the American Fisheries Society 115:503-514.
Carline, R. F., and B. J. McCullough. 2003. Effects of floods on brook trout populations in the
Monongahela National Forest, West Virginia. Transactions of the American Fisheries
Society 132:1014-1020.
Clark, M. E., and K. A. Rose. 1997. Factors affecting competitive dominance of Rainbow Trout over
brook trout in southern Appalachian streams: implications of an individual-based model.
Transactions of the American Fisheries Society 126:1-20.
Clark, M. E., K. A. Rose, D. A. Levine, and W. W. Hargrove. 2001. Predicting climate change
effects on Appalachian trout: combining GIS and individual-based modeling. Ecological
Applications 11(1):161-178.
Cook, S. B. and T. C. Johnson. 2016. Assessment of southern Appalachian brook trout
propagation as a tool for restoring Tennessee populations. Final report, Department of
Biology and the Center for the Management, Protection and Utilization of Water Resources,
Tennessee Technological University, Cookeville, Tennessee.
Damer, J., and P. W. Bettoli. 2008. The fate of brook trout stocked in the Watauga River below
Wilbur Dam. Fisheries Report No. 08-03. Tennessee Wildlife Resources Agency, Nashville,
Tennessee.
Davis, L., and T. Wagner. 2016. Scale-dependent seasonal pool habitat use by sympatric wild
brook trout and Brown Trout populations. Transactions of the American Fisheries Society
145:888-902.
DeWeber, J. T., and T. Wagner. 2015. Predicting brook trout occurrence in stream reaches
throughout their native range in the eastern United States. Transactions of the American
Fisheries Society 144:11-24.
Dibble, K. L., C. B. Yackulic, T. A. Kennedy, and P. Budy. 2015. Flow management and fish density
regulate salmonid recruitment and adult size in tailwaters across western North America.
Ecological Applications 25:2168-2179.

135
Dodrill, M. J., C. B. Yackulic, T. A. Kennedy, and J. W. Hayes. 2016. Prey size and availability
limits maximum size of Rainbow Trout in a large tailwater: insights from a drift-foraging
bioenergetics model. Canadian Journal of Fisheries and Aquatic Sciences 73(5):1-14.
Dreves, D. P., J. R. Ross, and J. T. Kosa. 2016. Effect of trophy regulations and reservoir
discharge on a population of stocked Brown Trout in a large, southeastern United States
tailwater. Journal of the Southeastern Association of Fish and Wildlife Agencies 3:167-177.
Elliott, J. M. 2000. Pools as refugia for Brown Trout during two summer droughts: trout responses
to thermal and oxygen stress. Journal of Fish Biology 56:938-948.
Ensign, W. E., R. J. Strange, and S. E. Moore. 1990. Summer food limitation reduces brook and
Rainbow Trout biomass in a southern Appalachian stream. Transactions of the American
Fisheries Society 119:894-901.
Filbert, R. B, and C. P. Hawkins. 1995. Variation in condition of Rainbow Trout in relation to food,
temperature, and individual length in the Green River, Utah. Transactions of the American
Fisheries Society 124:824-835.
Fiss, F. C., and J. W. Habera, editors. 2006. Trout management plan for Tennessee 2006-2016.
Tennessee Wildlife Resources Agency, Nashville, Tennessee
Flinders, J. M., and D. D. Magoulick. 2017. Spatial and temporal consumption dynamics of trout in
catch-and-release areas in Arkansas tailwaters. Transactions of the American Fisheries
Society 146:432-499.
Fox, C. N., and J. W. Neal. 2011. Development of a crowded largemouth bass population in a
tropical reservoir. Proceedings of the Annual Conference of the Southeastern Association of
Fish and Wildlife Agencies. 65:98-104.
Habera, J. W., R. J. Strange, and R. D. Bivens. 2001a. A revised outlook for Tennessee’s brook
trout. Journal of the Tennessee Academy of Science 76:68-73.
Habera, J. W., R. D. Bivens, B. D. Carter, and C. E. Williams. 2001b. Region IV trout fisheries
report: 2000. Fisheries Report No. 01-03. Tennessee Wildlife Resources Agency,
Nashville, Tennessee.
Habera, J. W., R. D. Bivens, B. D. Carter, and C. E. Williams. 2003. Region IV trout fisheries
report: 2002. Fisheries Report No. 03-03. Tennessee Wildlife Resources Agency,
Nashville, Tennessee.
Habera, J. W., R. D. Bivens, B. D. Carter, and C. E. Williams. 2004. Region IV trout fisheries
report: 2003. Fisheries Report No. 04-04. Tennessee Wildlife Resources Agency,
Nashville, Tennessee.

136
Habera, J. W., R. D. Bivens, B. D. Carter, and C. E. Williams. 2006. Region IV trout fisheries
report: 2005. Fisheries Report No. 06-01. Tennessee Wildlife Resources Agency,
Nashville, Tennessee.
Habera, J. W., R. D. Bivens, B. D. Carter, and C. E. Williams. 2008. Region IV trout fisheries
report: 2007. Fisheries Report No. 08-01. Tennessee Wildlife Resources Agency,
Nashville, Tennessee.
Habera, J. W., R. D. Bivens, B. D. Carter, and C. E. Williams. 2009a. Region IV trout fisheries report: 2008. Fisheries Report No. 09-01. Tennessee Wildlife Resources Agency, Nashville, Tennessee.
Habera, J. W., R. D. Bivens, and B. D. Carter. 2009b. Management plan for the Wilbur tailwater
trout fishery 2009-2014. Tennessee Wildlife Resources Agency, Nashville, Tennessee. Habera, J. W., R. D. Bivens, and B. D. Carter. 2009c. Management plan for the South Holston
tailwater trout fishery 2009-2014. Tennessee Wildlife Resources Agency, Nashville, Tennessee.
Habera, J. W., M. A. Kulp, S. E. Moore, and T. B. Henry. 2010. Three-pass depletion sampling
accuracy of two electric fields for estimating trout abundance in a low-conductivity stream with limited habitat complexity. North American Journal of Fisheries Management 30:757-766.
Habera, J. W., R. D. Bivens, B. D. Carter, and C. E. Williams. 2011. Region IV trout fisheries
report: 2010. Fisheries Report No. 11-01. Tennessee Wildlife Resources Agency, Nashville, Tennessee.
Habera, J. W., R. D. Bivens, B. D. Carter, and C. E. Williams. 2012. Region IV trout fisheries
report: 2011. Fisheries Report No. 12-01. Tennessee Wildlife Resources Agency, Nashville, Tennessee.
Habera, J. W., R. D. Bivens, B. D. Carter, and C. E. Williams. 2014a. Region IV trout fisheries
report: 2013. Fisheries Report No. 14-01. Tennessee Wildlife Resources Agency, Nashville, Tennessee.
Habera, J. W., R. D. Bivens, and B. D. Carter. 2014b. Management plan for the Norris Tailwater
trout fishery 2014-2019. Tennessee Wildlife Resources Agency, Nashville, Tennessee.
Habera, J. W., R. D. Bivens, B. D. Carter, and C. E. Williams. 2015a. Region IV trout fisheries report: 2014. Fisheries Report No. 15-01. Tennessee Wildlife Resources Agency, Nashville, Tennessee.
Habera, J. W., R. D. Bivens, and B. D. Carter. 2015b. Management plan for the Wilbur Tailwater
trout fishery 2015-2020. Tennessee Wildlife Resources Agency, Nashville, Tennessee.
Habera, J. W., R. D. Bivens, and B. D. Carter. 2015c. Management plan for the South Holston
Tailwater trout fishery 2015-2020. Tennessee Wildlife Resources Agency, Nashville,
Tennessee.

137
Habera, J. W., R. D. Bivens, B. D. Carter, and C. E. Williams. 2016. Region IV trout fisheries report: 2015. Fisheries Report No. 16-04. Tennessee Wildlife Resources Agency, Nashville, Tennessee.
Habera, J. W., R. D. Bivens, B. D. Carter, and C. E. Williams. 2017. Region IV trout fisheries
report: 2016. Fisheries Report No. 17-02. Tennessee Wildlife Resources Agency, Nashville, Tennessee.
Habera, J. W., and B. D. Carter. 2008. Access denied: keeping the rainbows out of Left Prong.
Tennessee Wildlife 31(6):21-24.
Habera, J. W. and S. E. Moore. 2005. Managing southern Appalachian brook trout: a position
statement. Fisheries 30(7):10-20.
Harris, A. 2010. Trout fishing in 2006: a demographic description and economic analysis
(addendum to the 2006 National Survey of Fishing, Hunting, and Wildlife-Associated
Recreation). Report 2006-6. U.S. Fish and Wildlife Service, Arlington, Virginia.
Higgins, J. M. 1978. Water quality progress in the Holston River basin. TVA Division of
Environmental Planning, Chattanooga, Tennessee. TVA/EP-78/08.
Hill, D. M. 1978. Tailwater trout management. Pages 66-75 in Southeastern trout resource:
ecology and management symposium proceedings. USDA Forest Service, Southeastern
Forest Experiment Station, Asheville, North Carolina.
Hill, D. M., and S. R. Brown. 1980. The fishery resource of Tennessee Valley tailwaters—
Cherokee. TVA Division of Water Resources, Norris, Tennessee.
Holbrook, C., and P. W. Bettoli. 2006. Spawning habitat, length at maturity, and fecundity of Brown
Trout in Tennessee tailwaters. Fisheries Report No. 06-11. Tennessee Wildlife Resources
Agency, Nashville, Tennessee.
Hoxmeier, R. J. H., and D. J. Dieterman. 2013. Seasonal movement, growth and survival of brook
trout in sympatry with Brown Trout in Midwestern US streams. Ecology of Freshwater Fish
22:530-542.
Hoxmeier, R. J. H., and D. J. Dieterman. 2016. Long-term population demographics of native brook
trout following manipulative reduction of an invader. Biological Invasions 18(10).
Hudy, M., T. M. Thieling, N. Gillespie, and E. P. Smith. 2008. Distribution, status, and land use
characteristics of subwatersheds within the native range of brook trout in the eastern United
States. North American Journal of Fisheries Management 28:1069-1085.
Huntsman, B. M. and J. T. Petty. 2014. Density-dependent regulation of brook trout population
dynamics along a core-periphery distribution gradient in a central Appalachian watershed.
PLoS One 9(3): e91673. doi:10.1371/journal.pone.0091673

138
Hutt, C. P., and Bettoli, P. W. 2003. Recreational specialization, preferences, and management
attitudes of trout anglers utilizing Tennessee tailwaters. Fisheries Report No. 03-01.
Tennessee Wildlife Resources Agency, Nashville, Tennessee.
Johnson, J. H., and D. S. Dropkin. 1996. Seasonal habitat use by brook trout, Salvelinus fontinalis
(Mitchill), in a second-order stream. Fisheries Management and Ecology 3:1-11.
King, W. 1937. Notes on the distribution of native speckled and rainbow trout in the streams of
Great Smoky Mountains National Park. Journal of the Tennessee Academy of Science
12:351-361.
Korman, J., M. Yard, and T. A. Kennedy. 2017. Trends in Rainbow Trout recruitment, abundance,
survival, and growth during a boon-and-bust cycle in a tailwater fishery. Transactions of the
American Fisheries Society 146:1043-1057.
Kriegler, F. J., G. F. McCracken, J. W. Habera, and R. J. Strange. 1995. Genetic characterization
of Tennessee's brook trout populations and associated management implications. North
American Journal of Fisheries Management 15:804-813.
Kulp, M. A. 1994. A comparative ecology study of two strains of brook trout in Great Smoky
Mountains National Park. MS thesis, Tennessee Technological University, Cookeville,
Tennessee.
Larson, G. L., S. E. Moore, and B. Carter. 1995. Ebb and flow of encroachment by nonnative
Rainbow Trout in a small stream in the southern Appalachian Mountains. Transactions of
the American Fisheries Society 124:613-622.
Lewis, S. L. 1969. Physical factors influencing fish populations in pools of a trout stream.
Transactions of the American Fisheries Society 98:14-19.
Lobon-Cervia, J. 2007. Density-dependent growth in stream-living Brown Trout Salmo trutta L.
Functional Ecology 21:117-124.
Lohr, S. C., and J. L. West. 1992. Microhabitat selection by Brook and Rainbow Trout in a southern
Appalachian stream. Transactions of the American Fisheries Society 121:729-736.
Luecke, C., T. C. Edwards, Jr., M. W. Wengert, Jr., S. Brayton, and R. Schneidervin. 1994.
Simulated changes in lake trout yield, trophies, and forage consumption under various slot
limits. North American Journal of Fisheries Management 14:14-21.
Maillett, E. and R. Aiken. 2015. Trout fishing in 2011: a demographic description and economic
analysis, addendum to the 2011 National Survey of Fishing, Hunting, and Wildlife-Associated
Recreation. Report 2011-4. U.S. Fish and Wildlife Service.

139
Matthews, K. R., N. H. Berg, D. L. Azuma, and T. R. Lambert. 1994. Cool water formation and trout
habitat use in a deep pool in the Sierra Nevada, California. Transactions of the American
Fisheries Society 123:549-564.
McKinney, T., D. W. Speas, R. S. Rogers, and W. R. Persons. 2001. Rainbow Trout in a regulated
river below Glen Canyon Dam, Arizona, following increased minimum flows and reduced
discharge variability. North American Journal of Fisheries Management 21:216-222.
McMichael, G. A., and C. M. Kaya. 1991. Relations among stream temperature, angling success
for rainbow and Brown Trout, and fishermen satisfaction. North American Journal of
Fisheries Management 11:190-199.
Meerbeek, J., and P. W. Bettoli. 2005. Survival, growth, condition, and diet of stocked Brown Trout
in five Tennessee tailwaters. Fisheries Report No. 05-05. Tennessee Wildlife Resources
Agency, Nashville, Tennessee.
Meyer, K. A., B. High, and F. S. Elle. 2012. Effects of stocking catchable-sized hatchery Rainbow
Trout on wild Rainbow Trout abundance, survival, growth, and recruitment. Transactions of
the American Fisheries Society 141:224-237.
Mork, M. D. 2011. Survival and movements of large Brown Trout in a regulated river system in east
Tennessee. MS thesis, Tennessee Technological University, Cookeville, Tennessee.
Myers, B. J. E., C. A. Dolloff, and A. L. Rypel. 2014. Rainbow Trout versus brook trout biomass and
production under varied climate regimes in small southern Appalachian streams. Pages 127-
134 in R. F. Carline, editor. Wild Trout IX: Looking back and moving forward. Wild Trout
Symposium, Bozeman, Montana.
Nagel, J. W. 1986. Brook trout / Rainbow Trout headwaters competition studies. Research
progress report submitted to Tennessee Wildlife Resources Agency, Nashville, Tennessee.
Nagel, J. W. 1991. Is the decline of brook trout in the southern Appalachians resulting from
competitive exclusion and/or extinction due to habitat fragmentation? Journal of the
Tennessee Academy of Science 66:141-143.
Nagel, J. W., and J. E. Deaton. 1989. Growth and longevity of Rainbow Trout in two headwater
streams in northeastern Tennessee. Journal of the Tennessee Academy of Science 64:9-12.
Noble, R. L., and T. W. Jones. 1999. Managing fisheries with regulations. Pages 455-480 in C. C.
Kohler and W. A. Hubert, editors. Inland fisheries management in North America, 2nd edition.
American Fisheries Society, Bethesda, Maryland.
Page, L. M., H. Espinosa-Pèrez, L. T. Findley, C. R. Gilbert, R. N. Lea, N. E. Mandrak, R. L.
Mayden, and J. S. Nelson. 2013. Common and scientific names of fishes from the United
States, Canada, and Mexico, 7th edition. American Fisheries Society, Special Publication 34,
Bethesda, Maryland.

140
Pedicillo, G, A. Carosi, L. Ghetti, and M. Lorenzoni. 2010. Population size structure indices and
growth standards for Salmo (trutta) trutta Linnaeus, 1758 in central Italy. Knowledge and
Management of Aquatic Ecosystems 399(02). doi:10.1051/kmae/2010030.
Pender, D. R., and T. J. Kwak. 2002. Factors influencing Brown Trout reproductive success in
Ozark tailwater rivers. Transactions of the American Fisheries Society 131:698-717.
Peterson, J. T., R. F. Thurow, and J. W. Guzevich. 2004. An evaluation of multipass electrofishing
for estimating the abundance of stream-dwelling salmonids. Transactions of the American
Fisheries Society 113:462-475.
Pfitzer, D. W. 1962. Investigations of waters below large storage reservoirs in Tennessee. D-J-R
Project F-1-R. Tennessee Game and Fish Commission, Nashville, Tennessee.
Power, M., and G. Power. 1996. Comparing minimum-size and slot limits for brook trout
management. North American Journal of Fisheries Management 16:49-62.
Roddy, D., editor. 2018. Coldwater fish production—statewide hatchery report: 2017. Fisheries
Report No. 18-02. Tennessee Wildlife Resources Agency, Nashville, Tennessee.
Roghair, C. N., C. A. Dolloff, and M. K. Underwood. 2002. Response of a brook trout population
and instream habitat to a catastrophic flood and debris flow. Transactions of the American
Fisheries Society 131:718-730.
Sánchez-Hernández, J., S. L. Shaw, F. Cobo, and M. S. Allen. 2016. Influence of a minimum-
length limit regulation on wild Brown Trout: an example of recruitment and growth
overfishing. North American Journal of Fisheries Management 36:1024-1035.
Schexnayder, S. M., A. Griffin, and J. M. Fly. 2014. Fishing participation and attitudes of anglers in
Tennessee, 2012. Human Dimensions Research Lab, Department of Forestry, Wildlife and
Fisheries. University of Tennessee, Knoxville, Tennessee.
Scott, E. M., K. D. Gardner, D. S. Baxter, and B. L. Yeager. 1996. Biological and water quality
responses in tributary tailwaters to dissolved oxygen and minimum flow improvements.
Tennessee Valley Authority, Water Management Services, Norris, Tennessee.
Shields, R. A. 1950. A survey of east Tennessee trout streams with recommendations for
management. Internal report, Tennessee Wildlife Resources Agency, Nashville, Tennessee.
Sotiropoulos, J. C., K. H. Nislow, and M. R. Ross. 2006. Brook trout, Salvelinus fontinalis,
microhabitat selection and diet under low summer stream flows. Fisheries Management and
Ecology 13:149-155.
Stitt, B. C., G. Burness, K. A. Burgonmaster, S. Currie, J. L. McDermid, and C. C. Wilson. 2014.
Intraspecific variation in thermal tolerance and acclimation capacity in brook trout (Salvelinus

141
fontinalis): Physiological implications for climate change. Physiological and Biochemical
Zoology 87:15-29.
Strange, R. J., and J. W. Habera. 1993. Wild trout project: 1992 annual report. Publication No.
R11-2216-76-001-93. University of Tennessee, Knoxville, Tennessee.
Strange, R. J., and J. W. Habera. 1994. Wild trout project: 1993 annual report. Publication No.
R11-2216-18-001-94. University of Tennessee, Knoxville, Tennessee.
Strange, R. J., and J. W. Habera. 1995. Wild trout project: 1994 annual report. Publication No.
R11-2217-18-001-95. University of Tennessee, Knoxville, Tennessee.
Strange, R. J., and J. W. Habera. 1996. Wild trout project: 1995 annual report. Publication No.
R11-2217-93-001-96. University of Tennessee, Knoxville, Tennessee.
Strange, R. J., and J. W. Habera. 1997. Wild trout project: 1996 annual report. Publication No.
R11-2217-93-001-97. University of Tennessee, Knoxville, Tennessee.
Strange, R. J., and J. W. Habera. 1998. No net loss of brook trout distribution in areas of sympatry
with Rainbow Trout in Tennessee streams. Transactions of the American Fisheries Society
127:434-440.
Stranko, S. A., R. H. Hilderbrand, R. P. Morgan II, M. W. Staley, A. J. Becker, A. Roseberry-Linclon,
E. S. Perry, and P. T. Jacobson. 2008. Brook trout declines with land cover and
temperature changes in Maryland. North American Journal of Fisheries Management
28:1223-1232.
Swink, W. D. 1983. Survey of stocking of tailwater trout fisheries in the southern United States.
Progressive Fish-Culturist 45(2):67-71.
Tarzwell, C. M. 1939. Changing the Clinch River into a trout stream. Transactions of the American
Fisheries Society 68:228-233.
Tatum, R. 1968. Brook trout streams in upper east Tennessee. Internal memorandum, Tennessee
Wildlife Resources Agency, Nashville, Tennessee.
TDEC (Tennessee Department of Environment and Conservation). 2013. State of Tennessee
water quality standards: use classifications for surface waters, chapter 0400-40-04. Water
Quality Control Board, Nashville.
TDEC (Tennessee Department of Environment and Conservation). 2015. State of Tennessee
water quality standards: general water quality criteria, chapter 0400-40-03. Water Quality
Control Board, Nashville.
TWRA (Tennessee Wildlife Resources Agency). 1998. Stream survey protocols. Tennessee
Wildlife Resources Agency, Nashville, Tennessee.

142
TWRA (Tennessee Wildlife Resources Agency). 2014. Protecting, preserving, and perpetuating
Tennessee’s wildlife and ecosystems: Strategic plan 2014-2020. Tennessee Wildlife
Resources Agency, Nashville, Tennessee.
TWRA (Tennessee Wildlife Resources Agency). 2017. Trout management Plan for Tennessee
2017-2027 (J. Habera, editor). Tennessee Wildlife Resources Agency, Nashville,
Tennessee.
TVA (Tennessee Valley Authority). 1980. Improving reservoir releases. TVA Office of Natural
Resources and Environmental Development, Knoxville, Tennessee.
Thompson, P. D., and F. J. Rahel. 1996. Evaluation of depletion-removal electrofishing of brook
trout in small Rocky Mountain streams. North American Journal of Fisheries Management
16:332-339.
Trumbo, B., M. Hudy, E. P. Smith, D.-Y. Kim, B. A. Wiggins, K. H. Nislow, and C. A. Dolloff. 2010.
Sensitivity and vulnerability of brook trout populations to climate change. Pages 62-68 in R.
F. Carline and C. LoSapio, editors. Wild Trout X: Conserving wild trout. Wild Trout
Symposium, Bozeman, Montana.
Verhille, C. E, K. K. English, D. E. Cocherell, A. P. Farrell, and N. A. Fangue. 2016. High thermal
tolerance of a Rainbow Trout population near its southern range limit suggests local thermal
adjustment. Conservation Physiology 4(1):1-12.
Vøllestad, L. A., E. M. Olsen, and T. Forseth. 2002. Growth-rate variation in Brown Trout in small
neighbouring streams: evidence for density-dependence? Journal of Fish Biology 61:1513-
1527.
Walters, C. J., and J. R. Post. 1993. Density-dependent growth and competitive asymmetries in
size-structured fish populations: a theoretical model and recommendations for field
experiments. Transaction of the American Fisheries Society 122:34-45.
Warren, D. R., A. G. Ernst, and B. P. Baldigo. 2009. Influence of spring floods on year-class
strength of fall- and spring-spawning salmonids in Catskill Mountain streams. Transaction of
the American Fisheries Society 138:200-210.
Waters, T. F. 1999. Long-term trout production in Valley Creek, Minnesota. Transaction of the
American Fisheries Society 128:1151-1162.
Weaver, D. M., and T. J. Kwak. 2013. Assessing effects of stocked trout on nongame fish
assemblages in southern Appalachian Mountain streams. Transaction of the American
Fisheries Society 142:1495-1507.

143
Weiland, M. A., and R. S. Hayward. 1997. Cause for the decline of large Rainbow Trout in a
tailwater fishery: too much putting or too much taking? Transaction of the American
Fisheries Society 126:758-773.
Whitworth, W. E., and R. J. Strange. 1983. Growth and production of sympatric brook and Rainbow
Trout in an Appalachian stream. Transaction of the American Fisheries Society 112:469-
475.
Wilde, G. R. 1997. Largemouth bass fishery responses to length limits. Fisheries 22:14-23.
Wiley, R. W., R. A. Whaley, J. B. Satake, and M. Fowden. 1993. Assessment of stocking hatchery
trout: a Wyoming perspective. North American Journal of Fisheries Management 13:160-
170.
Wilkins, L. P., L. Kirkland, and A. Hulsey. 1967. The management of trout fisheries in reservoirs
having a self-sustaining warm water fishery. Pages 444-452 in C. E. Lane, symposium
chairman. Reservoir Fishery Resources Symposium, Reservoir Committee, Southern
Division, American Fisheries Society, Bethesda, Maryland.
Willis, D. W., B. R. Murphy, and C. S. Guy. 1993. Stock densities: development, use, and
limitations. Reviews in Fisheries Science 1(3):203-222.
Yard, M. D., J. Korman, C. J. Walters, and T. A. Kennedy. 2015. Seasonal and spatial patterns of
growth of Rainbow Trout in the Colorado River in Grand Canyon, Arizona. Canadian Journal
of Fisheries and Aquatic Sciences 73:125-139.
Yeager, B. L., D. M. Hill, W. M. Seawell, C. M. Alexander, and R. Wallus. 1987. Effects of aeration
and minimum flow enhancement on the biota of Norris tailwater. TVA Office of Natural
Resources and Environmental Development, Knoxville, Tennessee.
Yeager, B. L., T. A. McDonough, and D. A. Kenny. 1993. Growth, feeding and movement of trout in
South Holston tailwater. Water Management Services, WM-94-003. Tennessee Valley
Authority, Norris, Tennessee.

144
APPENDIX A
Quantitative Wild Trout Stream Samples
1991-2017

145
Table A-1. Wild trout streams sampled quantitatively during 1991-2017.
Primary Total
Stream Watershed County Location Year species1 samples
Gee Creek Hiwassee Polk CNF 1993 RBT 1
Rymer Camp Branch Hiwassee Polk CNF 1994 RBT 1
Sulphur Springs Branch Hiwassee Polk CNF 1992 RBT 1
East Fork Wolf Creek Hiwassee Polk CNF 1995 RBT 1
Big Creek Ocoee Polk CNF 1996 RBT 1
Goforth Creek Ocoee Polk CNF 1993 RBT 1
Rough Creek Ocoee Polk CNF 1995 RBT 1
Tellico River2 L. Tennessee Monroe CNF 1993,95-02, 06, 11, 14 RBT/BNT 32
Bald River3 Tellico Monroe CNF 1991-00, 05, 07, 10, 13 RBT/BNT/BKT 39
Kirkland Creek Tellico Monroe CNF 1991 RBT 1
Henderson Branch Tellico Monroe CNF 1996 RBT/BNT/BKT 2
Brookshire Creek Tellico Monroe CNF 1996 BKT 3
North River2 Tellico Monroe CNF 1991-14 RBT/BNT 72
Laurel Branch Tellico Monroe CNF 1997 RBT/BNT 1
Sugar Cove Creek Tellico Monroe CNF 1995-96 RBT/BKT 3
Meadow Branch Tellico Monroe CNF 1991,95, 04 BKT 6
Sycamore Creek Tellico Monroe CNF 1994-95,97-98 RBT/BKT 6
Rough Ridge Creek Tellico Monroe CNF 1995 RBT/BKT 2
Citico Creek L. Tennessee Monroe CNF 1996 RBT/BNT 1
Doublecamp Creek L. Tennessee Monroe CNF 1992 RBT/BNT 2
S. Fork Citico Creek L. Tennessee Monroe CNF 2004 RBT 1
N. Fork Citico Creek L. Tennessee Monroe CNF 2003 RBT 1
Parson Branch L. Tennessee Blount Private 1993 RBT 1
Slickrock Creek L. Tennessee Monroe CNF 2007 BNT 2
Little Slickrock Creek L. Tennessee Monroe CNF 2007 BNT 1
Dunn Creek French Broad Sevier Private 1993 RBT 1
Indian Camp Creek French Broad Cocke Private 2007 RBT 1
Sinking Creek French Broad Cocke Private 1999 RBT 1
Tobes Creek French Broad Cocke Private 2006 RBT 1
Gulf Fork Big Creek French Broad Cocke Private 1993, 04, 08 RBT/BNT 3
Deep Gap Creek French Broad Cocke State Forest 2005 RBT 1
Laurel Creek French Broad Cocke State Forest 2013 RBT 1
M. Prong Gulf Creek French Broad Cocke Private 1991 BKT 1
Brown Gap Creek French Broad Cocke Private 1991 BKT 1
Trail Fork Big Creek French Broad Cocke CNF 1996, 2001 RBT 2
Dry Fork French Broad Cocke CNF 1994 BKT/RBT 2
Wolf Creek French Broad Cocke CNF 1993 RBT 2
Paint Creek2 French Broad Greene CNF
92, 94, 95, 02-04, 08, 11, 14, 17 BNT/RBT 17
Sawmill Branch French Broad Greene CNF 1999 BKT/BNT 1
Little Paint Creek French Broad Greene CNF 1993 BKT 1

146
Table A-1 (cont.). Wild trout streams sampled quantitatively during 1991-2017.
Primary Total
Stream Watershed County Location Year species1 samples
Camp Creek Nolichucky Greene Private 2004 RBT 1
Jennings Creek Nolichucky Greene CNF 1992, 14 RBT 2
Round Knob Branch Nolichucky Greene CNF 1996 BKT 1
Dry Creek Nolichucky Greene CNF 1992 RBT 1
Davis Creek Nolichucky Greene CNF 1992, 2003 RBT/BKT 2
W. Fork Dry Creek Nolichucky Greene CNF 1992 BKT 1
Horse Creek Nolichucky Greene CNF 1994 RBT 1
Squibb Creek Nolichucky Greene CNF 1991, 2003 RBT/BKT 2
Sarvis Cove Creek Nolichucky Greene CNF 1991, 2003 RBT/BKT 2
Cassi Creek Nolichucky Greene CNF 2003 RBT 1
Painter Creek Nolichucky Washington Private 1993 RBT 1
Clark Creek Nolichucky Unicoi CNF 1991 RBT 1
Sill Branch Nolichucky Unicoi CNF 1994 RBT 1
Devil Fork Nolichucky Unicoi CNF 1999 RBT 1
Longarm Branch Nolichucky Unicoi CNF 1997 RBT 1
Dry Creek Nolichucky Washington CNF 1997 RBT 1
Ramsey Creek Nolichucky Washington Private 1996 RBT 1
Briar Creek2 Nolichucky Washington CNF 1992,95-17 RBT/BKT 24
Straight Creek Nolichucky Washington CNF 2003 BKT 1
Broad Shoal Creek Nolichucky Unicoi CNF 1991 RBT 1
N. Indian Creek Nolichucky Unicoi CNF 1994-95, 03 RBT/BNT 3
Rock Creek Nolichucky Unicoi CNF 1991 RBT/BKT 1
R. Prong Rock Creek Nolichucky Unicoi CNF 1998 RBT 1
Red Fork Nolichucky Unicoi CNF 1998 RBT 1
Clear Fork Nolichucky Unicoi CNF 1993 BKT 1
South Indian Creek Nolichucky Unicoi Private 2009 RBT 1
Mill Creek Nolichucky Unicoi CNF 1996 RBT 1
Granny Lewis Creek Nolichucky Unicoi CNF 1991 RBT 2
Higgins Creek (Lower) Nolichucky Unicoi Private 1992,95 BKT/RBT 2
Spivey Creek Nolichucky Unicoi Private 2007 RBT 1
Coffee Ridge Nolichucky Unicoi Private 2011 RBT 1
Big Bald Creek Nolichucky Unicoi Private 1996 RBT 1
Tumbling Creek Nolichucky Unicoi Private 1995 RBT 1
Little Bald Creek Nolichucky Unicoi Private 2007 RBT 1
Big Branch Nolichucky Unicoi Private 1996 RBT 1
Rocky Fork2 Nolichucky Unicoi/Greene Private 1991-17 RBT/BKT 53
Rice Creek Nolichucky Unicoi Private 1995 RBT 1
Higgins Creek (Upper) Nolichucky Unicoi Private 2006 RBT 1
Sams Creek Nolichucky Unicoi Private 2002 RBT 1
Jones Branch Nolichucky Unicoi CNF 1991 BKT 1
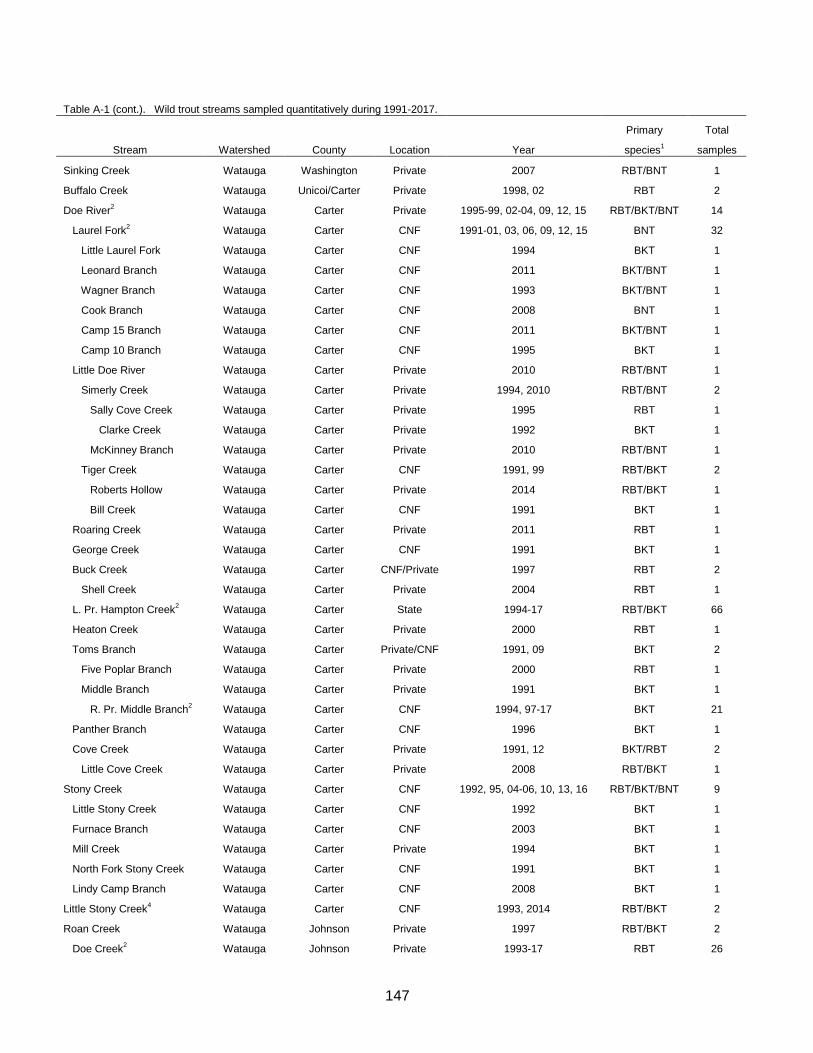
147
Table A-1 (cont.). Wild trout streams sampled quantitatively during 1991-2017.
Primary Total
Stream Watershed County Location Year species1 samples
Sinking Creek Watauga Washington Private 2007 RBT/BNT 1
Buffalo Creek Watauga Unicoi/Carter Private 1998, 02 RBT 2
Doe River2 Watauga Carter Private 1995-99, 02-04, 09, 12, 15 RBT/BKT/BNT 14
Laurel Fork2 Watauga Carter CNF 1991-01, 03, 06, 09, 12, 15 BNT 32
Little Laurel Fork Watauga Carter CNF 1994 BKT 1
Leonard Branch Watauga Carter CNF 2011 BKT/BNT 1
Wagner Branch Watauga Carter CNF 1993 BKT/BNT 1
Cook Branch Watauga Carter CNF 2008 BNT 1
Camp 15 Branch Watauga Carter CNF 2011 BKT/BNT 1
Camp 10 Branch Watauga Carter CNF 1995 BKT 1
Little Doe River Watauga Carter Private 2010 RBT/BNT 1
Simerly Creek Watauga Carter Private 1994, 2010 RBT/BNT 2
Sally Cove Creek Watauga Carter Private 1995 RBT 1
Clarke Creek Watauga Carter Private 1992 BKT 1
McKinney Branch Watauga Carter Private 2010 RBT/BNT 1
Tiger Creek Watauga Carter CNF 1991, 99 RBT/BKT 2
Roberts Hollow Watauga Carter Private 2014 RBT/BKT 1
Bill Creek Watauga Carter CNF 1991 BKT 1
Roaring Creek Watauga Carter Private 2011 RBT 1
George Creek Watauga Carter CNF 1991 BKT 1
Buck Creek Watauga Carter CNF/Private 1997 RBT 2
Shell Creek Watauga Carter Private 2004 RBT 1
L. Pr. Hampton Creek2 Watauga Carter State 1994-17 RBT/BKT 66
Heaton Creek Watauga Carter Private 2000 RBT 1
Toms Branch Watauga Carter Private/CNF 1991, 09 BKT 2
Five Poplar Branch Watauga Carter Private 2000 RBT 1
Middle Branch Watauga Carter Private 1991 BKT 1
R. Pr. Middle Branch2 Watauga Carter CNF 1994, 97-17 BKT 21
Panther Branch Watauga Carter CNF 1996 BKT 1
Cove Creek Watauga Carter Private 1991, 12 BKT/RBT 2
Little Cove Creek Watauga Carter Private 2008 RBT/BKT 1
Stony Creek Watauga Carter CNF 1992, 95, 04-06, 10, 13, 16 RBT/BKT/BNT 9
Little Stony Creek Watauga Carter CNF 1992 BKT 1
Furnace Branch Watauga Carter CNF 2003 BKT 1
Mill Creek Watauga Carter Private 1994 BKT 1
North Fork Stony Creek Watauga Carter CNF 1991 BKT 1
Lindy Camp Branch Watauga Carter CNF 2008 BKT 1
Little Stony Creek4 Watauga Carter CNF 1993, 2014 RBT/BKT 2
Roan Creek Watauga Johnson Private 1997 RBT/BKT 2
Doe Creek2 Watauga Johnson Private 1993-17 RBT 26

148
Table A-1 (cont.). Wild trout streams sampled quantitatively during 1991-2017.
Primary Total Stream Watershed County Location Year species
1 samples
Campbell Creek Watauga Johnson Private 1993 RBT 1
Slabtown Branch Watauga Johnson Private 1995 RBT 1
Vaught Creek Watauga Johnson Private 2005 RBT 1
Furnace Creek Watauga Johnson Private 1992 BKT 1
Goose Creek Watauga Johnson Private 2006 RBT/BNT 1
Forge Creek Watauga Johnson Private 1993 RBT/BKT 2
Roaring Creek Watauga Johnson Private 2001 RBT 1
Bulldog Creek Watauga Johnson Private 2009 RBT 1
Big Dry Run Watauga Johnson Private 1994 RBT 1
Heaton Branch Watauga Carter Private 1994 RBT 1
Little Laurel Branch Watauga Carter CNF 1992 BKT 1
Trivett Branch Watauga Carter Private 1996 BNT 1
Big Creek S. F. Holston Sullivan CNF 1994 RBT 1
Fishdam Creek S. F. Holston Sullivan CNF 1991, 2005 RBT 2
Sharps Creek S. F. Holston Sullivan CNF 2012 RBT 1
Little Jacob Creek S. F. Holston Sullivan CNF 1991, 2000 RBT 2
Rockhouse Run S. F. Holston Sullivan CNF 1993 BKT 1
Laurel Creek2 S. F. Holston Johnson CNF
1993-94, 01-02, 04, 07, 10, 13, 16 RBT/BNT 9
Beaverdam Creek² S. F. Holston Johnson CNF 1991-17 RBT/BNT 54
Tank Hollow S. F. Holston Johnson CNF 2003 BKT 1
Chalk Branch S. F. Holston Johnson CNF 1994 BKT 1
Maple Branch S. F. Holston Johnson CNF 1994 BKT 1
Fagall Branch S. F. Holston Johnson CNF 1995 BKT 1
Birch Branch2 S. F. Holston Johnson CNF/Private 1991,95-16 BKT/RBT 23
Marshall Branch S. F. Holston Johnson CNF 1999 BKT 1
Heaberlin Branch S. F. Holston Johnson CNF 1993 BKT 1
Johnson Blevins Br. S. F. Holston Johnson Private 1991 BKT 1
Jim Wright Branch S. F. Holston Johnson Private 1991 BKT 1
E. Fk. Beaverdam Ck. S. F. Holston Johnson CNF 1992 BKT 1
Valley Creek S. F. Holston Johnson CNF 1993 BKT 1
Owens Branch S. F. Holston Johnson CNF 1995 RBT/BNT 1
Lyons Branch S. F. Holston Johnson CNF 1992 RBT 1
Gentry Creek2 S. F. Holston Johnson CNF 1992,96-16 RBT/BKT 23
Grindstone Branch S. F. Holston Johnson CNF 1996 BKT 1
Kate Branch S. F. Holston Johnson CNF 2000 BKT 1
Atchison Branch S. F. Holston Johnson Private 2006 RBT 1
1RBT = Rainbow Trout; BNT = Brown Trout; BKT = Brook Trout.
2Monitoring stream. TWRA Region III began monitoring streams in the Tellico and Little Tennessee watersheds in 2014.
3Includes a site sampled in the allopatric Brook Trout zone in 1992; monitoring Site 2 was discontinued in 2010.
4Watauga Lake tributary.

149
APPENDIX B
Qualitative Stream Surveys 1991-2017

150
Table B-1. Streams sampled qualitatively during 1991-2017 to determine the presence of wild trout.
Survey Wild trout
Stream Watershed County Location Coordinates date present¹
Smith Creek Hiwassee Polk CNF 35.15135, -84.42420 Nov-99 RBT
Coker Creek Hiwassee Monroe Private 35.26978, -84.26283 Jul-96 None
Wolf Creek Hiwassee Polk CNF 35.16522, -84.38135 May-99 RBT/BNT
Wildcat Creek Tellico Monroe CNF 35.29894, -84.25793 Jul-96 None
Natty Creek Tellico Monroe CNF 35.31705, -84.22875 Jul-96 None
Tobe Creek Tellico Monroe CNF 35.29990, -84.22923 Jul-96 None
Laurel Branch French Broad Sevier Private 35.77184, -83.39841 Jul-15 None
Wilhite Creek French Broad Sevier Private 35.87333, -83.32037 Jul-15 None
Lin Creek French Broad Sevier Private 35.86744, -83.32864 Jul-15 None
Mill Creek French Broad Sevier Private 35.73479, -83.57456 Jul-15 RBT
Indian Camp Creek (lower) French Broad Cocke Private 35.77938, -83.26361 Jun-06 RBT
Indian Camp Creek (lower) French Broad Cocke Private 35.77622, -83.26537 Jun-06 RBT, BKT
Indian Camp Creek (lower) French Broad Cocke Private 37.77337, -83.26657 Jun-06 RBT, BKT
Greenbrier Creek French Broad Cocke Private 35.78278, -83.24322 Jun-06 RBT
Groundhog Creek French Broad Cocke Private 35.78918, -83.18387 Jul-15 RBT
Robinson Creek French Broad Cocke Private 35.79097, -83.19433 Jul-15 RBT
John Creek French Broad Cocke Private 35.86611, -83.03250 Jun-01 None
Baker Branch French Broad Cocke Private 35.86306, -83.03083 Jun-01 None
Tom Creek French Broad Cocke Private 35.85306, -83.01806 Jun-01 RBT3
Gulf Fork Big Creek French Broad Cocke Private 35.82385, -83.09162 May-07 RBT/BNT
Gulf Fork Big Creek French Broad Cocke Private 35.83037, -83.05730 May-07 RBT/BNT
Gulf Fork Big Creek French Broad Cocke Private 35.82064, -83.04665 May-07 RBT/BNT
Gulf Fork Big Creek French Broad Cocke Private 35.81805, -83.04191 May-07 RBT/BNT
Laurel Fork (upper) French Broad Cocke CNF 35.88146, -83.06236 Jun-14 None
Laurel Fork (lower) French Broad Cocke Private 35.89220, -83.06274 Jun-14 None
Grassy Fork French Broad Cocke Private 35.81585, -83.08673 Jun-03 RBT4
Deep Gap Creek French Broad Cocke State 35.79321, -83.02074 Oct-06 BKT
Brush Creek French Broad Cocke CNF 35.95817, -82.93442 Jun-15 None
Paint Creek French Broad Greene
Private 36.00702, -82.77679 Jun-15
RBT/BNT
Paint Creek French Broad Greene
CNF 36.02082, -82.74602 Jun-15
RBT
Cove Creek Nolichucky Greene Private 35.97882, -82.86960 Jun-15
None
Back Creek Nolichucky Greene Private 36.01896, -82.80796 Jun-08 None
Camp Creek Nolichucky Greene Private 36.07811, -82.76464 Jul-03 RBT
Bumpus Cove Creek Nolichucky Unicoi Private 36.16941, -82.47134 Jul-07 RBT
Bumpus Cove Creek Nolichucky Washington Private 36.15227, -82.49503 Jul-07 RBT/BNT
Broad Shoal Creek Nolichucky Unicoi CNF 36.15229, -82.44492 Jun-08 RBT
Dry Creek Nolichucky Unicoi Private 36.17448, -82.35113 Jun-10 None (dry)
Dick Creek Nolichucky Unicoi CNF 36.17326, -82.31647 May-11 No fish
Rocky Branch Nolichucky Unicoi Private 36.17589, -82.29530 Jun-10 None
Simerly Creek Nolichucky Unicoi Private 36.18453, -82.25218 Jun-10 None2

151
Table B-1 (cont.). Streams sampled qualitatively during 1991-2017 to determine the presence of wild trout.
Survey Wild trout
Stream Watershed County Location Coordinates date present¹
Birchlog Creek Nolichucky Unicoi Private 36.15263, -82.24237 Jun-10 None
South Indian Creek (upper) Nolichucky Unicoi Private 36.03568, -82.55163 Jun-05 RBT
South Indian Creek (middle) Nolichucky Unicoi Private 36.05937, -82.52198 Jun-05 RBT4
South Indian Creek (lower) Nolichucky Unicoi Private 36.12065, -82.44834 Jul-08 RBT4
Spivey Creek (lower) Nolichucky Unicoi Private 36.06566, -82.50199 Jun-06 RBT
Spivey Creek (middle) Nolichucky Unicoi Private 36.05169, -82.50063 Jun-06 RBT
Spivey Creek (middle) Nolichucky Unicoi Private 36.03955, -82.48652 Jun-06 RBT
Spivey Creek (upper) Nolichucky Unicoi Private 36.04042, -82.47109 Jun-06 RBT
Murray Branch Nolichucky Unicoi Private 36.04610, -82.51080 May-11 RBT4
Murray Branch Nolichucky Unicoi Private 36.04348, -82.51683 May-11 None
Slip Creek Nolichucky Unicoi Private 36.02103, -82.50891 Jun-06 RBT4
Little Bald Creek Nolichucky Unicoi Private 36.03993, -82.46505 Jun-06 RBT
Pete Creek Nolichucky Unicoi CNF 36.01286, -82.58934 Jun-05 None2
E. Fork Higgins Creek Nolichucky Unicoi CNF 35.99601, -82.53006 Jun-05 None2
Long Branch Nolichucky Unicoi CNF 36.08811, -82.42917 Jun-08 BKT
Sinking Creek (upper) Watauga Carter Private 36.25559, -82.36470 Jun-06 RBT, BKT, BNT
Sinking Creek (upper) Watauga Carter Private 36.25192, -82.36493 Jun-06 RBT, BKT, BNT
Sinking Creek (middle) Watauga Carter Private 36.26143, -82.36430 Jun-06 RBT, BKT
Sinking Creek (lower) Watauga Carter Private 36.27966, -82.36838 Jun-06 RBT
Basil Hollow Watauga Washington Private 36.25134, -82.36456 May-07 RBT
Dry Creek Watauga Carter Private 36.25910, -82.28150 Jun-09 BNT4
Honeycomb Creek Watauga Carter Private 36.24304, -82.26767 Jun-09 RBT4
Gap Creek Watauga Carter CNF 36.26756, -82.23016 Jun-09 None
Upper Gap Creek Watauga Carter Private 36.25850, -82.23574 Jun-09 None2
Little Doe River Watauga Carter Private 36.24629, -82.19464 Jun-09 RBT/BNT
Little Doe River Watauga Carter Private 36.22870, -82.18899 Jun-09 RBT/BNT
Simerly Creek (lower) Watauga Carter Private 36.22769, -82.18925 Jun-09 RBT/BNT
Big Flats Branch Watauga Carter Private 36.24634, -82.14575 Aug-06 RBT
Firescald Branch Watauga Carter CNF 36.24920, -82.08700 Nov-15 BKT
Doll Branch Watauga Carter Private 36.15115, -82.02994 Jun-04 RBT
Morgan Branch Watauga Carter Private 36.17449, -82.02072 Jun-08 RBT4
Bear Branch Watauga Carter CNF 36.18106, -82.01066 Jun-08 RBT4
State Line Branch Watauga Carter Private 36.16797, -82.00265 Jun-08 RBT4
Hampton Creek (upper) Watauga Carter Private 36.14939, -82.05561 Jun-08 RBT4
Sugar Hollow Creek Watauga Carter Private 36.15694, -82.07053 Jun-08 RBT4
Bearwallow Hollow Watauga Carter State 36.15899, -82.10180 Jul-14 None
Nidifer Branch Watauga Carter Private 36.39768, -82.09988 May-95 None2
Hinkle Branch Watauga Carter Private 36.40950, -82.09707 May-95 None2
Peters Branch Watauga Carter Private 36.40696, -82.07738 Jun-11 None (nearly dry)
Horselog Branch Watauga Carter Private 36.40822, -82.06854 Jun-11 None (nearly dry)
Laurel Branch Watauga Carter Private 36.41660, -82.07871 May-95 None2
Grindstaff Branch Watauga Carter Private 36.41442, -82.05386 Jun-11 None

152
Table B-1 (cont.). Streams sampled qualitatively during 1991-2017 to determine the presence of wild trout.
Survey Wild trout
Stream Watershed County Location Coordinates date present¹
Stover Branch Watauga Carter Private 36.42096, -82.05016 Jun-11 RBT4
Right Fork Mill Creek Watauga Carter CNF 36.43993, -82.07787 Jun-15 BKT
Hurley Branch Watauga Carter Private 36.43600, -82.04804 Jun-11 RBT/BNT
Hurley Branch Watauga Carter Private 36.43150, -82.03231 Jun-11 RBT
Richardson Branch Watauga Carter Private 36.45740, -82.01002 Jun-11 None (dry)
Bowen Branch Watauga Carter Private 36.46105, -82.00719 Jun-11 None (dry)
Upper Hinkle Branch Watauga Carter Private 36.46905, -82.00466 Jul-07 None
Big Spur Branch Watauga Carter CNF 36.46786, -81.97704 Jun-15 BKT
Lindy Camp Branch Watauga Carter CNF 36.47081, -81.96968 Jul-07 BKT
Baker Ridge Branch Watauga Carter CNF 36.48095, -81.97507 Jun-15 BKT
Water Hollow Branch Watauga Carter CNF 36.47822, -81.97452 Jun-15 BKT
Sink Branch Watauga Johnson Private 36.36305, -81.99222 Jun-09 None2
Doe Creek Watauga Johnson Private 36.45667, -81.87556 Oct-01 None
Doe Creek Watauga Johnson Private 36.44889, -81.89889 Oct-01 RBT4
Doe Creek Watauga Johnson Private 36.44194, -81.90806 Oct-01 RBT4
Dugger Branch Watauga Johnson Private 36.39397, -81.96911 Jun-95 None2
Campbell Hollow Watauga Johnson Private 36.40306, -81.96558 Jun-95 None2
Campbell Creek Watauga Johnson CNF 36.45734, -81.95157 Sep-14 Barrier—no fish
above
Spruce Branch Watauga Johnson Private 36.45630, -81.88100 Jun-15 RBT
Stout Branch Watauga Johnson Private 36.47544, -81.87173 Jun-15 None
Shaw Branch Watauga Johnson Private 36.48240, -81.85836 Jun-15 None2
Little Dry Run Watauga Johnson Private 36.35489, -81.93736 Jun-09 None2
Avery Branch Watauga Johnson Private 36.36972, -81.87307 Jun-09 None2
Stout Branch Watauga Johnson Private 36.36716, -81.83291 Jun-08 RBT4
Slimp Branch Watauga Johnson Private 36.38751, -81.84609 Jun-08 None
Lunt Branch Watauga Johnson Private 36.40488, -81.85349 Jun-08 None (dry)
Big Sandy Creek Watauga Johnson Private 36.39884, -81.80691 Jun-08 None (dry)
Furnace Creek Watauga Johnson Private 36.48419, -81.79864 Jun-06 RBT
East Fork (Furnace Creek) Watauga Johnson Private 36.36681, -81.80068 Jun-94, Jun-15 None
Cabbage Creek Watauga Johnson Private 36.40792, -81.80150 Jun-08 None (dry)
Stout Branch Watauga Johnson Private 36.42797, -81.74439 Jul-97 None
E.H. Phillippi Branch Watauga Johnson Private 36.49089, -81.84778 Jun-15 None2
Patrick Branch Watauga Johnson Private 36.50505, -81.82793 Jun-15 None2
Thomas Branch Watauga Johnson Private 36.51315, -81.83235 Jun-15 None2
Fenner Branch Watauga Johnson Private 36.51606, -81.83144 Jun-15 None2
Gentry Branch Watauga Johnson Private 36.51816, -81.82568 Jun-15 None2
Hall Branch Watauga Johnson Private 36.51850, -81.81934 Jun-15 None2
Stone Branch Watauga Johnson Private 36.52243, -81.81736 Jun-15 None2
Fall Branch Watauga Johnson Private 36.42452, -81.74489 Jun-99 RBT
Woodward Branch Watauga Johnson Private 36.47442, -81.72249 Jun-10 RBT4
Drake Branch Watauga Johnson Private 36.36566, -81.74845 Jun-09 RBT4
Egger Branch Watauga Johnson Private 36.36543, -81.76789 Jun-15 RBT4
Buttermilk Branch Watauga Johnson Private 36.35035, -81.75234 Jun-15 RBT4

153
Table B-1 (cont.). Streams sampled qualitatively during 1991-2017 to determine the presence of wild trout.
Survey Wild trout
Stream Watershed County Location Coordinates date present¹
W. Fork Buttermilk Br. Watauga Johnson Private 36.34703, -81.75228 Jun-15 None
Jenkins Creek Watauga Johnson Private 36.35215, -81.73884 Jun-10 RBT4
‘Poplar Ridge’ Branch5 Watauga Johnson Private 36.36566, -81.74845 Jun-15 RBT
Black Branch Watauga Carter Private 36.28758, -82.01163 Jul-07 RBT/BNT4
Row Branch Watauga Carter Private 36.28869, -82.01325 Jul-07 RBT4
Jones Branch Watauga Carter Private/CNF 36.20195, -81.98815 Jul-02 None
Baker Branch Watauga Johnson Private 36.34010, -81.92116 May-96 None2
Morgan Branch Watauga Johnson Private 36.32769, -81.90590 Jun-09 None
Dye Leaf Branch Watauga Johnson Private 36.33538, -81.89473 Jun-09 None
Little Creek S. Fork Holston Sullivan CNF 36.47529, -82.08702 Jul-15 BNT (1)
Roaring Creek S. Fork Holston Sullivan CNF 36.48538, -82.08930 Jul-15 None
Josiah Creek S. Fork Holston Sullivan CNF 36.49992, -82.04397 Jul-15 None2
Sulphur Springs Branch S. Fork Holston Sullivan CNF 36.52238, -82.02516 Jun-05 RBT
Sharps Creek S. Fork Holston Sullivan Private 36.54608, -82.01824 Jun-11 RBT4
Sharps Creek S. Fork Holston Sullivan Private 32.53868, -81.99159 Jun-11 RBT
Cave Spring Branch S. Fork Holston Sullivan Private 36.59283, -81.98427 Jun-11 None
Laurel Creek S. Fork Holston Johnson CNF 36.52622, -81.80172 Jun-04 None
Beaverdam Creek S. Fork Holston Johnson Private 36.53244, -81.92330 May-03, Jun-05 RBT/BNT
Beaverdam Creek S. Fork Holston Johnson Private 36.52050, -81.93219 May-03, Jun-05 RBT/BNT
Beaverdam Creek S. Fork Holston Johnson Private 36.51664, -81.93763 May-03, Jun-05 RBT/BNT
Reservoir Branch S. Fork Holston Johnson Private 36.60295, -81.81103 May-96 None2
Reservoir Branch S. Fork Holston Johnson Private 36.60264, -81.81086 Oct-15 RBT/BNT
Reservoir Branch S. Fork Holston Johnson Private 36.59858, -81.80787 Oct-15 None
Stillhouse Branch S. Fork Holston Johnson CNF 36.58489, -81.83032 Jun-04 RBT/BNT
Haunted Hollow S. Fork Holston Johnson CNF 36.57662, -81.85151 Jun-04 None
Dan Wiley Branch S. Fork Holston Johnson CNF 36.56981, -81.85512 Oct-15 None
Dark Hollow S. Fork Holston Johnson CNF 36.57683, -81.85896 Jun-04 None
Flat Springs Branch S. Fork Holston Johnson Private 36.54886, -81.88531 Aug-05 RBT/BNT
Grindstone Branch S. Fork Holston Johnson Private 36.53513, -81.88837 Jun-15 None2
David Blevins Branch S. Fork Holston Johnson Private 36.53357, -81.89964 Jun-06 None
McQueen Branch S. Fork Holston Johnson Private 36.54262, -81.90921 Jun-06 RBT4
Green Mountain Branch S. Fork Holston Johnson Private 36.50915, -81.91061 Jun-06 RBT
Buck Ridge Branch S. Fork Holston Johnson Private 36.49639, -81.96272 Jul-04 RBT/BNT
W. Fork Beaverdam Creek S. Fork Holston Johnson Private 36.49064, -81.94230 Jun-06 BKT
M. Fork Beaverdam Creek S. Fork Holston Johnson Private 36.49661, -81.93719 Jun-06 RBT, BKT, BNT
Seng Cove Branch S. Fork Holston Johnson Private 36.59219, -81.72168 Jun-10 None
Cave Spring Branch S. Fork Holston Johnson Private 36.59002, -81.72465 Jun-10 RBT4
Shingletown Branch S. Fork Holston Johnson Private 36.54533, -81.77751 Jun-04 None2
Drystone Branch S. Fork Holston Johnson Private 36.52833, -81.77521 May-96 None2
Flatwood Branch S. Fork Holston Johnson Private 36.52680, -81.80280 Jun-04 None2
Corum Branch S. Fork Holston Johnson Private 36.52636, -81.81085 Jun-15 None2
Richardson Branch S. Fork Holston Johnson CNF 36.61033, -81.67962 Jun-93 None
Richardson Branch S. Fork Holston Johnson CNF 36.61046, -81.68022 Jun-15 BKT

154
Table B-1 (cont.). Streams sampled qualitatively during 1991-2017 to determine the presence of wild trout.
Survey Wild trout
Stream Watershed County Location Coordinates date present¹
Whetstone Branch S. Fork Holston Johnson CNF 36.60731, -81.68474 Jun-15 BKT
1RBT = Rainbow Trout; BNT = Brown Trout; BKT = Brook Trout.
2Visually inspected and judged too small (<1 m wide) or without appropriate habitat to support wild trout.
3Trout present, but origin questionable; could be the result of fingerling stocking by private individuals.
4Low abundance.
5Unnamed tributary to Roan Creek on Zionville quadrangle map.