Fisheries Development Strategy SMEDA Marine Fisheries ... Industry Data... · Marine Fisheries...
54
Fisheries Development Strategy SMEDA 1 Marine Fisheries Sector in Pakistan Development Strategy Small and Medium Enterprise Development Authority Government of Pakistan www.smeda.org.pk HEAD OFFICE Waheed Trade Complex, 1 st Floor , 36-Commercial Zone, Phase III, Sector XX, Khayaban-e-Iqbal, DHA Lahore Tel: (042) 111-111-456, Fax: (042) 5896619, 5899756 [email protected] REGIONAL OFFICE PUNJAB REGIONAL OFFICE SINDH REGIONAL OFFICE NWFP REGIONAL OFFICE BALOCHISTAN Waheed Trade Complex, 1 st Floor, 36-Commercial Zone, Phase III, Sector XX, Khayaban-e-Iqbal, DHA Lahore. Tel: (042) 111-111-456 Fax: (042) 5896619, 5899756 [email protected] 5 TH Floor, Bahria Complex II, M.T. Khan Road, Karachi. Tel: (021) 111-111-456 Fax: (021) 5610572 helpdesk- [email protected] Ground Floor State Life Building The Mall, Peshawar. Tel: (091) 9213046-47 Fax: (091) 286908 helpdesk- [email protected] Bungalow No. 15-A Chaman Housing Scheme Airport Road, Quetta. Tel: (081) 831623, 831702 Fax: (081) 831922 helpdesk- [email protected]
Transcript of Fisheries Development Strategy SMEDA Marine Fisheries ... Industry Data... · Marine Fisheries...
Fisheries Development Strategy SMEDA
1
Marine Fisheries Sector inPakistan
Development Strategy
Small and Medium Enterprise Development AuthorityGovernment of Pakistan
www.smeda.org.pk
HEAD OFFICEWaheed Trade Complex, 1st Floor , 36-Commercial Zone, Phase III, Sector XX, Khayaban-e-Iqbal, DHA Lahore
Tel: (042) 111-111-456, Fax: (042) 5896619, [email protected]
REGIONAL OFFICEPUNJAB
REGIONAL OFFICESINDH
REGIONAL OFFICENWFP
REGIONAL OFFICEBALOCHISTAN
Waheed Trade Complex,1st Floor, 36-Commercial
Zone,Phase III, Sector XX,
Khayaban-e-Iqbal, DHALahore.
Tel: (042) 111-111-456Fax: (042) 5896619,
5TH Floor, BahriaComplex II, M.T. Khan
Road, Karachi.Tel: (021) 111-111-456
Fax: (021) 5610572helpdesk-
Ground FloorState Life Building
The Mall, Peshawar.Tel: (091) 9213046-47
Fax: (091) 286908helpdesk-
Bungalow No. 15-AChaman Housing
SchemeAirport Road, Quetta.Tel: (081) 831623,
831702Fax: (081) 831922
Fisheries Development Strategy SMEDA
2
Table of Contents
INTRODUCTION .......................................................................................................................................................5
METHODOLOGY ......................................................................................................................................................6
TERMS.........................................................................................................................................................................7
MAINLY THREE GROUPS OF MOLLUSCS CHARACTERIZED BY INTERNAL SKELETON, TENTACLES SURROUNDINGMOUTH AND QUICK MOVEMENT BY MEANS OF WATER, JET PROPULSION, NAMELY CUTTLEFISH, SQUID, ANDOCTOPUS....................................................................................................................................................................7
WHAT IS SEAFOOD: PRODUCTS AND RELATIVE VALUE ADDITION......................................................8
WORLD SEAFOOD TRADE : TRENDS AND PAKISTAN’S SHARE................................................................9
PRODUCTION AND STATE OF FISHERIES RESOURCES ..............................................................................9
FISH UTILIZATION................................................................................................................................................11
RECENT TRENDS IN INTERNATIONAL FISH TRADE..................................................................................13
PAKISTAN'S SHARE IN INTERNATIONAL MARKET ...................................................................................15
COMPOSITION OF PAKISTAN'S EXPORTS.....................................................................................................16
PAKISTAN’S FISH EXPORT AS % OF TOTAL EXPORT ...............................................................................16
FISH QUANTITY EXPORT AS % OF TOTAL CATCH, T.M.CATCH, T.E.CATCH....................................17
STATE OF PAKISTAN’S MARINE FISHERIES SECTOR ...............................................................................17
FISHING SETTLEMENTS/GROUNDS.................................................................................................................17
THERE ARE ON THE SEACOAST OF PAKISTAN MORE THAN 30 SPECIES OF SHRIMP, 10 SPECIES OF CRAB, 5 SPECIES OFLOBSTER AND ABOUT 70 COMMERCIAL SPECIES OF FISH INCLUDING SARDINE, HILSA, SHARK, MACKEREL,BUTTERFISH, POMFRET, SOLE, TUNA, SEA BREAM, JEW FISH AND CAT FISH, SHARK, EEL AND SHRIMP. ...............17
FISH LANDING POINTS/HARBORS....................................................................................................................18
KARACHI FISH HARBOUR ..................................................................................................................................19
KORANGI FISH HARBOR.....................................................................................................................................20
VESSELS(CATEGORIES) ...........................................................................................................................................221991 ........................................................................................................................................................................22
SINDH ........................................................................................................................................................................22
BALOCHISTAN........................................................................................................................................................22
S# ............................................................................................................................................................................24F.A.O GROUP ..........................................................................................................................................................24
FAO REPORTS.........................................................................................................................................................24
YEAR .......................................................................................................................................................................24Marine................................................................................................................................................................24
INLAND....................................................................................................................................................................24
Fisheries Development Strategy SMEDA
3
AREA.......................................................................................................................................................................25Quantity (1998) ..................................................................................................................................................25Quantity (1997) ..................................................................................................................................................25Quantity..............................................................................................................................................................25(1996 ..................................................................................................................................................................25Quantity..............................................................................................................................................................25
INLAND....................................................................................................................................................................25
AQUACULTURE......................................................................................................................................................27
SHRIMP CULTURE.................................................................................................................................................27
CEPHALOPOD RESOURCES AND LANDINGS ................................................................................................27
EXISTING FISHERIES RESOURCES AND INCREMENTAL POTENTIAL.................................................29
RESOURCES .............................................................................................................................................................30Biomass ..............................................................................................................................................................30
M.S.Y......................................................................................................................................................................30THE MARKETING CHANNEL OF THE FISH IS MORE OR LESS SIMILAR TO THOSE OF AGRICULTURAL PRODUCTS, WHERELAND LORD PROVIDES A LAND AND THE PEASANT GROWS THE COMMODITIES. THE PRODUCE IS THEN SOLD IN THEMARKET THROUGH COMMISSION AGENTS TO WHOLESALERS AND THEN TO RETAILERS AND FINALLY TOCONSUMERS. THE INCOME AFTER DEDUCTING THE COST OF DIRECT INPUTS IS SHARED BY THE LANDLORD AND THEPEASANT. .................................................................................................................................................................31
CHANNELS OF DISTRIBUTION FOR FISH AND FISH PRODUCTS............................................................32
STRUCTURAL PROBLEMS OF MARKETING..................................................................................................33
CHANNELS OF DISPOSITION OF THE CATCH ..............................................................................................33
CHANNELS OF DISPOSITION OF FISH (MARINE & INLAND) (IN TONNES)...........34
DISPOSITION CHANNELS..........................................................................................................................................341994 ........................................................................................................................................................................341995 ........................................................................................................................................................................34
PRODUCTION OF MARINE EDIBLE/INEDIBLE FISH ...................................................................................34
YEAR .......................................................................................................................................................................35Total Marine Catch............................................................................................................................................35
TOTAL PRODUCTION OF EDIBLE MARINE AND INLAND FISH AVAILABLE......................................35
YEAR .......................................................................................................................................................................36MARINE EDIBLE FISH...............................................................................................................................................36
Inland Fish .........................................................................................................................................................36
HARVESTING ..........................................................................................................................................................37
Fishing Technology............................................................................................................................................37
VOYAGE TIME:.......................................................................................................................................................37
AVERAGE VOYAGE TIME ...................................................................................................................................38
POST HARVESTING...............................................................................................................................................38
The fish holds of these trawlers are not insulated. For preservation of catch the insufficient crushed ice isapplied. Since no plastic crates are used for storing the catch on board, the catch is piled up in the fish holdwith the result that the two third of the piled up fish of the whole catch is crushed and de-shaped under
Fisheries Development Strategy SMEDA
4
pressure. All these factors lead to deterioration of the quality of landed fish. Due to the post harvest losses, thepoor quality fish fetches less price to the fishermen. Therefore to contain these post harvest losses, the fishholds of the traditional boats urgently needed to be insulated. A cooling and refrigerated system must beinstalled and use of plastic crates for storing the catch in the fish hold should be mandatory. Careful handlingat the port should also need to be encouraged...................................................................................................38
LANDING (AT HARBOR).......................................................................................................................................38
AUCTIONING...........................................................................................................................................................39
TRANSPORTATION................................................................................................................................................39
PROCESSING ...........................................................................................................................................................39
Value Addition Process ......................................................................................................................................40FREEZING ................................................................................................................................................................40INDIVIDUAL QUICK FREEZING..................................................................................................................................40BLAST FREEZING .....................................................................................................................................................40
PROCESSING CAPACITIES..................................................................................................................................41
FISHERIES RELATED RULES AND ACTS ........................................................................................................42
LEGISLATION OF THE COUNTRY ....................................................................................................................42
A SUMMARY OF PROBLEMS ..............................................................................................................................44
TECHNICAL SUPPORT .........................................................................................................................................47
UPGRADATION OF EXISTING TRADITIONAL FLEET.................................................................................48
IMPROVING POST HARVESTING METHODS.................................................................................................49
ANNEXES ..................................................................................................................................................................50
FAX: 51 - 9221246 ....................................................................................................................................................50
GOVERNMENT OF PAKISTAN............................................................................................................................50
MR. MOAZZAM KHAN..........................................................................................................................................50
GOVERNMENT OF NWFP.........................................................................................................................................51GOVERNMENT OF SINDH..........................................................................................................................................51
LIST OF FISHERY RELATED INDUSTRY AND ASSOCIATIONS ................................................................52
20. Mole Holder Association..............................................................................................................................52
FISHERY RELATED RESEARCH & EDUCATIONAL INSTITUTES ............................................................52
(Some international Fisheries Organizations/Groups) ......................................................................................53P O BOX 0896, UN CENTRE, MEDTERMOLEN 3, DK-2100 COPENHAGEN, DENMARK ...........................................53DEPARTMENT OF FISHERIES.....................................................................................................................................5331 MINFENG LANE, XIDAN, BEIJING, CHINA...........................................................................................................54ICH TRADING AB, VASTMANNAGATAN 9, SE-111.................................................................................................54
Fisheries Development Strategy SMEDA
5
Introduction
Pakistan has a total coastline of 1,050 km and a total fishing area of approximately 300,270 sq.kms. Pakistan’s fishing grounds are termed as highly rich in marine life with a vast variety ofspecies having commercial value. However, this potential is not reflected in the export earningfrom fisheries sector, which has remained stagnant around 150 million US$, during last decade.This situation is mainly attributed to highly unorganized nature of private sector, lack of focus inGovernment policies and little institutional investment (in public and private sector projects) inthis sector.
Pakistan’s export stood at 171 million US$ in 1997-98. Whereas, a rough estimate based onmaximum sustainable yield figures, existing value addition, and foreign benchmarks (Indian,Bangladesh and Malaysia benchmarks for %age of landed catch exported) puts our total exportpotential from this sector to around 1.0 billion US $ from existing natural resources. Including ahigh potential area, i.e., aquaculture, in our fisheries sector, can yield even higher export earningsfrom fisheries sector in Pakistan.
Pakistan’s domestic consumption of fish is termed as one of the lowest in the world at 1.6 KGper person/Year. This consumption pattern coupled with increased inland fish production(91,631 tons in 19987 to 167,530 tons in 1997) leaves little room for domestic marketing ofmarine fish. Therefor, the focus remains to be foreign markets mainly Europe, US, Japan andMiddle Eastern countries. A brief analysis of Pakistan’s export products in fisheries sectorsreveals over dependence on few species with little value addition. In particular, overexploitationof shrimp species, reflected by over 66% share in export by value, poses a very strong threat tothe industry as shrimp landing figures are declining and there are no signs of shrimp aquaculturedevelopment in the country. The dependence on a limited number of species causes an imbalanceresulting in over exploitation of few and under-exploitation of other species. This imbalance isalso reflected in fishing grounds with over 99% of landed catch being generated from continentalshelf (0-35 NM) while EEZ (35-200NM) contributing less than 1%. Also our decreasing averageunit prices (2.85 US$/kg in 19987-88 to 2.22 US$/kg in 1997-98) puts extra pressures on theindustry for increased volumes. All of the above situation results in a fishing industry where weare catching more and more of limited number of species in already overexploited fishinggrounds and selling these at low prices to our foreign buyers. Marine resources mismanagementis also aided by an obsolete fishing fleet and fishing methods, use of banned nets, fishing inprohibited breeding areas, poor landing conditions, highly unskilled fishermen and non-existentof modern fishing, handling and processing industry.
The negligence in exploiting marine fisheries resources is highly regrettable given the state ofworld markets. The world market stood at 52 billion US$ in 1997 with Pakistan’s share as lessthan 0.33%. Given the changing eating habits and depleting natural resources, world seafoodmarket is termed as mainly “sellers market”. The focus in fishing is shifting from alreadyexploited regions to under-exploited areas because of conservation and environment pressures.However, despite such favorable circumstances, Pakistan’s seafood exports have decreasedduring recent past with 1992 showing highest figures, i.e., 181 million US$.
Fisheries Development Strategy SMEDA
6
The fisheries sector in Pakistan offers direct employment to over one million people, most ofwhich work as fishermen. There are a large number of fishermen’s villages all along Pakistan’scoast line where fishing is primary source of earnings for centuries. The stagnant fisheries sectordirectly effect standard of living of this community. In addition, these large socioeconomic groupface economic survival problems due to marine resource mismanagement, decreased landingfigures and problems faced by seafood processors (who buy their produce) in export marketingbecause of poor quality product.
Based on the export potential, current and potential employment opportunities and threats tosurvival of seafood industry in Pakistan, SMEDA decided to review the industrial value chainfrom harvesting to processing, with the objective to develop a strategy for optimal utilization ofour marine resources. The Fisheries Development Strategy incorporates public and private sectorinterventions in all effecting areas, i.e., regulation, technology, management, marketing andhuman resources with a view to increase export earnings, create and sustain employment andbring about qualitative change in lives of millions of people involved in this trade.
Methodology
The process of strategy development for fisheries sector was based on data collection from allavailable resources. In addition to other information, following sources were reviewed forstrategy development purposes:
� International Trade Commission data for fisheries trade� FAO data and reports on fisheries sector� Marine Fisheries Development (MFD) reports� Export Promotion Bureau data on fisheries sector� Karachi Fisheries Harbor Authority (KFHA) reports� Fishermen’s Cooperative Society landing and auction/commission data� Infofish reports on Fishery sector profiles of different countries� Relevant federal and provincial regulations for fisheries sector in Pakistan� Relevant national and international regulations on seafood quality control� Stock survey reports
Another important element of SMEDA’s methodology was close liaison with stakeholders, i.e.,fishermen, boat owners, middlemen, seafood processors and relevant government agencies. Thisensured that the strategy is based on existing ground realities and that the stakeholder’s point ofview is incorporated for future development. In this context various office bearers wereconsulted from following organizations:
� Marine Fisheries Department (MFD), Ministry of Food, Agriculture and Livestock(MINFAL), Government of Pakistan (GOP)
� Export Promotion Bureau (EPB), Ministry of Commerce, GOP� Korangi Fish harbor Authority (KoFHA), MINFAL, GOP� Fisheries Department, Government of Sindh (GOS)� Karachi Fisheries Harbor Authority (KFHA), GOS
Fisheries Development Strategy SMEDA
7
� National Institute of Oceanography (NOI)� Center of Excellence in Marine Biology, Karachi University� Fishermen’s Cooperative Society (FCS)� Pakistan Seafood and Industries Association (PSIA) – both factions� Sindh Trawler Owners and Fishermen Association (STOFA)� Karachi Trawler and Boat Owners Group
Numerous meetings were held with personnel representing above organizations. In particular, theprivate industry was consulted at every step of the strategy development process. In addition,primary research was also conducted to develop value chain of fishing sector. SMEDAinterviewed a sample of people and closely observed the following areas to develop anunderstanding of the existing processes and facilities:
� Fishing boats� Unloading areas and the processes at Karachi Fish harbor (KFH)� Auction halls and the process at KFH� Chiller Rooms at KFH� Processing plants� Shrimp Peeling Sheds
Number of meetings were held with representatives on NCB’s for discussing financingarrangements for funding public and private sector initiatives in fisheries sector.
A reference list of reports consulted and contacts for relevant agencies are attached as annexesfor future reference.
Terms
Cephalopods:Mainly three groups of Molluscs characterized by internal skeleton, tentacles surrounding mouthand quick movement by means of water, jet propulsion, namely cuttlefish, squid, and octopus.
Molluscs:The group of species Abalones, winkles, conchs, Oysters, Scallops, Pectens and fresh watermolluscs.
Jaira Shrimp:Local name for the group consisting of Penaeus merguiensis; P. penicillatus the three mostvaluable species of shrimp. It is also called white shrimp.
Kalri Shrimp:Local name for the group of nine species of shrimp commercially next in importance to Jairashrimp. It is also called brown shrimp.
Fisheries Development Strategy SMEDA
8
Kiddi Shrimp:Local name for the group of three least valuable shrimp species.Penaeid and non penaeid shrimp:The commercially importance marine shrimp species that fall under the biological family calledPenaeidae are referred to as a penaeid shrimp while the rest including small acetes shrimp as wellas fresh water prawn.
Shrimp & Prawn:The marine water species are referred to as either shrimp or prawn while fresh water species asprawn.
Tuna & Tuna like Species:Five major tuna species – Skipjack, Yellowfin, Albacore, Bigeye and Bluefin are treated as tunawhile the others like kawakawa, longtail tuna, marlins, bonitos, seerfish, and so on of scombridaefamily are treated as tuna-like species or small tunas.
Keropok:Cracker often containing minced fish and a common snack in Southeast Asia.
Block Frozen:Frozen in blocks of 4 lb/1.8 kg or 2 kg or more for further processing.
Frozen Fish:The frozen shrimp or fish at the temperature of above minus 40.
Fresh Fish:The fresh shrimp or fish at the temperature or below minus 20.
IQF:Individual quick freezing a technique for sea food processing, in which food is freeze with in 3-5minutes.
MSY:Maximum sustainable yield, in which one country is not allowed to go beyond its MSY.
Capture Fishery:The catch of fish through the natural resources like Seas, Rivers, etc.
Aquaculture:The production of fish by culturing it, like culture of shrimp farms, fish farms, ponds etc.
What is Seafood: Products and relative Value Addition
Any marine biomass whether fished from natural environment or developed through man madefarms in any form, i.e., live, chilled/fresh, frozen or cooked is called seafood. The table below
Fisheries Development Strategy SMEDA
9
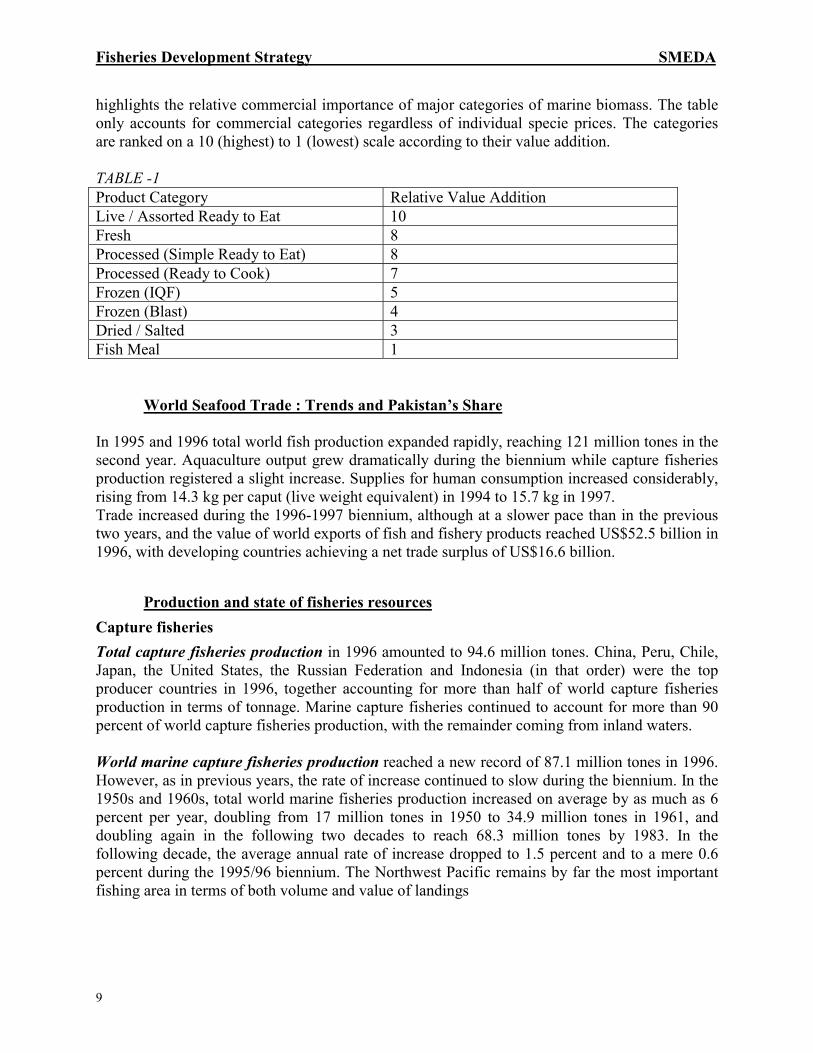
highlights the relative commercial importance of major categories of marine biomass. The tableonly accounts for commercial categories regardless of individual specie prices. The categoriesare ranked on a 10 (highest) to 1 (lowest) scale according to their value addition.
TABLE -1Product Category Relative Value AdditionLive / Assorted Ready to Eat 10Fresh 8Processed (Simple Ready to Eat) 8Processed (Ready to Cook) 7Frozen (IQF) 5Frozen (Blast) 4Dried / Salted 3Fish Meal 1
World Seafood Trade : Trends and Pakistan’s Share
In 1995 and 1996 total world fish production expanded rapidly, reaching 121 million tones in thesecond year. Aquaculture output grew dramatically during the biennium while capture fisheriesproduction registered a slight increase. Supplies for human consumption increased considerably,rising from 14.3 kg per caput (live weight equivalent) in 1994 to 15.7 kg in 1997. Trade increased during the 1996-1997 biennium, although at a slower pace than in the previoustwo years, and the value of world exports of fish and fishery products reached US$52.5 billion in1996, with developing countries achieving a net trade surplus of US$16.6 billion.
Production and state of fisheries resourcesCapture fisheriesTotal capture fisheries production in 1996 amounted to 94.6 million tones. China, Peru, Chile,Japan, the United States, the Russian Federation and Indonesia (in that order) were the topproducer countries in 1996, together accounting for more than half of world capture fisheriesproduction in terms of tonnage. Marine capture fisheries continued to account for more than 90percent of world capture fisheries production, with the remainder coming from inland waters.
World marine capture fisheries production reached a new record of 87.1 million tones in 1996.However, as in previous years, the rate of increase continued to slow during the biennium. In the1950s and 1960s, total world marine fisheries production increased on average by as much as 6percent per year, doubling from 17 million tones in 1950 to 34.9 million tones in 1961, anddoubling again in the following two decades to reach 68.3 million tones by 1983. In thefollowing decade, the average annual rate of increase dropped to 1.5 percent and to a mere 0.6percent during the 1995/96 biennium. The Northwest Pacific remains by far the most importantfishing area in terms of both volume and value of landings
Fisheries Development Strategy SMEDA
10
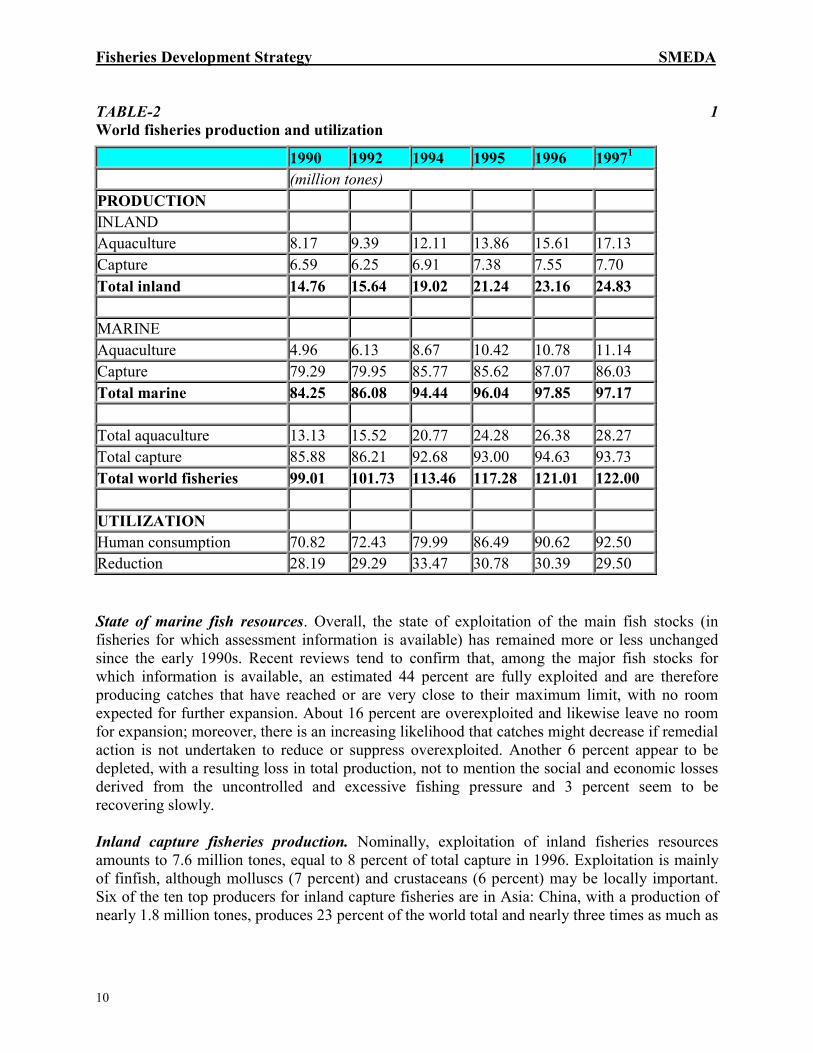
TABLE-2 1World fisheries production and utilization
1990 1992 1994 1995 1996 19971
(million tones)PRODUCTIONINLANDAquaculture 8.17 9.39 12.11 13.86 15.61 17.13Capture 6.59 6.25 6.91 7.38 7.55 7.70Total inland 14.76 15.64 19.02 21.24 23.16 24.83
MARINEAquaculture 4.96 6.13 8.67 10.42 10.78 11.14Capture 79.29 79.95 85.77 85.62 87.07 86.03Total marine 84.25 86.08 94.44 96.04 97.85 97.17
Total aquaculture 13.13 15.52 20.77 24.28 26.38 28.27Total capture 85.88 86.21 92.68 93.00 94.63 93.73Total world fisheries 99.01 101.73 113.46 117.28 121.01 122.00
UTILIZATIONHuman consumption 70.82 72.43 79.99 86.49 90.62 92.50Reduction 28.19 29.29 33.47 30.78 30.39 29.50
State of marine fish resources. Overall, the state of exploitation of the main fish stocks (infisheries for which assessment information is available) has remained more or less unchangedsince the early 1990s. Recent reviews tend to confirm that, among the major fish stocks forwhich information is available, an estimated 44 percent are fully exploited and are thereforeproducing catches that have reached or are very close to their maximum limit, with no roomexpected for further expansion. About 16 percent are overexploited and likewise leave no roomfor expansion; moreover, there is an increasing likelihood that catches might decrease if remedialaction is not undertaken to reduce or suppress overexploited. Another 6 percent appear to bedepleted, with a resulting loss in total production, not to mention the social and economic lossesderived from the uncontrolled and excessive fishing pressure and 3 percent seem to berecovering slowly.
Inland capture fisheries production. Nominally, exploitation of inland fisheries resourcesamounts to 7.6 million tones, equal to 8 percent of total capture in 1996. Exploitation is mainlyof finfish, although molluscs (7 percent) and crustaceans (6 percent) may be locally important.Six of the ten top producers for inland capture fisheries are in Asia: China, with a production ofnearly 1.8 million tones, produces 23 percent of the world total and nearly three times as much as
Fisheries Development Strategy SMEDA
11
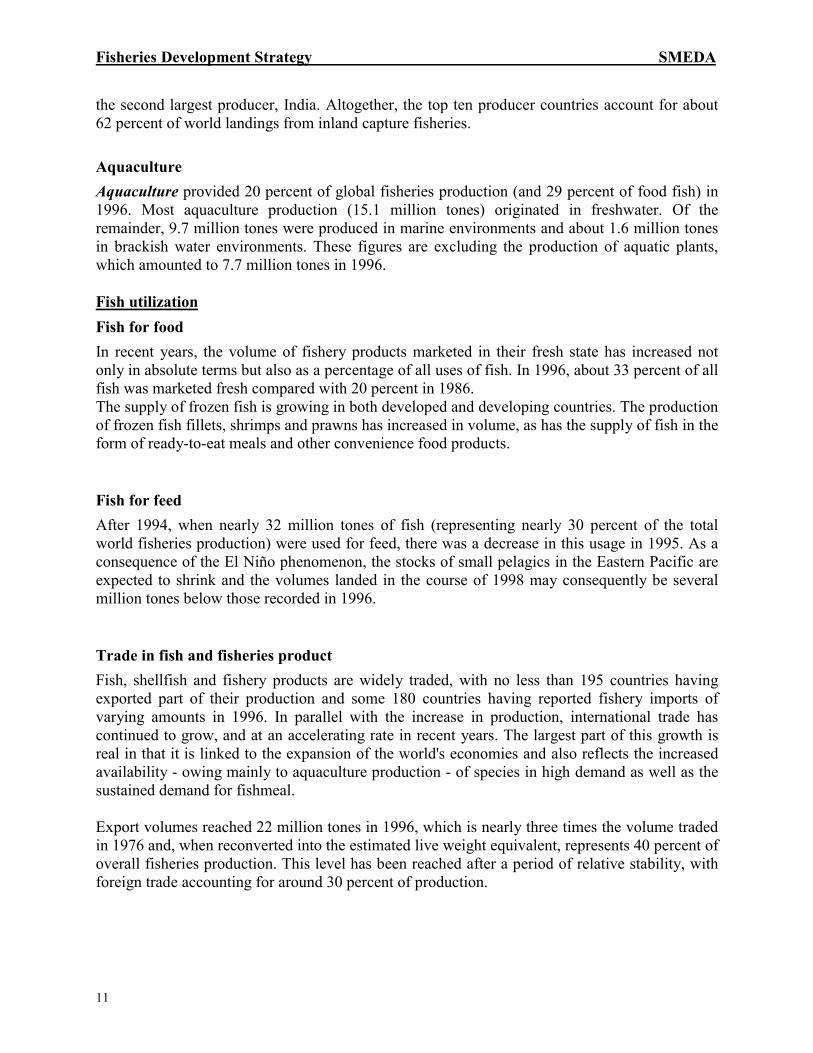
the second largest producer, India. Altogether, the top ten producer countries account for about62 percent of world landings from inland capture fisheries.
AquacultureAquaculture provided 20 percent of global fisheries production (and 29 percent of food fish) in1996. Most aquaculture production (15.1 million tones) originated in freshwater. Of theremainder, 9.7 million tones were produced in marine environments and about 1.6 million tonesin brackish water environments. These figures are excluding the production of aquatic plants,which amounted to 7.7 million tones in 1996.
Fish utilizationFish for foodIn recent years, the volume of fishery products marketed in their fresh state has increased notonly in absolute terms but also as a percentage of all uses of fish. In 1996, about 33 percent of allfish was marketed fresh compared with 20 percent in 1986.The supply of frozen fish is growing in both developed and developing countries. The productionof frozen fish fillets, shrimps and prawns has increased in volume, as has the supply of fish in theform of ready-to-eat meals and other convenience food products.
Fish for feedAfter 1994, when nearly 32 million tones of fish (representing nearly 30 percent of the totalworld fisheries production) were used for feed, there was a decrease in this usage in 1995. As aconsequence of the El Niño phenomenon, the stocks of small pelagics in the Eastern Pacific areexpected to shrink and the volumes landed in the course of 1998 may consequently be severalmillion tones below those recorded in 1996.
Trade in fish and fisheries productFish, shellfish and fishery products are widely traded, with no less than 195 countries havingexported part of their production and some 180 countries having reported fishery imports ofvarying amounts in 1996. In parallel with the increase in production, international trade hascontinued to grow, and at an accelerating rate in recent years. The largest part of this growth isreal in that it is linked to the expansion of the world's economies and also reflects the increasedavailability - owing mainly to aquaculture production - of species in high demand as well as thesustained demand for fishmeal.
Export volumes reached 22 million tones in 1996, which is nearly three times the volume tradedin 1976 and, when reconverted into the estimated live weight equivalent, represents 40 percent ofoverall fisheries production. This level has been reached after a period of relative stability, withforeign trade accounting for around 30 percent of production.

Fisheries Development Strategy SMEDA
12
In 1996, the export sector earned US$52.5 billion, representing 11 percent of the value ofagricultural exports and about 1 percent of total merchandise trade. The share of trade in fish andfishery products in all agricultural trade has increased somewhat over the last decade.Although fishery trade is not prominent at the global level, in some countries its contribution toforeign currency earnings is vital to the national economy; for example, fish and fishery productsrepresent more than 75 percent of total merchandise exports for Iceland, the Faeroe Islands,Greenland, Maldives and Seychelles. In a further 20 countries, including Chile, Ecuador,Kiribati, Madagascar, Mauritania, Morocco, Mozambique, Namibia, Peru and Senegal, fisheriesexports account for between 75 and 10 percent of total merchandise exports.In terms of value, fishery exports are almost entirely (95 percent) composed of food products,although, in terms of volume, fishmeal and fish oil account for a much greater share. In valueterms, more than half of the fishery export trade originates in developing economies and consistslargely of imports into developed economies. While Thailand was the leading world exporter offish products between 1993 and 1996, at a value of US$3.4 billion, Norway's fishery exportswere the highest in 1997. Japan, with US$15.5 billion worth of imports in 1997, is the leadingimporter while the United States absorbs about 10 percent of world fish imports. These twocountries and the European Community (including the value of the intra-EC trade) import 75percent (in value terms) of internationally traded fishery products.
Fisheries Development Strategy SMEDA
13
Recent Trends In International Fish Trade
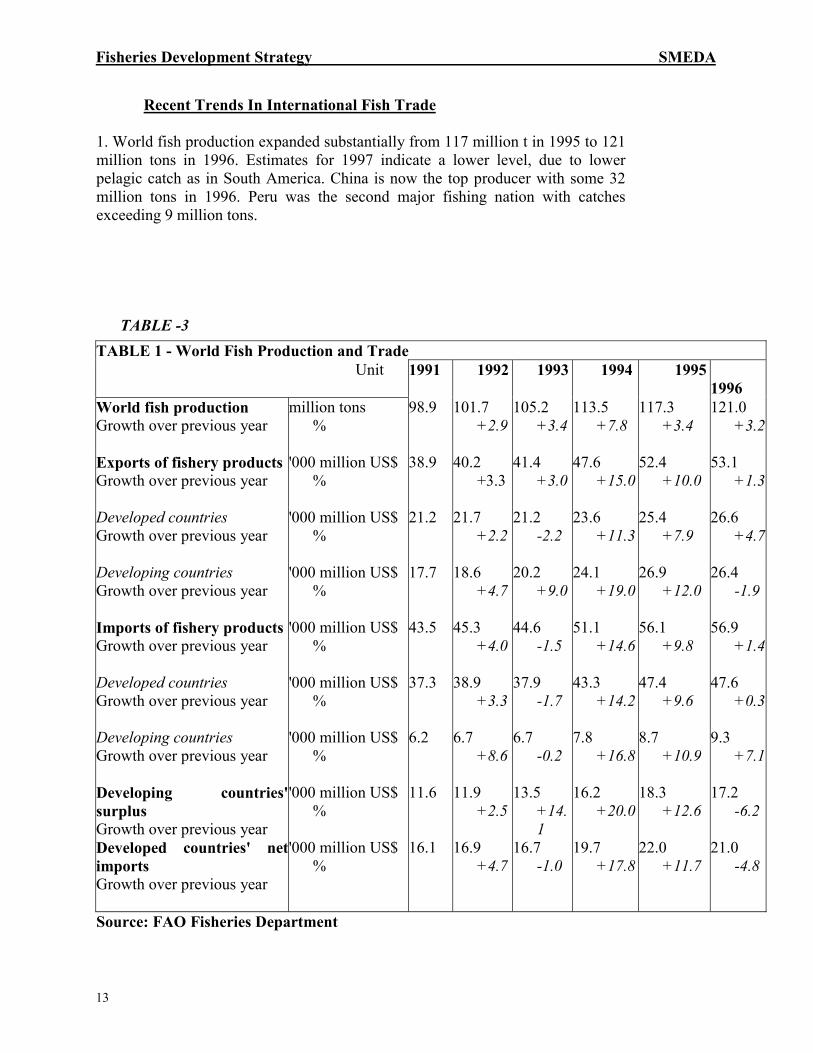
1. World fish production expanded substantially from 117 million t in 1995 to 121million tons in 1996. Estimates for 1997 indicate a lower level, due to lowerpelagic catch as in South America. China is now the top producer with some 32million tons in 1996. Peru was the second major fishing nation with catchesexceeding 9 million tons.
TABLE -3TABLE 1 - World Fish Production and Trade Unit 1991 1992 1993 1994 1995
1996World fish productionGrowth over previous year
million tons%
98.9 101.7+2.9
105.2+3.4
113.5+7.8
117.3+3.4
121.0+3.2
Exports of fishery productsGrowth over previous year
'000 million US$%
38.9 40.2+3.3
41.4+3.0
47.6+15.0
52.4+10.0
53.1+1.3
Developed countriesGrowth over previous year
'000 million US$%
21.2 21.7+2.2
21.2-2.2
23.6+11.3
25.4+7.9
26.6+4.7
Developing countriesGrowth over previous year
'000 million US$%
17.7 18.6+4.7
20.2+9.0
24.1+19.0
26.9+12.0
26.4-1.9
Imports of fishery productsGrowth over previous year
'000 million US$%
43.5 45.3+4.0
44.6-1.5
51.1+14.6
56.1+9.8
56.9+1.4
Developed countriesGrowth over previous year
'000 million US$%
37.3 38.9+3.3
37.9-1.7
43.3+14.2
47.4+9.6
47.6+0.3
Developing countriesGrowth over previous year
'000 million US$%
6.2 6.7+8.6
6.7-0.2
7.8+16.8
8.7+10.9
9.3+7.1
Developing countries'surplusGrowth over previous year
'000 million US$%
11.6 11.9+2.5
13.5+14.1
16.2+20.0
18.3+12.6
17.2-6.2
Developed countries' netimportsGrowth over previous year
'000 million US$%
16.1 16.9+4.7
16.7-1.0
19.7+17.8
22.0+11.7
21.0-4.8
Source: FAO Fisheries Department
Fisheries Development Strategy SMEDA
14
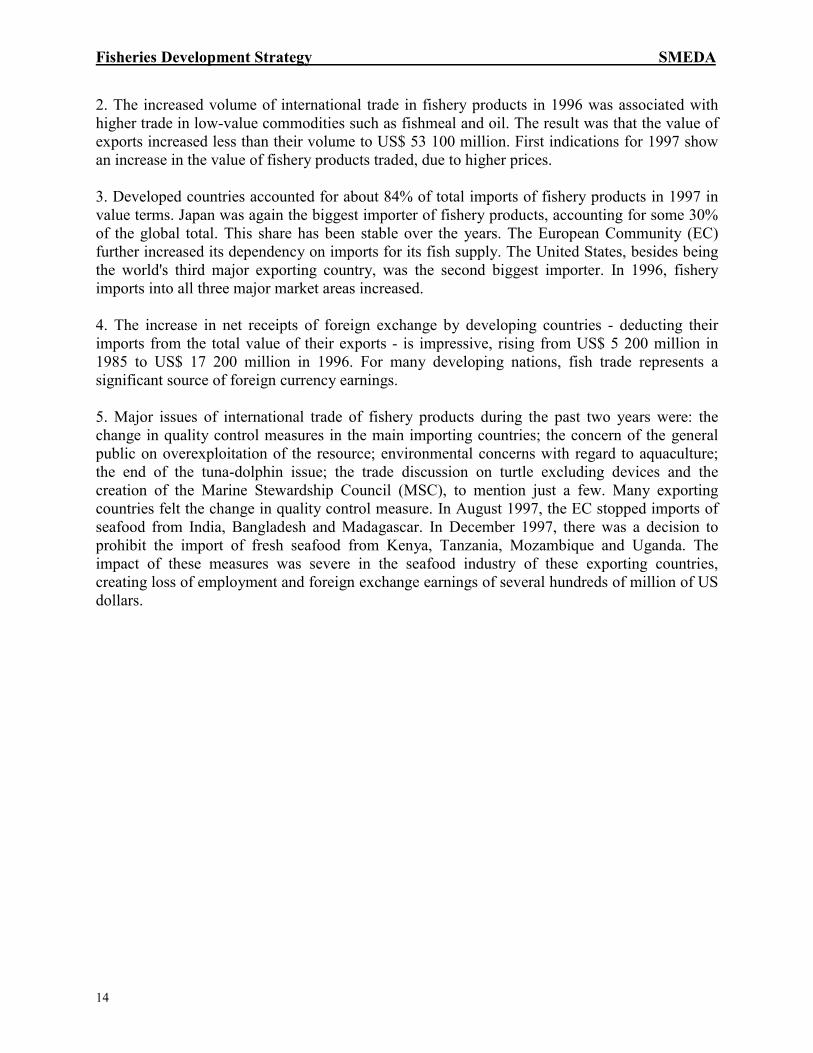
2. The increased volume of international trade in fishery products in 1996 was associated withhigher trade in low-value commodities such as fishmeal and oil. The result was that the value ofexports increased less than their volume to US$ 53 100 million. First indications for 1997 showan increase in the value of fishery products traded, due to higher prices.
3. Developed countries accounted for about 84% of total imports of fishery products in 1997 invalue terms. Japan was again the biggest importer of fishery products, accounting for some 30%of the global total. This share has been stable over the years. The European Community (EC)further increased its dependency on imports for its fish supply. The United States, besides beingthe world's third major exporting country, was the second biggest importer. In 1996, fisheryimports into all three major market areas increased.
4. The increase in net receipts of foreign exchange by developing countries - deducting theirimports from the total value of their exports - is impressive, rising from US$ 5 200 million in1985 to US$ 17 200 million in 1996. For many developing nations, fish trade represents asignificant source of foreign currency earnings.
5. Major issues of international trade of fishery products during the past two years were: thechange in quality control measures in the main importing countries; the concern of the generalpublic on overexploitation of the resource; environmental concerns with regard to aquaculture;the end of the tuna-dolphin issue; the trade discussion on turtle excluding devices and thecreation of the Marine Stewardship Council (MSC), to mention just a few. Many exportingcountries felt the change in quality control measure. In August 1997, the EC stopped imports ofseafood from India, Bangladesh and Madagascar. In December 1997, there was a decision toprohibit the import of fresh seafood from Kenya, Tanzania, Mozambique and Uganda. Theimpact of these measures was severe in the seafood industry of these exporting countries,creating loss of employment and foreign exchange earnings of several hundreds of million of USdollars.
Fisheries Development Strategy SMEDA
15
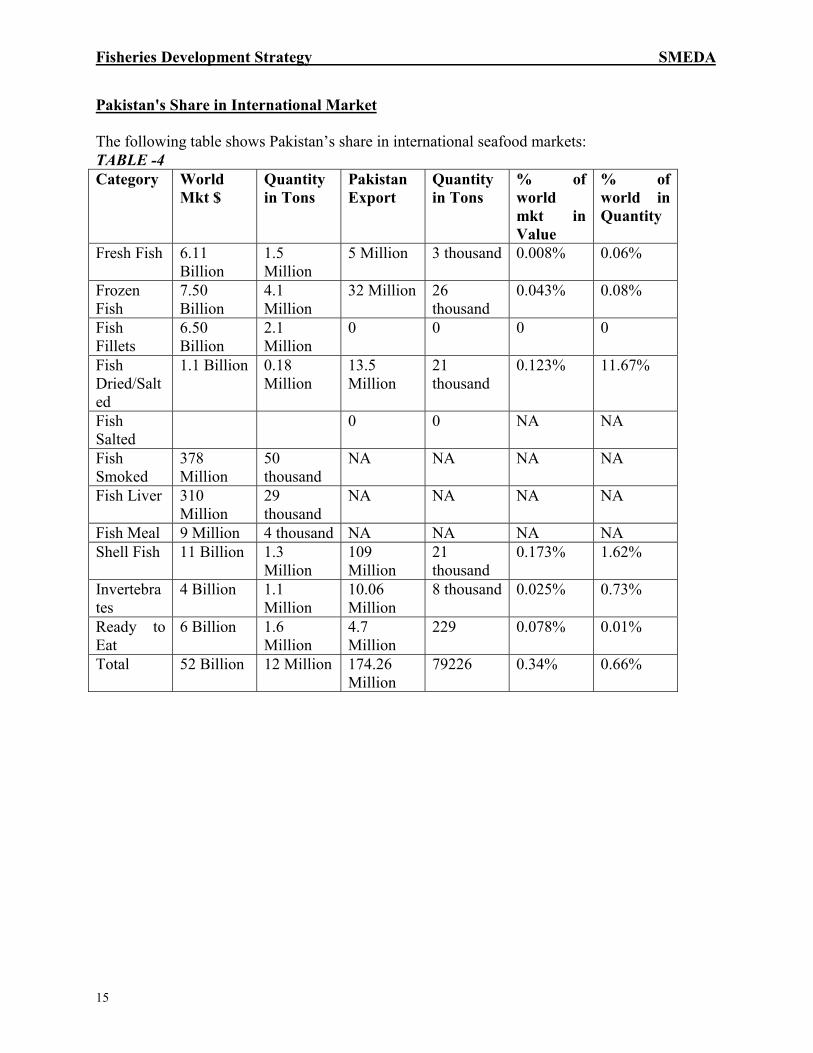
Pakistan's Share in International Market
The following table shows Pakistan’s share in international seafood markets:TABLE -4Category World
Mkt $Quantityin Tons
PakistanExport
Quantityin Tons
% ofworldmkt inValue
% ofworld inQuantity
Fresh Fish 6.11Billion
1.5Million
5 Million 3 thousand 0.008% 0.06%
FrozenFish
7.50Billion
4.1Million
32 Million 26thousand
0.043% 0.08%
FishFillets
6.50Billion
2.1Million
0 0 0 0
FishDried/Salted
1.1 Billion 0.18Million
13.5Million
21thousand
0.123% 11.67%
FishSalted
0 0 NA NA
FishSmoked
378Million
50thousand
NA NA NA NA
Fish Liver 310Million
29thousand
NA NA NA NA
Fish Meal 9 Million 4 thousand NA NA NA NAShell Fish 11 Billion 1.3
Million109Million
21thousand
0.173% 1.62%
Invertebrates
4 Billion 1.1Million
10.06Million
8 thousand 0.025% 0.73%
Ready toEat
6 Billion 1.6Million
4.7Million
229 0.078% 0.01%
Total 52 Billion 12 Million 174.26Million
79226 0.34% 0.66%
Fisheries Development Strategy SMEDA
16
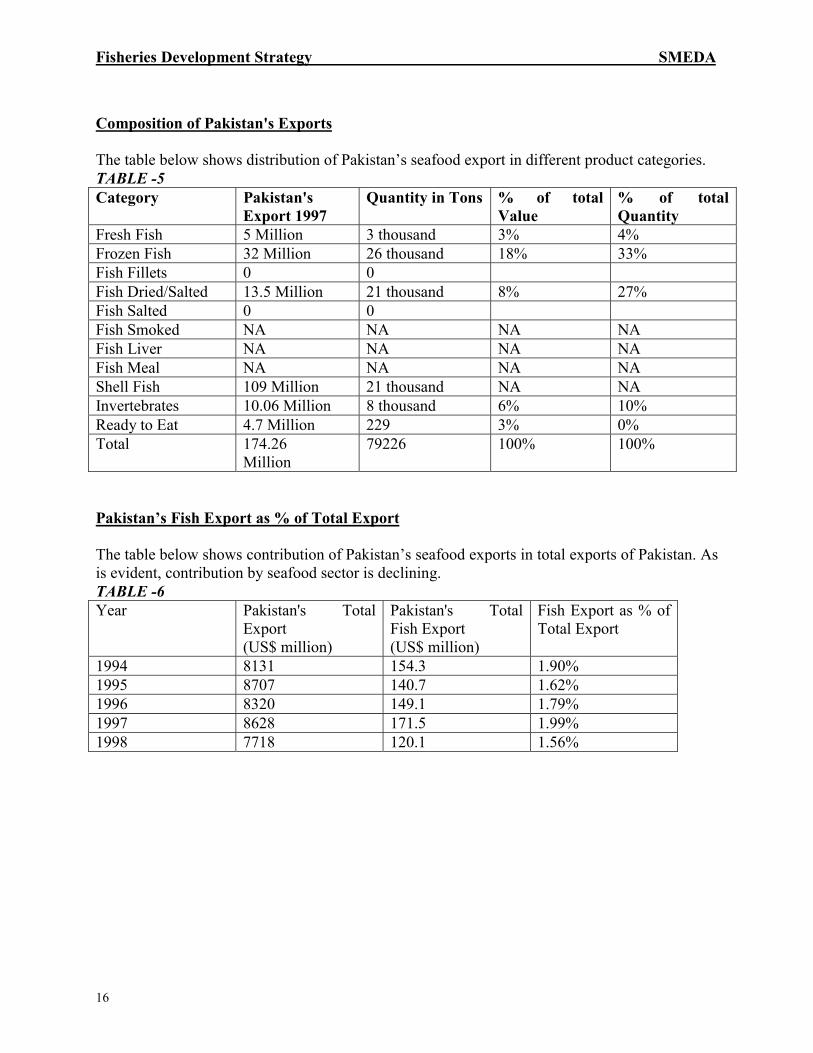
Composition of Pakistan's Exports
The table below shows distribution of Pakistan’s seafood export in different product categories.TABLE -5Category Pakistan's
Export 1997Quantity in Tons % of total
Value% of totalQuantity
Fresh Fish 5 Million 3 thousand 3% 4%Frozen Fish 32 Million 26 thousand 18% 33%Fish Fillets 0 0Fish Dried/Salted 13.5 Million 21 thousand 8% 27%Fish Salted 0 0Fish Smoked NA NA NA NAFish Liver NA NA NA NAFish Meal NA NA NA NAShell Fish 109 Million 21 thousand NA NAInvertebrates 10.06 Million 8 thousand 6% 10%Ready to Eat 4.7 Million 229 3% 0%Total 174.26
Million79226 100% 100%
Pakistan’s Fish Export as % of Total Export
The table below shows contribution of Pakistan’s seafood exports in total exports of Pakistan. Asis evident, contribution by seafood sector is declining.TABLE -6Year Pakistan's Total
Export(US$ million)
Pakistan's TotalFish Export(US$ million)
Fish Export as % ofTotal Export
1994 8131 154.3 1.90%1995 8707 140.7 1.62%1996 8320 149.1 1.79%1997 8628 171.5 1.99%1998 7718 120.1 1.56%
Fisheries Development Strategy SMEDA
17
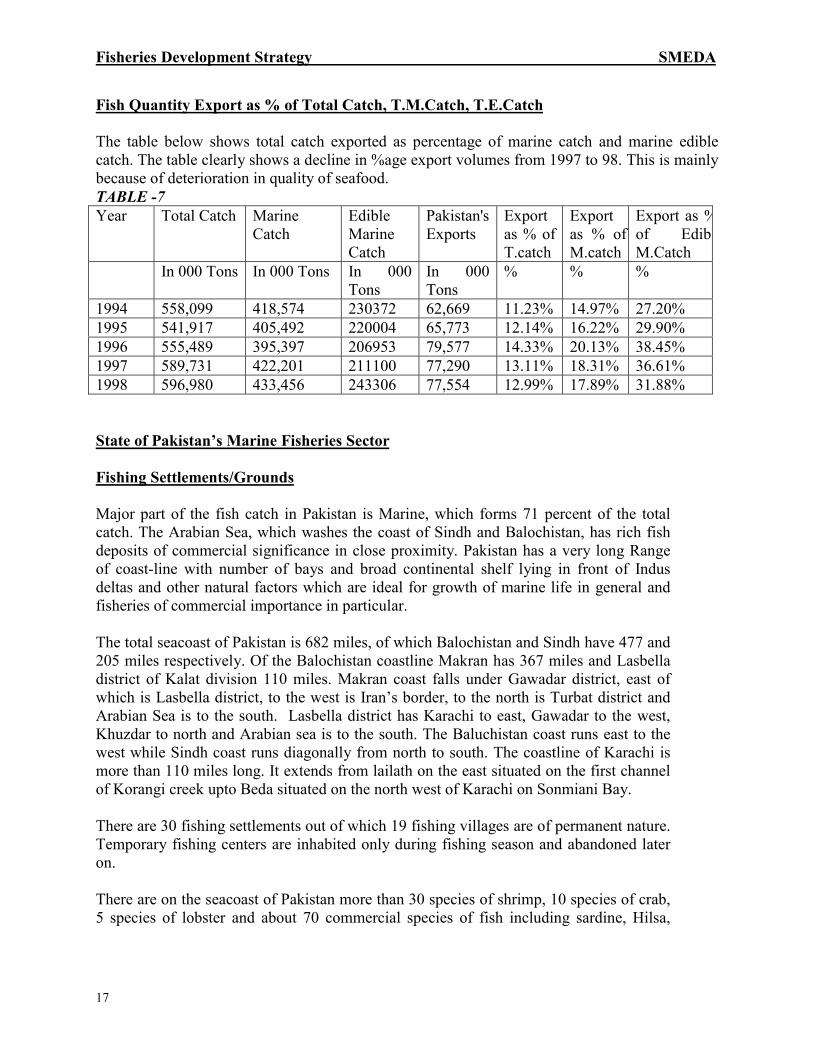
Fish Quantity Export as % of Total Catch, T.M.Catch, T.E.Catch
The table below shows total catch exported as percentage of marine catch and marine ediblecatch. The table clearly shows a decline in %age export volumes from 1997 to 98. This is mainlybecause of deterioration in quality of seafood.TABLE -7Year Total Catch Marine
CatchEdibleMarineCatch
Pakistan'sExports
Exportas % ofT.catch
Exportas % ofM.catch
Export as %of EdiblM.Catch
In 000 Tons In 000 Tons In 000Tons
In 000Tons
% % %
1994 558,099 418,574 230372 62,669 11.23% 14.97% 27.20%1995 541,917 405,492 220004 65,773 12.14% 16.22% 29.90%1996 555,489 395,397 206953 79,577 14.33% 20.13% 38.45%1997 589,731 422,201 211100 77,290 13.11% 18.31% 36.61%1998 596,980 433,456 243306 77,554 12.99% 17.89% 31.88%
State of Pakistan’s Marine Fisheries Sector
Fishing Settlements/Grounds
Major part of the fish catch in Pakistan is Marine, which forms 71 percent of the totalcatch. The Arabian Sea, which washes the coast of Sindh and Balochistan, has rich fishdeposits of commercial significance in close proximity. Pakistan has a very long Rangeof coast-line with number of bays and broad continental shelf lying in front of Indusdeltas and other natural factors which are ideal for growth of marine life in general andfisheries of commercial importance in particular.
The total seacoast of Pakistan is 682 miles, of which Balochistan and Sindh have 477 and205 miles respectively. Of the Balochistan coastline Makran has 367 miles and Lasbelladistrict of Kalat division 110 miles. Makran coast falls under Gawadar district, east ofwhich is Lasbella district, to the west is Iran’s border, to the north is Turbat district andArabian Sea is to the south. Lasbella district has Karachi to east, Gawadar to the west,Khuzdar to north and Arabian sea is to the south. The Baluchistan coast runs east to thewest while Sindh coast runs diagonally from north to south. The coastline of Karachi ismore than 110 miles long. It extends from lailath on the east situated on the first channelof Korangi creek upto Beda situated on the north west of Karachi on Sonmiani Bay.
There are 30 fishing settlements out of which 19 fishing villages are of permanent nature.Temporary fishing centers are inhabited only during fishing season and abandoned lateron.
There are on the seacoast of Pakistan more than 30 species of shrimp, 10 species of crab,5 species of lobster and about 70 commercial species of fish including sardine, Hilsa,
Fisheries Development Strategy SMEDA
18
shark, Mackerel, Butterfish, Pomfret, Sole, Tuna, sea bream, Jew fish and Cat Fish,Shark, Eel and shrimp.
Marine fishing is undertaken from right beyond the seacoast to 200 n. miles in the sea.The distance has been divided into two broad categories known as: (1) Coastal WaterFishing, and (2) Deep-sea fishing. Deep Sea is further divided in two zones. The distancespecified are: up-to 12 n. miles for coastal water fishing, 12 to 35 n.miles for Zone 1 and35 to 200 n. miles for Zone II.
Coastal water fishing is done in the villages along the coast that are predominatelyinhabited by fisherman whose main livelihood is fishing. The fishermen community ismainly Sindhis, Balochis, Kutchies, Zikries and Makranis. Karachi, which is the nucleusof fishing industry, is an old fishing settlement.
In Sindh the south of the Karachi Coastal area is Indus delta and has a number of fishingsettlements in creeks, of which Keti Bunder is an important center.
In Balochistan the major centers for fish catching are (I) Ormara (ii) Kalmat (iii) Pasni (iv)Gawadar (v) Jiwani (vi) Kor Bandar, (vii) Ras Shumal Bundar (viii) Kapar (ix) Sur (x) Peshukanand Bandari. Lassbella district has Sonmiani, Damb and Gadani as its fishing centres.
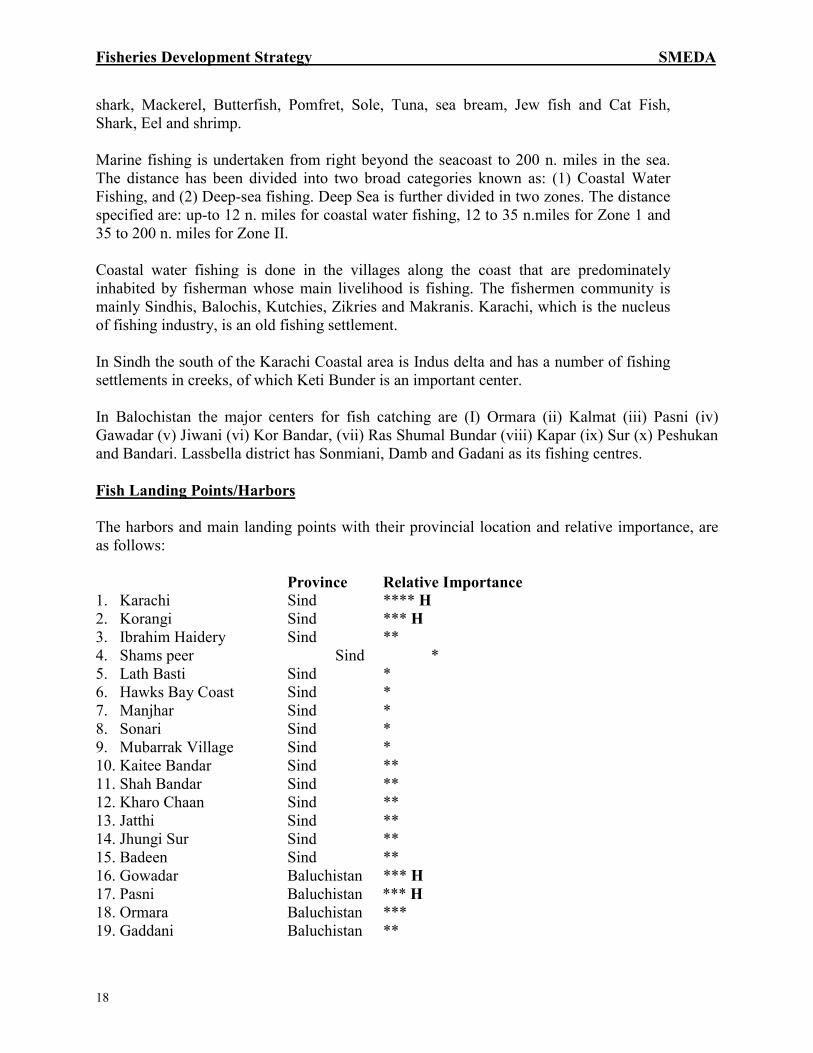
Fish Landing Points/Harbors
The harbors and main landing points with their provincial location and relative importance, areas follows:
Province Relative Importance1. Karachi Sind **** H2. Korangi Sind *** H3. Ibrahim Haidery Sind **4. Shams peer Sind *5. Lath Basti Sind *6. Hawks Bay Coast Sind *7. Manjhar Sind *8. Sonari Sind *9. Mubarrak Village Sind *10. Kaitee Bandar Sind **11. Shah Bandar Sind **12. Kharo Chaan Sind **13. Jatthi Sind **14. Jhungi Sur Sind **15. Badeen Sind **16. Gowadar Baluchistan *** H17. Pasni Baluchistan *** H18. Ormara Baluchistan ***19. Gaddani Baluchistan **
Fisheries Development Strategy SMEDA
19
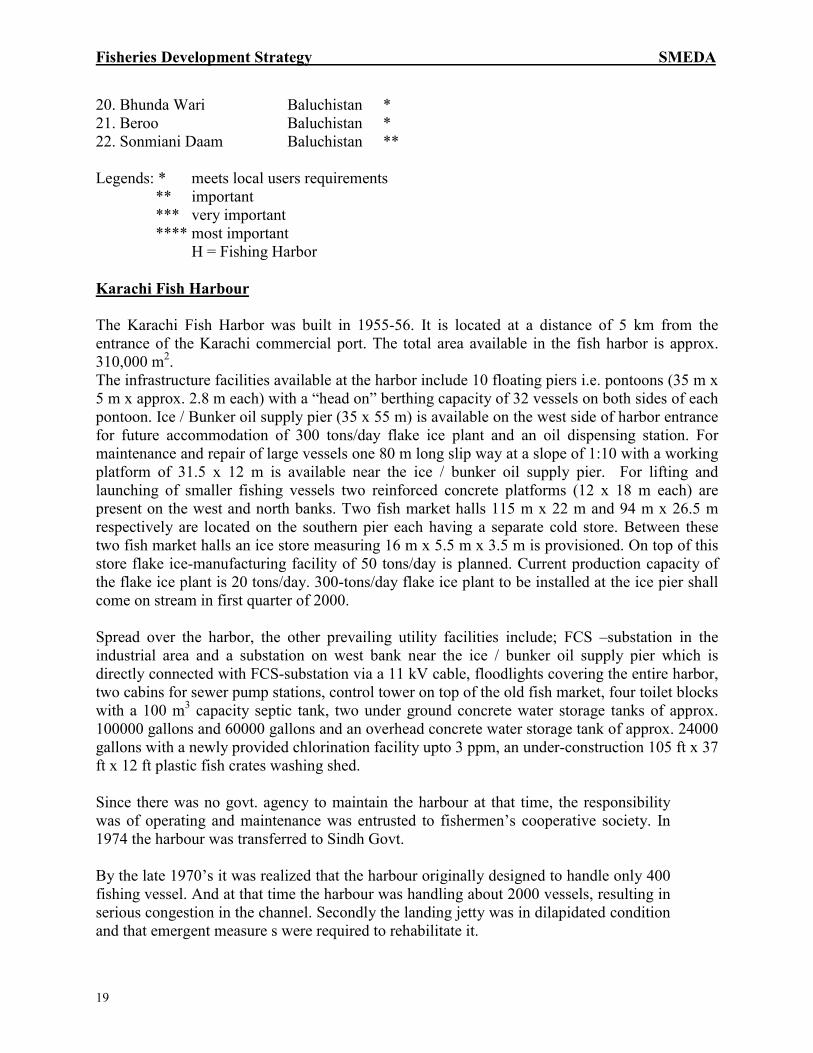
20. Bhunda Wari Baluchistan *21. Beroo Baluchistan *22. Sonmiani Daam Baluchistan **
Legends: * meets local users requirements ** important *** very important
**** most importantH = Fishing Harbor
Karachi Fish Harbour
The Karachi Fish Harbor was built in 1955-56. It is located at a distance of 5 km from theentrance of the Karachi commercial port. The total area available in the fish harbor is approx.310,000 m2.The infrastructure facilities available at the harbor include 10 floating piers i.e. pontoons (35 m x5 m x approx. 2.8 m each) with a “head on” berthing capacity of 32 vessels on both sides of eachpontoon. Ice / Bunker oil supply pier (35 x 55 m) is available on the west side of harbor entrancefor future accommodation of 300 tons/day flake ice plant and an oil dispensing station. Formaintenance and repair of large vessels one 80 m long slip way at a slope of 1:10 with a workingplatform of 31.5 x 12 m is available near the ice / bunker oil supply pier. For lifting andlaunching of smaller fishing vessels two reinforced concrete platforms (12 x 18 m each) arepresent on the west and north banks. Two fish market halls 115 m x 22 m and 94 m x 26.5 mrespectively are located on the southern pier each having a separate cold store. Between thesetwo fish market halls an ice store measuring 16 m x 5.5 m x 3.5 m is provisioned. On top of thisstore flake ice-manufacturing facility of 50 tons/day is planned. Current production capacity ofthe flake ice plant is 20 tons/day. 300-tons/day flake ice plant to be installed at the ice pier shallcome on stream in first quarter of 2000.
Spread over the harbor, the other prevailing utility facilities include; FCS –substation in theindustrial area and a substation on west bank near the ice / bunker oil supply pier which isdirectly connected with FCS-substation via a 11 kV cable, floodlights covering the entire harbor,two cabins for sewer pump stations, control tower on top of the old fish market, four toilet blockswith a 100 m3 capacity septic tank, two under ground concrete water storage tanks of approx.100000 gallons and 60000 gallons and an overhead concrete water storage tank of approx. 24000gallons with a newly provided chlorination facility upto 3 ppm, an under-construction 105 ft x 37ft x 12 ft plastic fish crates washing shed.
Since there was no govt. agency to maintain the harbour at that time, the responsibilitywas of operating and maintenance was entrusted to fishermen’s cooperative society. In1974 the harbour was transferred to Sindh Govt.
By the late 1970’s it was realized that the harbour originally designed to handle only 400fishing vessel. And at that time the harbour was handling about 2000 vessels, resulting inserious congestion in the channel. Secondly the landing jetty was in dilapidated conditionand that emergent measure s were required to rehabilitate it.
Fisheries Development Strategy SMEDA
20
As a result the study was carried out in 1980 under the aegis of Asian Development Bankwhich earmarked funds for this project and the harbour was expanded at the cost of RS.250 million. European Economic Community offered a grant of 12 million ECU to meetthe project expenditure. The expansion of harbour included rehabilitation of the existingquay, storage facilities, water and power supply and dredging and widening of channelfrom 90 to 120 meter. New facilities included construction of floating pontoons, new fishshed of 2500 sq.metre, slipway and infrastructure of boat repair yard, new roads, openstorage areas, new water supply and electricity facilities, ice supply berth, bunker fuelsupply berth and the fire fighting equipment. The project was completed in 1990. Karachifish harbour authority was established in 1984 for rehabilitation of the harbour andequipping it with accessories.
Korangi Fish Harbor
Because the congestion at he Karachi fish harbour it was strongly felt that anotherharbour nearby should be developed. Accordingly in august 1978 Asian DevelopmentBank approved a project and engaged M/s Norconsult to conduct feasibility studies forthe second fisheries development project in Paksitan. The consultant completed theassignment in 1979. Consequently ADB provide loan in December 1980 of 25.338 USmillion dollars for the construction of this harbour. Th basic objective of the harbour is toincrease the foreign exchange earnings through new catch by accommodating large sizevessels by exploiting the untapped fisheries resources in the sea.
The total project cost incurred so far is Rs. 916 million. The project facilities includes709 meter long jetty, an auction hall an administrative building, a generator building,provision of service and utilities, power and utilities, sewerage and water, reclamation of180000 sq. meter port area. Including 40,000 sq. meter for establishing processing units.And 50,000 sq.metre for boat building and repair facilities. Construction of 2.5 km ofaccess road and 3200 sq.metres gravelled areas and port roads, provision for navigationalaid equipment, internal development of industrial area etc.
The harbor was completed in 1992 but till today it is not operative,although, in recentpast some deep sea fishing vessels are using Korangi’s landing facilties. The KFHAauthority was established in 1982 and started functioning in 1983.
There were two main objective of the harbour , one was to remove a congestion at theKarachi fish harbour and another was to promote deep sea fishing by accommodatinglarger size vessels for exploiting fishing vessels beyond 12. N miles. Neither of theseobjectives have yet been achieved.
Gawadar Fish Harbor
Compared to Sindh, Balochistan has a longer coastline, offering fish resources at a largecoast. However the quantity landed in Balochistan is less than the sindh. This is attributedto lack of infrastructure and basic marketing facilities.
Fisheries Development Strategy SMEDA
21
One important fish harbor in Baluchistan is Gawadar which is situated at about 290miles west of Karachi on the Balochistan coast. About 23 percent of the total fish catchfor the country is obtained from Balochistan. Out of which the share of Gawadar is 37percent. The construction of the Gawadar port was completed 1992. The project includesconstruction of 416 meter long and 65 meter wide jetty. To provide marketing facility forthe daily fish landing, an auction hall of 3000 sq. meter is built over the jetty. For the safeand fast handling of fish catch, 500 hand trolleys and 1000 fish containers are alsoprovided in the auction hall.
A storage shed covering an area of 1000 sq. meters is provided at the end of the jetty tofacilitate the fishermen to get their needs like nets, spare parts etc. The powerhouse isequipped with 3nos 750 KVA generators. An underground tank of 150000-gallan scapacity is constructed. The port has its own dredges and support equipment comprisingof dredge discharge line 4 km long, booster station, tug boat, work boat, launch andbarge.
Pasni Fish Harrbor
In order to increase fish production by providing improved fishing technology and basicinfrastructure and marketing facilities to improve the socioeconomic conditions offishermen community along the Mekran coast, the ADB agreed to provide financialassistance for construction of a compact fishery harbour at Pasni, because of its bestsuited location.
The project was started in 1987 and completed in 1989. The total cost of the project wasRs. 563 million of which Rs. 495 million was provided by ADB and the rest byBalochistan Govt. The project included construction of 1225 meters long jetties, 647 longberthing jetties, 150 meter long berth and cargo jetty, 100 meter long quay, 150 metersouth berthing jetty, 60 meter unloading jetty, 120 meter north berthing jetty. 67 metercauseway jetty, 150 meter landing beach, 1300 sq.metre market hall and 800 sq.met portauthority building. Power supply is 320 KVA through diesel generating set.. There aretwo tanks of 800000 litters of diesel 250,000 litter of kerosene oil. Beside this there aresix small ice plants with total production of 5000 ice blocks per day.
Some Facts About Fish Harbors in Pakistan
It was observed that all the four fish harbors are under different administrative control.For example Karachi fish Harbour is under Government of Sindh., Korangi fish harborunder the MINFAL, Government of Pakistan, Gawadar fish harbour-cum mini port isunder Ministry of Communication, Govt. of Pakistan and Pasni fish harbor is under
Fisheries Development Strategy SMEDA
22
Balochistan Govt. This causes lack of coordination and consistency in the governmentpolicies wrt to harbours management.
An important factor common to three fish harbors namely Korangi, Gawadar, and Pasniis the lack of electricity connection from main transportation lines of KESC or WAPDA.The electricity obtained through generators is not sufficient for the needs of harbors.Private sector is reluctant to construct processing plants due to shortage of power andother utlities.
There is no direct export facility from the Gawadar and Pasni harbors, the catch isbrought to Karachi for export which is a main reason for the deterioration of the catch,because of poor road conditions and the time required for transportation, e.g., 30-40hours.
Fishing Vessels
The following types of vessels are currently operating in fishing sector:
1. Trawlers2. Gill-netters3. Long liners4. Howra for fresh trash fish5. Dhonda ( gill-netters)
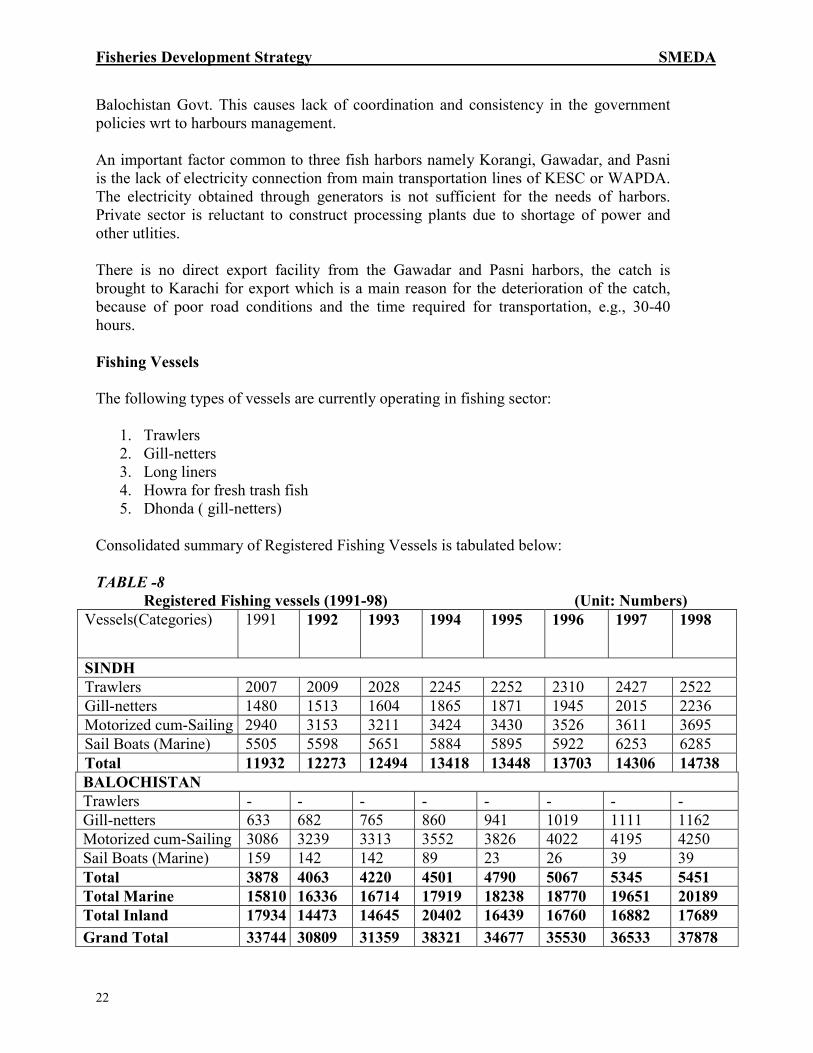
Consolidated summary of Registered Fishing Vessels is tabulated below:
TABLE -8Registered Fishing vessels (1991-98) (Unit: Numbers)
Vessels(Categories) 1991 1992 1993 1994 1995 1996 1997 1998
SINDHTrawlers 2007 2009 2028 2245 2252 2310 2427 2522Gill-netters 1480 1513 1604 1865 1871 1945 2015 2236Motorized cum-Sailing 2940 3153 3211 3424 3430 3526 3611 3695Sail Boats (Marine) 5505 5598 5651 5884 5895 5922 6253 6285Total 11932 12273 12494 13418 13448 13703 14306 14738BALOCHISTANTrawlers - - - - - - - -Gill-netters 633 682 765 860 941 1019 1111 1162Motorized cum-Sailing 3086 3239 3313 3552 3826 4022 4195 4250Sail Boats (Marine) 159 142 142 89 23 26 39 39Total 3878 4063 4220 4501 4790 5067 5345 5451Total Marine 15810 16336 16714 17919 18238 18770 19651 20189Total Inland 17934 14473 14645 20402 16439 16760 16882 17689Grand Total 33744 30809 31359 38321 34677 35530 36533 37878
Fisheries Development Strategy SMEDA
23
Progressive addition 2935 550 6962 3644 853 1003 1345
Source: MFD
Although there are around 20189 vessels registered for marine fishing but it is estimated that inactual the number of vessels in active operation can be as low as 4000.
Vessel’s Description
Trawlers
This vessel uses a trawling net for targeted shrimp catching. The net size (eye) varies accordingto the need of the owner and crew and weighs around 0.6 tons. These boats require powerful andwell-maintained engines for pulling the trawling net (gujja). The size of these trawlers variesfrom 30 to 45 feet keel length and the crew ranges between 12 – 20 men. Trawlers remaincontinuously in operation from August till May. These trawlers are required to be registered withMMD (Mercantile Marine Department). These trawlers are fitted with 66 –240 HP marine dieselengines as well as non-marine engines. For cost effective trawling operations on long voyage it isimperative that the vessel is fitted with marine engines capable of continuos running throughoutthe voyage.
Gill-netters
This vessel uses net for catching fish, these nets are relatively big and weigh around 0.6 to 2.5tons. The size of these trawlers varies from 45 – 60 feet keel length and the crew ranges between15 and 34 men. They remain continuously in operation throughout the year except June, July andAugust. During gill netting there engines remain idle. These vessels are required to be registeredwith MMD (Mercantile Marine Department).
Long liners
These are mainly deep sea fishing vessels over 100 GRT rating and are similar to trawlers but areequipped with winches for net pulling. Capacity is large and have powerful engines. Thesetrawlers are required to be registered with MMD (Mercantile Marine Department).
Howra for fresh fish
These vessels are same as gill-netters with average overall length varying between 30 – 40 feet.Used for fishing voyage of one to three days. Use of ice is rather limited due to short duration.Most of these have removable fish holds.
Dhonda ( gill-netters)
These vessels are small lifeboats converted into fishing gill-netters. They use small nets andmostly kundi. Their size is below 30 feet and voyage ranges between one to three days.
Fisheries Development Strategy SMEDA
24
Fishing Methods
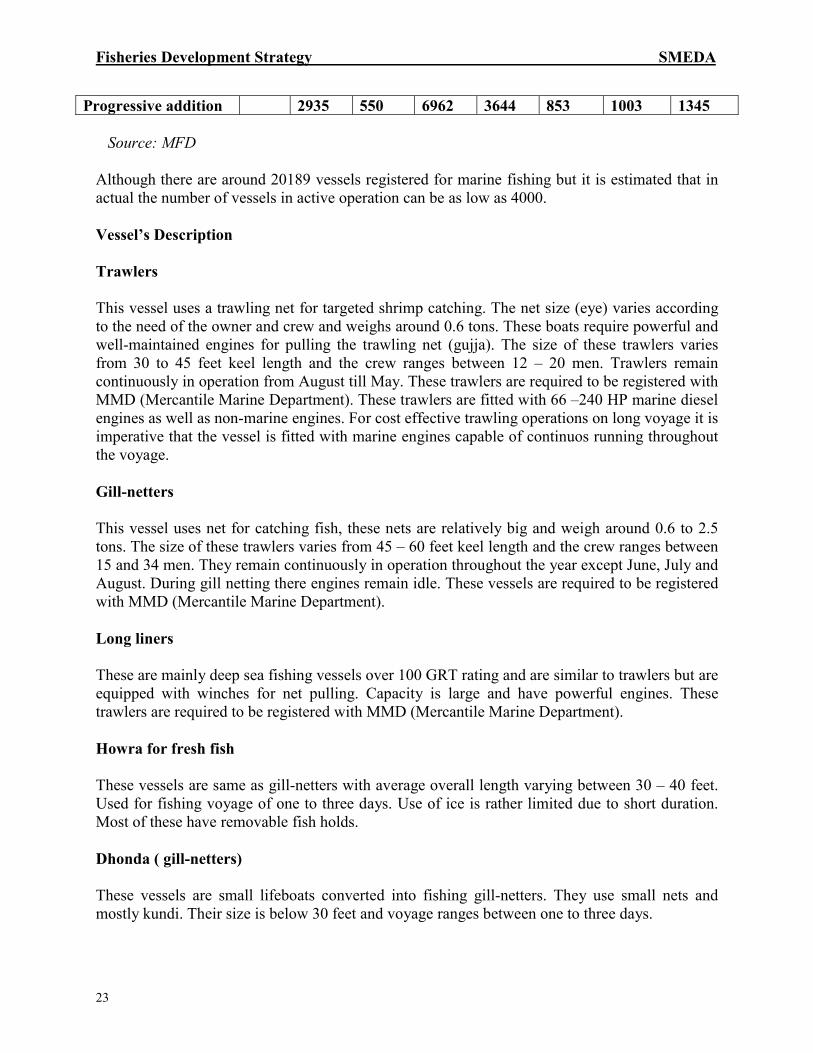
Landed Catch and Incremental Potential
Pakistan is rich in marine fishery resources, where catching is done in the coastal areas ofSindh and Baluchistan. According to a survey there are more than 45 species of shellfishand over 70 species of commercial finfish including Sardine, Hilsa, and Sharks areavailable in the Pakistani coast. The major varieties of fish include Mackerel, Butterfish,Pomfret, Indian Salmon, Beckti, Sole, Tuna, Jew fish, Sea Bream, catfish, Shark and Eel.
Following table indicates the commercial importance of various species of fish inPakistan. For example the top two groups namely Herrings/sardines/Anchovies and Redfishes/basses/Congers consist of over 50% of total catch in Pakistan, the top fivecategories consist of over 81% of total catch, and top eight categories consist of over 90%of total catch.
Percentages of Fish catch in PakistanTABLE -9S# F.A.O Group Percentage
1. Herrings, Sardines, Anchovies 33.32. Red fishes, Basses, Congers 17.53. Tunas, Bonitos, Bill fishes 12.04. Jack mullets, Sauries 11.45. Sharks, Rays, Cimaeras 6.36. Shrimp, Prawns 7.07. Squids, Cuttle fishes, Octopii 1.28. Mackerels, Snoeks, Cutlass fishes 0.89. Flounders, Halibuts, Soles 0.410. Shads 0.211. Lobsters, Spiny, rock Lobsters 0.112. Sea Spiders, Crabs 0.113. Diadromous fishes 0.114. Miscellaneous marine fishes 9.6
TOTAL 100.0FAO reports
The total fish catch in Pakistan in 1997 was 589,731 m. tons, of which 422,207 tonnes(71%) was marine fish and 167,530 (29%) m. tons was Inland fish. Of the 422,207marine fish 285,767 (68%) came from Sindh, 130,406(31%) came from Balochistan, and6,028(1%) came from EEZ.
Fish Production (in tonnes)TABLE -10Year Marine Inland Total1993 499,159 122,536 621,695
Fisheries Development Strategy SMEDA
25
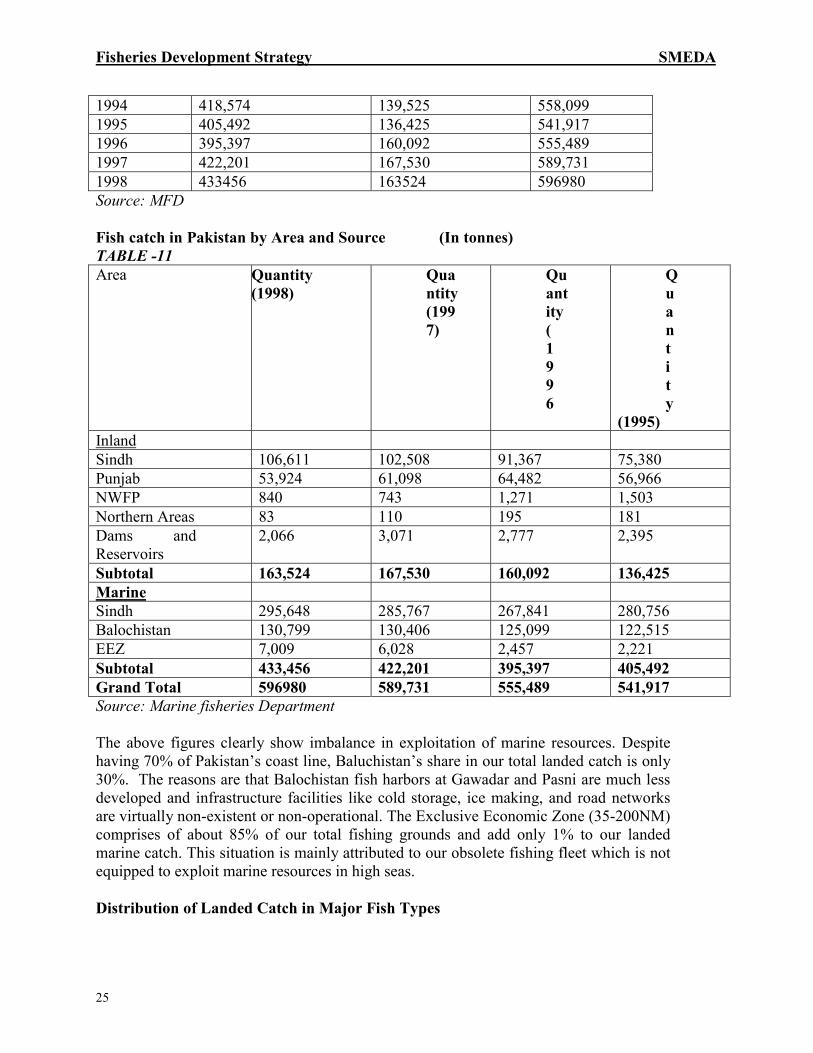
1994 418,574 139,525 558,0991995 405,492 136,425 541,9171996 395,397 160,092 555,4891997 422,201 167,530 589,7311998 433456 163524 596980Source: MFD
Fish catch in Pakistan by Area and Source (In tonnes)TABLE -11Area Quantity
(1998)Quantity(1997)
Quantity(1996
Quantity
(1995)InlandSindh 106,611 102,508 91,367 75,380Punjab 53,924 61,098 64,482 56,966NWFP 840 743 1,271 1,503Northern Areas 83 110 195 181Dams andReservoirs
2,066 3,071 2,777 2,395
Subtotal 163,524 167,530 160,092 136,425MarineSindh 295,648 285,767 267,841 280,756Balochistan 130,799 130,406 125,099 122,515EEZ 7,009 6,028 2,457 2,221Subtotal 433,456 422,201 395,397 405,492Grand Total 596980 589,731 555,489 541,917Source: Marine fisheries Department
The above figures clearly show imbalance in exploitation of marine resources. Despitehaving 70% of Pakistan’s coast line, Baluchistan’s share in our total landed catch is only30%. The reasons are that Balochistan fish harbors at Gawadar and Pasni are much lessdeveloped and infrastructure facilities like cold storage, ice making, and road networksare virtually non-existent or non-operational. The Exclusive Economic Zone (35-200NM)comprises of about 85% of our total fishing grounds and add only 1% to our landedmarine catch. This situation is mainly attributed to our obsolete fishing fleet which is notequipped to exploit marine resources in high seas.
Distribution of Landed Catch in Major Fish Types
Fisheries Development Strategy SMEDA
26
From the total catch of 589,731 m.tons in 1997, the total marine catch is about 422,201MT. According to the MFD sources out of this 211,100 Mt about (50%) was inedibleknown as trash fish which is mainly use for manufacturing fishmeal. (According to theindustry sources the inedible fish catch counts about 70% of the total marine catch). The211,100 Mt marine edible fish consist 27,4 44(13%) of shrimp and 183656 Mt (87%)consist of edible fish in volume. But the ratio is reverse in value. The 17,499 tonnes ofshrimp exported in 1997, fetch about US$ 104,986(61%) and 59,791 of fish exportedfetch US$66,599 (39%) of the total export value.
Specie wise Landing
Shrimps
In the absence of shrimp farming activities of any significance, fishery export industry inPakistan is mainly dependent on capture fishery for shrimp operation from the coast ofSindh and Balochistan provinces. Altogether there are 15 species of marine shrimp inPakistani waters under two families of Penaeidae and Solenoceriadae of whichcommercially important species fall under the Peneidae family. Of these Kiddi shrimpalone accounts for nearly 49 percent of the total shrimp production. However bananashrimp, Indian white shrimp and red-tail prawn form the so-called ‘Jaira’shrimp iscommercially the most important category. Shrimp of Metapaneous spp are collectivelycalled ‘Kalri’ in local languages. All these species occur at different salinity’s and depthranging from brackish waters and coastal waters to a depth of some 170 m.
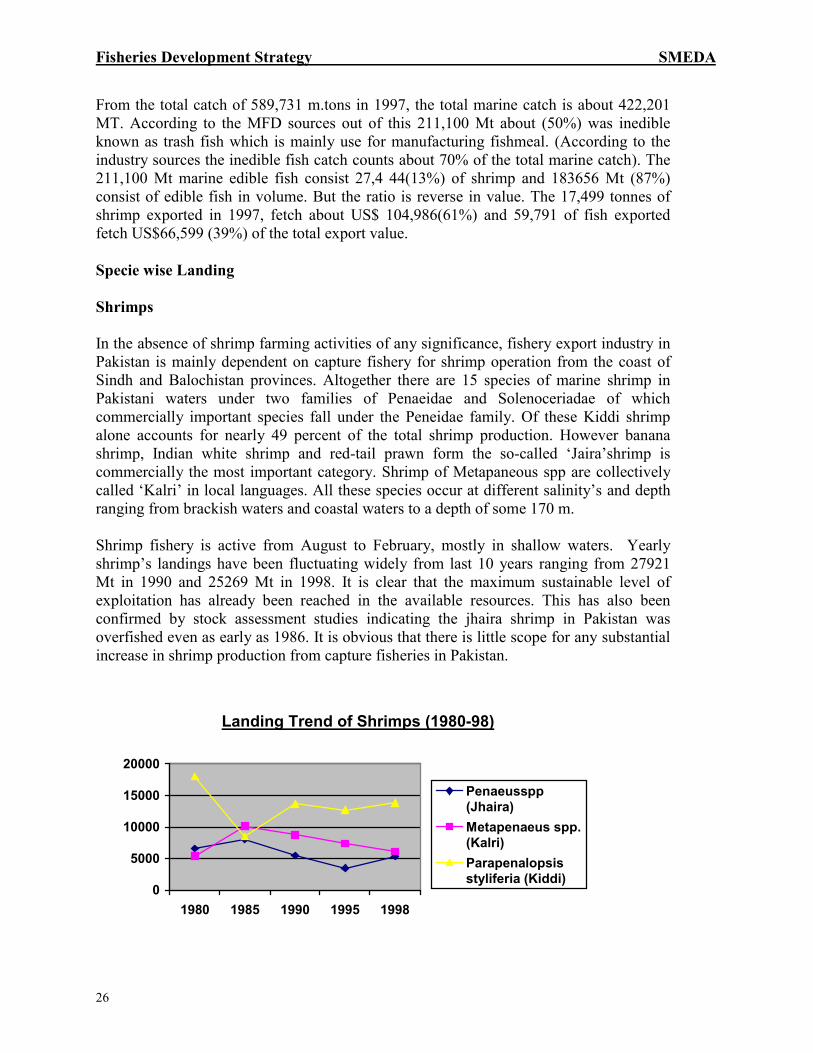
Shrimp fishery is active from August to February, mostly in shallow waters. Yearlyshrimp’s landings have been fluctuating widely from last 10 years ranging from 27921Mt in 1990 and 25269 Mt in 1998. It is clear that the maximum sustainable level ofexploitation has already been reached in the available resources. This has also beenconfirmed by stock assessment studies indicating the jhaira shrimp in Pakistan wasoverfished even as early as 1986. It is obvious that there is little scope for any substantialincrease in shrimp production from capture fisheries in Pakistan.
Landing Trend of Shrimps (1980-98)
0
5000
10000
15000
20000
1980 1985 1990 1995 1998
Penaeusspp(Jhaira)Metapenaeus spp.(Kalri)Parapenalopsisstyliferia (Kiddi)
Fisheries Development Strategy SMEDA
27
AQUACULTURESHRIMP CULTURE
The first major attempt to culture shrimp in Pakistan was made in 1982 when theDepartment of Fisheries, GOS started a shrimp farming pilot projection Richhal Creek,Gharo as part of the ADB-financed Aquaculture Development project. Private sectorinvestors namely Lipton Farm, Baloch farm and Mansour Sheriff farm also invested inthe projects.. Though all these projects had demonstrated the commercial feasibility ofshrimp culture in Paksitan, none has susucceeded in continuing the operations.
TUNA RESOURCES AND LANDINGS
The volume of Tuna landed in Pakistan has fluctuating widely during the past decade.From a meager 8541 MT recorded in 1980 the quality nearly doubled the next year,rapidly increasing to peak of 31854 MT by 1988, and it continue in this range till 1995.The catch of Tuna and Tuna like species in 1998 were recorded 23075 MT. According tothe gathered data from the total landings around 55 percent is the long tail tuna.The Species of Tuna and Tuna like fishes in Pakistan are:
� Yellowfin tuna� Longtail Tuna� Kawakawa tuna� Skipjack tuna� Frigate and bullet tuna� Other tunas of scombroidei� Seerfishes� Bilfishes
The fishing vessels engage in Tuna catching are motorized gill-netters that carry outfishing operation in traditional way. Since most of the boat for tuna catch do not carryice, the catch is gutted and salted on board and landed in wet salted condition, the fishingtrip along the coast ranges from 15-25 days, sometime more than a month.
In Pakistan tuna fishery is a relatively neglected activity. The GOP has taken steps toencourage commercial exploitation of oceanic tunas by encouraging foreign tuna longliners as per the new Deep Sea Fishing Policy.
CEPHALOPOD RESOURCES AND LANDINGS
Among the three common groups of cephalopods mostly squids and cuttle fish is beingexploited with only stray catches of octopus, mostly from coastal waters. This fishing ismostly taken by haila a one-day fishing. There is no targeted fishery for cephalopods andalmost the entire quantity landed is obtained as a bycatch from shrimp fishery.
SPECIES WISE NOMINAL CATCH (FINFISH/SHELL FISH) Qty in MTTABLE -12
Fisheries Development Strategy SMEDA
28
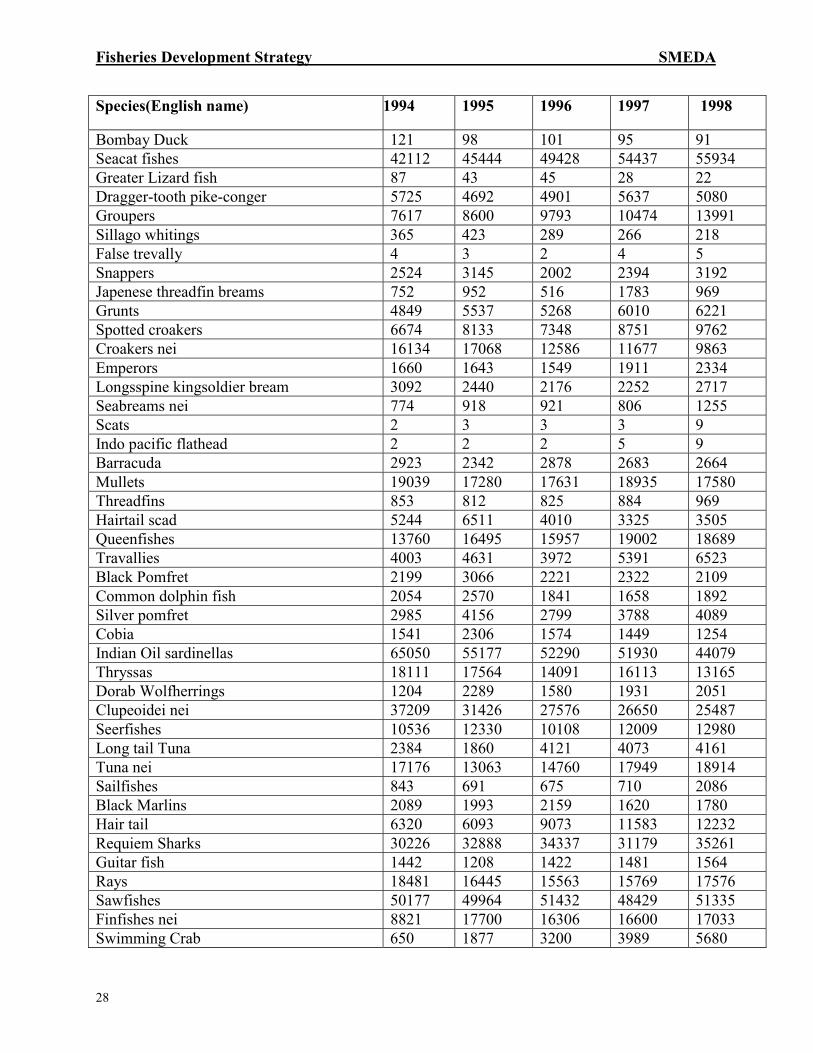
Species(English name) 1994 1995 1996 1997 1998
Bombay Duck 121 98 101 95 91Seacat fishes 42112 45444 49428 54437 55934Greater Lizard fish 87 43 45 28 22Dragger-tooth pike-conger 5725 4692 4901 5637 5080Groupers 7617 8600 9793 10474 13991Sillago whitings 365 423 289 266 218False trevally 4 3 2 4 5Snappers 2524 3145 2002 2394 3192Japenese threadfin breams 752 952 516 1783 969Grunts 4849 5537 5268 6010 6221Spotted croakers 6674 8133 7348 8751 9762Croakers nei 16134 17068 12586 11677 9863Emperors 1660 1643 1549 1911 2334Longsspine kingsoldier bream 3092 2440 2176 2252 2717Seabreams nei 774 918 921 806 1255Scats 2 3 3 3 9Indo pacific flathead 2 2 2 5 9Barracuda 2923 2342 2878 2683 2664Mullets 19039 17280 17631 18935 17580Threadfins 853 812 825 884 969Hairtail scad 5244 6511 4010 3325 3505Queenfishes 13760 16495 15957 19002 18689Travallies 4003 4631 3972 5391 6523Black Pomfret 2199 3066 2221 2322 2109Common dolphin fish 2054 2570 1841 1658 1892Silver pomfret 2985 4156 2799 3788 4089Cobia 1541 2306 1574 1449 1254Indian Oil sardinellas 65050 55177 52290 51930 44079Thryssas 18111 17564 14091 16113 13165Dorab Wolfherrings 1204 2289 1580 1931 2051Clupeoidei nei 37209 31426 27576 26650 25487Seerfishes 10536 12330 10108 12009 12980Long tail Tuna 2384 1860 4121 4073 4161Tuna nei 17176 13063 14760 17949 18914Sailfishes 843 691 675 710 2086Black Marlins 2089 1993 2159 1620 1780Hair tail 6320 6093 9073 11583 12232Requiem Sharks 30226 32888 34337 31179 35261Guitar fish 1442 1208 1422 1481 1564Rays 18481 16445 15563 15769 17576Sawfishes 50177 49964 51432 48429 51335Finfishes nei 8821 17700 16306 16600 17033Swimming Crab 650 1877 3200 3989 5680
Fisheries Development Strategy SMEDA
29
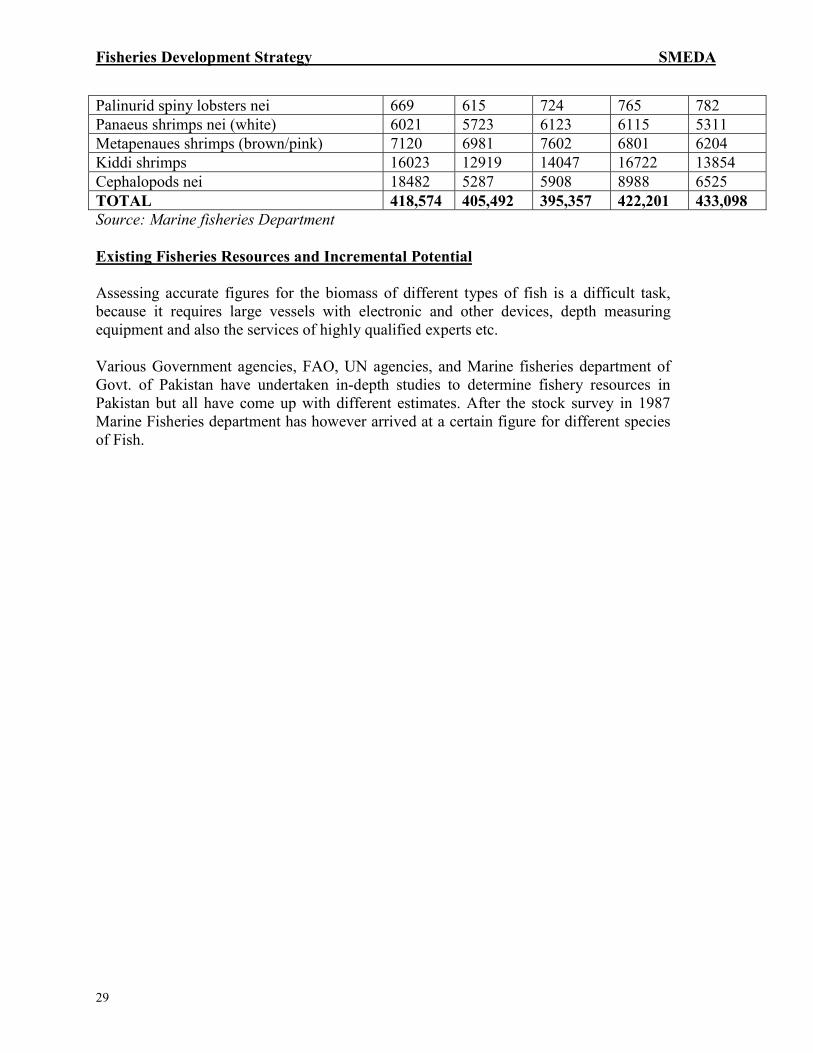
Palinurid spiny lobsters nei 669 615 724 765 782Panaeus shrimps nei (white) 6021 5723 6123 6115 5311Metapenaues shrimps (brown/pink) 7120 6981 7602 6801 6204Kiddi shrimps 16023 12919 14047 16722 13854Cephalopods nei 18482 5287 5908 8988 6525TOTAL 418,574 405,492 395,357 422,201 433,098Source: Marine fisheries Department
Existing Fisheries Resources and Incremental Potential
Assessing accurate figures for the biomass of different types of fish is a difficult task,because it requires large vessels with electronic and other devices, depth measuringequipment and also the services of highly qualified experts etc.
Various Government agencies, FAO, UN agencies, and Marine fisheries department ofGovt. of Pakistan have undertaken in-depth studies to determine fishery resources inPakistan but all have come up with different estimates. After the stock survey in 1987Marine Fisheries department has however arrived at a certain figure for different speciesof Fish.
Fisheries Development Strategy SMEDA
30
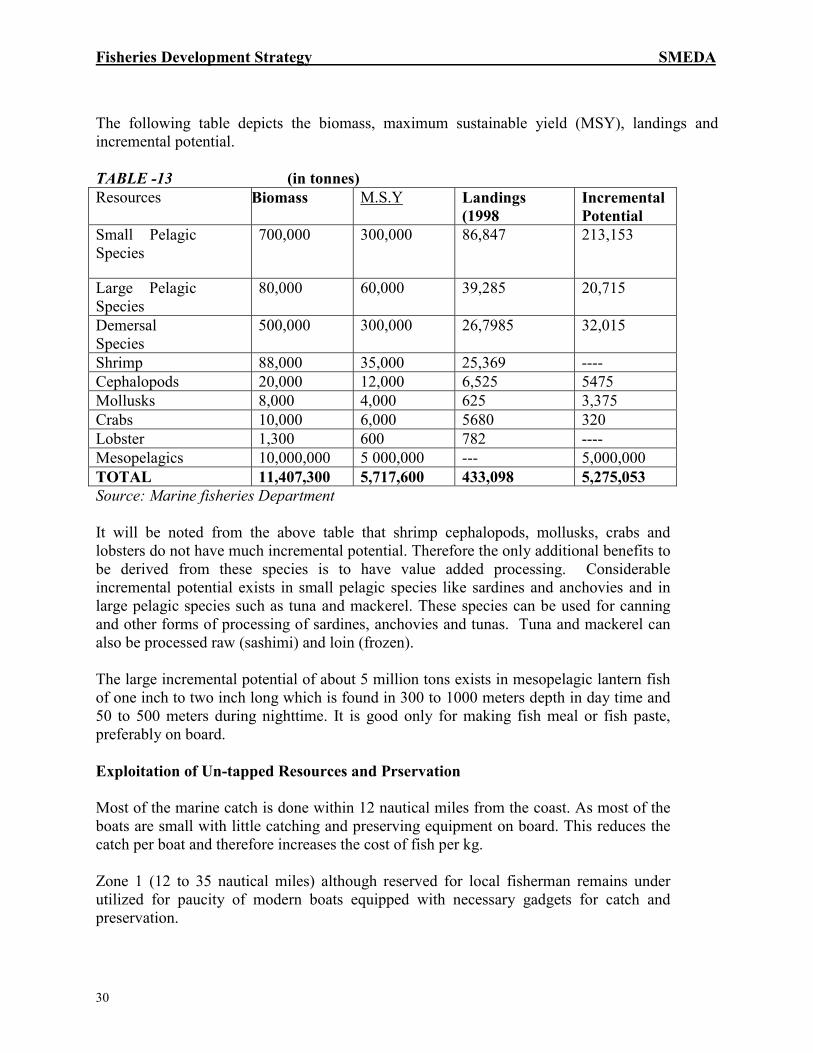
The following table depicts the biomass, maximum sustainable yield (MSY), landings andincremental potential.
TABLE -13 (in tonnes)Resources Biomass M.S.Y Landings
(1998IncrementalPotential
Small PelagicSpecies
700,000 300,000 86,847 213,153
Large PelagicSpecies
80,000 60,000 39,285 20,715
DemersalSpecies
500,000 300,000 26,7985 32,015
Shrimp 88,000 35,000 25,369 ----Cephalopods 20,000 12,000 6,525 5475Mollusks 8,000 4,000 625 3,375Crabs 10,000 6,000 5680 320Lobster 1,300 600 782 ----Mesopelagics 10,000,000 5 000,000 --- 5,000,000TOTAL 11,407,300 5,717,600 433,098 5,275,053Source: Marine fisheries Department
It will be noted from the above table that shrimp cephalopods, mollusks, crabs andlobsters do not have much incremental potential. Therefore the only additional benefits tobe derived from these species is to have value added processing. Considerableincremental potential exists in small pelagic species like sardines and anchovies and inlarge pelagic species such as tuna and mackerel. These species can be used for canningand other forms of processing of sardines, anchovies and tunas. Tuna and mackerel canalso be processed raw (sashimi) and loin (frozen).
The large incremental potential of about 5 million tons exists in mesopelagic lantern fishof one inch to two inch long which is found in 300 to 1000 meters depth in day time and50 to 500 meters during nighttime. It is good only for making fish meal or fish paste,preferably on board.
Exploitation of Un-tapped Resources and Prservation
Most of the marine catch is done within 12 nautical miles from the coast. As most of theboats are small with little catching and preserving equipment on board. This reduces thecatch per boat and therefore increases the cost of fish per kg.
Zone 1 (12 to 35 nautical miles) although reserved for local fisherman remains underutilized for paucity of modern boats equipped with necessary gadgets for catch andpreservation.
Fisheries Development Strategy SMEDA
31
The area between 35 to 200 nautical miles declared as EEZ Zone 2 is reserved for foreignas well as Pak Flag vessels, which operate under license from the Government ofPakistan. The catch in zone 2 is very nominal and therefore it remains to be exploited.Foreign vessels have been found to operate in zone 2 without license from thegovernment and even enter into zone 1 with collaboration with local firms.
The immediate need is in the shrimp fishery is to enforce measures, which will stop overfishing because of too many trawlers. This will allow the stocks of “jhaira” and “kalri”Shrimp to recover and production to rise. These measures should also minimize thedanger of depletion of shrimp stock (including “kiddi”) through overexploitation.
The problems that shrimp aquaculture along creaks and shallow waters near the coasthave not been developed. Fish processors are apprehensive about the future prospects ofshrimp catch because of pollution hazards decreasing discharge of the Indus River due tothe construction of dams and barrages and over exploitation.
Un-exploited available yield of demersal species is 74,000 tons a year. Most of this islocated in the portion of the continental shelf beyond the 20-meter depth line. Financialand Technical assistance is needed at this stage to convert the shrimp trawlers to gillnetting, and long lining for exploiting under-utilized demersal stocks. Potential exists forcatching pelagic such as Tuna, Mackerel and Shark. Cuttlefish and squid resources existon the continental shelf and oceanic squid beyond the shelf.
A large amount of mesopelagic resources remains un-exploited and an annual catch ofseveral hundred thousand tons can be expected. No effort has been made to explore thecommercial possibilities of alternate fisheries. These include Seaweed’s, Crustaceans(other than shrimp) Mollusks, and Echinoderm.Marine resources such as seaweed, small coastal and pelagic shrimp and clampsInhabiting mangrove areas are not presently exploited. It is felt that some significanteconomic potential is tied up in these resources and further investigations are justified.
Disposition of Landed catch
The marketing channel of the fish is more or less similar to those of agricultural products,where Land lord provides a Land and the peasant grows the commodities. The produce isthen sold in the market through commission agents to wholesalers and then to retailersand finally to consumers. The income after deducting the cost of direct inputs is sharedby the Landlord and the peasant.
Similarly, the flow of the fish is channeled from boat owner/fish catcher to commissionagent, to wholesaler, to retailer, to consumer for local market. It goes from commissionagent to exporter/processor to importer to consumer for export market. As described inthe channel distribution chart. The owner of the vessel is usually separate from the fishcatcher, known as “Na Khuda”. The system is that the owner lends his boat to the “NaKhuda” on profit sharing basis, generally equally divided. Thus, if the catch is sold, let ussay, for Rs.15, 000 the owner will deduct the direct cost of such items as Oil, ration to the
Fisheries Development Strategy SMEDA
32
crew, ice, and salt. No depreciation, repair, or replacement costs are included in it. If thecost for example comes to RS. 5000 the remaining Rs. 10,000 will be divided equally,Rs.5000 each by the boat owner and fish catcher. Since the boat remains in the water forthe several days, the “Na Khuda” takes a crew with him, which generally consist of hisfamily members. But if the family members are not available, he may hire crew and paythem from his own share of earning.
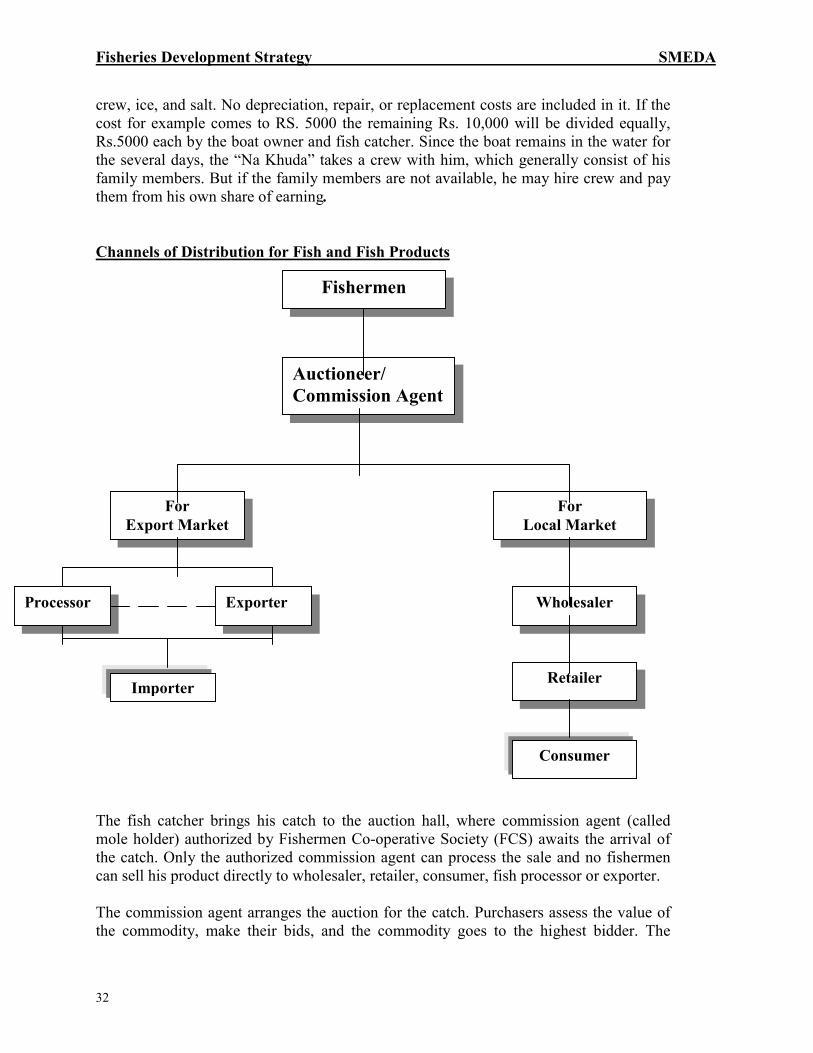
Channels of Distribution for Fish and Fish Products
The fish catcher brings his catch to the auction hall, where commission agent (calledmole holder) authorized by Fishermen Co-operative Society (FCS) awaits the arrival ofthe catch. Only the authorized commission agent can process the sale and no fishermencan sell his product directly to wholesaler, retailer, consumer, fish processor or exporter.
The commission agent arranges the auction for the catch. Purchasers assess the value ofthe commodity, make their bids, and the commodity goes to the highest bidder. The
Fishermen
Auctioneer/Commission Agent
ForExport Market
ForLocal Market
Processor Exporter
Importer
Wholesaler
Consumer
Retailer

Fisheries Development Strategy SMEDA
33
fisherman pays 6.25 percent of the gross value of the commodity, which is dividedequally by the Fishermen’s Cooperative Society (FCS) and auctioneer.
The fish is passed on from the catcher via the commission agent to the processor/exporterto importer or the local wholesaler, then to retailer, and finally to consumer.
The fish is generally brought to the auction hall/market on the fish harbor where theprocessor/exporter or wholesaler purchase the catch. Almost all the processing units arelocated in Karachi. Therefore the catch meant for processing/export is either purchased atharbor, or is brought to Karachi immediately if purchased at other fish harbors. Thepurchase made for local sale is bought by wholesaler who delivers it to the retailer inlocal market, who ultimately sells to consumer.
Structural Problems of Marketing
Geographic ConstraintsIn Pakistan, primarily warm water fishing is done, and marine fishing is done in thecoastal areas of Sindh and Balochistan provinces, which have severe warm climate. Thefish harbor of Gawadar and Pasni are located in Balochistan, some 300-400 km awayfrom Karachi, which puts severe constraints in marketing of fish.
Lack of Basic InfrastructureAside from the geographic constraints, lack of infrastructure facilities is anotherimpediment to smooth marketing. To begin with there are virtually no road network toquickly transport the fish. For example, driving from Quetta to Turbat, Pasni, Gawadarand Panjgur there is hardly any metalled road at all. Thus transportation becameextremely difficult. The inadequate number of non-refrigerated transport vehicles are alsoold and dilapidated. Frequent breakdowns and lack of repair facilities also affect the fishdistribution. Then there is a non-existence of ice-making, refrigeration, and refrigeratedtransport facilities, which poses problem of quick disposal.
Paucity of FundsThe fishermen are, by and large, extremely poor. Thus, when the catch is brought forsale, they are over-anxious to cash in their catch. The middlemen takes advantage of thissituation and pay as little as possible. Another factor is that commission agent generallyfinance the social events of fishermen such as marriages of their daughters, repairing oftheir houses, purchase of staples, etc. Fishermen being unable to pay off their loans intime are forced to sell their fish at the dictated prices.
Illiteracy and TraditionalismSince the fishermen are illiterate, they are not aware of their importance and bargainingposition.
Channels of Disposition of the CatchA substantial quantity of fish is consumed locally. In addition, small pelagic and by catchof trawl fishing is being used for production of fishmeal. Remaining balance is exported
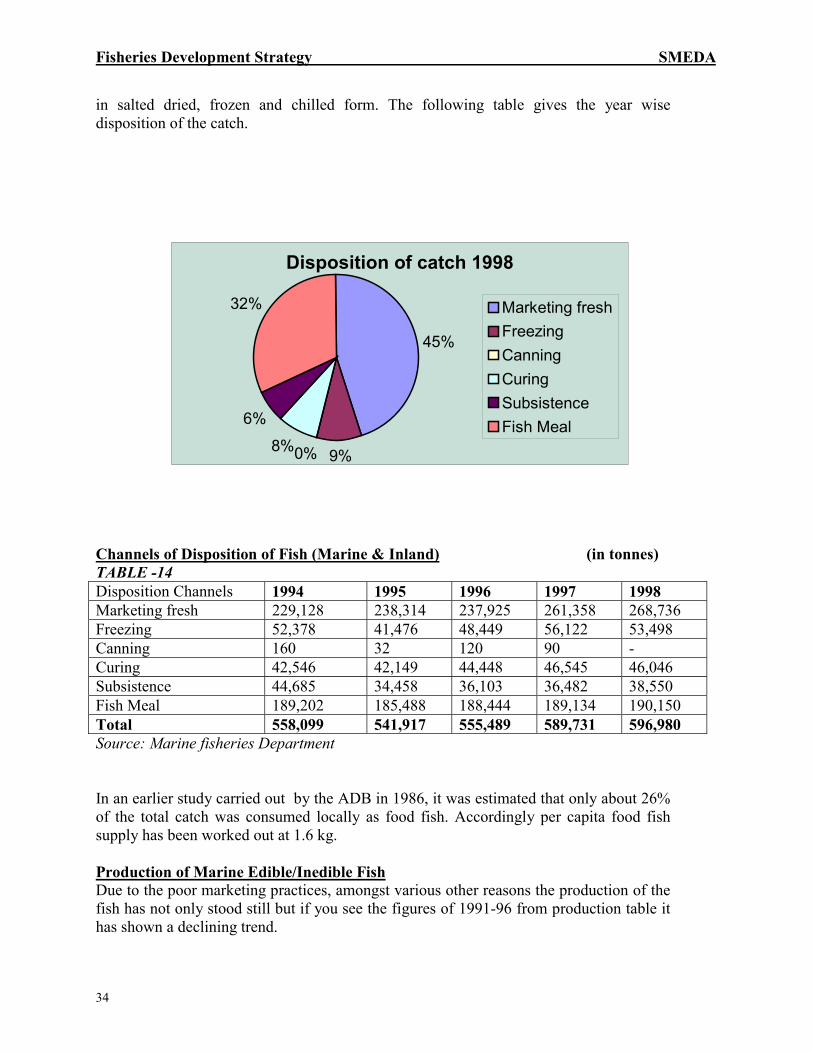
Fisheries Development Strategy SMEDA
34
in salted dried, frozen and chilled form. The following table gives the year wisedisposition of the catch.
Channels of Disposition of Fish (Marine & Inland) (in tonnes)TABLE -14Disposition Channels 1994 1995 1996 1997 1998Marketing fresh 229,128 238,314 237,925 261,358 268,736Freezing 52,378 41,476 48,449 56,122 53,498Canning 160 32 120 90 -Curing 42,546 42,149 44,448 46,545 46,046Subsistence 44,685 34,458 36,103 36,482 38,550Fish Meal 189,202 185,488 188,444 189,134 190,150Total 558,099 541,917 555,489 589,731 596,980Source: Marine fisheries Department
In an earlier study carried out by the ADB in 1986, it was estimated that only about 26%of the total catch was consumed locally as food fish. Accordingly per capita food fishsupply has been worked out at 1.6 kg.
Production of Marine Edible/Inedible FishDue to the poor marketing practices, amongst various other reasons the production of thefish has not only stood still but if you see the figures of 1991-96 from production table ithas shown a declining trend.
Disposition of catch 1998
45%
9%0%8%
6%
32% Marketing freshFreezingCanningCuringSubsistenceFish Meal
Fisheries Development Strategy SMEDA
35
Due to indiscriminate catching of fish, a large portion of total fish caught turns out to betrash fish, which is either used for fishmeal or other non-edible purposes, or it is simplythrown away. This is one of the cause of low income of the fishermen, because trash fishfetches a very nominal price.
According to the figures given by Marine fisheries department the percentage of trashfish has ranged from 38% to 51% of the total fish catch for last 10 years, and the overallaverage for the 10 years comes to about 42%, which is very high ratio for any fish catch.
Note: (According to the industry sources the percentage of trash fish is about60-70% of the total catch)
Quantities and percentage of Edible and trash fish of the total Marine fish Catch year(1987-1998) (in tonnes)TABLE -15Year Total
MarineCatch
Edible fish Trash fish
Qty % Qty %1987 336,129 166,042 49 170,087 511988 348,897 184,254 53 164,643 471989 341,222 174,851 51 166,371 491990 369,802 196,946 53 172,856 471991 402,795 225,405 56 177,390 441992 431,465 245,758 57 185,707 431993 499,159 310,755 62 188,404 381994 418,574 230,372 55 188,202 451995 405,492 220,004 54 185,488 461996 395,397 206,953 52 188,444 481997 422,201 211,100 50 211,100 501998 433,456 243,306 56 190,150 44Source: Marine Fisheries department
Total Production of Edible Marine and Inland Fish AvailableThe percentage of trash fish in the marine catch is very high, whereas Inland fish isalmost all edible. Although the total quantity of marine fish is high, the quantity of ediblefish is less. The following table shows the total availability of edible fish available inPakistan.
Fisheries Development Strategy SMEDA
36
Total Quantity of Edible fish available in Pakistan (1987-1998) (in tonnes)TABLE -16Year Marine Edible
fishInland Fish Total
1987 166,042 91,631 257,6731988 184,254 96,545 280,7991989 174,851 105,009 279,8601990 196,946 113,158 310,1041991 225,405 115,907 341,3121992 245,758 121,653 367,4111993 310,755 122,536 433,2911994 230,372 139,525 369,8971995 220,004 136,425 356,4291996 206,953 160,092 367,0451997 219,545 167,530 387,0751998 243,306 163,524 406830Source: Marine Fisheries department
Auction System
Immediately after landing catch has to pass through the auction process for sale. The authorizedappointees of Fishermen Cooperative Society called Moles carry out auction. On return from thevoyage, the boat captain called Nakhuda informs the boat owner and the mole holder to arrangefor the auction. The boat crew brings catch to auction hall where mole arranges a display of catchfor interested buyers. After the display mole invites the buyers to bidding process and acts onboat owner's behalf to gain maximum price. The buyer giving the highest acceptable bid isconsidered the final bidder and the catch is sold to him. The mole issues a gate pass in favor ofbuyer allowing him to take catch to his factory and in return buyer agrees to pay the agreed sumto the mole in near future which later on mole pays to boat owner and to the crew. The mole inreturn of his services deducts 6.25% of the total catch as commission out of which the mole pays3.125% to FCS as contribution by fisherman for the social development projects aimed towardsfishermen.
The mole in order to attract boats also acts as a working capital financier for the voyage and alsoextends short term to long term financing to fishermen community for the social purposes.Running mole is a very profitable business as the running finance required to attract one boat isabout Rs100, 000 and the net auction commission is more than the initial loan. Secondly therunning finance is paid in form of commodities so mole also makes money in procurement ofcommodities.
Fish is a very fishy business, due to unorganized setup, limited number of buyers and lack ofeconomic awareness among fishermen middlemen exploits the situation and make abnormalprofits. The market is dominated by few huge buyers, who control the pricing mechanism. Allmiddleman and genuine buyers have agreed to an informal buying cartel under which theydecide what to buy and at what price. At the end of voyage the boat owner and the boat crew are

Fisheries Development Strategy SMEDA
37
in desperate need of money, they sell there product at through away prices to middleman whothen resells the product to other traders and the final products costs 3 to 4 times more expensivethan the initial auction price.
Karachi is the largest fish auction point in Pakistan, it nearly handles about 400,000 tons of fishevery year, but still there is no proper auction system. All auction is on word of mouth basis andall existing documents are not properly filled. The documentation standards are belowinternational levels and the are no sources for reliable data.
Mode of Transportation
A Typical Boat Fishing Voyage
Process Flow: From Harvesting to Processing
HarvestingThe Principal craft used by coastal fisherman are known as trawlers, gill-netters, andhoras. A traditional wooden trawler undertakes a fishing trip for about 10 to 25 daysduration. The basic input of the industry is in a haphazard and dilapidated condition.Most of the boats are wooden, non-mechanized, old and out-dated. They have thereforeoutlived their utility. Facilitates of On-board chilling system is missing, which areresponsible for lot of waste. Third none of these fishing vessels are equipped withnavigational or electronic devices like sonar, echo sounders or other fishing aids. Fourthis the lack of the education and training among boat –builders have made the matterworse.
Fishing TechnologyThe fisherman over 90% of whom are illiterate, are still following the centuries oldtechnology of “feel and See”. They take their wooden hull boats in the shallow water,throw their nets and leave it to the nature for getting some fish. Some time they may stayin the water for a whole week and return with very little or nothing at all. They are noteven aware of the navigational aids as fish finders and echo sounders. Technology todiscriminate between the edible and trash fish, species of various kinds, and size of fish,etc. must be taught to fisherman to be more productive.
Voyage Time:Due to the non-mechanization of the boats and non-availability of the navigational orelectronic devices like sonar, echo sounders or other fishing aids it was observed that50% of the total voyage time is wasted only on finding of the fish.

Fisheries Development Strategy SMEDA
38
Average Voyage time
7-10 days
10-15 days
20-25 days
7-10 days
2-3 days
May Aug Sept Oct Nov Dec Feb March
Post HarvestingThe fish holds of these trawlers are not insulated. For preservation of catch theinsufficient crushed ice is applied. Since no plastic crates are used for storing thecatch on board, the catch is piled up in the fish hold with the result that the twothird of the piled up fish of the whole catch is crushed and de-shaped underpressure. All these factors lead to deterioration of the quality of landed fish. Dueto the post harvest losses, the poor quality fish fetches less price to the fishermen.Therefore to contain these post harvest losses, the fish holds of the traditionalboats urgently needed to be insulated. A cooling and refrigerated system must beinstalled and use of plastic crates for storing the catch in the fish hold should bemandatory. Careful handling at the port should also need to be encouraged.
Landing (at harbor)Fish harbor is one of the most important infrastructure facilities in the fisherydevelopment. It not only allows the boats to operate but also enables fishermen's todispose off their products for local consumption and export. Karachi fish harbor wasconstructed in early 1960 to accommodate the fleet of about 400 vessels. At present theharbor is handling about more than 4000 fishing vessels, resulting in serious congestionin the channel. There is no any system of vessel movement after unloading its catch, afterunloading of its catch the vessel stays and leaves the jetty, when it has to go for anothervoyage, which takes at-least 3-4 days. As the catch is arrives at the jetty, It is handledvery Un-hygienically right from Unloading to Auction hall and then to market. After thecatch is unloaded, there is no any preparatory area for the de-icing, sorting and thegrading and it directly comes in to the auction halls. The deicing, sorting and grading isdone on the floors or at the deck of the boats with the channel water. The Landing oflong voyage boats is usually starts in the late evening and continue till morning, in the
Fisheries Development Strategy SMEDA
39
mean the auction is continue according to the species landed at that time. The landings ofthe fresh catches of haila & Dhoonda (a short trip boats) is done after 3.00 pm in theevening and continues till 6.00 pm. There are two cold storage facilities for storing thecatch are in the both auction halls but are not being properly used. There is no anyarrangement of washing and proper handling of catch. The sanitary and hygienicconditions at fish harbor are not according to the international standards.
AuctioningAuctioning of the long voyage iced boats is starts in the 6.00 a.m. in the morning andcontinues till 12.00 noon of both the shrimps and fish. The auction of fresh catch is donefrom 4.00 p.m. to 6.00 p.m. in the evening. In this time the catch remains on the floor ofthe auction hall without any proper chilling facility. The grading and the weighing isdone in the auction hall. There is no any proper system of sorting and Grading. After theauctioning there is a lack of handling equipment and proper transportation to theprocessing unit or peeling shed or to the local market.
TransportationLanding at the other fishing centers is first transported to the Karachi fish harbour for theauction then it is distributed. From the nearby centers like Ibhraim Haydri and Korangi itis brought through trucks, vans and Suzuki’s packed in ice, covering short distances.However for long distances transportation from Karachi fish harbour to inland markets inthe Punjab and Sindh province, railways are the principal carriers, often the catch is de-headed and gutted before icing to enhance quality.this is the most famous and cost-effective mode of transportation.Fishing boats operating off Balochistan coast also act as a fish carriers, collecting catchesfrom Pasni and Gawadar or other fish landing points to Karachi harbour. The time takenby different mode of transport ranges from 24 to 30 hours and from boat is 15 hours, inall the cases the catch is ice and packed in wicker boxes.
Seafood Processing Industry
ProcessingFish is a perishable food item therefore need for preservation is immense. In order to maintainquality of fish, to increase shelf life of the product and to ensure continuity of supply the conceptof preservation and curing have been in use in one form or the other since centuries. In fisheriessector preservation of fish quality means freezing the natural qualities and attributes of theproduct immediately after the catch (in developed countries) or after the landing (in developingcountries). Freezing here means decreasing the temperature of the fish product from 5 degrees to– 40 degrees.
The fish processing has three major areas namely:
� Value Addition Process� Freezing� Packaging
Fisheries Development Strategy SMEDA
40
Value Addition Process
As discussed earlier value addition in fish product is a combination of 3 major factors namely:
� Product Attributes� Brand Name� Distribution Channel
Under the processing section of the report emphasis is on Production process and Productattributes. Both product attributes and production process depends upon the selection of the finalproduct and the target market. The market trends very clearly suggests that there is excessivedemand for quality oriented ready to eat fish products. These products enjoy a premium marketrate and sales are virtually guaranteed. Below are the production flow charts for most commonspecies of shrimp and fish.
FreezingThe three major forms of freezing are:� Nitrogen Freezing� Individual Quick Freezing� Blast Freezing
Nitrogen FreezingNitrogen freezing technique is a very recently developed technique and is currently underexperimental phase. The process preserves the quality and freshness of the product with in aminute and the shelf life of the product is about 1 year. As the technique is in the experimentalphase the operating costs are too high and it is very rare in use.
Individual Quick freezingIndividual quick freezing technique commonly known as IQF is most widely used method andmost cost effective method of freezing. The IQF process takes only 3 to 8 minutes (dependingupon the process and the product) to bring down the product temperature from 5 degrees to – 40degrees and the shelf life of the product increases from a few days to about 6 to 8 months. IQF isthe most recommended form of freezing and several countries including EU are now planning tomake IQF as a pre requisite for imports. The final customer of an IQF product is householdindividual who purchases it for his consumption.
Blast FreezingBlast freezing technique is the most basic form of processing which is only used in developingcountries. The process takes about 8 hours to freeze the product and the costs more. The productsells at a discount and it has major selling problems. The only customer for this product is a re-processor who after some value addition finally passes it through an IQF process.
Fisheries Development Strategy SMEDA
41
PackagingPackaging is as important as processing. Product has to be packed in food grade, convenient,attractive economical and market oriented packs with proper brand names on it. The broadpacking requirements varies from product to product but some of major types of packaging are:� Canning� Vacuum Bag Packing� Shrink Wrapping� Jumbo Packing
Current Status of Fish Processing in PakistanThe fish-processing sector of Pakistan is in far better shape than the fishing sector. but still theprocessing sector had not kept upgrading with the International technological advancements, thechange in demand patterns and customer preferences for which the country paid the price inform of losing market share and lower average unit prices.
Except for Blast freezing plants (so called processing units) there is no modern value added fishprocessing plant producing products like breaded buttered shrimps, fish fingers, fish cakes, fishpaste, fish sauce or surimi products. Three major categories of exports oriented fish processingactivities mechanical means in Pakistan are freezing, canning and fish meal production. Intraditional sector curing is the most popular method of fish preservation method which accountsfor considerable quantities of finfish, fish maws and shark fins.
Processing Capacities
Freezing
The are 27 processing units with a total installed capacity of about 450 tones per day.Out of 27 only 21 plants of total 300 tons per day capacity are in operation with others closeddown due to several reasons. The average capacity utilization for the processing sector is about25 %.
All the existing plants have secondhand blast and plate freezers (about 10 to 15 years old) with afew as exception. These old plants consume about double of electricity (electricity is biggestportion of operating expense), as a result product does not remain competitive and the over allrisk increases.
CanningThere are 11 canning plants in with a total installed capacity of 106 MT/Day, with only one inoperation. The only operational plant is crab meat-processing unit, which has only survivedbecause of being non-traditional in nature. Shrimp canning industry flourished in late sixties andearly seventies but later on died very rapidly on emergence of very cheap but quality orientedproducts from South East Asian countries and extensive dependence on imported cans (as a wellestablished local canning industry still does exist).
Fisheries Development Strategy SMEDA
42
Fish Meal
The small size of pelagic and the BI-catch caught by shrimp trawlers are used for industrialpurposes in the production of fishmeal. Besides, small pelagic fish caught in creeks and inshorewater by small crafts are also utilized in production of fishmeal.
All fishmeal plats are located in Karachi near Ibrahim Hydri. Most of the fish meal plants are 25to 30 years old with no oil extracting provisions as a result losing huge sum of money. The mostcommon practice is to use sun-dried fish and fish offal, which are sterilized with steam and againdried in sun. Then it is pulverized in a grinder and packed in jute bags. Some plants also usemechanical dryer after sterilization. The net yield during this process ranges from 20% to 22 %and the protein is between 40% to 50%, which is well below international standards.Fishmeal industry is in the decline stage of product life cycle as local industry is not able tocompete with international fishmeal producers. All local fish meal producers will be wiped outby Chinese product which is better in quality and is still cheaper than the local product.
Fisheries Related Rules And Acts
1. The Pakistan Fish Inspection & Quality Control Act, 1997.2. The Pakistan Fish Inspection & Quality Control Amendment (Ordinance), 1998.3. The Pakistan Fish Inspection & Quality Control Rules, 1998.4. The Sindh Fisheries Ordinance, 1980.5. The Balochistan Sea Fisheries Sea Fisheries Act No. IX of 1971.6. The Pakistan Environmental Protection Act, 1997.7. The Agriculture Produce (Grading & Marketing) Act 1937.8. The Pakistan Animal Qurantine (Import and Exports of Animal and Animal Products)
Ordinance, 19799. The Karachi Fish Harbour Authority Ordinance, 1984.
(All the above documents are available in the MFD’s document of Health conditions forEuropean Commission.)
Legislation of the Country
(a) The Agricultural Produce (Grading and Marketing) Act, 1937.This act provides authority and control for the grading and the marketing of theagricultural produce. Dry fish, shellfish, and fishmeal are graded under the provision ofthis act.
(b) The Baluchistan Sea Fisheries Act No. IX 1971: provides authority of fishing crafts,fishing license and processing of fish and fishery products in the territorial water ofPakistan along the coast of Balochistan. Contravention of any provision of the Ordinanceis punishable by one month imprisonment or with a 5000 rupee fine or both.

Fisheries Development Strategy SMEDA
43
(c) The Pakistan Animal Quarantine (Import and Export for Animal and AnimalProducts) Ordinance 1979: This Ordinance provides for control over Import and Exportof animals and animal products and issue of “health Certificate” to regulate the trade andto prevent the introduction or spread of diseases.
(d) The Karachi Fisheries Harbor Authority Ordinance 1984: provides law to carry outefficient operation of harbor facilities and to inspect periodically hygienic conditions ofprocessing plants, ice plants, cold storage and other related activities.
(e) The Sindh Fisheries Ordinance, 1980: This Ordinance provides rules and regulationsfor marketing, handling, transportation, processing and storage of fish and shrimp forcommercial purpose and sale of fish used for domestic and inters provincial trade.Contravention of this Ordinance is punishable by imprisonment up to six months or withby a fine of 10,000 rupees or both.
(f) The Coastal Development Authority Act Sindh Act No. XXVIII 1994: It provides lawfor planning, Development operation, management and maintenance of coastal areasincluding development of fisheries, livestock, horticulture and agriculture.
(g) The Pakistan Environmental Protection Ordinance No XXVII: It becomes effective atthe beginning 1997 provides law for protection, conservation and improvement ofenvironment for the prevention and control of pollution including biodiversity,ecosystem, effluent, hazardous substance, emission and water pollution.
(f) Pakistan Fish Inspection and Quality Control Act, 1997: The Government has passed anumber of Acts for Inspection, Grading, quality control and marketing especially forexports. For example exports of fish was covered under Agriculture produce (Gradingand Marketing) Act 1937 and Animal Quarantine (Import and Export of Animal andanimal products) Ordinance 1979. The Sindh government passed fisheries Ordinance,1980. But the latest is Pakistan Fish inspection and Quality Control Act, 1997. Whichdeals with the registration of the fish processing plants and fish exporters, andconstitutions and functions of inspection committee. The function of the committeeincludes inspection of fish processing plants, fish exports, handling of fish and fisheryproducts. It also spells out the powers, duties and functions, of fishery officers andpenalties on the processors/exporters for contravention.
The Acts and Ordinances are in Vogue but are not stringently practiced. Marine fisheriesDepartment issues certificates of quality and Origin for fresh, frozen, canned fish/shrimp,conducting pre-shipment inspection of the consignments to ensure that properstandardization of fish and fishery products are enforced.The following criteria are used to ensure quality control of fish and fishery products.
1. Pakistan standard for fish and fishery products as defined in Pakistan StandardsInstitution (Certification Marks) Ordinance, 1961.
2. Code of practice for fish/shrimp-Codex Alimentarious Commission of FAO/WHO.
Fisheries Development Strategy SMEDA
44
In order to promote the quality of fish and fishery products, following measures aresuggested:
1. Fishermen and producers should make use of adequate quantity of ice for thepreservation of fish/shrimp. For this purpose, economically cheap but clean iceshould be made available to fishermen and processors. The use of flake ice must beencouraged.
2. Chlorinated ice is superior to ordinary use. Therefore chlorinated ice should be madeavailable to the fishermen/producers.
3. Installation of flake ice plant be encouraged and the use of flake ice be popularizedamong the fishermen/processors.
4. Plastic fish boxes be introduced for hygienic handling and transportation of fish andshrimp.
5. Refrigerated seawater technology be adopted for preservation of fresh fish and shrimpon board the fishing vessels.
6. Apart from the usual shrimp products, other varieties of fish, such as Sardine andTuna be utilized by the canning industry.
7. Marine fisheries department be entrusted with the sole responsibility for supervisingthe quality control and inspection program for fish and fishery products.
8. Compulsory quality control program be enforced to ensure quality assurance for fishand fishery products.
9. Modern processing technology (liquid nitrogen technology) be encouraged forfreezing fish and shrimp.
Pakistan’s export earnings in the fish and fish products have reached US $ 171 million in1997-98. The importing countries which are very much quality conscious and are nowdeveloping stringent quality standards and hygienic criteria for exportable goods. Lackof mandatory seafood inspection and quality control program in Pakistan sometimesresults in selling of some detrimental products by unsavory dealers/exporters. EU ismajor importer of seafood products from Pakistan, however according to the regulationsof European commission; the exporting countries must comply with their standards. Aninspection mission of European commission visited Pakistan in December 1997 toevaluate conditions of seafood production and processing and pointed out manyshortcomings especially on hygienic conditions at fish harbor and processing units andimposed a ban on sea food exports from Pakistan from July 1 this year, which lasted forover three and half months. Which gave a loss of US $ 46.3 million to the industry invalue if we compared the figure with the last year period.
A Summary of Problems
� Imbalance in exploitation of marine resorces
� Fishing Nets
Fisheries Development Strategy SMEDA
45
� Fishing Fleet
� Fleet Operations
� Engines
The majority of the fishing fleet incorporates under under-powered used/reconditionedengines and propulsion equipment mainly because of the low financial strength of theboat owners to acquire new equipment. The used/reconditioned propulsion equipment ofa trawler having a keel length of around 40-ft will cost approx. 1.5 to 2 million rupeesdepending upon the condition; A brand new set for the same trawler can cost around 3million rupees.The problems being faced with these engines are the non-availability of spare parts andinadequate repair facilities. Low BHP of engines limit speed for trawling, higher fuelconsumption, overheated engine room environment and unstable seaworthiness. Majorityof engines are non marine in nature thus causing increased down time and financial andmaintenance burden on the user.
� Navigation Equipment
The fishing fleet in Pakistan is deprived of the modern navigational equipment, such asglobal positioning system (GPS), fish finder and UHF/VHF communication system. Thecrew uses their commonsense and memory to detect fish and looks for various land marksto locate the position of the vessel and at times erroneous assessment results in excessvoyage and hence increased fuel costs. The modern fishing vessels in developedcountries have to install a GPS for determining its position in the sea. This gadget enablesfishermen to remain on course (LAT/LONG) while fishing, determine the cruising speedand memorize rich and profitable routes etc. Fishfider effectively locates fish school(s)and reduces the overall voyage duration and economizes fuel consumption. Apart fromthis a common fish finder is helpful in determining the water depth thus saving the vesselfrom unfortunate calamity of hitting the bottom rock etc. Two way communicationsystem is a necessity on fishing vessels and provides safety and a mode of informationtransfer between boats and owner/harbor authorities.The reasons for prejudiced awareness on electronic equipment amongst commonfishermen are plenty out of which the broadest is the lack of training facilities andidentification of the core need of cost effective solutions to the fishermen problems. Theliteracy rate of our fisherman limits their acquaintance with these electronic gadgets.Thus an intensive and well-organized training program is planned.
� Fish Finding Equipmet
� Fish HoldsThe existing fish holds are not according to the E.U specifications. The typical vessel’sfish hold is insulated using thermopile (polystyrene) covered with galvanized iron sheets,
Fisheries Development Strategy SMEDA
46
which are riveted, screwed or nailed to the hull frames. G.I sheets start getting corrodedwithin a month of installation and corroded surface result in breeding grounds for thebacteria. The catch is iced with the help of unhygienic block ice usually crushed onboard.The catch is preserved in the compartments commonly known as Gallas and stowed oneover the other with intermittent layers of ice, in the form of a heap as high as 6 to 8 ft.Crushed block ice has sharp corners which cause damage to the skin/tissue of fish. Inheaped stowage tremendous pressure is exerted on the bottom fish and the bottom catchpartially bursts open and contaminates quality of entire catch of galla.
There is an immediate need to modify fish holds as part of value addition program byensuring proper “ Care”, “Cleanliness” and “Cooling” from the time of bringing thecatch to deck upto its delivery in the processing plants. It is planned to usepolyurethane as the insulation material, which has much better insulating properties(thermal conductivity) and is thus cost/energy efficient. The G.I hold lining is to bereplaced by either fiberglass or urethane/polyurea coating withstanding extreme impactand abrasion resistance, providing clean and glossy surface, eliminating the hazard of rustor corrosion and creating a vapor barrier between the insulation and catch, besidesensuring optimum sanitation environment with ease of cleaning. Future storage of catchis planned in properly iced fish crates. Fish hold modifications shall therefore incorporateproper arrangement for handling and storage of fish crates. Ice to be used shall be flakeice. It is planned to bring the temperature of catch to 5oC at the earliest and to maintainthe cold chain upto delivery of catch to the processing plants. Accelerated cooling offresh catch is envisaged through pre-chilling technique before storage in fish crates.To optimize cooling, flake ice consumption and duration of voyage, on board chillingunits are also planned for vessels having keel length of over 40 feet.
� Ice
� Catch Storing Methods
As explained above the conventional method of storage of catch in the galas in the formof heaps leads to significant post catch losses and edible fish looses value into industrialfish. It is now planned to store catch in 75-liter capacity, properly engineered fish cratesof international design. These crates have a carrying capacity of 50 kg iced catch. Thedesign of fish crates ensures that the load is transferred to the walls of the fish crates andthe catch remains stress free. Thus in properly iced fish crates the catch will remain freshensuring prime value of the catch on landing. Such fish crates of standard design havebeen imported in nominal quantity and tenders are under review for local manufacture offish crates.
� Harbor
� Utilities
� Boat Movement
Fisheries Development Strategy SMEDA
47
� Catch unloading, handling and transportation
� Peeling Sheds
� Auction System
� Processing Industry
� Human Resource
Recommendations
Improvement in Regulations
� Deep Sea Fishing Policy� Boat registration regulations� KFHA regulations
Instituition Strenghting
� KFHA� FCS
Marketing Support Programmes
� Interntaion markets information data base
Technical Support
� Boat Fish hold modification� Navigation Equipmet� Fish Finding Equipment� Local development of Fish Crates� Flake Ice manifacturing� Provision of electricity/water at KFH
Management Support program
� Boat Movement Plan� Ctach Unloading Program� Auction management Program� Receiving Hall management� Catch weight/price recording and tracking system� Training of:
Fisheries Development Strategy SMEDA
48
� Fishermen� Processors� FCS staff� KFHA Staff
Action Plan
Upgradation of Existing Traditional FleetBoat Building, the basic input for fisheries is in a haphazard and dilapidated condition.Most of the boats are wooden, non-mechanized old and outdated. They have therefore outlived there utility. They require frequent repairing and are poor in quality. Secondly,facility such as cold storage, and chilling on board are missing, which are responsible forlot of waste. Third our boats are devoid of equipment such as echo sounders and fishfinders and modern technology is missing. Which is used on aluminum or fiber glassboats. Fourth, the lack of education and training among the boat builders has made thematters worse.
If un-explored fisheries resources are to be exploited, existing fleet needs up-gradation.There is a very strong case for a boat with necessary gadgets such as wheelhouseequipment, fish finders, net haulers and drums gantry and tillable. The industry ishampered by lack of power and high material cost. Manpower needs to be educated andtrained in use of sophisticated equipment. Solutions to these problems include tax freeimports and local manufacturing of fishing equipment, pilot schemes to assist progressiveboat owners and fishermen to begin using new techniques and setting up of fishermen’straining center.
Boats need refrigeration facilities on board to keep the catch according to the requiredstandardization, so that it can fetch the higher prices. There is a great need of fiber glassboats and development of ancillary industries such as manufacturing of nets, hooks,floats, ropes etc. if boats are equipped with such facilities earning could double or go upthree times and export to neighboring countries and Africa could rise significantly.
There is a need to improve construction methods and quality of wooden hull boatsconstructed at Karachi boat yard. Presently boats are being manufactured in theunorganized sector mostly manually. Therefore, there is a need to establish boat-makingindustry in the organized sector so that quality boats could be built. Besides improvingthe manufacturing of wooden hulls pilot scale manufacturing of fiberglass boats shouldmust begin, as is being done elsewhere in the world because wood is becoming more andmore expensive.
Aside from Karachi there is also a need of boat repairing facilities at other fishing centerssuch as Pasni and Gawader. Government should assist fishermen in meeting the high costof procuring gear. Benefits of electronic fishing aid must be propagated. There is need formore extension services in order to popularize new fishing methods among fishermenwho are sometimes conservative in adopting new methods and to modernize the fleet.
Fisheries Development Strategy SMEDA
49
There is no modern plant manufacturing fish nets on scientific lines. Fishermen makenets manually but these are of inferior quality. The basic raw material is namely syntheticfiber is both made locally as well as imported. Thus net manufacturing should beundertaken in the organized sector.
Improving Post Harvesting MethodsRight from the catch, the post-harvesting period starts. After the catch, fish is stored infish hold in the plastic crates, which is totally lacking. Where ice is placed but there areno freezing facilities. After a week or so, the fish is brought on the harbor where it isplaced on the floor of the jetty. Sometimes fish is thrown from the boat, which affects itsquality. Then it is taken to processing units for export. The wholesaler purchases it forlocal sale who dispatches it to different cities but the fish is not properly handled. Moreimportant factor is the absence of refrigerated transport and freezing facilities.
Inferior quality shrimp is priced 20 to 30% lower in the international market then highquality shrimp of the same size.According to the industry sources after following the right handling procedures� White shrimp price can go from US$12 to $14� The price of brown and pink shrimp can go up from $7.5 to $10( about 30% to 40%
increase)� The price of PUD can go to minimum $2.5 from $1.5.
There are four principle factors resulting in low quality.1 Handling, processing and packing do not confirm to international standards.2 microbiological criterion for frozen shrimp is not maintained.3 Freshness is not ensured.4 Size separation is not correct.Quality control through an effective plant inspection program is the only way forincreasing export earnings.
Fisheries Development Strategy SMEDA
50
Annexes
� List of Contacts
1. Ministry of Food, Agriculture and Livestock,Government of PakistanPak Secretariat Block ‘B’Islamabad, Pakistan
Tel: 51- 9203307 51- 9210351
Fax: 51 - 9221246
2. Marine Fisheries Department (MFD)Government of PakistanMr. Moazzam KhanDirector General MFDFish Harbour, West Wharf Karachi.Tel : 21- 2312923 Fax: 21- 2316539
3. Mercantile Marine Department (MMD) Principle officer MMD 70/4, Timber Mart Kiamari Karachi. Tel : 21-2851306
4. Maritime Security Agency (MSA)Director General MSAMaritime Security Building,West Wharf Karachi.Tel : 21- 9214618
5. Export Promotion Bureau (EPB)5th Floor Block A, Finance & Trade CentreShahra-e-Faisal Karachi.Tel : 21- 9202718
6. Small & Medium Enterprise Development Authority(SMEDA)General mangerSmeda- Sindh5th Floor, Baharia complex II, M.T Khan Road, Karachi.Tel : 92-21- 111 111 456, Fax: 021-5610572

Fisheries Development Strategy SMEDA
51
7. Karachi Fisheries Harbour Authority (KFHA)Government of SindhManaging Director KFHAFish Harbour, West Wharf Karachi.Tel : 21-2314204
8. Korangi Fisheries Harbour AuthorityMinistry of Food, Agriculture & LivestockGovernment of PakistanManaging DirectorKprangi fish Harbour, Chashma Goth, Landhi.Tel : 21-5016719
9. Pasni Fish HarbourDirector General Pasni Fish HarbourPasni, BalochistanTel: 0863- 210212
10. Gawadar Fish HarbourDirector General Gawadar Fish HarbourGawadar, Balochistan
11. Fisheries DepartmentGovernment of NWFP
Shami Road, Peshawar
12. Fisheries DepartmentGovernment of Punjab2- Sanda Road LahoreTel: 42- 7321172
13. Fisheries DepartmentGovernment of Sindh
Block- 50, Pakistan Secretariat,Saddar, Karachi.Tel : 21-9203314
14. Fisheries DepartmentGovernment of Boalochistan
Pasni.Tel: 0863- 210212
Fisheries Development Strategy SMEDA
52
List of fishery Related Industry and Associations
15. Fishermen’s Co-operative Society (FCS) Chairman FCS Fish Harbour, West Wharf Karachi. Tel : 21-2310315, 2313139
16. Pakistan Sea Food Industries AssociationChairmanC-6, Fish Harbour, West Wharf Karachi.Tel : 21- 2313601-2
17. Pakistan Sea Food Industries AssociationChairmanM/s. long Wharf Seafoods (Pvt) LimitedB-3, Fish Harbour, West Wharf Karachi.Tel : 21-2313010
18. Sindh Trawlers Owners & Fishermen Association213, Askary Building, Fish HarbourWest Wharf, Karachi. Tel : 21- 2132644
19. Karachi Fishing Boat and Trawler Owners GroupMole No. 33, Fish Harbour, West Wharf, Karachi.Tel: 21-201855, 201259
20. Mole Holder AssociationM. Ismail & Company
Fish Harbour, West Wharf Karachi.Tel : 21- 201776
Fishery Related Research & Educational Institutes
21. National Institute of Oceanography (NIO)Director General NIO
ST-47, Block- 1, Clifton, Karachi. Tel : 21-5860028-30
Fisheries Development Strategy SMEDA
53
22. Centre of Excellence in Marine BiologyDirectorDepartment of BotanyUniversity of KarchiTel : 21-470572 – 479001
(Some international Fisheries Organizations/Groups)
23. Food & Agriculture Organization (FAO)Chief FAOViale delle Terme di Caracalla00100 Rome, Italyweb. site : www. Fao. Org
24. The Marine Product & Development Authority, IndiaMPEDA house, Panampilly Avenue, Panampilly Nagar, Cochin.Tel : 91-484-311979, E-mail: [email protected]
25. InfofishP O Box 1089950728 Kuala Lumpur, MalaysiaTel : (603) 2914466 Fax: (603) 2916804E-mail: [email protected]
26. East FishP O Box 0896, UN Centre, Medtermolen 3, DK-2100 Copenhagen, Denmark
Tel : (45) 35467180
27. Ministry of Agriculture & Cooperatives, ThailandDepartment of Fisheries
Ratchadamnern NokBangkokTel: (66-2) 282-4513Fax: (66-2) 280-1502
Fisheries Development Strategy SMEDA
54
28. Department of Fisheries, MalaysiaWisma Tani, Jalan SultanSalahuddin 50028, Kaula LimpurTel : 03-298-2011Fax: 2910305
29. Ministry of Fisheries & Aquatic Resources, Sri LankaMaligawatte SecretariatColombo 10Tel : 546183
30. Cabin Plant International A/SRoesbjergvej 9, DK-5683 HaarbyTel : 45 63 73 20 20Fax: 45 63 73 20 00E-mail: [email protected]
31. China International Fisheries Corp.31 Minfeng Lane, Xidan, Beijing, China.
Tel: 86-10-66081039, Fax: 86-10-66011021
32. Swede Fishery GroupICH Trading AB, Vastmannagatan 9, SE-111
24 Stockholm, SwedenTel: 46 8 20 81 90 Fax: 46 8 20 81 11Web site: www.swedefish.org

![appraisal marine fisheries gujarat - [email protected] - Central Marine](https://static.fdocuments.us/doc/165x107/620624468c2f7b173004d426/appraisal-marine-fisheries-gujarat-emailprotected-central-marine.jpg)


![NATIONAL MARINE FISHERIES SERVICE …...NATIONAL MARINE FISHERIES SERVICE INSTRUCTIONS 01-101-03 [9/30/2015] Fisheries Management Fisheries Management Actions, NMFSPD -01-101 OPERATIONAL](https://static.fdocuments.us/doc/165x107/5f0d46657e708231d4398972/national-marine-fisheries-service-national-marine-fisheries-service-instructions.jpg)