Marine Fisheries Research. Management and Development ...
40
Marine Fisheries Research. Management and Development Project BGD/80/025/CR 11 Marine Fisheries Resources Survey Demersal Trawling BGD/80/025/CR11 Survey Cruise Report No. 11. May 19 - 24. 1985 and July 12-17. 1985 By T F White FAO Senior Fisheries Biologist United Nations Development Programme. Food and Agriculture Organization of the United Nations Chittagong Bangladesh September 1985
Transcript of Marine Fisheries Research. Management and Development ...

Marine Fisheries Research. Management and Development Project BGD/80/025/CR 11
Marine Fisheries Resources Survey Demersal Trawling BGD/80/025/CR11
Survey Cruise Report No. 11. May 19 - 24. 1985 and July 12-17. 1985
By T F White FAO Senior Fisheries Biologist
United Nations Development Programme. Food and Agriculture Organization of the United Nations
Chittagong Bangladesh September 1985

jj
ACKNOWLEDGEMENT
Besides the biologists who participated in this survey cruise, special mention should be made of Mr Michel Lamboeuf of FAO who assisted with the preparation of data and figures for this report.
Information provided in this Cruise Report is the result of analysis of data obtained during the survey cruise. Any interpretation of these data represents the opinions of the authors alone and does not necessarily represent the opinion of the Food and Agriculture Organization.
Similarly, the designations employed and the presentation of the material and maps in this document do not imply the expression of any opinion whatsoever on the part of the United Nations or the Food and Agriculture Organization of the United Nations concerning the legal or constitutional status of any country, territory or sea area. or concerning the delimitation of frontiers.

1.
2.
3.
4.
iii
TABLE OF CONTENTS
INTRODUCTION
MATERIALS AND METHODS
2.1 The Survey Area and Selection of Trawl Stations 2.2 The Vessel and Gear 2.3 Treatment of the Catch
2.4 Data Analysis
RESULTS
DISCUSSION
LIST OF TABLES
Page 1
1
1 1 2 2
2
4
1. The ten major species groups or Families caught during each survey cruise both in terms of their relative abundance in the total catch of that cruise and rank. 3
2. Average Catch Rates Obtained (All species combined) by Depth Strata for
each Cruise 4
UST OF FIGURES
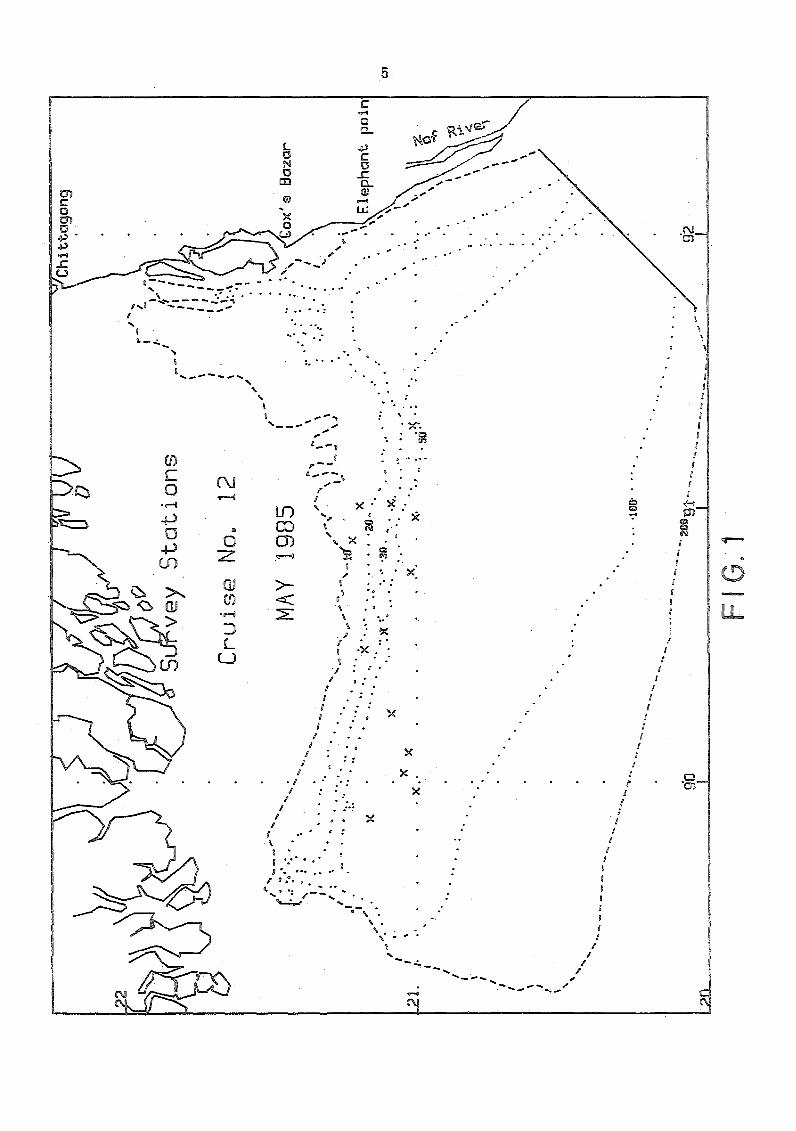
1. Survey area showing position of stations - Cruise No. 12 5 2. Survey area showing position of stations- Cruise No. 13 6
7 B
3. Distribution of total fish stock over the survey area - Cruise No. 12 4. Distribution of total fish stock over the survey area - Cruise No. 13. 5. Catch rate (kg/30 minutes haul) versus depth of trawling (metres) for
6. 7. 8. 9.
10. 11. 12. 13. 14. 15. 16. 17. 18. 19.
Total Catch -All species- Cruise No. 12 9 Total Catch - All species - Cruise No. 13 10
Length frequency histogram for Japanese threadfin bream, Nemipterus japonicus 11 white pomfret, Pampus argenteus- May 12 white pomfret, Pampus argenteus __.July 13 rainbow sardine Dussumeria acuta 14 lizard fish, Saurida tumbi! 15 yellow lined goatfish, Upeneus su!phureus 16
" chinese Pomfret Pampus chinensis 17
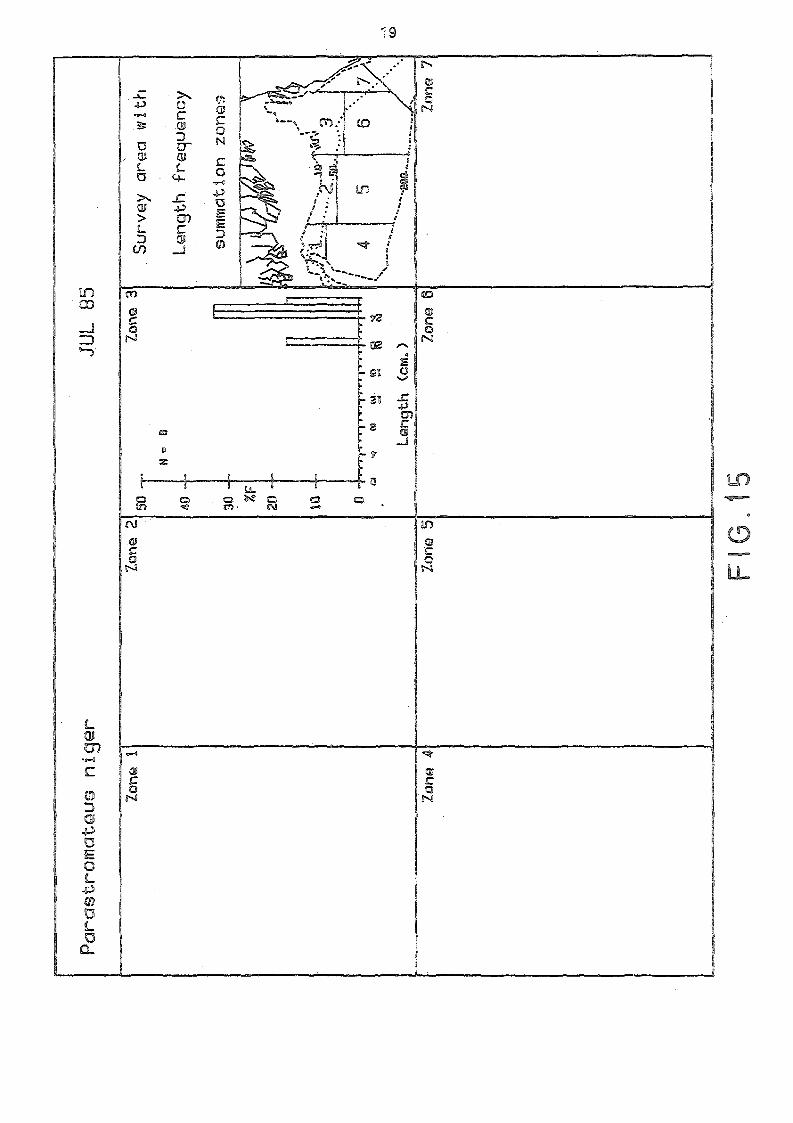
"· hard tail scad, Mega!aspis cordy!a 18 black pomfret, Parastromateus niger 19
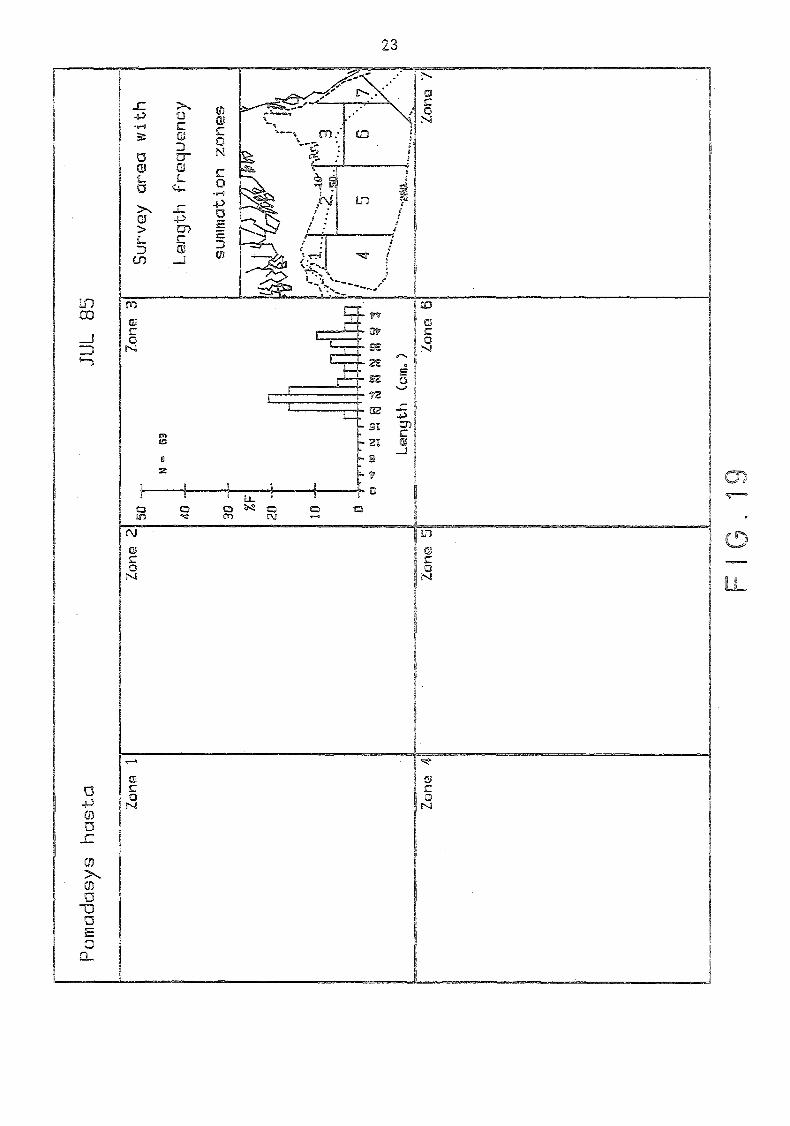
" blackspot threadfin, Po!ynemus sexstarius 20 kuweh trevally, Atropus atropus 21 grunter, Pomadasys hasta - May 22
" grunter, Pomodasys hasta - July 23

Iv
20. Length Frequency histogram for Bombay duck, Harpadon nehereus 21. hairtail, Lepturacanthus sava!a 22. Secchi disc measurements in the survey area - May 23. Secchi disc measurements in the survey area - July
APPENDIX A RESEARCH VESSEL R/V "ANUSANDHANI"
APPENDIX B ENGEL HIGH OPENING BOTTOM TRAWL
APPENDIX C SURVEY LOG SHEETS
Page 24 25 26 27

1 INTRODUCTIOl\I
In order to understand more about the abundance and distribution of the living marine resources within the Bangladesh continental shelf, the Bangladesh Government, with the assistance of FAO, commenced a comprehensive survey programme in September 1984.
Initially, the investigations concentrated on the demersal resources, which were surveyed using a 32m, research vessel with a high opening demersal fish/shrimp trawl. A series of cruises were planned to cover both the summer monsoon (April-September) and winter (October-March) periods. Due to the widespread influence of the monsoon discharge of the Ganges/Brahmaputra river system, into the northern Bay of Bengal it was important that the survey be conducted during both seasons.
In May, 1985, Cruise No. 12 was abandoned after only 13 stations had been trawled. Due to the inclement weather conditions, no survey cruises were condt:1C:ted in June. In July, an attempt was made to continue the survey programme, However Cruise No. 13 was also abandoned due to the weather conditions after only 13 stations had been trawled.
This report is a summary of the results obtained from these two cruises, Nos 12 and 13. As too few stations were tr0wled on each occasion to allow any meaningful analysis of the results and too much time had elapsed between them for the results to be pooled, this cruise report is a only a summary of the results obtair.ed C:urir.g these cruises.
2. MATERIALS AND METHODS
2.1 THE SURVEY AREA AND SELECTION OF TRAWL STATIONS
The survey area extended from the 10 metre depth contour in the north and east, to the 200 metre depth contour in the south. A line drawn at 45° from the southern tip of St. Martins Island was considered to approximate the Bangladesh/Burmese marine border in the south east. In the west, the survey area extended to the Bangladesh/ Indian marine border, but in practice no trawling was conducted west of the eastern edge of the "swatch of no ground". The survey area, together with the 10, 20, 30, 51, 100 and 200 m3tre depth contours is outlined on ail Figures used in this report,
Fifty trawl stations were selected prior to each cruise on a random basis covering the entire survey area. The survey area and stations actually surveyed are shown on figures 1 (Cruise No. 12) and 2 (Cruise No. 13).
The most practical cruise track to cover these stations was selected by the captain of the research vessel in consultation with the cruise leader.
2.2. THE VESSEL AND GEAR
The survey vessel, the R/V "Anusandhani" is a 32.4 metre "multipurpose" research vessel, although principally designed for stern trawling, constructed in Japan in 1979. Details of the vessel are provided in Appendix A.
The trawl net used was an Engel high opening fish/shrimp trawl with a cod-end mesh size of 32mm. Details of the fishing gear are provided in Appendix B.

2
Secchi disc transparencies and surface water temperatures were taken at all stations using a standard 30cm diameter white disc and 0-51 "c thermometer and bucket
respectively.
2.3 TREATMENT OF THE CATCH
Stations were trawled during daylight in order to avoid any possible bias in catch rates due to day/night variations in abundance. All hauls were of 30 minutes duration, the time commencing when the net reach the bottom, as determined by the net-sonde and terminating when hauling commenced. If trawls were discontinued within 15 minutes of shooting, they were considered invalid and the results discarded.
The catch was sorted into species and each weighed separately to the nearest 0.25 kg. In the event that the catch in a particular haul exceeded 500 kgs (approximately) than it was subjectively subdivided into two equal portions, one of which was sorted and the results then doubled. In -the number of individuals of any species present in the catch was less than around 20 then the numbers of that species in the hual was counted in order to calculate the average weight of the species. If the number was greater than this, then a weighed sample was usually taken for length/frequency measurement and the average weight calculated in this manner.
In any event samples of 50-200 fish were selected randomly for length measurement for most species in the catch, where the species were clearly indentifiable. As the taxonomy of the catfish (Family Ariidae) and jewfish (Family Sciaenidae) was confused no length measurements were made for these two Families. Lengths were in ems, fork length.
2.4 DATA ANALYSIS
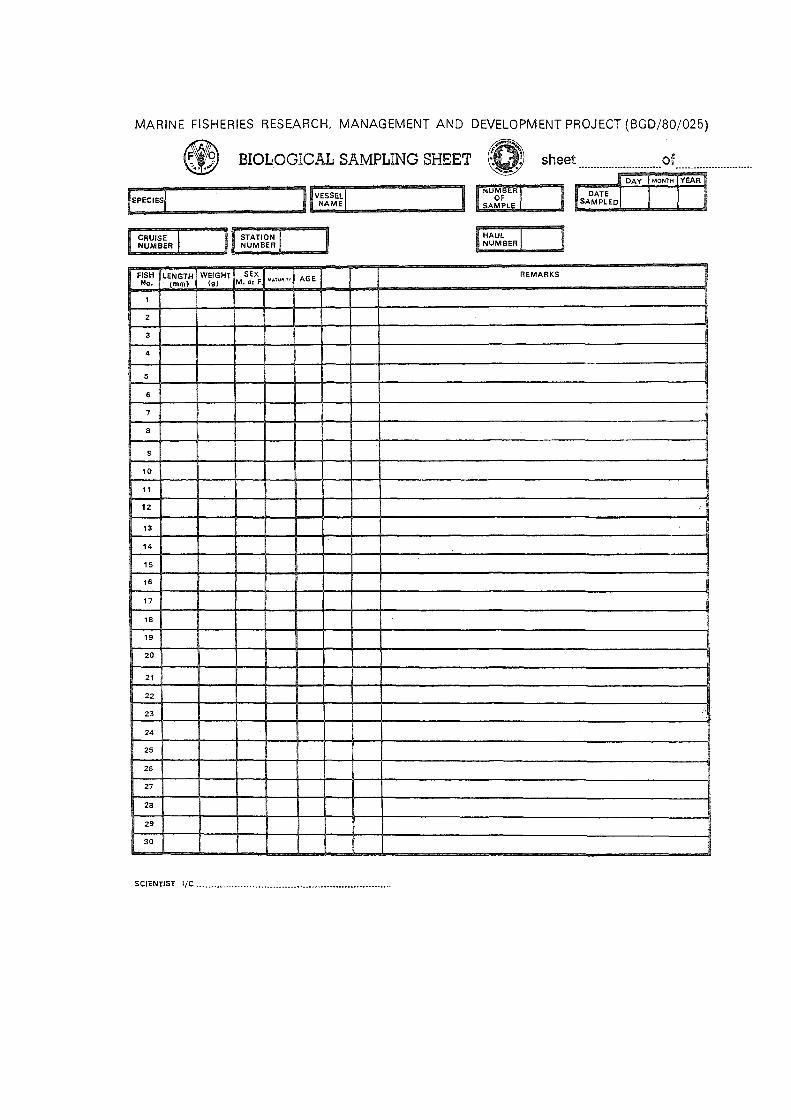
All data were recorded on proforma sheets which are shown in Appendix C. A Hewlett Packard 868 microcomputer was used to store and analyse the catch, length frequency and oceanographic data, using programmes written specifically for the purpose.
For the analysis of the length frequency data, the survey area was subdivided into eight zones. For each species, samples taken from within the same zone were pooled and a single histogram produced for that zone. The histograms were then plotted onto the maps of the survey area in the position where the samples were taken. The eight zones are shown with each of these histograms.
3 RESULTS
As described above, only thirteen of the planned fifty stations were sampled during each of Cruises No. 12 and 13. Most of the hauls made during Cruise No. 12 were carried out along the northern shallow areas of the survey area, while those during
cruise No. 13 were along the eastern shallow areas. The following is a summary of the stations successfully trawled by depth zone. The positions of these stations are shown on Figures 1 and 2 and catch rates obtained on Figures 3 and 4.

Depth zone No. of successful hauls
Cruise No. 12 Cruise No. 13
10-20 metres 3 4
21-30 2 5
31-50 2 3
50-100 6 1
· Total : 13 13
Table 1 below lists the ten major species groups or Families caught during each survey cruise both in terms of their relative abundance in the total catch of that cruise and rank,
TABLE 1
Cruise No. 12 Famify % of catch I Rank
CARANGIDAE (Jacks, scads, trevallies etc) 32.6 1
ARllDAE (catfish) 15.9 2
SCIAENlDAE (jewfish) 12,9 3
NEMIPTERIDAE {threadfin bream) 6.8 4
TRICHIURIDAE (Hairtail) 5.5 5
Trash Fish 5.4 6
LEIOGNATHIDAE (pony fish) 3.9 7
CLUPEIDAE (herrings, shads etc,) 3.3 8
MULLIDAE (goatfish) 3.0 9
Rays 2.3 10
HARPADONTIDAE (Bombay duck) 0.8
ENG RAU LI DAE (sardines) 0.4
POLYNEMIDAE (Threadfin) 0.1
Penaeid prawns 0.5
I Cruise No. 13
% of catch I 0.7
16.1
18.7
Not present
2.5
1.5.
Not present
3.3
0,2
4.0
44.7
3.0
1.4
0.8
Rank
3
2
7
8
5
4
1
6
9
10
4
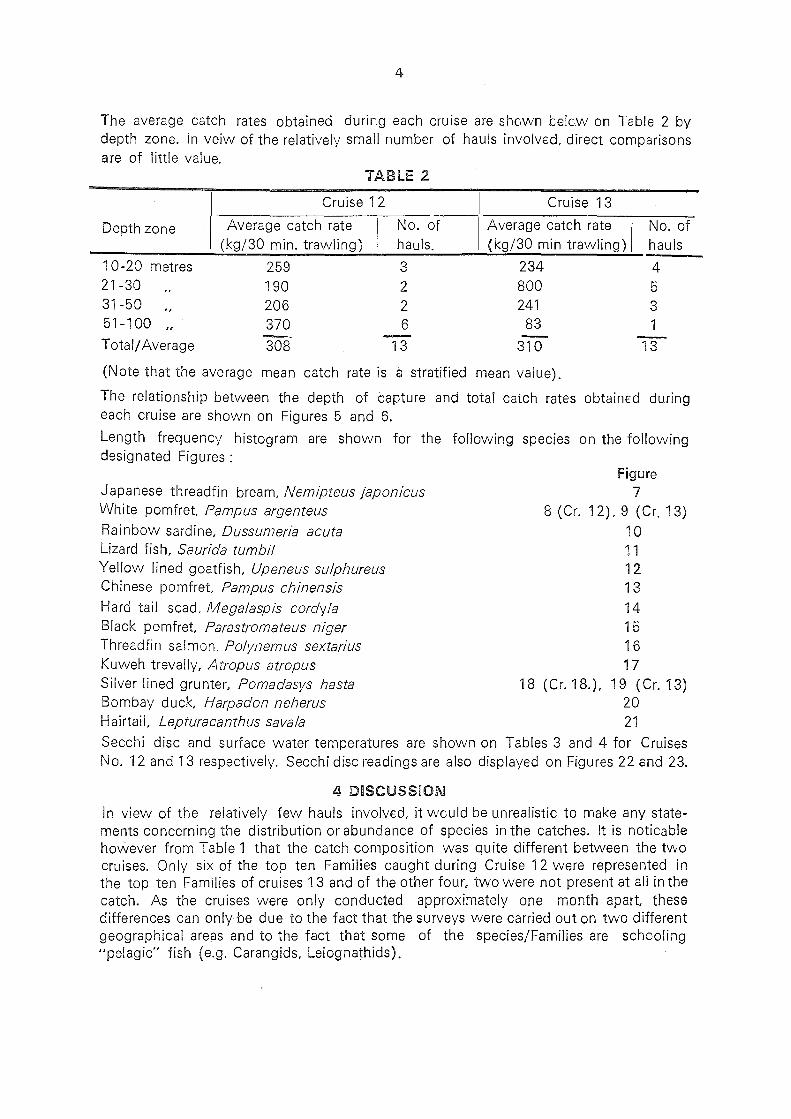
The average catch rates obtained during each cruise are shewn telcw on Table 2 by depth zone. In veiw of the relatively small number of hauls involved, direct comparisons are of little value.
TABLE 2
Cruise 12 I Cruise 13
Depth zone Average catch rate No. of I Average catch rate I No. of (kg/30 min. trawling) hauls. (kg/30 min trawling) hauls
10-20 metres 259 3 234 4 21-30 190 2 800 5 31-50 206 2 241 3 51-100 370 6 83 1 -·· Total/Average 308 13 310 13
(Note that the average mean catch rate is a stratified mean value).
The relationship between the depth of capture and total catch rates obtained during each cruise are shown on Figures 5 and 6.
Length frequency histogram are shown for the following species on the following designated Figures :
Japanese threadfin bream, Nemipteus japonicus White pomfret, Pampus argenteus Rainbow sardine, Dussumeria acuta Lizard fish, Saurida tumbil Yellow lined goatfish, Upeneus su/phureus Chinese pomfret Pampus chinensis Hard tail scad. Mega/aspis cordy/a Black pomfret, Parastromateus niger Threadfin salmon, Polynemus sextarius Kuweh trevally, Atropus atropus Silver lined grunter, Pomadasys hasta Bombay duck, Harpadon neherus Hairtail, Lepturacanthus savala
Figure 7
8 (Cr. 12), 9 (Cr. 13)
10 11 12 13 14 15 16 17
18 (Cr.18.), 19 (Cr.13) 20 21
Secchi disc and surface water temperatures are shown on Tables 3 and 4 for Cruises No. 12 and 13 respectively. Secchi disc readings are also displayed on Figures 22 and 23.
4 DISCUSSION
in view of the relatively few hauls involved, it would be unrealistic to make any statements concerning the distribution or abundance of species in the catches. It is noticable however from Table 1 that the catch composition was quite different between the two cruises. Only six of the top ten Families caught during Cruise 12 were represented in the top ten Families of cruises 13 and of the other four, two were not present at all in the catch. As the cruises were only conducted approximately one month apart, these differences can only be due to the fact that the surveys were carried out on two different geographical areas and to the fact that some of the species/Families are schooling "pelagic" fish (e.g. Carangids, Leiognathids).
Chi
ttag
ong
, .....
,.-
I·
I -,
1"
1
/ f"
I
.. -/
II
I I
I I
I \
I I
I \
I t
I t
I I
, \ I.
·., '
\!: •\
Sta
tio
ns
Cru
ise
No
.. 12
/// I
. ·~
"'"'
~....
,--
(; ~~
·~.~ .
~ ........
..... ~..
M
AY
1 98
5 t
" . ..
.... '
I •
.,, "
' ,.
"' \
I'
. •
• ••
'•
-..
.I''-
. \
I j'
\ \
I •
• •
• ••'
....
...
, .
/""•
.'
\ \
( \
\ \
I •
~..
• •
'•,
• '-
--.·
,.-.
-
" I
I -
..,
\ .J
I
I •
...
• ·:: •
• •
• •
• •
• •
"".,
,,.
,,,.
-'
-w
;
·, :
.. •
. ' ..
. : :
. . . .
. x
x ,."
' x
• ..
. ..
x ..
....
....
.. ·
2()~
"·/
. •
• •
• •
....... i
· ••• •
• · •
• ·3
0 ..
•
. ..
. 1"
" f
• -X
' t
I • •"
'It •••• 0
....
e ·><
:. •
.,, •
•o
••
1 ,'
xx
·.
·.·.
.
....
.. ~.
··
• .I
· ••
•
X •
• '
,X.
X·
·.•
• .X
. :
I
•• ~
'50
••
I I \ I
I I
I I I \ \ I I \ ' ' ... ..
. ..... .....
___ -
--.....
..
..
-...........
..... ....
....... ....
90 .. ~
..
..
.... _ .....
.._ .....
... · ·
·U
lD·
·
..... _
____
_ ---
-20
0'9
t---
-..... __
___ _
FIG
. 1
.·
~ . .
••
• •
I ~
.· .·
..
.. . ·
....
.. ..
. ·,,,
: .
' .
, •
• I
••'
. I
. .. ' ' .
.,. \
Bcr
:zor
\ . \E
lep
han
t po
in
. · ... ·.
' \ I \'\.
~~
I 7J
I
,_..
\ 4
\ \ I I \ \ \

,-
L 0 N 0
CCI
(/)
' ---\. ___ ..,,=-·· -,,,- ........ _--- -. ·.· .· .... . ~ __ . __ -: ... ""
I • .• • ·.:
.. _ ... -... I i
(J)
c 0 .,...,,
..µ 0 ..µ U1
..... .,,..-- __ ,
" 0 :z
GJ (J) . ,...,, :J L
u
' ' ' I I
. .. .: .. _ .. x. ·,.c . x : ......
, __ ,..,.,,,.,..-"' ,. ..... '-- .. ,.--'
c..,,,.--
U1 CD m ..--!
,.-' ,. I
,,. I
r I \ \ \
,I ; I I
6
c -0 c..
x· ... x
. ~.
x . x
·.
.· .
a· ~ . · ..
.. . ' ..
I • : J'
I a; •
... .. ... . . ~
.x . - ... .. . ..
. .
. ..
·. "Iii
· .
I \ \ \
I 8 I I I I I I I I I I
+< O>
~ I I I I I I I I i I I
I I
I I
I I I I
.. .. . ,., : ~ ' I I
I . ' I I
. ' I I
I . :
I I
I \ I
I
I • I I
I
I ._.· • . , ·. . ..
.· .
... ··· ... . :
,.' , :. . 'I•: • •• --=-,-- ....
"
I i
I {
I / .g I
I I
I I
I I I I
'I.·. I \ . I
',· ·. I \ I ' I -.... I
-- I ', I _ .... , , ... _ I'
..._,,,,,,,,, .... ~_/"
N
LL

I._
' ,-
!..
I l
I I
I I"
I -
-J
II
I I
11
I \
I I
I \
I I
I I
I I
I I
\ I ·
'.1
10
1-2
00
,.,
0
\ \!
:-\
.......
,/
. ·~
f ': .·,:: ~
~..--...
_.._,._
>
200
I I
0 ,-_
,,." ••
•
• •
I ..
. I
J1 1 .: :;
:.". ~ ..
... ~ ..
.......... ,_
.. Z
ero
catc
hes
no
t ,.~ho:~
... ~'
:· ..
:: :·
: :
{;.0
/•
• ••
•••••
....
...
I._
\,\\\
.:
'•
CJ,.
..
....
.
..... 0
,,, ,
,,
.... : ...
#
I .'
... , "CJ
. .°,':
: ..
... ·:
..
'--rt
::q
--'-K
f 0
) _ _,
\.1
'
Kg/
30m
in
0
I I
0
"§~</.
. . . ··
CY: "< ..
.. i:J "':.
"~" ..
. 0. · ...
.. ..... · .
......... ..
i,i':
o o
o ..
... u
....
: :· .
·. · .... ·
.·. o· : .
.. .
~,,
I '
•• I
•.
· ..•
;.
50 •
· .
. .
• "
I I I \ \ I I \ ' ,/
I \ I
I ' .....
.. ..
.... ... ...
. _ --
----
..... ""
" --......
..
ALL
FISH
..
r'
•
....... ...
... _ -- -
-.... .....
. .......... __
_ _ ---
---2
tlfl
91
----
----
----
-
... ·
tfl!
l' •.•
. . .
90
FIG
.3
.. ' '
MAY
85
.,. \ \ \
Ele
phan
t p
oin
t
' ' I ' ·.
'
92
' ' \ I \ \ \ \ I I \ \ \

Chi
ttag
ong
, .......
,-
(.
A
f \
I I
f f'
I
--"
't I
I It
I
\ I
I I
\ I
I I
I I
I I
\ 1 "·
t
0 \
\!:-
\ I
'I
,,, ,,,
. ~
(;~~·~
~~"''-
..-.,.
_ >
50
0 I
I I
0 ( __
,,, 0
0 f..,
.
: :
~ .... .
. ....
Zer
o c
atc
hes
no
t sh
own
1 •
.. •
.. ~
:: . .
........
.. .. ,.
\ '(:/
: ..
di
l /.
: ·
· · .
.. ··
~ .. ·
.-....
........
.. ,,,
.:.,,"
'·\ \
! \ \
\
1 .; o
. -.
.. =
...
• ...
0 K
g/30
min
201-
500
I I
0
I I
I :
• ..
•
';:"
.:: :
: :
• ..
. '.
• •
'-
--..
._.,
.,,.
.,. .
. ~-,-Kf"
1)
_ _,
\J
'\
g. :#,...<
:: ~ ..
~ ·:. ·: .
: ......
......
......
.. ·2
(1..
·6
........
o· .. ,
1 /( :
. <· :
: < .'>
:-: : ....
"·.: : :
:. : ·. ·. :.
·: ·: ... ~
. : ... ·: .
.... ·...
:. Ct
} I
• "
' '
I I
....
50
··
·. "
I I I \
...
·.
"
JUL
85
' \ \ \ \ I \ \ \ I I I I
O~
O'
·0
I ' .
\
\ \ I I \ ' ' ....
.... ... ....
.... --
--~ --
...... .....
.... -....
-....
ALL
FISH
90
..
---•
•.
·1fll
} ••••
.,,,..
.,,,,.
.,,...
.....,
___ ---
--2
00
91
---
FIG
.4
---- -
-----
.,. ..
.
\ \ \

9
0 N -· 0 --
Ln 0 0
00 ->-< ~ 0
+ en
+ +
0 .CD
+ 0 I:'-
,..... E ......
+ 0 ..c co +' LO a.. QI
0
~ 0 + It) 0
0 LL + 0
QI ..c
~ u +' 0
:I: u (/) 0 . .......i 0 L
LL CT) II
+ N
_J + _J
< 0 CT)
+ N -+
.. 0
+ .... :::>
0 0 - ..c .... 0 +' 0
0 I-
0 0 0 0 0 0 0 0 0 0 0 0 0 0 0 N - 0 0 0 0 0 0 0 0 0 0 0 - - - en CD I:' co It) ~ ('I') N -
(U'JWOE / 6)1) 4=>+0J

10
Lf) 00
_J :J .......,
:::r: CJ) 1--1
LL +
_J _J + <
I I I I I I I I 0 ' B I ' '
0 0 0 0 0 0 0 0 0 0 0 0 0 0 co «:!" N ·O CD co -q-..... ...... .... ......
(U'PllOE I 6)1) 4:l~OJ
+
+
+
+ + +
* ++
I
' 0 0
.N
0 .,... N -0 _,_ ....... -0 _,_ 0 -0 _,_ Cl)
_,_ 0 CD
-,_ 0 r-..
.... 0 co
_,_ 0 If)
0 _,_ «:!"
+_ ;.- 0 (T)
_,_ 0 N
_,.... 0 -0
0
,-.... E ......
..c CD +> CL Cl!
0 ~
0
m LL Cil ..c 0 +> 0 0
0 L Cll
N
00 -.. 0 ..... '.:) 0 ..c
..... 0 ~ 0 r--

Nem
ipte
rus
Jap
on
icu
s
Zone
1
Zone
4
50
40
30 %F
20
10
MAY
85
Zom
a 2
Zone
3
N .
. 33
0
Len
th
(cm
.) Zo
ne
5 Z
one
6
FrG
.7
Sur
vey
area
wit
h
Len
gth
freq
uen
cy
sum
mat
ion
zon
es
,. .......
.. .._
,--L·.
.. / .
• 1):
.1.
......
.. JO
' ~~
.JJ,
•
• •
• •••
• -"
)-'
" .::;;
.. . I
I I /. : 4
5 ' '''
---..
. .. ~
.. ~ ........
.. 290
. ......
.
6
-... -__ _
Zone
7

Pam
pus
arg
en
teu
s
Zon
e 1
Zone
4
50
40
30 %F
20
10
MAY
85
Zon
e 2
Zon
e 3
N ..
34
Len
gth
(cm
.) Z
one
5 Z
one
6
FIG
.8
Sur
vey
area
w
ith
Len
gth
f reg
uen
cy
sum
mat
ion
zone
s , ... r r
,...
....
....
...
,,.,.
I ',
,--t.·
·1
... '
' I
.'f}
· ..
,. .. ,
. .1
,0-
,'itf,1
I
:"1 .. ·'
... • •
••••
•• ·"'
)-3
l r
~-
·· ...
:
------..~
.. ~
: 4
5 6
I ', , ...
..........
.. ..... ..
....
.. ..
i!SQ
. ....
_ --
---Zo
ne
7

Pam
pus
arg
ente
us
Zon
e 1
Zone
2
•' 50
N "'
40.
30 %F
20
10
Zon
e 4
Zon
e 5
IG.9
JUL
85
Zon
e 3
a Len
gth
(cm
.> Z
ona
6 50
40
30 %F
20
10
Sur
vey
area
wit
h
Len
gth
f reg
uen
cy
sum
mat
ion
zon
es
Zon
e 7
N"'
a1
Le
ng
th
(cm
. )

Ous
sum
erio
acu
to
JUL
85
Zon
e 1
Zon
e 2
50
Zar~
3 :
:
N"
17
40
30 %F
20
10
o N
~
m
m
a N
~
m
m
~
....
, V
""i
..,,
. ...
.....
Len
gth
(cm
.)
Zon
e 4
Zon
e 5
ZonQ
6
I G.
10
50
40
30 %F
20
10
Sur
vey
area
wit
h
Len
gth
f reg
uenc
y
sum
mat
ion
zon~s
Zon
e 7
N .
, 19
Le
ng
th
(cm
. )

Sau
rid
a tu
mb
il
MAY
85
Zon
e 1
50
Zon
e 2
Zon
e 3
Sur
vey
are
a w
ith
N
..
74
40
Len
gth
f r8q
uenc
y
30
sum
ma
t i o
r,
zo
na
s
%F
20
10 0
Ml
Q ~
w ~ ~
tij ~ ~
N
ffi (i
)
Len
gth
(cm
.)
50
Zon
e 4
50
Zon
e 5
Zon
e 6
Zon
e 7
N .
, 25
5 N
.. BB
40
40
30
30
%F
%F
20
20
10
10 0
I ..
....
.,-l
"'l'"
fl
Q ~
w ~ ~
tij ~ ~ ~ ~
LQ
ngth
(c
m.)
L
engt
h (c
m.)
F I
G .
11

Upe
neus
su
lph
ure
us
MAY
85
Zon
e 1
50
Zone
2
Zone
3
Sur
vey
area
wit
h
N ..
22.7
40
Len
gth.
fre
qu
ency
30
sum
mat
ion
zon
es
,;F
20
, .. ,
... r
I •
_,('
I , ...
""" .....
... t
• ..
,-r-·
.. \'j
l.[\\
I
10
. \
.......
,.,:
i.
....
.J.~
,. _,
J ....
.... z-
3 .'
/ ;
I '
. .
.. I
I ...
I I ..
0 I
4 5
6 I
Cl
(\I
... IO
m
Q
(\
I o,
j>
I ...
.... ...
', '--
-...
""""
.... O
>
Len
gth
(cm
.)
.... .....
...... 2
e4
--
Zon
e 4
Zon
e 5
Zon
e 6
Zon
e 7
FIG
.12

Pam
pus
ch
inen
sis
Zon
e 1
Zon
e 4
50
40
30 %F
20
10
MAY
85
Zon
e 2
Zon
e 3
N •
39
Len
gth
(cm
.) Z
one
5 Z
one
6
F I
G.
13
Sur
vey
are
a
wit
h
Len
gth
freq
uen
cy
sum
mat
ion
zon
es
;"':'
I I
•• .,
•• ,
I I I 4
s s
,, . '--
-........
... "'
~ .....
...... ~ ... -
Zon
e 7

Mb:
?ga
1 asp
is
cord
y1a·
JU
L 85
Zon
e 1
'Zon
a 2
50
Zom~
3 S
urve
y ar
ea w
ith
'·
N ..
15
.40
·Len
gth
f r::-
eque
ncy
30
sum
mat
ion
zo
ne
s
%F
20
,-r~
.,,-
... ">;> 10
. '
1
.....
'·' .
.... ....
..-~ ... -:.
' ...
..... z.
i~
' ,
. ..,
....
I I I I
0 I
4 5
6 .I
Q
"" Ii
i 1\
1 co
fO
"'1'
I
-... N
,,
.....
'---
... -..
00
L
en
th
(cm
.)
~~ ....
..... ~--
.,. __
,,,.,
Zon
e 4
Zon
e 5
Zon
e 6
Zon
a 7
F I
. 14
Par
astr
om
ateu
s n
iger
JUL
85
Zon
e 1
Zon
e 2
50
Zon
e 3
. Sur
vey
area
wit
h N
..
8
40
Len
gth
freq
uenc
y
30
su
mm
ati
on
zo
rn'3
s
%F
20
10
Len
gth
(cm
.) Z
one
4 Zo
ne 5
Z
one
6 Z
one
7
FIG
. 1

Pol
ynem
us
sex
tari
us
Zon
e 1
Zon
a 4
Zone
2 50
Zon
e 5
40
30 %F
20
10
I G.
16
JUL
85
Zone
3
Sur
vey
are
a w
ith
N .
. 37
Len
gth
freq
uenc
y
sum
mat
ion
zon
es
Zone
B
Zo
ne
7
N
0

Atr
op
us
atr
op
us
Zon
e 1
Zon
e 4
Zon
e 2
Zon
e 5
50
40
30 %F
20
I G.
1 7
JUL
85
Zon
e 3
Sur
vey
area
w
ith
N
.,
29
Len
gth
freg
uen
cy
sum
mat
ion
zon
es
Len
gth
(cm
.)
Zon
e 6
Zon
e 7

Pom
ados
ys
hast
a
MAY
85
Zon
e 1
Zon
e 2
50 -
-Z
one
3
N ..
4
40 --
30 -
-
%F
20 -
-
10
--
D ~
'"Fr
'l,.
..-.
..,.
..,~'T'r?'"T,'T'TT'T,,......-t
1+
+H
-
m
~
;\)
~
51 !I
Len
th
(c
m.)
Zon
e 4
Zon
e 5
Zon
e 6
I G.
18
Sur
vey
area
w
ith
Len
gth
fr
-equ
ency
sum
mat
ion
zon
gs Zon
e 7
N
N
Pom
adas
ys
hast
a
JUL
85
Zon
e 1
Zon
e 2
50
Zon
e 3
Sur
vey
area
wit
h
N "
" 09
40
Len
gth
f re9
uen
cy
30
sum
mat
ion
zon
es
%F
20
10 0 ·~
C"'1'00~~~~Ri!ij~~:J
Len
gth
(cm
.)
Zon
e 4
Zon
e 5
Zon
e 6
Zon
e 7
. 1

Har
dapo
n n
eher
eus
Zon
e 1
Zon
e 2
50
N"'
40
30 %F
20
10 0
Cl
"<)'
Zon
e 4
Zon
e 5
I G.
2 0
JUL.
8
5
Zon
e 3
217
Tf~·
Fl
(lJ
N
(0
Rl ~ ~ ~
-.,.. N
Len
gth
{cm
.)
ZonG
i 6
50
40
30 %F
20
HJ
Sur
"vey
are
a
wit
h
Lg
ng
th
f'r·
egue
ncy
sum
mat
ion
zo
nes
Zem
e '/
0 -+
-.T
V'T
ierr
FrT
TT
Trn
-n+
'l+
ttrH
•fh
-rr
Cl
~
00 ~ ~ ~ ~ ~ ~
Lem
gth
(cm
.)

Lep
tura
can
thu
s ~avala
Zon
e 1
Zon
e 4
Zon
e 2
50
40
30. %F
20
10
Zon
e 5
50
40
30 %F
20
JUL
85
Zon
e 3
N ..
Ul
Len
gth
(cm
.) Z
one
6
N "
' 67
Sur
vey
area
wit
h
Len
gth
f reg
uenc
y
sum
mat
ion
zone
s
, .... .,.
.....
,~ -t
:·.
.. I
.'l.1
;'I
~ ...
. .,
tn,
.,.. t
J.I
I
"J. •
• ~
·')-
...sv
,)';
·····~
/ r
. . .
.... ·
.. I
•.
,I I
4 5
,, '---~
.......
50
40
30 Y.F
20
.... ........
... 2So
. ......
.
N .
. 42
6
Zon
e 7
Cl©~~f.i~~m~~liJ!ll
blirl!!;l~lif5i~lft~~fitat
l~-~~~
~~~~~~
~~~~~~
~~~~~~
~----~
~~-L_e
_n_g_t
_h~C_c
_m_._)
~~-"-~
~~-L_e
_n_g_t
_h~<_c
_m_._>
~~,.,.
.,,
FIG
. 21

2-5
m
5-
10m
0 0
20-5
0m
50-1
00m
0 0 0 I I I \ \
/· ......
. __ ,
,. .......
,....
Secch
i O
ise
,, ......
\',I
"\\
f
-. '
,, ''1
I"
"' .....
__
/ /
,, -- I I I I I I I
.;
I I I
Ch
itta
go
ng
Cox
's B
azar
...
,,
'· •
; .
I .
• I
••
• •
.• •
. I
:. :·
:..
. ",
R
.. ; :
··.-: .
.. '
'',,
, /
' V
--
,)
' . '
.
. --,
---
. .;
r;
I.
. .
. .
. ..
.•
'
--.
,,.
-'-
tu
Q
v -
••
• -
,_
'
( . .
. .
. .
"' "•
.
c.i
;,
, •..
•.
:.:.
::::
:::·
··· .
. '.::
·"o
· ....
... , .
....
...
....
....
....
.. ..
0
, '
' -•.
' '
' "
-'
" '"
' -
' 0
, ,,_ ~
) ..
oo
-..
· · · · ....
::o
: ..
· · :o
... · ·
·o. · · ... : -· ·
" ·: : jj
. · ....
·. 0
,," ..
.
&1<
·. oo
o "-
1 I
? 1 ~
{)
,' V
j I
.· .·
',.' ..
\ E
lep
han
t po
in
\ \
\ I \ \
\ \
I I I \ I \ \ I
I I I I I I ' ',,
....
.. . .
·.
........ _
____
___ .
....... _
... """"'-
......... -.....
....
MAY
19
85
90
---~ ...
....... --
----
----
---2
llllg
t---
----
----
--
'· .
.. ·
HIO
-'
•..
· •
•.
. ...
. . ...
. . .
. .
92
FIG
.22
\ I \ I \ \ I \ \ I \

m
I \ 0
} I 0
) 2
0-5
0m
,-
o Q
"
Cox
' e
Baz
ar
2-5
m
S
O-lO
Om
,
-o
; .'
'\
5-l
Om
0
: \J·
;"
I
,. .....
.... S
h 1'
Di S
C
.. \'1
t',
\, '; .
O.',' :
:: :
\,.,
p
o•n
t '
-'
e cc
I \
I \
• •
• •
• I
El e
ph
on
t A
f ': ... ~·~. .
'-,
-.. ,,
,-,'
\• ·--
,, .. "
. .. . .
'o
" o
\ •
••
• •
• '
',
I •
' .
' .
• .
-----
, ..
-K
l' .
. '
b I.
. .
. .
..
.. . .
.
', _
_ ,
I -
,_
••
•
• '
0 I
" , .
. .
..
.. ..
·..
,,
..
....
·.
. ....
· .. 0
0
" 0
\ il
t:
. ·.
:::.
..
. .
. . .
. . ..
...
·. ..
. . ..
. .
. .
.. ..
. ..
..
.. ·.
\ ,<
I
' •;
: .
•·
.. •
• •·
.
• .•
• •
• •
• ..
·g
!) •
••
• •
• .-.
• "
, "
• •.
\ ~
. .. .
. . ..
.. '
. . .
. .
. ·.
\ I
• .
• •
• •
• .
• •
I :f
,i
. ·.
. ··
...
.. ,.
,..
\ '<
/ • •
. I
0 '·
.
. \
. .,,,
,-.
' d,
,_?
I '
Q ·o
\
1$'
: '
I t;
'
\
I "
, ,
, ,
I ,
, , .
I I \ I I I I \ \ I I \ ' ' .... , .....
..... __
____
___ .
.....
JULY
. "
....
..
.,,..,..
,,,..""
'° .....
... ~..,
,.~-
--.
.... ...,,
.
1985
--
-....
___
____
____
"""9
t----
----
--....
..
. "··
..
·U
lll'
' "'
.....
... •
• t
u ••••
90
92
FIG
. 23

APPENDIX A
RESEARCH VESSEL R/V "ANUSANDHANI"

Principal Dimension -- _. ~-
Length Overall
Length B.P.
Breadth Mid
Depth Mid
Gross Tonnage Main Engine
Max Trial SP
32.40M
28.00M
7.50M
3.30M
221.16 G.T. 900 PS
12.44km
m _,....... __
Fish Hold
Fuel Oil
Fresh water
Freezing Room
~omple_ments
Officer
Crew
Scientists
Total
73.67 M2
88.22 M2
34.53 M 2
11.17 M 2
..::===-
22

APPENDIX B
ENGEL HIGH OPENING BOTTOM TRAWL

GE
NE
RA
L A
RR
AN
GE
ME
NT
FO
R E
NG
EL
486
ME
SH
H
IGH
O
PE
NIN
G
BO
TT
OM
TR
AW
L
1.
Hea
dlin
e 57
.50
met
res
P. P
. C
ombi
natio
n w
ire
rope
12
mm
di
a w
ith
st
eel
core
2.
Foo
trop
e 66
.30
mtrs
. P.
P.
Com
bina
tion
wire
ro
pe
1 4m
m
dia
wit
h s
teel
co
re
RU
BB
ER
di
sc G
roun
drop
e 5
x 13
, 10
mtrs
.

APPENDIX C
SURVEY LOG SHEETS

MARINE FISHERIES RESEARCH, MANAGEMENT AND DEVELOPMENT PROJECT (BGD/80/025)
GEAR TYPE
FISHING LOG
LOCAL TIME LATITUDE AND LONGITUDE
TIME SHOT TIME HAULED DIRECTION BOTTOM FISHING
POSITION OF SHOOTING DEPTH (m) DEPTH (m)
0 s I H s I H ~
IN I 0 I
E
DECCA Readings Shooting
I SAMPLE I I BASKETS
R G p
I TOTAL ( I BASRETS COMPOSITION OF TOTAL CATCH
SPEC I E·S CODE NUMBER WEIGHT (<g) SPECIES
REMARK·S: (DETAILS OF GEAR DAMAGE ETC.)
SCIENTIST 1/C ·····-························--···········-···········-··········
I DAY MON"TH
I YEAR
CRUISE NUMBER
STATION NUMBER
SURVEY POSITION NUMBER
POSITION OF HAULING DJ STANCE TRAVELLED N.M.
0 1
N l I 0
E
DECCA Readings Hauling
R G
HAUL VALIDITY
FOR VALID HAUL ENTER 1 FOR NON-VAL.ID HAUL ENTER 0
CODE NUMBER WEIGHT (kg)
~ L
p

MARINE FISHERIES RESEARCH, MANAGEMENT AND DEVELOPMENT PROJECT (BGD/80/025)
CM TICK
0 0
1 2
2 4
3 6
4 8
5 0
6 2
7 4
8 6
9 s
0 0
1 2
2 4
3 6
4 8
5 0
s 2
7 4
8 6
9 8
0 0
, 2
2 4
3 6
4 8
5 0
6 2
7 4
8 6
9 8
0 0
, 2
2 4
3 s ·4 8
5 0
6 2
7 4
8 6
9 8
0 0
TOTAL CATCH OF THIS SPECIES
SPECIES
SPECIES CODE
LENGTH FREQUENCY SHEET
CM
TOTAL
MPLE I ME UNITS OTAL CATCH)
TICK co SP~
STATION NUMBER
DAY MON YEAR
DATE
TOTAL
.
MARINE FISHERIES RESEARCH, MANAGEMENT AND DEVELOPMENT PROJECT (BGD/80/025)
SPECIES
CRUISE I NUMBER
~ ~
FISH LENGTH WEIGHT No. (mml (g)
1
2
3
4
5
6
7
8
9
10
11
12
13
14
15
16
17
18
19
20
21
22
23
24
25
26
27
28
29
30
BIOLOGICAL SAMPLING SHEET
STATION NUMBER
SEX M.or F MA.TURllY
VESSEL NAME
AGE
SCIENTIST l/C ..••..•••••..•.....•.••.•••.••...••• ._ ........................... .
HAUL NUMBER
sheet of -··------------------------- -------------------------~
REMARKS
DATE SAMPLED
.·•