Fiscal Windfall Curse - unifr.ch
42
7795 2019 August 2019 Fiscal Windfall Curse Simon Berset, Mark Schelker
Transcript of Fiscal Windfall Curse - unifr.ch

7795 2019
August 2019
Fiscal Windfall Curse Simon Berset, Mark Schelker

Impressum:
CESifo Working Papers ISSN 2364-1428 (electronic version) Publisher and distributor: Munich Society for the Promotion of Economic Research - CESifo GmbH The international platform of Ludwigs-Maximilians University’s Center for Economic Studies and the ifo Institute Poschingerstr. 5, 81679 Munich, Germany Telephone +49 (0)89 2180-2740, Telefax +49 (0)89 2180-17845, email [email protected] Editor: Clemens Fuest www.cesifo-group.org/wp
An electronic version of the paper may be downloaded · from the SSRN website: www.SSRN.com · from the RePEc website: www.RePEc.org · from the CESifo website: www.CESifo-group.org/wp

CESifo Working Paper No. 7795 Category 1: Public Finance
Fiscal Windfall Curse
Abstract We study the impact of a one-off exogenous fiscal windfall on local public finances in the canton of Zurich in Switzerland. The windfall was due to the IPO of Glencore on the London Stock Exchange in 2011. As a result, its CEO paid an extraordinary tax bill of approximately CHF 360 million. About CHF 238 million of that extra tax revenue entered the municipal resource equalization scheme and rained down on the municipalities of the canton of Zurich. This quasi-experimental setup and our unusually rich dataset allow us to estimate the causal effect of this one-off windfall on all municipal accounting positions. We show that it triggered large expenditure increases targeting particular groups (e.g., salaries of public employees) at the same time as general tax cuts and user charge hikes (e.g., nursing home fees). The resulting imbalances caused a 7.5-fold increase in gross debt relative to the windfall. This massive overreaction hints at a substantial fiscal windfall curse.
JEL-Codes: D700, H110, H710, H720.
Keywords: local public finance, fiscal windfalls, fiscal policy.
Simon Berset
Department of Economics University of Fribourg
Boulevard de Pérolles 90 Switzerland – 1700 Fribourg
Mark Schelker Department of Economics
University of Fribourg Boulevard de Pérolles 90
Switzerland – 1700 Fribourg [email protected]
August 2019 We would like to thank Gerald Hosp for the discussions leading to this research project. We thank the Statistisches Amt and the Gemeindeamt of the canton of Zurich for answering our numerous questions efficiently as well as for their invaluable help in our data collection. We benefited from comments by James Alt, Désirée Christofzik, Christelle Dumas, Reiner Eichenberger, Jeff Frieden, Bruno Frey, Emma Galli, Roland Hodler, Martin Huber, Torben Iversen, Santiago Lago-Peñas, Simon Lüchinger, Thierry Madiès, Raphael Parchet, Paul Raschky, Stephan Schneider, Andrei Shleifer, Benno Torgler, Vera Troeger, Rick van der Ploeg, and seminar participants at Monash University, QUT, ZEW Mannheim, University of Lucerne, PEARL Workshop, the annual meetings of the Society of Institutional and Organizational Economics, the European Public Choice Society, the European Political Science Association, and the Beyond Basic Questions Workshop. The Online Appendix is available on our website: www.unifr.ch/ecopub/en/research/

2
1. Introduction
Little is known about how a one-off fiscal windfall gain affects public finances in an advanced
democracy. Some studies analyze natural resource windfalls in democratic countries like Brazil
or Norway (e.g., Caselli & Michaels, 2013; Borge, Parmer, & Torvik, 2015), but these windfalls
are recurring and they change the income and consumption path in a jurisdiction. A non-
recurring windfall leaves all other factors unchanged, which makes it an almost ideal setting to
analyze fiscal behavior. Our empirical study uses variation in Switzerland, a country with strong
democratic institutions, generally good governance, and little corruption.
We analyze a unique quasi-experimental setup, in which an exogenous one-off fiscal windfall
temporarily relaxed the budget constraint of local jurisdictions of the canton of Zurich in
Switzerland. This allows us to estimate the causal effect of a temporal relaxation of the budget
constraint on fiscal policy. It is an interesting setup because the shock allowed policy makers
to allocate additional resources. The windfall did not change any structural parameters: the
shock was transitory and orthogonal to local circumstances. These characteristics simplify the
empirical analysis to uncover causal effects.
The windfall has its origin in the flotation of Glencore, a large, multinational, commodity
trading and mining company, at the London Stock Exchange. The initial public offering (IPO)
in 2011 enabled Glencore to raise about USD 10 billion of capital (LSEG, 2011). With this
transaction, the CEO of Glencore, Mr. Ivan Glasenberg, joined the Forbes’ list of billionaires
(Forbes, 2019). For Mr. Glasenberg, the IPO also resulted in an extraordinary tax bill of
approximately CHF 360 million (about USD 395 million in May 2011) from the canton of
Zurich and his residential municipality of Rüschlikon on the shores of Lake Zurich (Hotz,
2013a). About CHF 238 million of these extra tax revenues were redistributed to the
municipalities of the canton through a predetermined, rule-based fiscal equalization scheme.
The remaining extra tax revenues entered the budget of the canton and the municipality of
Rüschlikon. The induced equalization transfers were large enough to matter (about CHF 1
million on average), but small enough (maximum 4.70% of the annual current expenditures) to
prevent dramatic or easily observable shifts in local public finances in a particular year. These
extra transfers to the municipalities of the canton of Zurich constitute our fiscal windfall.
Given the transitory nature of this one-off windfall, we can rule out—ceteris paribus—
permanent structural changes in local tax revenue flows. In contrast, other windfalls, such as
natural resource windfalls, also change expected future tax revenues. Therefore, the Glencore

3
windfall provides a remarkable quasi-experimental setup to shed light on the impact of a
positive transitory fiscal shock on local jurisdictions in a high-quality institutional environment.
We assemble a rich dataset containing detailed and disaggregated municipal accounting
information between 2008 and 2016. This allows us to track the impact of the windfall to
specific subaccounts and to uncover potential restructuring of public finances. We know when
the transfer occurred and when the first information on the equalization transfers were
published. We measure the windfall for each municipality and we are able to control for all
relevant local parameters that determine the relative size of the windfall. Finally, we also
dispose of the necessary information to separate the effect of the windfall from the potential
impact of other transfers. This information allows us to estimate the causal effect of the
Glencore windfall on a large number of disaggregated public finance outcomes.
In our empirical investigation, we observe relatively large persistent adjustments of current
revenues and expenditures. On the expenditure side, we find a significant increase in personnel
expenses (between CHF +0.5 and +0.9 per CHF 1 windfall annually), subsidies to local public
entities as well as private individuals (between CHF +0.6 and +0.9 per CHF 1 windfall
annually), and third-party services (about CHF +0.2 per CHF 1 windfall annually). On the
revenue side, we document significant persistent reductions in personal and corporate income
tax revenues (CHF -0.7 per CHF 1 windfall annually), but increases in user charges and fees
(CHF +0.6 per CHF 1 windfall annually). These adjustments immediately lead to the
deterioration of the current balance, and, due to the persistent nature of most adjustments, to
the accumulation of significant public debt (CHF +7.5 of gross debt per CHF 1 windfall). We
do not only find a massive overreaction relative to the size of the windfall, but also permanent
restructuring of public expenditures and revenues.
These large adjustments led to an estimated total increase of about CHF 1.1 billion in gross
municipal debt in our sample of municipalities. This looks coherent with a look at aggregate
debt figures. The increase in public debt, starting in 2013, reversed an overall declining trend
in municipal debt that happened over the 15 previous years. However, the increase in gross debt
could be absorbed fairly easily, as municipalities, on average, featured large negative net debt
(i.e., non-administrative assets are higher than the stock of liabilities) and the economic
situation in the relevant period was rather fortunate. Overall, interest rates for municipal debt
were close to zero and remained there over the relevant period.
Theoretically, there is no unique optimal, or unambiguously predicted, policy response to such
a one-off windfall. We can derive predictions from standard normative models of public
4
finance. Under the permanent income hypothesis—assuming full information and a benevolent
social planner—an extraordinary transitory revenue shock should be smoothed (Barro, 1979).
In equilibrium, a positive (negative) transitory shock should affect capital accounts through the
incurred surpluses (deficits), while tax rates and current expenditures only react incrementally.
From this perspective, our transitory fiscal windfall is equivalent to a transitory positive shock
to taxable incomes, and hence, current revenues. Seen as a revenue management problem (e.g.,
van der Ploeg & Venables, 2011; Cherif & Hasanov, 2013), we could reformulate the problem
as one in which local governments seek to transform an extraordinary one-off revenue into a
continuous flow of income. Here, the municipalities should either invest in projects and assets
with positive net present value, or decrease the stock of debt and reduce future debt service. In
neither tradition should we expect large permanent adjustments to current expenditures or
revenues, large shifts across different spending and revenue categories, or substantial changes
going beyond the actual revenue shock.
From the patterns of our empirical results, a politico-economic interpretation seems more likely.
Besides the general tax cuts, the increases in public spending targeted the interest groups closest
to local politicians and administrators. The largest expenditure increase benefited local public
employees, the second largest raised subsidies to private individuals (e.g., subsidies to local
sports clubs, cultural associations, etc.). These reactions are coherent with the institutional and
politico-economic realities at the municipal level in the canton of Zurich.
Therefore, we propose a politico-economic interpretation in which politicians want to appeal to
the electorate at large (e.g., tax payers) and provide rents to well-organized interest groups (e.g.,
local public employees). We code all public accounts with respect to who is affected through
transactions in these accounts (large vs. small, organized vs. unorganized groups) and how well-
informed citizens are about such transaction (media coverage and individual perceptibility of
transactions). Our empirical results point to an interpretation in which politicians target the
large, but unorganized group of taxpayers with highly mediatized and immediately perceptible
tax cuts. They also target well-organized interest groups (e.g., local employees and private
individuals) with benefits that are directly visible to the recipients, but remain generally hidden
due to a lack of media coverage. Through the induced imbalances and the accumulation of
public debt, taxpayers are finally burdened with the cost of such public policies.
Our study contributes and relates to two strands of the economic literature. First, it relates to
the traditional literature on intergovernmental transfers and the flypaper effect (e.g., Henderson,
1968; Gramlich, 1969; Courant, Gramlich, & Rubinfeld, 1979; Hines & Thaler, 1995; Bailey

5
& Connolly, 1998; Persson & Tabellini, 2000; Inman, 2009; Allers & Vermeulen, 2016; Vegh
& Vuletin, 2016; Leduc & Wilson, 2017). This literature builds around the puzzling evidence
showing that vertical grants have a larger stimulatory effect on public spending than an
equivalent increase in the disposable income of local residents. However, our study reveals a
stimulatory effect that goes much beyond the imbalances documented in this literature.
Second, our study of a fiscal windfall relates to the large literature about the impact of natural
resource windfalls. This literature provides evidence that natural resource windfalls can cause
a resource curse. Countries experiencing a natural resources boom tend to save and invest too
little, suffer more from corruption, and show lower levels of economic growth (e.g., Hodler,
2006; Bhattacharyya & Hodler, 2010; van der Ploeg, 2011; Caselli & Michaels, 2013; Borge et
al., 2015). In contrast to the discovery of natural resources that produce long-lasting windfalls
and recurring income flows, our shock is only temporary and non-recurring. While natural
resource windfalls are often studied in developing economies with weak institutions, our
empirical setting takes place in a highly developed country with a reputation for high-quality
political institutions. Despite these differences, we find similarities in the outcomes. Even with
only a transitory windfall and high-quality fiscal institutions, our results point in the direction
of the resource curse. We term it the “fiscal windfall curse” and acknowledge that even strong
fiscal institutions are not able to avoid it.
The rest of the article is structured as followed. In section 2, we describe the policy experiment.
We explain how the Glencore windfall emerges and how it enters the municipal accounts, how
we compute a municipality-specific measure of this windfall, and how the institutional
environment looks at the local level. In section 3, we introduce our dataset and discuss the
empirical strategy and identification. In section 4, we present our main results and discuss a
series of robustness checks. In section 5, we provide potential interpretations of the observed
reaction to the windfall. We confront our results with the theoretical predictions of different
models and propose a politico-economic narrative for the observed patterns. Section 6 discusses
open questions and avenues for follow-up research. Sections 7 concludes.
2. From going public to public accounts
2.1. The Glencore windfall
In May 2011, the IPO of Glencore on the London Stock Exchange raised USD 10 billion.
Glencore reached a market capitalization of about USD 59 billion (LSEG, 2011; Wachman,

6
2011) and the transaction became one of the largest IPOs in the history of the London Stock
Exchange. Mr. Glasenberg, its CEO, held about 16% of the shares, valued at approximately
USD 8.3 billion (Zaki, 2011). He joined the Forbes’ list of billionaires and is still listed today
with an estimated net worth of USD 7.3 billion (Forbes, 2019). As a resident and taxpayer of
the municipality of Rüschlikon (about 5500 inhabitants) in the canton of Zurich, Mr.
Glasenberg paid an extraordinary total tax bill of about CHF 360 million of cantonal and
municipal income taxes for fiscal year 2011 (Hotz, 2013a), of which about CHF 160 million
went to the municipality of Rüschlikon (e.g., Baumann, 2012; Schraner, 2012).1
Out of these CHF 160 million local income tax revenue that Rüschlikon received from Mr.
Glasenberg, about CHF 136 million were redistributed to other municipalities through the
cantonal resource equalization scheme. Due to the IPO and the mechanics of the equalization
scheme, the canton of Zurich had to contribute an additional CHF 100 million to the
equalization scheme (Regierungsrat des Kantons Zürich, 2016, p. 96). The equalization
transfers were paid out to the municipalities in 2013, however, the actual amounts were known
already in February 2012 (Schraner, 2012). While the municipality-specific equalization
transfers usually evolve quite stably, the extraordinary inflow increased transfers substantially
in 2013, and then returned to its normal path right after. This temporary variation constitutes
our windfall.
2.2. Measuring the windfall
The municipal resource equalization scheme in the canton of Zurich is a rule-based
redistributive instrument.2 The equalization rules define the transfers to be paid and received
by each municipality according to its tax capacity and other parameters. In general, richer
municipalities redistribute resources to poorer ones, but the rule does not require that the total
transfers to poor municipalities correspond to the total contribution payed by the rich. Resulting
differences are financed by the canton. The transfers are unconditional.
The municipality-specific transfers (positive for poor municipalities, negative for rich
municipalities) are calculated on a yearly basis and depend on only three parameters. The key
parameter is the municipal tax capacity per capita that measures the municipal tax base. It is
1 In the case of Mr. Glasenberg, there is no official information available on the exact sources of income that have been taxed. Allegedly, some partners were promised extraordinary and large dividend payments (Wachtel, 2011), and, as has to be assumed, there was the issue of pre-emptive rights. Both sources of income are taxed under the Swiss tax code. 2 For details on and an evaluation of the municipal equalization scheme of the canton of Zurich, see Gulde and Hubler (2015) and Mauchle and Schaltegger (2018).

7
used to rank all municipalities from poorest (low tax capacity) to richest (high tax capacity) and
to calculate the average tax capacity in the canton. Municipalities with a tax capacity below
95% of the cantonal average receive transfers from municipalities above 110% of that same
average. Municipalities in between the two thresholds neither pay nor receive transfers (Gulde
& Hubler, 2015). The other parameters are the tax multiplier (only relevant for the
beneficiaries) and the population size. The tax multiplier is set at the local level. It is a surcharge
on the tax schedule, which is defined at the cantonal level. Together the local tax multiplier and
the cantonal tax schedule determine how intensively the tax base is exploited.
The amount to be received or paid by each municipality in year t is defined based on the
municipal parameters two years prior, in t–2. The equalization transfers are announced at the
end of t–1, and enter the forecasted municipal budgets. The sudden increase in Rüschlikon’s
tax capacity in 2011 produced an exogenous fiscal shock and resulted in unexpected variations
of the equalization transfers (positive and negative) in 2013. We calculate the windfall of
municipality i as the difference between the observed and the counterfactual (CF) equalization
transfer without the Glencore shock (𝑊𝑊𝑊𝑊𝑊𝑊𝑊𝑊𝑊𝑊𝑊𝑊𝑊𝑊𝑊𝑊𝑖𝑖,2013 = 𝑂𝑂𝑂𝑂𝑂𝑂.𝑇𝑇𝑇𝑇𝑊𝑊𝑊𝑊𝑂𝑂𝑊𝑊𝑇𝑇𝑇𝑇𝑂𝑂𝑖𝑖,2013 −
𝐶𝐶𝐶𝐶.𝑇𝑇𝑇𝑇𝑊𝑊𝑊𝑊𝑂𝑂𝑊𝑊𝑇𝑇𝑇𝑇𝑂𝑂𝑖𝑖,2013).
The construction of counterfactual equalization transfers consists of correcting the equalization
parameters as if the Glencore shock did not hit Rüschlikon, and recalculate accordingly the
entire equalization scheme. The parameter that shocked the equalization scheme in 2013 is the
one-off variation in Rüschlikon’s tax capacity per capita in 2011. It increased form CHF 11’687
in 2010 to CHF 48’366 in 2011 and reverted back to CHF 12’037 in 2012. This increase in the
tax capacity per capita was the result of Mr. Glasenberg’s extraordinary tax bill.3 However, the
exact amount of local income taxes paid by Mr. Glasenberg has never been officially released.
Therefore, we have to rely on an approximation based on our detailed accounting data and
cross-check it against information available from local newspapers and official statements.
After careful consideration, we chose to approximate the counterfactual by the tax capacity per
capita in 2010, a year prior to the shock, which amounts to CHF 11’687. For detailed
information on our calculation of the windfall based on the counterfactual equalization scheme
3 Besides Mr. Glasenberg, other members of the top management team reside in the canton of Zurich and even Rüschlikon (Schraner, 2012). Unfortunately, much less is known about how the IPO affected these people and about potential individual extra tax payments. Our calculation of the windfall is based on the total variation in the tax capacity of Rüschlikon. Therefore, extra tax payments of other individuals residing in Rüschlikon are automatically included. However, it seems that by far the largest part of the variation in the local tax capacity is explained by the extra tax payments of Mr. Glasenberg.

8
as well as graphical representations of the observed and counterfactual transfers, see Online
Appendix OA.1.
Our approximation seems reliable for at least three reasons: First, the 2010 tax capacity per
capita corresponds roughly to the average municipal tax capacity of the five years prior to the
Glencore shock and the values it takes in the years after the shock. Secondly, in absolute terms,
the approximation implies that the IPO induced a CHF 197.5 million increase in Rüschlikon’s
total tax capacity, which corresponds to an increase in local income tax revenues of CHF 156.5
million (based on the local tax multiplier of 79%). This is very close to the estimated CHF 160
million published by local newspapers (Baumann, 2012; Hotz, 2013a). Using even another
method to calculate the extra tax payment, the difference in taxable income between 2010 and
2011 leads to an approximation of the extraordinary tax bill of CHF 159 million. Again, this
estimation is well in line with the CHF 160 million reported by local newspapers. Thirdly, our
calculation of the counterfactual equalization transfers reveals that the Glencore IPO triggered
an extraordinary contribution from the canton to the resource equalization scheme of CHF
102.4 million. This amount is corroborated in a report by the cantonal administration
(Regierungsrat des Kantons Zürich, 2016, p. 96). Therefore, our calculation of the total windfall
amounts to CHF 238.2 million, which includes the extra contributions of Rüschlikon (CHF
135.8 million) as well as the canton (CHF 102.4 million).
We exclude the directly affected municipality of Rüschlikon and the two largest cities of the
canton, Zurich and Winterthur from our analysis, because they are outliers with respect to the
size of the transfers and the fact that they receive additional compensations for their provision
of centralized public goods and services. Moreover, six municipalities are involved in local
amalgamations and we are unable to merge the accounting data for the previous periods.
Therefore, the total windfall that will be used in our analysis amounts to CHF 153.6 million.
The windfall variable is always positive. For relatively poor, recipient municipalities, the
windfall reflects the amount received in addition to the expected regular transfers. For relatively
rich, donor municipalities, the measure corresponds to the amount saved, thanks to
Rüschlikon’s exceptional contribution. Both cases are economically equivalent and correspond
to a relaxation of the municipal budget constraint.
As shown in the summary statistics in Table 1, the average windfall amounts to about CHF 1
million, and it corresponds to 2.95% of current expenditures. Out of the 162 municipalities in
our analysis, 132 received a larger equalization transfer and 23 relatively richer municipalities
saw their annual contribution reduced. Only seven municipalities remained unaffected. With or

9
without the Glencore shock, the tax capacity of those municipalities stood in between the upper
and lower equalization thresholds.
Table 1: Descriptive statistics of the municipality-specific windfall. Obs. Mean
(std. dev.) Min Max
All municipalities
Windfall, in CHF 162 948’415.70 0.00 6’760’142.00 (1’116’087.78) Windfall per capita, in CHF 162 184.60 0.00 227.00 (57.08) Windfall in % of current rev. 162 2.61 0.00 4.00 (0.94) Windfall in % of current exp. 162 2.95 0.00 4.70 (1.07)
Beneficiaries
Windfall, in CHF 132 958’590.89 69’458.00 6’760’142.00 (1’159’860.91) Windfall per capita, in CHF 132 203.09 22.00 227.00 (34.06) Windfall in % of current rev. 132 2.92 0.22 4.00 (0.62) Windfall in % of current exp. 132 3.30 0.26 4.70 (0.72)
Contributors
Windfall, in CHF 23 1’178’667.22 66’270.00 2’824’020.00 (873’580.79) Windfall per capita, in CHF 23 134.70 4.00 149.00 (37.88) Windfall in % of current rev. 23 1.66 0.06 2.94 (0.72) Windfall in % of current exp. 23 1.86 0.06 3.48 (0.80) Note: Summary statistics exclude Rüschlikon, the largest cities of Zürich and Winterthur (both receive additional transfers as they provide additional public goods and services), and 6 municipalities involved in an amalgamation, for which proper data are not available over the entire period.
2.3. Local public finances in the canton of Zurich
The canton of Zurich is the most fiscally decentralized canton in Switzerland. The ratio of local
expenditure relative to the sum of local and cantonal expenditures is about 50%. The
municipalities enjoy great autonomy in the definition of the services and infrastructure they
provide. They are responsible for compulsory education at the primary and secondary school
levels (30% of current expenses), social assistance (15%), and local health services (5%).
Municipalities also provide other public goods and services regarding culture, security,
transportation, and the environment. Finally, infrastructure investments account for a
10
significant share of municipal budgets (on average 15% of total annual expenditures). The
provision of some of those services is subject to cantonal, sometimes even national, standards.
However, the municipalities are far from being simple providers of public services defined by
upper-layer governments.
On the revenue side, municipalities are subject to the equivalence principle. They primarily
finance expenditures with revenues raised through their own taxation of local sources of income
and wealth. On average, about half of the municipal revenues come from the direct taxation of
natural persons’ incomes and firm profits. The overall tax scheme is defined by the canton,
while municipalities decide on a tax multiplier. The second source of municipal revenues is
user charges and fees (18% of current receipts, on average). Unconditional transfers account
for only 10% of municipal current revenues, and transfers with a counterpart for 5% on average.
This makes the municipalities relatively independent of inter-governmental transfers compared
to other local governments worldwide. Municipalities can incur debt. Most local debt today is
through bank lending and only larger cities borrow directly in financial markets. Interest rates
for municipal debt were very low in general and often close to zero. Municipalities are subject
to a credible no-bailout provision, which was upheld by the highest federal court in a famous
ruling in 2003.
The general situation of local public finances in the canton of Zurich can be described as
sustainable. All standard public finance measures indicate that the municipalities are, on
average, well managed and financially stable. They record neither systematic deficits nor
unsustainable levels of public debt, and they have easy access to external financing, primarily
through bank loans. Moreover, their fiscal institutions (fiscal supervision, financial referendum,
direct democracy, etc.) meet high standards and have a reputation of achieving a high degree
of fiscal conservatism (e.g., Feld & Kirchgässner, 2001; Schelker & Eichenberger, 2010).
2.4. Municipal governance
Municipalities are managed by a local administrator and its staff. They are responsible for the
daily operations and they are best acquainted with local circumstances and developments.
Politically, municipalities are governed by the “local council”, which constitutes the executive
and is made up by 5 to 9 members. Local council members are usually part-time politicians.
They rely heavily on local administrators to formulate and implement policies. The legislative

11
organ is the municipal assembly or, in 13 cases, a local parliament.4 With the assistance of the
local administrators, members of the local executive prepare the budget, which has to be
accepted by the municipal assembly or the local parliament, and they execute the budget. They
have important autonomy in running the local administration, make personnel decisions, and
allocate resources within the limits of the budget.
The fiscal supervision is delegated to the local finance commission, comprised of local citizens.
They audit the budget and the accounts, analyze and criticize spending propositions, and they
issue a report and can make amendment propositions in municipal assembly meetings (see
Schelker & Eichenberger, 2010). Municipalities have installed mandatory budget referendums,
which have to be held, as soon as a spending proposition goes beyond a certain threshold. The
thresholds for recurring expenditures vary between CHF 40’000 and CHF 1 million and for
one-off expenditures between CHF 250’000 and CHF 5 million. Changes to the local income
tax multiplier have to be approved by the citizens during the municipal assembly.
Local elections were held in 2014. Most municipalities only elect the local executive, while
citizens constitute the legislative body via municipal assemblies several times a year. Only 13
municipalities elect a local parliament. Parties play a weaker role at the local level and not all
national parties are represented and polarizations is not pronounced. Moreover, municipalities
regularly face the problem of finding sufficient numbers of candidates to fill the required
executive positions. Therefore, political competition is often not intense. Detailed information
at the individual level are not available and we have to abstain from an electoral analysis.
3. Data and identification
3.1. The data
Our dataset contains 162 municipalities, for which we have assembled detailed municipal
accounting data.5 All municipalities use the same accounting model and the same rules apply
during the entire period (Direktion der Justiz und des Innern des Kantons Zürich, 1984).6 Our
main results come from the years centered around the windfall in 2013 and span the period
4 Among the 162 municipalities of our sample, 9 municipalities have a local parliament over the whole period and one municipality introduced a parliament in 2014. 5 In 2013, the canton of Zurich had 171 municipalities. We exclude the large cities of Zurich and Winterthur, as they represent clear outliers (size, population, beneficiaries of particular transfers for agglomerations, etc.). Three amalgamations involving six municipalities took place since 2013. We finally exclude Rüschlikon, the municipality from which the windfall spreads. 6 Online Appendix OA.2 provides an overview of the accounting framework and shows the links between the accounts of current and investment flows and the capital account.

12
from 2008 to 2016. This is also the period for which we have the most detailed and
disaggregated data, containing not only the major accounts (e.g., personnel expenses, tax
receipts, user charges), but also its subaccounts such as salaries of administrative and operating
staff, salaries of teachers, social security contributions, income tax receipts of natural persons
and legal entities, or receipts coming from nursing home and school fees, etc. For the main
accounting categories, data is available back to 2000. These more aggregated categories are
used in a series of robustness checks. We also collected economic, demographic, and socio-
economic variables for the entire period.
3.2. Identification
We are interested in the causal effect of the fiscal windfall on local public finances. This
consists of estimating where the windfall spread in municipal accounts, i.e., which accounts are
affected by the windfall and by how much. Glencore’s IPO and the respective inflow of tax
revenues into the equalization scheme are clearly exogenous to local public finances. Yet, the
redistributive rule of the equalization scheme determining the size of the municipality-specific
windfall is not. The municipality-specific windfall depends on the parameters of the
equalization scheme.7 Therefore, the windfall is exogenous conditional on controlling for these
parameters. In other words, identification hinges on a standard conditional independence
assumption (e.g., Wooldridge, 2002). Specifically, we control for the regular equalization
transfers, which are the direct outcome of three equalization parameters. An advantage of
including the product of said parameters (regular equalization transfers) over including them
individually, is the intuitive public finance interpretation of transfer payments relating them
directly to the budget constraint.
It is important to note that an additional complication must be considered: The equalization rule
relevant for the calculation of the windfall only entered into force in 2012. In this year, the
canton of Zurich implemented a reform aiming at disentangling the tasks between the canton
and its municipalities and to make the transfer flows more transparent (Regierungsrat des
Kantons Zürich, 2016). After the reform in 2012, the equalization transfers were split into three
components: 1) the resource equalization transfers (our main category discussed above), 2) the
demographic equalization transfers, and 3) the topographic equalization transfers. Both latter
transfers are independent of the Glencore IPO and remain unaffected. Fortunately, our detailed
accounting data enable us to fully capture the budgetary implications for the municipalities over
7 For details about the equalization rules and a replication of equalization transfers, see Online Appendix OA.1.
13
the entire period. We observe all actual transfer flows before and after the reform and, hence,
are able to capture all relevant potential changes to the municipal budget constraint. As a result,
our estimations include the sum of all equalization transfers, excluding the windfall in 2013.
Therefore, comparable data is available also for the pre-reform period before 2012.
3.3. Empirical strategy
The Glencore windfall produced a temporary relaxation of the municipal budget constraint in
2013. Given that we focus on the absolute relaxation of the budget constraint, the quantity of
interest is expressed in absolute budgetary terms. Therefore, we specify our regression models
in absolute values (in CHF) and not in terms of elasticities (logs) or per capita values.
The windfall entered the municipal accounts in 2013, but its origin is anterior to the effective
equalization transfers. As planned by the equalization calendar, the official information with
the exact equalization transfers to be paid or received was announced in September 2012 to all
municipalities. However, the municipalities received the information about the estimated
impact of Glencore’s flotation on Rüschlikon and the implication for the equalization scheme
at the latest in early 2012. The first newspaper report on the issue that we found was published
on February 7th, 2012 (Schraner, 2012). It is likely that the municipal executives received
information about potential implications for the equalization transfers even before that date, but
clearly only after the actual IPO in May 2011. As a result, municipalities were clearly able to
fully internalize the windfall for the forecasted 2013 budget, but the windfall could already be
anticipated in the budgetary period of 2012. For this reason, 2012 has to be considered as a
treated period.
The windfall could spread in many accounts, making the number of outcomes plentiful. We
consider all public finance outcomes in the municipal accounting framework (all main
accounting categories and subaccounts).
The regression specification is the following:
𝑌𝑌𝑖𝑖𝑖𝑖𝑗𝑗 = 𝛼𝛼 + � 𝛽𝛽𝜏𝜏𝑊𝑊𝑊𝑊𝑊𝑊𝑊𝑊𝑊𝑊𝑊𝑊𝑊𝑊𝑊𝑊𝑖𝑖,2013+𝜏𝜏
𝜏𝜏=3𝜏𝜏=−1 + 𝜗𝜗𝜗𝜗𝜗𝜗𝜗𝜗𝑊𝑊𝑊𝑊𝑊𝑊𝜗𝜗𝑊𝑊𝜗𝜗𝑊𝑊𝜗𝜗𝑊𝑊 𝜗𝜗𝑇𝑇𝑊𝑊𝑊𝑊𝑂𝑂𝑊𝑊𝑇𝑇𝑇𝑇𝑂𝑂𝑖𝑖𝑖𝑖 + 𝑿𝑿𝑖𝑖𝑖𝑖𝜽𝜽+ 𝜗𝜗𝑖𝑖 + 𝜇𝜇𝑖𝑖 + 𝜖𝜖𝑖𝑖𝑖𝑖,
with the indices i and t referring, respectively, to municipalities and years, and 𝜏𝜏 reflecting the
lag and lead structure of the variable of interest. The index j refers to each accounting variable

14
(𝑌𝑌𝑖𝑖𝑖𝑖𝑗𝑗) considered (38 main accounts and 148 subaccounts). The specification always includes
municipal (𝜗𝜗𝑖𝑖) and time (𝜏𝜏𝑖𝑖) fixed effects.8
The variable 𝑊𝑊𝑊𝑊𝑊𝑊𝑊𝑊𝑊𝑊𝑊𝑊𝑊𝑊𝑊𝑊 measures the Glencore shock as it affects the municipalities of the
canton of Zurich through its impact on the fiscal equalization scheme. This variable is zero for
all years but 2013 when the windfall occurs. The coefficient 𝛽𝛽−1 reflects the impact of the
windfall as it is anticipated in 2012, one year prior to the effective transfer. 𝛽𝛽0 measures the
effect of the windfall in 2013, the year of the effective transfer. To account for a potentially
persistent impact of the windfall, we include lags for 2014 (𝛽𝛽1), 2015 (𝛽𝛽2), and 2016 (𝛽𝛽3). Note
that, when the outcome variable is an accounting stock (assets or liability), the interpretation
differs slightly. Then the coefficients of interest express the cumulative effect of the windfall.
The variable 𝜗𝜗𝜗𝜗𝜗𝜗𝑊𝑊𝑊𝑊𝑊𝑊𝜗𝜗𝑊𝑊𝜗𝜗𝑊𝑊𝜗𝜗𝑊𝑊 𝜗𝜗𝑇𝑇𝑊𝑊𝑊𝑊𝑂𝑂𝑊𝑊𝑇𝑇𝑇𝑇𝑂𝑂𝑖𝑖𝑖𝑖 accounts for the regular (counterfactual) equalization
transfer and is necessary for the causal identification of the windfall effect. As discussed in the
previous section, it includes the resource equalization transfers (net of the windfall) and all
other equalization transfer flows (independent of the Glencore IPO) that might affect the budget
constraint.
With the inclusion of 𝑿𝑿𝑖𝑖𝑖𝑖, we control for a series of other factors that might affect annual
variations in fiscal policy outcomes: First, we account for economic and socio-demographic
municipal characteristics, such as the contemporaneous size of the local population, the share
of young inhabitants (<20), the share of old inhabitants (>65), the unemployment rate, and the
contemporaneous fiscal capacity as a measure of local economic circumstances. Second, we
add the revenue from the property gains tax. This revenue comes from private transactions on
the real estate market, which are extremely difficult to forecast, can be subject to large annual
variations, and can provide substantial additional fiscal income. Importantly, the tax rate on
such transactions is fixed by the canton and is, thus, not a local policy variable. Neither do we
expect, nor do we observe this variable to affect our point estimates. However, the inclusion
affects precision and we want to make sure that such flows are captured in our regressions.
Third, the reform of the allocation of tasks between the canton and the municipalities in 2012
also affected a small number of accounting outcomes. The reform aimed at disentangling some
financial flows between the canton and its municipalities related to the (joint) production of
public goods and services. As discussed before, these changes are well documented and affect
8 Municipal time trends are not included in the main estimations because of the short time frame (2008–2016). They are introduced in the specification that considers the longer period 2000–2016.
15
municipalities primarily through transfer flows (Regierungsrat des Kantons Zürich, 2016).9 As
a result, we control for the municipal compensations and subsidies with counterparts to and
from the canton, and we control for the potential outsourcing of municipal tasks to associations
of municipalities, with the municipal compensations and subsidies to and from other
municipalities and associations of municipalities. Controlling for these changes allows us to
hold budgetary implications of the reform constant over the analyzed period. As should be noted
upfront, none of the outcomes found to have changed as a reaction to the windfall are affected
by the specific reform of 2012. Appendix Table A1 presents the descriptive statistics of the
major accounts (outcome variables) and of our main control variables.
4. Empirical results: Where does the windfall spread?
As a starting point, we estimate the impact of the windfall on some well-known accounting
aggregates (section 4.1). The advantage of showing regressions on these aggregates is to build
an intuition for the total effect of the windfall on some standard public finance outcomes. It also
helps to illustrate the limitations of this aggregated approach: First, this level of aggregation
does not provide information on how the windfall is actually spent. Second, the effects on the
aggregated outcomes cannot expose shifts across accounts. Third, and more technically, total
revenues and expenditures, i.e., current accounts, include parts of the windfall, as it enters the
current expenditures for the municipalities receiving higher transfers and the current revenues
for those with reductions to their expected payments. Therefore, our main results will focus on
disaggregated accounts in section 4.2.
4.1. Aggregate effects
Table 2 reports the estimated effect of the windfall on current expenditures, current revenues,
current balance, cash flow, net investments, gross debt, and net debt. The first five outcomes
are measures of accounting flows, whereas gross and net debt are accounting stocks.
In column 1, we observe a large increase in current expenditures. For a CHF 1 windfall received
in 2013, the total current expenditures increase by CHF 2.25 in 2012. In other words,
municipalities anticipated the windfall and, right from the start, its impact was already larger
than the transfer was. The effect fades out over time, but persists until 2015. Note that the year
2013 includes reduced equalization transfer payments of 23 municipalities. Column 2
9 We have checked and reconfirmed the relevant changes with the office for municipal affairs of the canton of Zurich (Gemeindeamt des Kantons Zürich).

16
documents that the total current revenues increase in 2012 and 2013. The 2013 effect includes
the entry of the windfall transfers into the accounts of the net-recipient municipalities. With a
large positive effect on current expenditures and overall only small and transitory adjustments
to the total current revenues, the windfall negatively affects the current balance (column 3), as
well as the cash flow (column 4).10 Regarding net investment expenditures (column 5), the
estimation reveals a delayed adjustment with a significant increase only in 2016. In addition,
the windfall significantly affects accounting stocks over time. In 2016, the cumulated effect of
the windfall amounts to CHF 7.45 per CHF 1 of windfall on gross debt,11 and CHF 7.13 on net
debt.12
Table 2: Impact on accounting aggregates. (1) (2) (3) (4) (5) (6) (7) Current
expend. Current revenue
Current balance
Cash flow
Net investment
Gross debt
Net debt
Windfall2012 2.245*** 0.805 -0.945** -0.600 0.327 -0.0956 0.794 (𝛽𝛽−1) (0.526) (0.622) (0.414) (0.449) (0.497) (2.035) (1.752) Windfall2013 1.877*** 0.824* -0.586 -0.985** 0.196 0.818 2.984 (𝛽𝛽0) (0.493) (0.490) (0.529) (0.485) (0.425) (2.164) (2.043) Windfall2014 2.032*** 0.148 -1.204** -1.657*** 0.0873 2.551 4.975** (𝛽𝛽1) (0.500) (0.540) (0.514) (0.501) (0.478) (2.456) (2.151) Windfall2015 1.264** -0.166 -0.595 -0.913* 0.477 4.076 6.167** (𝛽𝛽2) (0.611) (0.626) (0.588) (0.549) (0.516) (2.736) (2.451) Windfall2016 0.150 -0.369 0.0615 -0.176 1.489* 7.454** 7.130** (𝛽𝛽3) (0.659) (0.790) (0.730) (0.705) (0.798) (3.651) (3.035)
Controls Yes Yes Yes Yes Yes Yes Yes Municipal FE Yes Yes Yes Yes Yes Yes Yes Year FE Yes Yes Yes Yes Yes Yes Yes
Observations 1458 1458 1458 1458 1458 1458 1458 Municipalities 162 162 162 162 162 162 162 R2 0.872 0.868 0.638 0.640 0.126 0.221 0.347
Standard errors are clustered at the municipality level and are reported in parentheses. * p < 0.10, ** p < 0.05, *** p < 0.01.
4.2. Analyzing disaggregated effects
Analyzing large aggregates only uncovers the net effects of various potential operations in the
underlying accounts. Our data, in contrast, reveal in detail where the windfall spread. Therefore,
10 Cash flow = current balance – depreciations. The cash flow is also known as “self-financing.” 11 Gross debt = short-term debt + medium-term debt + long-term debt + commitments toward other entities. 12 Net debt = total stock of liabilities – non-administrative assets.
17
we run our regression model on all outcomes reported in the relevant accounts and
subaccounts.13 In the following series of graphs, we report a selection of estimated coefficients
and the associated 95% confidence intervals. We report results that are not only statistically
significant but also economically relevant (e.g., McCloskey & Ziliak, 1996; Amrhein,
Greenland, & McShane, 2019). The results of all outcomes are presented in the Online
Appendix OA.6.
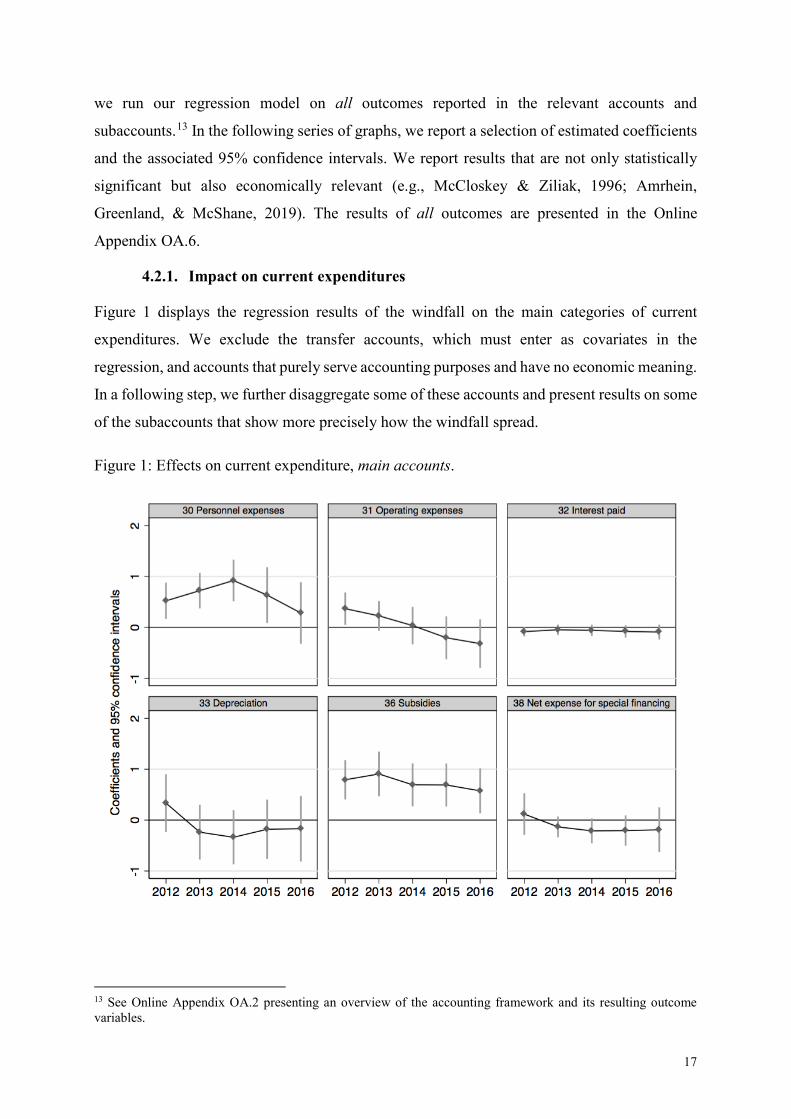
4.2.1. Impact on current expenditures
Figure 1 displays the regression results of the windfall on the main categories of current
expenditures. We exclude the transfer accounts, which must enter as covariates in the
regression, and accounts that purely serve accounting purposes and have no economic meaning.
In a following step, we further disaggregate some of these accounts and present results on some
of the subaccounts that show more precisely how the windfall spread.
Figure 1: Effects on current expenditure, main accounts.
13 See Online Appendix OA.2 presenting an overview of the accounting framework and its resulting outcome variables.

18
The windfall affects mainly three accounting categories (Figure 1): personnel expenses,
operating expenses, and subsidies. Paid interest, depreciations, and the attribution to reserves
(net expense for special financing) seem less (systematically) affected. While the impact on
total operating expenses is only temporary (significant effect in 2012 only), personnel expenses
and subsidies are more strongly and more persistently affected (by up to CHF 0.92 in 2014).
The increase in subsidies remains relatively constant over time, while the adjustment on
personnel expenses fades out after 2015. Considering only these three accounts, the windfall
induces adjustments that exceed its own size. The data permits digging even deeper by looking
at all respective subaccounts, where some interesting patterns emerge.
Figure 2: Effect on current expenditure, subaccounts.
The sizable overall effect on personnel expenses stems mostly from salaries to administrative
and operating staff (Figure 2, upper left). Mechanically, the increases in salaries must also affect
mandatory social welfare contributions (second, upper middle graph). The salaries of teachers
are unaffected (not reported). The effect on salaries does not necessarily mean that
municipalities start hiring new staff. It could also be that employees are able to increase their
workload or move up in the respective salary schedule. Unfortunately, there is no data available

19
to us to separate the two mechanisms. The effect is quite persistent in both cases. On a smaller
scale, temporary compensations and in-kind benefits experience temporary increases (not
reported). But what about the (relative) size of these effects? We have seen that the total
personnel expenses increase by up to 92 cents per 1 CHF of windfall, which corresponds to less
than 10% of total personnel expenses. The size of the effect seems substantial, but remains
within a credible order of magnitude.
Total administrative and operating expenditure in Figure 1 shows a temporary increase in 2012
(CHF 0.37). The analysis of the subaccounts “Water energy fuel” and “Third party services and
fees” in Figure 2 reveals restructuration in this spending category. The increase in 2012 is driven
by a temporary increase in energy expenditure. The remaining part of the total effect comes
from an increase in third-party services (e.g., consultancy fees, office or supervisory work
performed by third parties). The windfall not only induced a temporary adjustment in the total
administrative expenses, but it affected more persistently the structure of this spending
category.
Figure 1 shows permanent increases in total subsidies (about CHF 0.73 annually, on average).
Figure 2 reveals that these additional subsidies go mostly to local public companies14 (about
CHF 0.35) and private individuals (about CHF 0.36, on average). For a typical municipality,
local public companies are the industrial services (water, electricity, waste disposal) or nursing
homes. These entities see their subsidies increase permanently over the treated period.
Subsidies to private individuals cover a wide range of different types of transfers. They can
include, for instance, individual support and study grants, culture, sports, public health, or social
welfare expenditures. Evaluated against the average subsidy payments of CHF 9.9 million per
year (Table A1), the increase due to the windfall amounts to about 7% of total subsidies
disbursed.
In conclusion, the estimated effects of the windfall on current expenditures reveal three main
patterns: First, adjustments take place where municipalities have flexibility in the short run.
Second, the response to the windfall is not limited to the year of the actual transfers. The
windfall is anticipated and many adjustments are persistent. Third, our results show a massive
overreaction to the windfall. Considering only the significant estimates of the expenditure-side
14 “Own” public companies are companies, establishments, or institutions owned by the municipality, or with governing bodies directly appointed by local authorities.

20
of the current account, a CHF 1 windfall induced—as early as 2012—a CHF 1.69 increase in
current spending, which accumulated to about CHF 6.84 in the observed period until 2016.
4.2.2. Impact on current revenues
The estimation of the effect on total current revenue (Table 2) does not point toward large
significant adjustments. However, the focus on disaggregated outcomes provides a very
different picture. The windfall affects mainly two categories: tax receipts and user charges and
fees (Figure 3). These are exactly the accounts where municipal autonomy is highest. The three
upper graphs show the effect on taxes in total (upper left), and two respective subaccounts
“Regular tax revenues” (upper middle) and “Other tax revenues (403+404+406)” (upper right).
The significant permanent decrease in total taxes amounts to approximately CHF 0.71 annually.
The effect comes exclusively from reductions in regular municipal income and profit taxes and
not from other fiscal revenues such as the taxation of property transactions. The tax reduction
reflects the direct redistribution of the windfall to taxpayers. The relative size of the induced
tax cut is approximately equivalent to an average reduction of 3% of total tax revenues.
Figure 3: Effect on current revenue, main and subaccounts.
Main accounts Subaccounts

21
In stark contrast to the permanent tax reductions are the permanent increases in user charges
(Figure 3, lower left). The size of the effect is slightly smaller and comes from two specific
subaccounts, nursing home fees (lower middle) and school fees (lower right). However, in
comparison to the increases in nursing home fees (CHF 0.40) the increase in school fees is
negligible. Everything else being equal, this translates into an increase in the pricing for those
services. In relative terms, this increase amounts to about 4.6% of total revenues form user
charges and fees. Other types of user charges (replacement contributions, administrative fees,
and use and maintenance fees, fines) do not display particular patterns. Only the subaccount
“third-party refunds” increases slightly. This subaccount reflects, among other flows, the
payroll deductions for social insurance, which is fully aligned with the increase in personnel
expenses. Municipalities enjoy much less autonomy in the definition of other sources of fiscal
revenue. It is therefore no surprise that they remain largely unaffected.
Part of the adjustments on the revenue side of the current account reinforces the observed
overreaction to the windfall. In addition to the increase of several current spending categories,
municipalities gave tax cuts. The resulting imbalance of the current account is partially
mitigated by compensating measures: decreases in some administrative and operating
expenditures and increases in particular user charges. This explains why the effect on the
current balance (Table 2) does not entirely mirror the expenditure increases and tax cuts.
4.2.3. Impact on investment accounts
As far as the investment flows are concerned, the windfall does not produce many relevant or
significant adjustments. This is true for both administrative and non-administrative
investments.15 For administrative assets, the result is not surprising given the longer decision-
making process regarding municipal investments. The decision to undertake new investments
is usually subject to several prerequisites (e.g., preliminary studies, financial planning, etc.).
Ultimately, it can even necessitate passing the projects in a local ballot. An impact on these
investments is only observed in the last treatment period. The estimated effect on the total net
administrative investment (Table 2, column 5) shows a significant and large positive effect in
2016 (CHF 1.49). Yet, the analysis of the subaccounts reveals only two significant
15 The accounting model of the canton of Zurich’s municipalities distinguishes investments in administrative and non-administrative assets. Administrative assets are assets necessary for the provision of public goods and services (e.g., school buildings, traffic infrastructures, etc.). Non-administrative assets serve no public purpose. They can be sold without affecting public goods provision (e.g., real estate properties serving commercial purposes, participations in private companies, etc.).
22
adjustments:16 A persistent small increase (about CHF 0.05) in investment subsidies to private
institutions (e.g., cultural institutions, sports facilities, etc.), and a slightly larger positive effect
on investment planning expenditures (about CHF 0.08). The few significant adjustments in the
subaccounts indicate that, while the total investment tends to increase, there is no systematic
uniform reaction of investment strategies among municipalities.
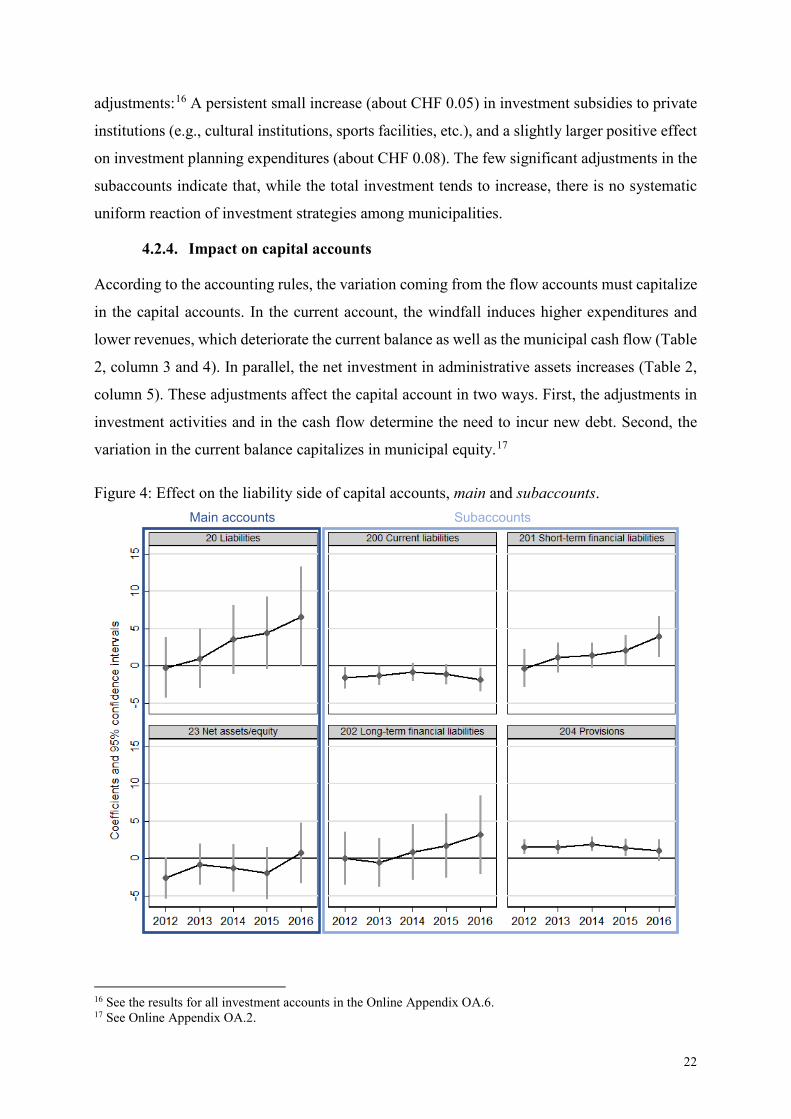
4.2.4. Impact on capital accounts
According to the accounting rules, the variation coming from the flow accounts must capitalize
in the capital accounts. In the current account, the windfall induces higher expenditures and
lower revenues, which deteriorate the current balance as well as the municipal cash flow (Table
2, column 3 and 4). In parallel, the net investment in administrative assets increases (Table 2,
column 5). These adjustments affect the capital account in two ways. First, the adjustments in
investment activities and in the cash flow determine the need to incur new debt. Second, the
variation in the current balance capitalizes in municipal equity.17
Figure 4: Effect on the liability side of capital accounts, main and subaccounts.
16 See the results for all investment accounts in the Online Appendix OA.6. 17 See Online Appendix OA.2.
Main accounts Subaccounts

23
Figure 4 provides insights on how the liabilities side of the capital account is affected by the
windfall. Between 2012 and 2016, total liabilities increase to CHF 6.58. This large expansion
comes mostly from the accounts that compose the gross debt aggregates, i.e., short and long-
term financial liabilities (CHF 3.91 and CHF 3.19, respectively), and liabilities toward other
entities (CHF 0.36, not reported). The decrease in current liabilities modestly mitigates the
increase in the total stock of liabilities. Our results also reveal an increase in provisions of
around CHF 1. Provisions are commitments already fixed but yet unknown in their entirety.
They are usually related to investment activities. The analysis of the asset side provides a
potential rationale for this effect.
The liability side of the capital accounts reveals another important account: net equity.
According to the accounting mechanics, the annual current balance enters the capital account
in the stock of equity, i.e., a municipality’s own capital. Current surpluses increase municipal
equity; deficits decrease it. Between 2012 and 2016, the cumulated effect of the windfall on the
current balance amounts to CHF -3.27 (Table 2). Under a strict ceteris paribus assumption, the
estimated effect on equity should mirror the one on current balance. According to our
estimations, the windfall first decreases the stock of equity, but then converges toward an effect
close to zero (Figure 4). The difference between the current balance and net equity must not
call into question our results. In fact, the equity account can be affected by other operations,
especially accounting operations, some of which might enter the realm of creative accounting.
The analysis of the rest of the capital accounts, as well as our analysis of creative accounting
practices (see section 4.2.5), provides potential explanations for the difference.
The asset side of the municipal account increases by CHF 6.95 by 2016 (not reported). Figure
5 shows how this increase is spread among the different types of assets: the administrative and
non-administrative assets. The effect of the windfall on the total stock of non-administrative
assets is negative but statistically insignificant (Figure 5, upper left graph). The focus on
subaccounts of non-administrative assets reveals some restructuration within the financial
assets (upper middle). We observe a drain in the stock of liquidities (cash and cash equivalents)
of up to CHF -3.04 by 2016, and an increase in financial investments (saving, shares, and loans
as capital investment or real estate) of about +4.50 by 2016. Regarding administrative assets
(Figure 5, lower left graph), the total stock also shows an increasing trend with a significant
cumulated effect of CHF 7.69 in 2016. The trend is particularly marked in the last treatment
period. The effect comes from an increase in tangible administrative assets (CHF 5.85, lower-

24
middle graph), which takes place in 2016. We also observe a one-time CHF 1.25 increase in
loans and financial interests (lower right), but earlier in the period.
Figure 5: Effect on the asset side of capital accounts, main and subaccounts.
The analysis of the asset side of the capital account highlights investment activities that the
variation in the investment flows only partially reveal. In total, it seems that CHF 5.74 is not
explained by variations in flows. A large part of it comes from higher values of administrative
assets (+5.12), the rest from the non-administrative assets (+0.63). They could explain the
difference in equity, and are possibly due to the creation of provisions and “creative
accounting”.
4.2.5. Traces of creative accounting?
The analysis of the capital account tends to point toward the use of “creative” forms of
accounting. Some (legal) accounting manipulations might allow municipalities to hide partially
the imbalances produced by the windfall. Re-evaluation of assets increases municipal equity.
Other accounting operations can affect the balance of the current account. We review three
commonly known accounting tricks (lower accounting depreciations, higher benefits on sale of
assets, and variations in accruals and deferrals of assets and liabilities).
Main accounts Subaccounts

25
Depreciations are monetary expenditures when they correspond to a reimbursement of a debt.
They correspond to pure accounting operations when they only represent the decline in value
of an asset. Higher accounting depreciations reduce the current balance, while lower
depreciations increase it. In Figure 6 (upper left and upper middle) observe an insignificant but
growing trend in compulsory depreciation that reflect the increase in the stock of administrative
assets. More interestingly, depreciation of non-administrative assets and additional depreciation
are decreasing, but the estimated coefficients are not statistically significant.
Figure 6: Traces of creative accounting?
Municipalities can buy and sell administrative assets. They can also transfer administrative
assets to non-administrative assets, and vice versa. This type of operation sometimes implies
value corrections. For instance, when an asset is sold, its book value might not correspond to
the purchasing value. The account “book profit”, on the revenue side of the current account,
supports such differences. In the case of a sale, the profit of a sale of assets is an actual benefit
that matches the inflow of liquidities. However, when assets change from administrative to non-
administrative, the amount that enters the current account is a pure accounting value.
Nonetheless, the operation increases the revenue side and the balance of the current account. It

26
can be neutralized for the current account if an equivalent value is entered in additional
depreciation. Our estimations report traces of such increasing accounting benefits on assets
values.
Our results show several significant positive effects on the account “Book profits” (Figure 6,
upper right). We observe statistically significant coefficients in 2012 (CHF 0.84), 2015 (CH
0.52), and 2016 (CHF 0.34). Interestingly, the origin of these effects remains unclear as an
actual sale of assets should be reflected on the revenue side of the investment accounts. In 2012,
we estimate a slightly larger, but insignificant coefficient in non-administrative sales. The
increase in profits observed in 2012 could be related to that. However, the non-administrative
assets do not show traces of a reduced stock (Figure 5). Also, the effects observed on profits
find no balancing effects that could make accounting benefits neutral to the current balance; for
instance, on the account’s additional depreciation (Figure 6). Overall, “Book profits” contribute
to mitigating the negative effects of the windfall on the current balance. Nonetheless, it is
impossible to conclude firmly that creative accounting practices have been used systematically
by municipalities.
Last but not least, accruals and deferrals of assets and liabilities might provide another
opportunity to influence temporarily the current balance. As it is in private accounting, these
two capital account positions permit reporting revenues and expenses in the economically
relevant period, no matter when the cash receipt or payment actually occurs. Accruals and
deferrals reallocate revenues and expenses across time and can serve different accounting
strategies and potentially allow smoothing of the current balance.
Our estimations on the accruals and deferrals of liabilities find no significant effect and a
coefficient close to zero (Figure 6). However, for accruals and deferrals of assets, our results
show a significant negative effect of CHF -0.56 in 2012, which becomes slightly larger over
time. We cannot distinguish whether the negative effect comes from lower accrual revenues or
lower deferral expenses. However, the implication for the current balance is the same: it
reallocates parts of the current surplus of 2012 to 2013, and similar for the other years. For
example, this adjustment implies that the estimated effect on the 2012 current balance is
overstated (reducing deficits), while the effect on the 2013 current balance, when the windfall
enters, is understated, etc.
27
4.2.6. Summary of the results
Many of the documented effects would have gone unnoticed without the use of econometric
methods and an exploration of the detailed, disaggregated accounting positions. Our empirical
analyses show that municipalities strongly respond to the windfall. Traces of the windfall are
observed in all main accounts. The investment accounts appear to be least affected. In the
current and capital accounts, the windfall triggers large adjustments in current expenditures and
revenues, and induces large effects on assets and liabilities. Some adjustments are temporary,
but many persist over time and capitalize in the stock accounts.
Palliating to the imbalances, municipalities adopt compensation measures. Some drawdowns
increase and some spending categories slightly decrease over time. The windfall induces a
restructuration of many accounting categories. The analysis also documents some traces of
creative accounting practices. Several observed effects seem to serve the purpose of improving
key accounting aggregates, such as the current balance or municipal equity.
More specifically: We document massive increases in public expenditures going more than 6-
fold beyond the size of the windfall. Most of this adjustment comes from persistent increases
of personnel expenses targeting the administrative staff, a temporary increase in operating
expenses, and persistent increases in subsidies to local public entities and private individuals.
On the revenue side, we observe a persistent reduction in income tax revenues, accompanied
by a persistent increase in user charges for nursing home services and smaller ones for school
fees. These policy changes cause a deterioration of the current balance and lead to the
accumulation of substantial public debt in the order of magnitude of about 7.5 times the windfall
and other shifts in the capital accounts.
4.3. Robustness checks
To underpin our empirical results, we conduct a series of robustness checks. First, we check
whether or not our results are solely driven by some influential observation or specific groups
of municipalities. This does not seem to be the case. Secondly, a major advantage of accounting
information is that the estimated effects on accounts and subaccounts must add up according to
some well-specified rules. All of our results conform to these rules. Thirdly, given the large
number of regressions, we need to worry about problems of multiple hypothesis testing. Our
results remain significant, even after adjusting the standard errors for false discovery rates.
Fourthly, we also present results (for the available main accounting categories) using a longer
horizon, which allows us to include municipality-specific time trends, and, finally, we run

28
placebo tests on pre-treatment periods, and evaluate pre-treatment trends. None of these
robustness checks challenge our main insights. The specific result tables and graphs are
reported in the Online Appendix OA.3.
4.3.1. Influential observations and effect heterogeneity
To make sure that our results are not primarily driven by some influential observation or driven
by a particular group of observations, we run a series of robustness checks. First, for each
outcome variable, we run regressions excluding one observation at a time and report the
coefficients with the largest difference to our previous results using the full sample. Table OA.2
of the Online Appendix reports the results including the smallest as well as the largest estimated
windfall coefficient in 2013 for our main outcome variables. The differences are small and our
qualitative results are unaffected. This assessment holds for the effects of the windfall for other
years and other outcome variables (not reported).
Secondly, we consider the relative position of a municipality in the equalization scheme. One
of the two decisive parameters in the equalization scheme is the local per capita tax capacity of
a municipality evaluated against the average tax capacity per capita in the canton. We run
regressions distinguishing the effect of the windfall between richer municipalities (defined as
those municipalities above the equalization cut-off of 110% of average tax capacity and
contributing less to the equalization scheme), and poorer municipalities (defined as those
situating below the equalization cut-off of 95% of average tax capacity and receiving higher
transfers). In general, the effects are very similar, point in the same direction, and are not
significantly different from each other at the 5% level (a summary of important results are
reported in the Online Appendix Figure OA.4). However, the effect of the windfall on
depreciations, subsidies, and user charges show some noteworthy (though generally
insignificant) differences: The effects of the windfall tend to be larger for the richer
municipalities.
Thirdly, the population size is the other decisive parameter of the resource equalization scheme.
We distinguish between municipalities above and below 10’000 inhabitants.18 The effects are
very similar, point in the same direction, and the differences are in general not statistically
significant. However, a larger (but mostly insignificant) difference can be observed for the
effect on personnel expenses and tax revenues (Online Appendix Figure OA.5). As a reaction
18 A total of 26 municipalities situate above the population threshold of 10’000 inhabitants. This threshold is also applied by authorities to grant the status of a city in Switzerland and it typically separates the more urban from the more rural towns.

29
to the windfall, smaller municipalities reduce their taxes by about CHF 1.2 per 1 CHF of
windfall, while larger municipalities reduce it by only about CHF 0.6. Personnel expenses
increase somewhat more strongly in smaller municipalities. The largest difference of the two
effects occurs in the effect in 2014, in which personnel expenses increase by about CHF 1 per
CHF 1 in windfall in larger municipalities, while smaller ones only increase it by about CHF
0.4.
4.3.2. Accounting identities and mechanical impact
Our estimations respect the accounting identities and rules. First, all coefficients add up
according to accounting rules. The estimated coefficients for the main accounting categories
correspond to the sum of the coefficients of their sub-accounts. Similarly, the estimated effects
on the large aggregates match the sum of the individual effects on the components of the
aggregates.
Second, the accounting rules imply that the windfall has a mechanical impact on two specific
accounts. The resource equalization transfers enter into specific municipal accounts the moment
they are effectively received or paid. Municipalities that experienced an increase in equalization
transfers due to the windfall (132 municipalities) received the transfer in the subaccount
“equalization transfers received” on the revenue side of the current accounts. Those
municipalities that pay less than expected find their windfall in a reduced outflow in the
“equalization transfers paid” account on the expenditure side of the current accounts (23
municipalities). If our windfall variable correctly measures the windfall, we should be able to
observe its mechanical impact on the respective accounts and find a 1-to-1 relationship between
the windfall variable and the outcome.
We regress the windfall measure and the relevant control variables on the above-mentioned
accounts (Online Appendix Table OA.3). We obtain close to a 1-to-1 relationship (0.919 and -
0.927). Both estimated coefficients are statistically significant. This further indicates that our
windfall measure isolates the part of the equalization transfers that is due to the Glencore
windfall.
4.3.3. Multiple hypothesis testing
Given that we run regressions on many dependent variables, we conduct multiple hypothesis
tests to control for false discovery rates (FDR). We follow the procedure of sharpened two-
stage q-values described in Anderson (2008) and introduced in Benjamini, Krieger, and
Yekutieli (2006). The tests indicate that our main results are not merely type I errors.

30
Concerning the current accounts, the effects on personnel expenses, subsidies to own
companies, and regular taxes are significant when controlling for FDR at q = 0.10. The same is
true for the compensation effects found in the subaccounts of user charges. Regarding the
outcomes from the capital accounts, the increase in provisions, in non-administrative assets
(financial investments) and in administrative assets (Loans and financial interests) are also
significant at q = 0.10. The impact on the stocks of liquidities, prepaid expenses and accrued
income, and current liabilities only closely miss the threshold.
4.3.4. Longer timeframe and municipal time trends
The most disaggregated accounting data, including subaccounts, are only available since 2008.
However, the available data for the main accounting categories actually cover a longer period.
We replicate our estimations, adding eight additional fiscal years, and obtain very similar results
for a timeframe going from 2000 to 2016 (Online Appendix Figure OA.6).
The extension of the timeframe also allows for introducing municipality-specific time trends.
Even though the introduction of such trends is extremely restrictive and the estimated
coefficients flatten, the main qualitative insights hold (Online Appendix Figure OA.7). We
observe general level effects from the municipality-specific de-trending, but, the relative
dynamics persist. The de-trending of such a short period of time, in which all the variation in
the explanatory variable happens toward the end of the period, can be expected to produce such
level effects. We still observe the relative changes in the accounts when the windfall enters the
decision-making process and hits the municipalities.
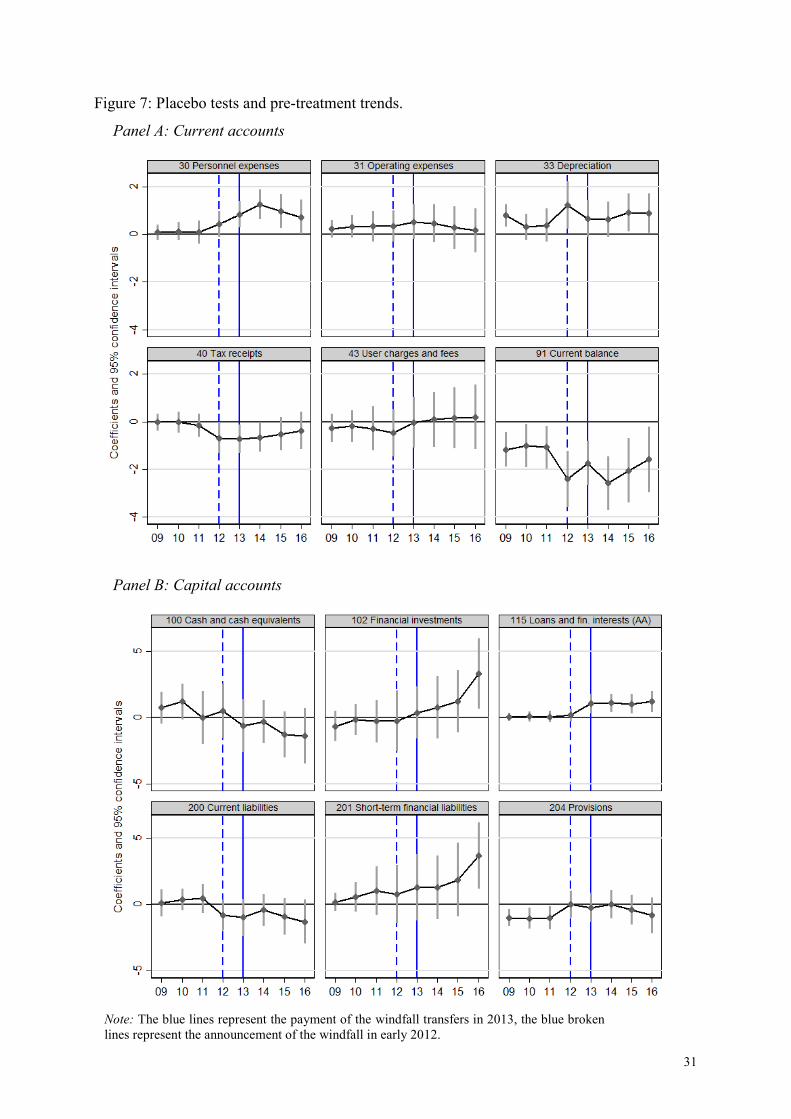
4.3.5. No pre-treatment effects
The extension of the timeframe allows us to evaluate the existence of pre-treatment trends. The
placebo tests consist of simulating the windfall for earlier (placebo) periods. We expect the
windfall to show no significant pre-trends on the outcomes in periods before 2012. Based on
the extended dataset, we introduce three additional leads in our specification and estimate the
impact of the windfall for the placebo periods 2009, 2010, and 2011.
As expected, the results in Figure 7 do not show important pre-trends. Note that there are some
significant differences in levels between those that receive a higher and those that receive a
smaller windfall. However, no important pre-trends are visible and thus, our identifying
assumption of similar pre-treatment trends remains valid. The results mitigate concerns that our
results are merely driven by other factors than the windfall itself.
31
Figure 7: Placebo tests and pre-treatment trends.
Panel A: Current accounts
Panel B: Capital accounts
Note: The blue lines represent the payment of the windfall transfers in 2013, the blue broken lines represent the announcement of the windfall in early 2012.

32
5. Interpretations
Our empirical results are difficult to reconcile with standard public economic theory. Normative
theories relying on the permanent income hypothesis or similar can, in equilibrium,
accommodate incremental increases in current expenditures and revenues and, in the short run,
somewhat larger increases in infrastructure expenditures, while most of the windfall would be
saved (e.g., Barro, 1979; van der Ploeg & Venables, 2011). Our large and permanent increases
in current expenditures, the restructuring of current revenues, and the increase in public debt
are no equilibrium outcomes. Likewise, according to the flypaper effect, intergovernmental
grants can increase the marginal propensity to spend on public goods (e.g., Henderson, 1968;
Gramlich, 1969), but such theories cannot explain the restructuring and the overall size of the
adjustments in our setup.
Given the result patterns, we believe that a politico-economic interpretation is more likely:
politicians want to appeal to the electorate and provide rents to special interests. In line with
such an interpretation, the main results show that the windfall benefited taxpayers through tax
cuts and special interests (foremost local public employees) through increases in current
expenditures.
In the context of the municipalities in the canton of Zurich, two qualification pertaining to local
policymaking have to be discussed. First, electoral competition is often rather unimportant. In
some municipalities it is notoriously hard to find enough candidates. Therefore, winning
elections might not be a very strong motivation. However, politicians face their voters on a
regular basis in municipal assemblies and it remains important to cater to the electorate at large
to pass policy in municipal assemblies. Among other topics, the local tax shifter is regularly
discussed in citizen assemblies and it requires approval by the municipal assembly or by the
local parliament. In line with anecdotal evidence, it is likely that pressure for tax cuts came
directly from the citizens in local assemblies.
Second, local governments are led by elected part-time policymakers and managed primarily
by a local administrator and its staff. Local administrators hold—de facto—very strong
positions, as they run the municipality on a daily basis and are best acquainted with local
circumstances. Local politicians depend heavily on their information and assistance. From this
perspective, local employees are very well organized and have a certain clout over one-off
resources.
33
In Online Appendix OA.4 and OA.5 we provide evidence that these intuitions hold more
generally when considering all accounting outcomes. For this analysis, we categorize all flow
accounts with respect to who they affect and whether or not information on these accounts are
available through local media (for details see Table OA.5). Specifically, we code all
subaccounts on whether changes in them affect a large or a small group, if the affected groups
are likely to be organized or not, whether or not the media report on the specific accounts, and
if transactions in these accounts are easily perceptible by the affected individuals (see Online
Appendix OA.4 and OA.5). Our empirical results indicate that benefits are concentrated in
accounts affecting small and organized groups on which the media tend not to report (Figure
OA.8, upper middle). The large and unorganized group of taxpayers benefits through tax cuts
that the media cover extensively (Figure OA.8, upper left), but are harmed through the induced
imbalances leading to, for example, higher interest payments and other transactions that remain
below the radar of the media and which are not easily perceptible (Figure OA.8 upper right and
lower left).
Other interpretations seem less likely: One view holds that voters might have had a biased
perception of the windfall. While the media reported extensively on the total amount of the
extraordinary tax revenue from Mr. Glasenberg (CHF 360 million), the specific implications
for each municipality were much less covered. If voters overestimated the actual windfall
received by their local municipality, overspending of the windfall could temporarily occur.
However, the persistence of the observed changes would require that voters also misperceive
the windfall’s temporary nature. Given the significant media coverage and the intense public
discourse following the Glencore windfall, we do not believe that this was likely. The
permanent adjustments in current expenditures and revenues would require additional
assumptions. These could be some form of loss aversion by voters, voter inertia, or forms of
mental accounting (e.g., Hines & Thaler, 1995; Lago-Peñas, 2008), where once granted favors
are difficult to take back.
Another view proposes the creation of a political endowment effect: once the fiscal policy
adjustments resulting from the windfall are chosen by the majority, they become the new status
quo, and a majority of voters would want to stick with it (Alesina & Passarelli, 2015). Apart
from the general tax reductions that might align with the median voter, we would have to
assume further that the windfall induced voters to tilt public expenditures toward small and
narrowly defined groups (local administrative staff), and to target other groups with higher fees

34
(e.g., nursing home fees). Without further assumptions, our results seem inconsistent with such
a model.
6. Open questions
At this point, at least three important questions come to mind: First, do local political
institutions, such as local democracy in the form of citizens’ assemblies and compulsory fiscal
referenda, or local political factors, such as political parties and female politicians, affect the
observed patterns of the windfall? Our preliminary analyses do not suggest large
heterogeneities in the reaction of different municipalities to the windfall. Neither economic or
demographic, nor institutional or political differences substantially affect our overall results.
Further research addresses these questions.
Second, how can municipalities absorb such increases in public debt? Do they have problems
in accessing external financing? It is important to remember that our estimates control for the
underlying economic situation and municipal fixed effects, and that increases in public debt are
relative to the counterfactual situation without the windfall. In this particular period,
municipalities of the canton of Zurich experienced stable conditions and economically
prosperous years. The levels of public debt and the exploitation of the tax base were on average
moderate to low. Municipalities had (and still have) easy access to bank loans at interest rates
close to zero and the few larger cities that issue public debt on capital markets (e.g., the city of
Zurich) feature extremely low yields.19 As documented in Figure 8, gross and net municipal
debt were on a declining trend for most of the 15 previous years and net debt was largely
negative, i.e., non-administrative assets were higher than the stock of liabilities. Figure 8
documents the stabilization and then the reversion of that trend in 2013. The broken lines
provide the counterfactual trends in gross and net debt without the windfall. In this environment
the increases in public debt could be absorbed quite easily and we are not aware of serious
discussions about unsustainable patterns in the evolution of local public debt.
19 We do not have access to systematic data on interest rates on bank loans. However, according to the association of Swiss municipalities (“Schweizerischer Gemeindeverband”) interest rates for 10-year bank loans can be obtained for rates below 1% and anecdotal evidence suggests interest rates as low as 0 to 0.5% in 2016. Examples from the cities of Zurich or Winterthur suggest successful placements of municipal bonds with coupons as low as 0.15%.

35
Figure 8: Trends in municipal gross and net debt, 1995 – 2016
Third, and maybe most important, why do we observe these unsustainable patterns in the
reaction to the windfall, while we do not observe overall imbalances or unsustainable patterns
in general public finances in the canton of Zurich? Or, put differently, if politicians overspend
and redirect resources in response to the windfall, why don’t they do it also with regular revenue
flows and are, hence, in financial difficulty?
Let us mention at the outset that we can only speculate on this question. Our narrative is based
on anecdotal evidence and we are unable to test our conjectures empirically. In normal times,
without large shocks, local public finances are the results of a bargaining process. The local
political process aggregates and weights local preferences, which results in a certain political
equilibrium. Without shocks, this equilibrium remains relatively stable. Political shifts among
interest groups would cause redistribution and be met with resistance of the concerned interests.
Therefore, politicians can fend off new demands by pointing to the redistributional character
and consequences of accepting specific demands and deviations from the political consensus.
However, in times with a highly mediated positive one-off windfall, resources are up to be
distributed and interest groups are mobilized. For example, we have observed the unusual
demand of Christian interest groups to redistribute resources to beneficiaries outside the
municipality: five municipalities held popular ballots or decided in municipal assemblies on
whether or not to donate some of the windfall to charities targeting countries, in which Glencore

36
was active. Even though only minimal sums were finally donated,20 it generated significant
media attention and might have made all interest groups aware of the extra-money to be
distributed.
Strategies to fend off demands on redistributional grounds are, not credible because the windfall
delivers additional resources to be distributed and new demands do not directly hurt established
interests. As a consequence, politicians have difficulty to fend off such demands and engage in
overpromising. They might allocate highly visible and mediated benefits to taxpayers through
tax cuts, and accommodate special interests with transfers where it is least visible. Such patterns
would be well in line with our empirical results.
Given that the windfall was not of enormous magnitude (about 3% of current expenditures),
implementing policy responses remaining below the referendum thresholds was not difficult.
The large imbalances only built up over time due to the discrepancy of the persistent nature of
some responses and the one-off nature of the windfall. So far, there was, to our knowledge, no
awareness of the induced imbalances in the media or in the cantonal administration overseeing
local municipalities. This is not entirely surprising, as the consequences are not obvious when
looking at the numerous public accounts without detailed data and econometric methods. From
this perspective, political strategies according to our narrative would not have caused obvious
negative consequences. Moreover, similar to a rising tide who lifts all boats, yardstick
competition—the comparison with neighboring municipalities—might not have had its usual
effect, because basically all municipalities benefited from this one-off windfall.
7. Conclusion
We investigate how municipalities of the canton of Zurich adjust their fiscal behavior in
response to a temporary fiscal windfall. The windfall itself is exogenous to local public
finances. It has its origin in the IPO of Glencore at the London Stock Exchange. As a result, its
CEO, Ivan Glasenberg, paid a large extraordinary income tax bill to its residential municipality
of Rüschlikon and the canton of Zurich. Most of this extra tax revenue was redistributed to
other municipalities of the canton through the municipal fiscal equalization scheme. We
document the surprising fact that this one-off windfall induced large and persistent imbalances
20 Five municipalities in the region of the Knonauer Amt decided to donate 10% of the windfall to Swiss charities active in countries in which Glencore extracted natural resources (e.g., Hotz, 2013b).

37
to local public finances in a developed country like Switzerland with a reputation for strong
democratic institutions: hence the fiscal windfall curse.
Based on our detailed accounting data, we estimate the causal effect of the relaxation of the
municipal budget constraint on local public finances: The windfall induced increases in
personnel expenses, administrative and operating expenses, and subsidies, and a decrease in
revenues from income taxes, as well as an increase in revenues from user charges. The fiscal
response in the current account by far exceeds the size of the windfall. It deteriorates
persistently the current balance and, over 4 years, increases the stock of gross debt in an order
of magnitude of about 7.5 times the windfall. A rough calculation illustrates the overall effect:
the CHF 154 million fiscal windfall considered in our analyses induced the accumulation of
about CHF 1.1 billion in total gross debt.21 This points to a massive fiscal windfall curse.
We ran a series of robustness checks: all estimated coefficients sum-up according to accounting
rules, the necessary mechanical effects are observed where expected, our results survive tests
addressing multiple hypothesis testing, we do not observe pre-trends in placebo-regressions,
and effect heterogeneity is small.
These results are difficult to reconcile with standard public economic theory. In an explorative
empirical analysis, we show that the observed patterns of the impact of the windfall are well in
line with a simple politico-economic interpretation: Policy makers use the windfall to further
their political interests: they want to appeal to the electorate and target political favors to
specific interest groups. They provide highly mediatized and perceptible benefits to the general
public (most notably and most visibly, income tax cuts). They also provide specific favors to
small and powerful interest groups as long as the recipients immediately perceive the benefits
and public awareness through media coverage remains low. Examples of such strategies are the
increase in personnel expenses, subsidies to local public entities, and to private individuals. The
costs of the politically motivated use of the windfall are concentrated in accounts in which
consequences for individual voters are blurred: they affect all inhabitants in general, and the
effect on individual voters is unspecific and not immediately perceptible (e.g., deficits or
depreciations).
Our findings relate to the large literature analyzing the impact of natural resource windfalls
(e.g., Hodler, 2006; Bhattacharyya & Hodler, 2010; van der Ploeg, 2011; Caselli & Michaels,
2013; Borge et al., 2015). According to this literature, natural resource windfalls can cause a
21 We exclude Rüschlikon, the cities of Zurich and Winterthur, and 6 municipalities involved in an amalgamation.

38
resource curse. In contrast to the more permanent natural resource windfalls in developing
countries, (often) with weak political institutions, the one in our analysis is only temporary and
embedded in a high-quality institutional environment. Despite these facts, our results document
traces of a “curse.”
One important question is how it is possible that a one-off windfall can induce such imbalances,
while local public finances are on a sustainable path in general. In other words, why do we not
observe unsustainable patterns also with regular revenue flows? We argue that the highly
mediatized shock temporarily affected the politico-economic equilibrium and mobilized special
interests. Given that the windfall provided additional resources, politicians might have found it
difficult to fend off new demands on grounds that giving in to these demands had a direct
redistributive effect on other groups. Finally, policymakers were giving highly visible tax cuts
to local taxpayers and targeted special interests with rents where media attention was low.
References
Alesina, A., & Passarelli, F. (2015). Loss Aversion in Politics. National Bureau of Economic Research Working Paper Series, No. 21077.
Allers, M. A., & Vermeulen, W. (2016). Capitalization of equalizing grants and the flypaper effect. Regional Science and Urban Economics, 58, 115-129.
Amrhein, V., Greenland, S., & McShane, B. (2019). Retire statistical significance. Nature, 567, 305-307.
Anderson, M. L. (2008). Multiple Inference and Gender Differences in the Effects of Early Intervention: A Reevaluation of the Abecedarian, Perry Preschool, and Early Training Projects. Journal of the American Statistical Association, 103(484), 1481-1495.
Bailey, S. J., & Connolly, S. (1998). The flypaper effect: Identifying areas for further research. Public Choice, 95(3), 335-361.
Barro, R. J. (1979). On the Determination of the Public Debt. Journal of Political Economy, 87(5), 940-971.
Baumann, R. (2012, March 2). Glencore-Börsengang spülte Ursula Gut 240 Millionen in die Kasse. Tages-Anzeiger, p. 15.
Benjamini, Y., Krieger, A. M., & Yekutieli, D. (2006). Adaptive linear step-up procedures that control the false discovery rate. Biometrika, 93(3), 491-507.
Bhattacharyya, S., & Hodler, R. (2010). Natural resources, democracy and corruption. European Economic Review, 54(4), 608-621.
Borge, L.-E., Parmer, P., & Torvik, R. (2015). Local natural resource curse? Journal of Public Economics, 131, 101-114.
Caselli, F., & Michaels, G. (2013). Do Oil Windfalls Improve Living Standards? Evidence from Brazil. American Economic Journal: Applied Economics, 5(1), 208-238.
Cherif, R., & Hasanov, F. (2013). Oil Exporters’ Dilemma: How Much to Save and How Much to Invest. World Development, 52, 120-131.
Courant, P. N., Gramlich, E. M., & Rubinfeld, D. L. (1979). Public Employee Market Power and the Level of Government Spending. The American Economic Review, 69(5), 806-817.

39
Direktion der Justiz und des Innern des Kantons Zürich. (1984). Handbuch über das Rechnungswesen der zürcherischen Gemeinden. Zürich: Direktion der Justiz und des Innern des Kantons Zürich.
Feld, L. P., & Kirchgässner, G. (2001). The political economy of direct legislation: direct democracy and local decision-making. Economic Policy, 16(33), 331-367.
Forbes (2019). #343 Ivan Glasenberg. Retrieved from https://www.forbes.com/profile/ivan-glasenberg/#4d69332f3d63
Gramlich, E. M. (1969). State and Local Governments and Their Budget Constraint. International Economic Review, 10(2), 163-182.
Gulde, A., & Hubler, U. (2015). Zürcher Finanzausgleich Handbuch. Zürich: Gemeindeamt des Kantons Zürich.
Henderson, J. M. (1968). Local government expenditures: A social welfare analysis. The Review of Economics of Statistics, 50(2), 156-163.
Hines, J. R., & Thaler, R. H. (1995). Anomalies: The Flypaper Effect. The Journal of Economic Perspectives, 9(4), 217-226.
Hodler, R. (2006). The curse of natural resources in fractionalized countries. European Economic Review, 50(6), 1367-1386.
Hotz, S. (2013a, September 18). Glencore-Millionen hinterfragt. Neue Zürcher Zeitung, p. 15. Hotz, S. (2013b, December 12). Säuliämtler sind solidarisch. Neue Zürcher Zeitung, p. 18. Inman, R. P. (2009). Flypaper effect. In Steven N. Durlauf and Lawrence E. Blume (Ed.), The
New Palgrave Dictionary of Economics (pp. 1-6). New York: Palgrave Macmillan. Lago-Peñas, S. (2008). Local Governments' Asymmetric Reactions to Grants:Causes and
Consequences. Public Finance Review, 36(2), 219-242. Leduc, S., & Wilson, D. (2017). Are State Governments Roadblocks to Federal Stimulus?
Evidence on the Flypaper Effect of Highway Grants in the 2009 Recovery Act. American Economic Journal: Economic Policy, 9(2), 253-292.
LSEG (2011, May 24). Glencore raises $10BN in London’s largest ever international IPO. Retrieved from https://www.lseg.com/media-centre/news/corporate-press-releases/glencore-raises-10bn-londons-largest-ever-international
Mauchle, F., & Schaltegger, C. A. (2018). Der Finanzausgleich des Kantons Zürich: Wirkungsanalyse and Reformvorschläge. Bern: Haupt.
McCloskey, D. N., & Ziliak, S. T. (1996). The Standard Error of Regressions. Journal of Economic Literature, 34(1), 97-114.
Persson, T., & Tabellini, G. (2000). Political economics: explaining public policy. Cambridge, MA: The MIT Press.
Regierungsrat des Kantons Zürich. (2016). Gemeinde- und Wirksamkeitsbericht 2017. Zürich. Schelker, M., & Eichenberger, R. (2010). Auditors and fiscal policy: Empirical evidence on a
little big institution. Journal of Comparative Economics, 38(4), 357-380. Schraner, T. (2012, February 7). Rüschlikon zahlt Rekordsumme in Finanzausgleich. Der
Landbote, p. 17. van der Ploeg, F. (2011). Natural Resources: Curse or Blessing? Journal of Economic
Literature, 49(2), 366-420. van der Ploeg, F., & Venables, A. J. (2011). Harnessing Windfall Revenues: Optimal Policies
for Resource-Rich Developing Economies. The Economic Journal, 121(551), 1-30. Vegh, C. A., & Vuletin, G. (2016). Unsticking the Flypaper Effect Using Distortionary
Taxation. National Bureau of Economic Research Working Paper Series, 22304. Wachman, R. (2011, May 18). Glencore valued at £38bn as it reveals its flotation price. The
Guardian. Retrieved from https://www.theguardian.com/business/2011/may/18/glencore-ipo-price-london-flotation

40
Wachtel, K. (2011, May 5). Meet the 5 people who are about to become billionaires from the huge Glencore IPO. Business Insider. Retrieved from https://www.businessinsider.com.au/meet-the-glencore-billionaires-ivan-glasenberg-2011-5
Wooldridge, J. M. (2002). Econometric analysis of cross section and panel data. Cambridge, Mass: MIT Press.
Zaki, M. (2011, June 22). Ivan Glasenberg, le « Magneto » des matières premières. Bilan, p. 18.
Appendix
Table A1: Summary statistics of main accounts and control variables (2008-2016).
Obs. Mean (std. dev.)
Min Max
Main outcome variables: main accounts, in CHF
30 Personnel expenses 1458 9’079’094 335’011 90’047’704 (12’631’607) 31 Operating expenses 1458 6’933’436 403’389 55’197’977 (8’431’378) 36 Subsidies 1458 9’922’005 245’337 88’184’170 (13’086’832) 40 Tax receipts 1458 21’447’016 617’201 165’692’593 (26’722’504) 43 User charges and fees 1458 8’247’316 178’510 67’032’082 (12’610’860) 91 Current balance 1458 704’772 -28’236’428 29’627’691 (3’399’085) 10 Non-administrative assets 1458 36’744’131 2’145’171 244’084’844 (40’122’983) 11 Administrative assets (AA) 1458 20’669’898 347’998 193’247’911 (26’175’344) 20 Liabilities 1458 24’087’475 207’496 169’655’414 (30’027’952) 23 Net assets/equity 1458 27’859’798 0 226’567’941 (32’331’836)
Main control variables
Regular equalization transfers, in CHF 1458 868’170 -96’853’145 41’756’879 (11’164’682) Population 1458 5’486 297 34’216 (5’774) % young population (<20 years) 1458 21.82 14.11 28.88 (2.24) % aged population (>65 years) 1458 16.05 8.00 26.20 (3.07) Unemployment rate, in % 1458 1.99 0.21 4.85 (0.73) Tax capacity, in CHF 1458 19’550’359 487’379 189’363’289 (26’283’668) Property gain tax, in CHF 1458 1’860’985 -53’205 37’530’872 (3’137’201)