Fiscal 2015 data sheet - Toto Ltd. · 1 Boundary TOTO LTD. and 52 of consolidated subsidiary...
10
-Contents- Report Policy --------------------------------------------------------- 1 Environmental Performance Indicator ------------------------------ 2 Calculation method of Environmental Performance Data ---------- 7 Independent Assurance Report ------------------------------------- 9 Fiscal 2015 data sheet
Transcript of Fiscal 2015 data sheet - Toto Ltd. · 1 Boundary TOTO LTD. and 52 of consolidated subsidiary...

-Contents-
Report Policy --------------------------------------------------------- 1
Environmental Performance Indicator ------------------------------ 2
Calculation method of Environmental Performance Data ---------- 7
Independent Assurance Report ------------------------------------- 9
Fiscal 2015 data sheet

1
Boundary
TOTO LTD. and 52 of consolidated subsidiary companies in Japan and overseas.
Period covered by this report
Fiscal year 2015(Japan: April 1, 2015 to March 31, 2016/ Overseas: January 1, 2015 to December 31, 2015.)
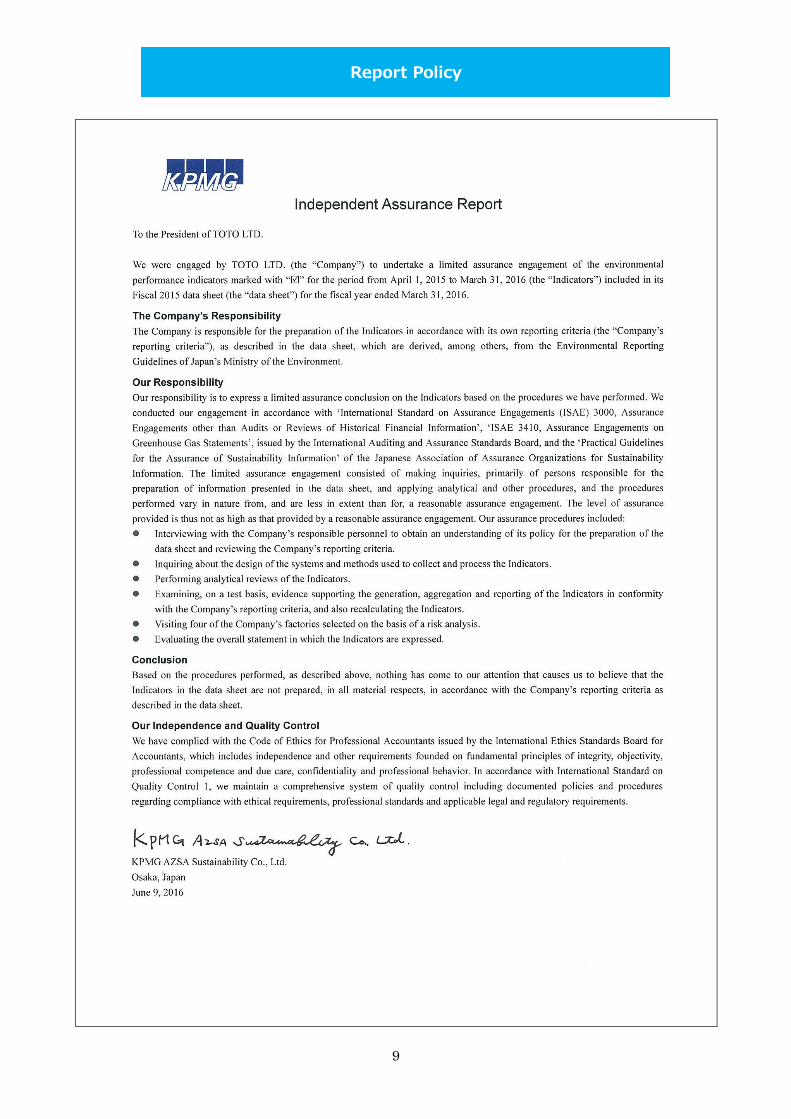
Independent Assurance ☑The fiscal year 2015 performance indicators with this tick mark have been assured by KPMG AZSA
Sustainability Co., Ltd.
But “per unit of sales” of each indicators are not covered.
Referenced guidelines
“Environmental Reporting Guidelines (Year 2012 version)”, Ministry of the Environment of Japan
Report Policy
2
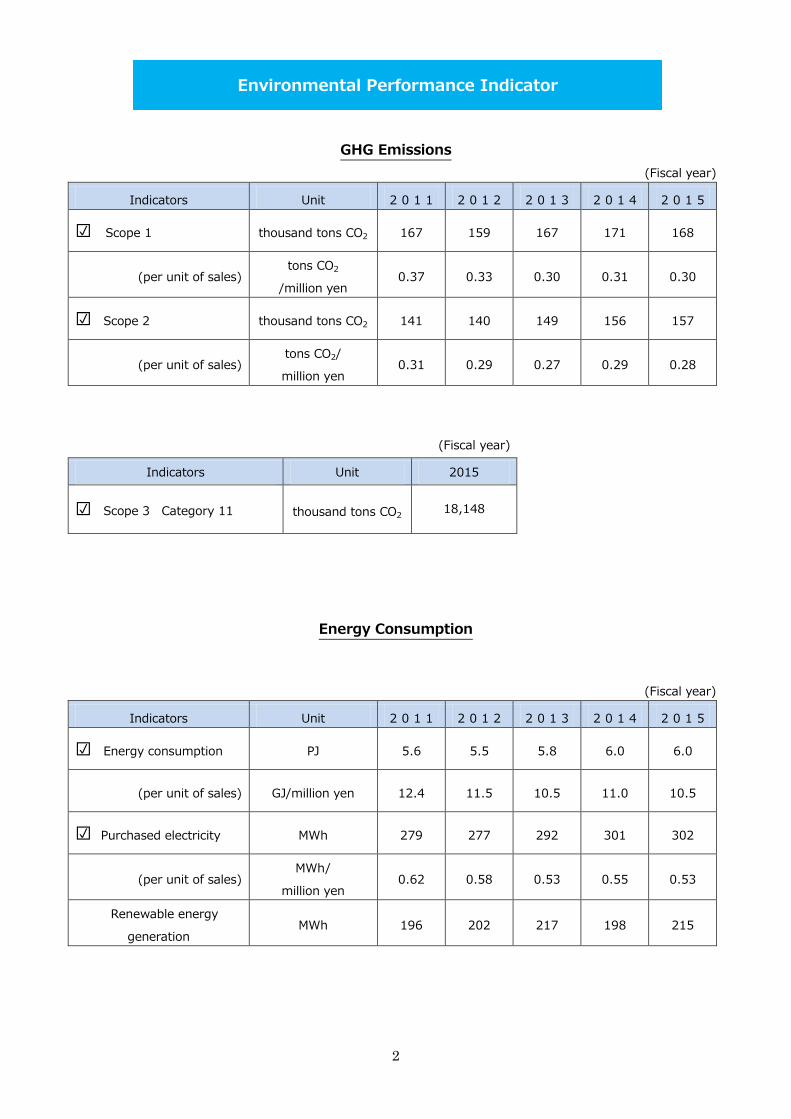
GHG Emissions
(Fiscal year)
Indicators Unit 2011 2012 2013 2014 2015
☑ Scope 1 thousand tons CO2 167 159 167 171 168
(per unit of sales) tons CO2
/million yen 0.37 0.33 0.30 0.31 0.30
☑ Scope 2 thousand tons CO2 141 140 149 156 157
(per unit of sales) tons CO2/
million yen 0.31 0.29 0.27 0.29 0.28
(Fiscal year)
Indicators Unit 2015
☑ Scope 3 Category 11 thousand tons CO2 18,148
Energy Consumption
(Fiscal year)
Indicators Unit 2011 2012 2013 2014 2015
☑ Energy consumption PJ 5.6 5.5 5.8 6.0 6.0
(per unit of sales) GJ/million yen 12.4 11.5 10.5 11.0 10.5
☑ Purchased electricity MWh 279 277 292 301 302
(per unit of sales) MWh/
million yen 0.62 0.58 0.53 0.55 0.53
Renewable energy
generation MWh 196 202 217 198 215
Environmental Performance Indicator

3
Water Consumption and Wastewater
(Fiscal year)
Indicators Unit 2011 2012 2013 2014 2015
☑ Water consumption thousand m3 2,727 2,702 2,601 2,800 2,851
(per unit of sales) m3/
million yen 6.02 5.67 4.70 5.14 5.02
(Groundwater
consumption) thousand m3 515 445 408 394 361
Wastewater thousand m3 2,229 2,272 1,824 1,809 1,801
(per unit of sales) m3/
million yen 4.92 4.77 3.30 3.32 3.17
Reused water thousand m3 1,225 1,266 1,416 1,893 1,711
Waste
(Fiscal year)
Indicators Unit 2011 2012 2013 2014 2015
Waste generated thousand tons 112.2 104.3 99.0 103.7 106.7
(per unit of sales) tons/million yen 247.9 219.0 178.9 190.4 187.9
Final disposal thousand tons 31.9 27.6 21.3 17.2 8.7
(per unit of sales) tons/million yen 70.5 57.9 38.5 31.6 15.3
Recycling rate % 71.5 73.5 80.6 82.4 91.8
(Japan) % 99.8 99.9 99.9 99.9 100
(Overseas) % 54.1 58.1 69.7 74.4 88.1
(Paper and Cardboard in
TOTO branch and
sales offices )
% 99.8 99.3 99.3 99.7 99.8
(Paper and Cardboard in
Group Sale/ Construction
companies in Japan)
% 99.4 99.9 100 100 100

4
Atmospheric Emissions
(Fiscal year)
Indicators Unit 2011 2012 2013 2014 2015
Chemical substance emission tons 27.9 39.7 27.9 28.0 40.0
(per unit of sales) kg/ million yen 0.06 0.08 0.05 0.05 0.07
SOx emission tons 133.4 168.1 149.8 131.5 134.4
(per unit of sales) kg/ million yen 0.29 0.35 0.27 0.24 0.24
NOx emission tons 273.1 283.2 356.1 382.6 272.9
(per unit of sales) kg/ million yen 0.60 0.59 0.64 0.70 0.48
Dust emission tons 142.2 150.6 110.8 152.3 124.7
(per unit of sales) kg/ million yen 0.31 0.32 0.20 0.28 0.22
※SOx emission, NOx emission and Dust emission were updated as far back as fiscal 2011 for accuracy
improvement
Regulated total water pollutants performance
COD (Chemical Oxygen Demand) (Fiscal year)
Plants Unit
Regulatory
value
Actual measured value
2011 2012 2013 2014 2015
Kokura No.2 Plant,
TOTO LTD. kg/day 28.82 8.95 6.60 9.59 9.61 5.02
HQ / Nakatsu Plant,
TOTO SANITECHNO LTD. kg/day 12.00 8.90 4.10 2.90 3.20 4.40
HQ / Nakatsu Plant,
TOTO Fine Ceramics LTD. kg/day 4.70 0.19 2.35 0.28 0.22 0.31
Oita Plant,
TOTO AQUATECHNO
LTD.
kg/day 16.60 2.80 4.60 1.90 2.60 2.40
Aichi Plant,
TOTO SANITECHNO LTD. kg/day 4.30 ― ― ― 0.70 0.63

5
Nitrogen content (Fiscal year)
Plants Unit
Regulatory
value
Actual measured value
2011 2012 2013 2014 2015
Kokura No.2 Plant,
TOTO LTD. kg/day 57.48 2.38 1.69 2.04 2.50 2.09
HQ / Nakatsu Plant,
TOTO SANITECHNO LTD. kg/day 8.85 7.36 6.95 6.42 5.51 4.66
HQ / Nakatsu Plant,
TOTO Fine Ceramics LTD. kg/day 8.20 1.11 0.93 1.44 0.92 1.10
Oita Plant,
TOTO AQUATECHNO LTD. kg/day 16.60 2.00 2.85 2.40 2.60 2.30
Aichi Plant,
TOTO SANITECHNO LTD. kg/day 3.70 ― ― ― 0.06 0.25
Phosphorus content (Fiscal year)
Plants Unit
Regulatory
value
Actual measured value
2011 2012 2013 2014 2015
Kokura No.2 Plant,
TOTO LTD. kg/day 5.75 0.09 0.05 0.08 0.06 0.04
HQ / Nakatsu Plant,
TOTO SANITECHNO LTD. kg/day 0.60 0.03 0.11 0.03 0.07 0.03
HQ / Nakatsu Plant,
TOTO Fine Ceramics LTD. kg/day 1.56 0.07 0.38 0.02 0.01 0.01
Oita Plant,
TOTO AQUATECHNO LTD. kg/day 4.98 0.30 0.40 0.30 0.30 0.30
Aichi Plant,
TOTO SANITECHNO LTD. kg/day 0.50 ― ― ― 0.00 0.004
6
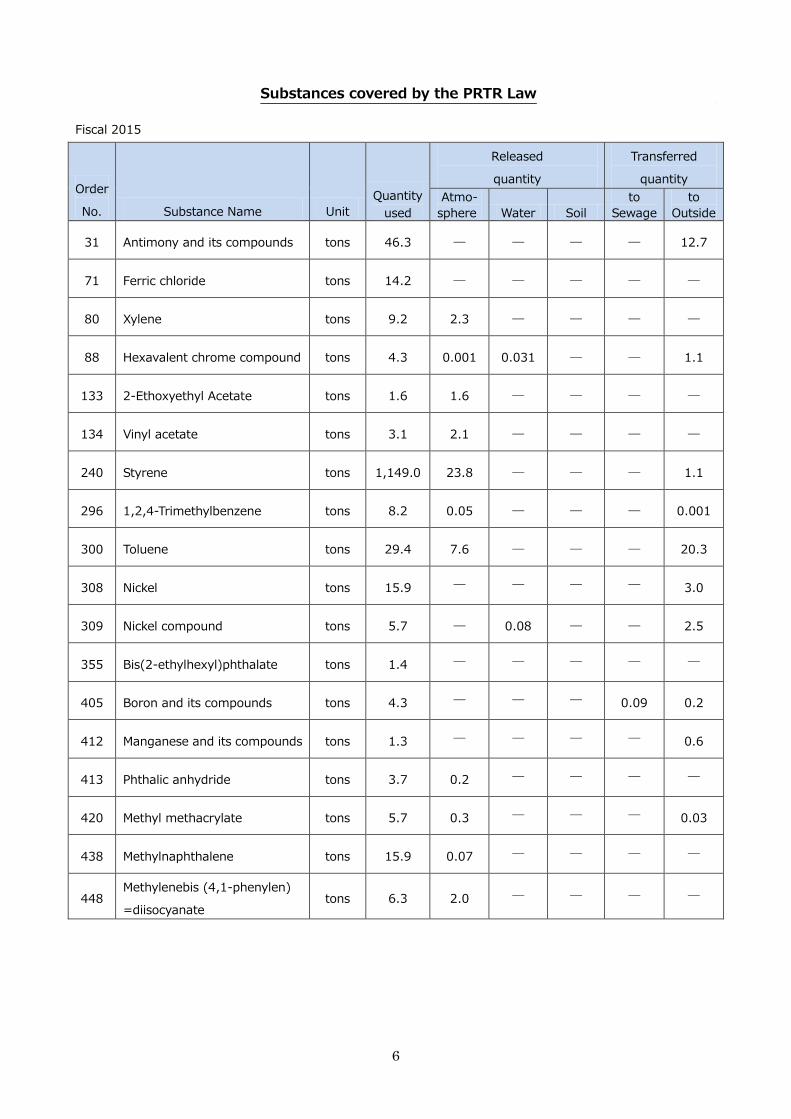
Substances covered by the PRTR Law
Fiscal 2015
Order
No. Substance Name Unit
Quantity
used
Released
quantity
Transferred
quantity
Atmo-
sphere Water Soil
to
Sewage
to
Outside
31 Antimony and its compounds tons 46.3 ― ― ― ― 12.7
71 Ferric chloride tons 14.2 ― ― ― ― ―
80 Xylene tons 9.2 2.3 ― ― ― ―
88 Hexavalent chrome compound tons 4.3 0.001 0.031 ― ― 1.1
133 2-Ethoxyethyl Acetate tons 1.6 1.6 ― ― ― ―
134 Vinyl acetate tons 3.1 2.1 ― ― ― ―
240 Styrene tons 1,149.0 23.8 ― ― ― 1.1
296 1,2,4-Trimethylbenzene tons 8.2 0.05 ― ― ― 0.001
300 Toluene tons 29.4 7.6 ― ― ― 20.3
308 Nickel tons 15.9 ― ― ― ― 3.0
309 Nickel compound tons 5.7 ― 0.08 ― ― 2.5
355 Bis(2-ethylhexyl)phthalate tons 1.4 ― ― ― ― ―
405 Boron and its compounds tons 4.3 ― ― ― 0.09 0.2
412 Manganese and its compounds tons 1.3 ― ― ― ― 0.6
413 Phthalic anhydride tons 3.7 0.2 ― ― ― ―
420 Methyl methacrylate tons 5.7 0.3 ― ― ― 0.03
438 Methylnaphthalene tons 15.9 0.07 ― ― ― ―
448 Methylenebis (4,1-phenylen)
=diisocyanate tons 6.3 2.0 ― ― ― ―

7
Indicators Calculation method
Scope 1 emissions CO2 emissions from the use of fuel + Non-CO2 and Non-Energy CO2 Sources
Scope 2 emissions CO2 emissions from purchased electricity and heat
【CO2 emission coefficient from electricity (Japan)】
“Guidelines for Calculating Corporate Greenhouse Gases Emissions(draft
ver.1.6)” published by Ministry of the Environment of Japan.
【CO2 emission coefficients from electricity (overseas)】
GHG Protocol, Calculation Tools, “Indirect CO2 Emission from Purchased
Electricity. Version 3.0”
【CO2 emission coefficients other than electricity】
“Guideline for Calculation of Greenhouse Gas Emissions (Version 2.4)”
published by Ministry of the Environment and Ministry of Economy, Trade
and Industry of Japan
Scope 3 Category 11
emissions
Lifetime※1 CO2 emissions※2 per unit from major products※3 × Sales quantity
※1:Duration of use by product classification (defined by TOTO)
※2:CO2 emissions from consumption of water and energy based on
specifications and the usage models (based on the information published
industry associations and research articles etc.) by sales areas
※3:Toilets, Washlets, faucets and bathtubs
【 CO2 emission coefficient from electricity (Japan)】
Average for 5 years (from fiscal year 2009 to fiscal year 2013) of CO2
emissions coefficient (adjust basis) indicated in “Environment Action Plan by
the Japanese Electric Utility Industry” by the Federation of Electric Power
Companies of Japan
【 CO2 emission coefficients from electricity (overseas)】
GHG Protocol, Calculation Tools, “Indirect CO2 Emission from Purchased
Electricity. Version 3.0
【 CO2 emission coefficient from water (Japan)】
“Approach book to promote household energy efficiency and home security”
by The committee to promote household energy efficiency and home
security
【 CO2 emission coefficients from water (overseas)】
CO2 emissions defined from research reports published by Ministry of the
Environment and Ministry of Economy, Trade and Industry of Japan
They are set from 0.39kg-CO2/m3 to 1.11kg-CO2/m
3 by sales areas
【CO2 emission coefficient from Gas】
“Guideline for Calculation of Greenhouse Gas Emissions (Version 2.4)”
published by Ministry of the Environment and Ministry of Economy, Trade
Calculation method of Environmental Performance Data

8
and Industry of Japan
Quantity of Energy
consumption
Total quantity of energy consumption of electricity, fuel and heat consumption
at offices and factories
Quantity of purchased
electricity
Total quantity of purchased electricity at offices and factories
Quantity of renewable
energy generation
Total quantity of renewable electricity generated at offices and factories
Quantity of water
consumption
Total quantity of water intake (municipal water, groundwater, and industrial
water) into offices and factories
Quantity of
groundwater
consumption
Total quantity of groundwater intake into offices and factories
Quantity of discharged water Total quantity of discharged water from offices and factories to sewage and
river
Quantity of reused water Total quantity of reused water in offices and factories
Quantity of waste generated Total quantity of waste generated in offices and factories
Quantity of final disposal Total quantity of final disposal without recycling in offices and factories
Recycling rate Quantity of waste recycled / Quantity of waste generated × 100
Recycle rate of paper and
cardboard in
TOTO branch and sales
offices
Recycle rate of paper and cardboard in TOTO branch and sales offices
Recycle rate of Paper and
Cardboard in
Group Sale/ Construction
companies in Japan
Recycle rate of paper and cardboard in group sale/ construction companies in
Japan
Chemical substance
emissions
Total quantity of chemical substance emissions
SOx emissions Total quantity of SOx emissions
NOx emissions Total quantity of NOx emissions
Dust emissions Total quantity of dust emissions
COD (Chemical Oxygen
Demand)
Average measured value of COD in 5 offices of TOTO group offices in Japan
which are subject to the total pollution control load systems
Nitrogen content Average measured value of nitrogen content in 5 offices of TOTO group offices
in Japan which are subject to the total pollution regulation
Phosphorus content Average measured value of phosphorus content in 5 offices of TOTO group
offices in Japan which are subject to the total pollution regulation
Substances covered by the
PRTR Law
Total quantity of subject chemical substances that exceeds the total annual
handling capacity of 1 ton (0.5 tons and above for Special Class 1) in the 16
business locations that are subject to the PRTR Law
9
Report Policy


![TOTO [ IMPORT ] RR [ IMPORT ] INAX [ JAPAN ] … · toto [ import ] rr [ import ] inax [ japan ] rbm - s 302 rzj - 11041 a-580 wc piston valve [ for rr brand ] toto [ import ] rr](https://static.fdocuments.us/doc/165x107/5b8fccf509d3f2c7748cde70/toto-import-rr-import-inax-japan-toto-import-rr-import-inax.jpg)