FIS project
55
FIXED INCOME SECURITIES PROJE Professor HK.Pradhan Submitted by Dhivya Partheeban 0 Rama Kumari 23 XLRI Singapore
-
Upload
something8648 -
Category
Documents
-
view
223 -
download
0
Transcript of FIS project

8/7/2019 FIS project
http://slidepdf.com/reader/full/fis-project 1/55
FIXED INCOME SECURITIES PROJE
Professor HK.Pradhan
Submitted by
Dhivya Partheeban 0
Rama Kumari 23
XLRI Singapore

8/7/2019 FIS project
http://slidepdf.com/reader/full/fis-project 2/55
T
5

8/7/2019 FIS project
http://slidepdf.com/reader/full/fis-project 3/55
8/7/2019 FIS project
http://slidepdf.com/reader/full/fis-project 4/55
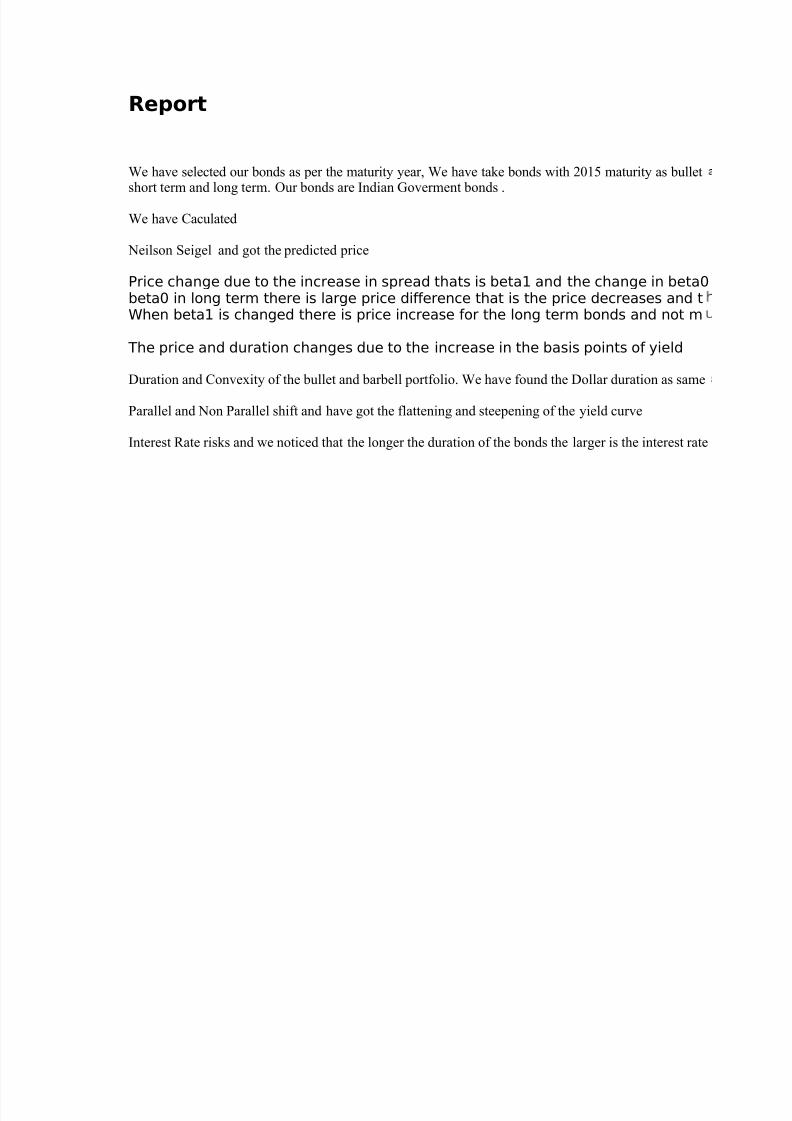
Report
We have selected our bonds as per the maturity year, We have take bonds with 2015 maturity as bulletshort term and long term. Our bonds are Indian Goverment bonds .
We have Caculated
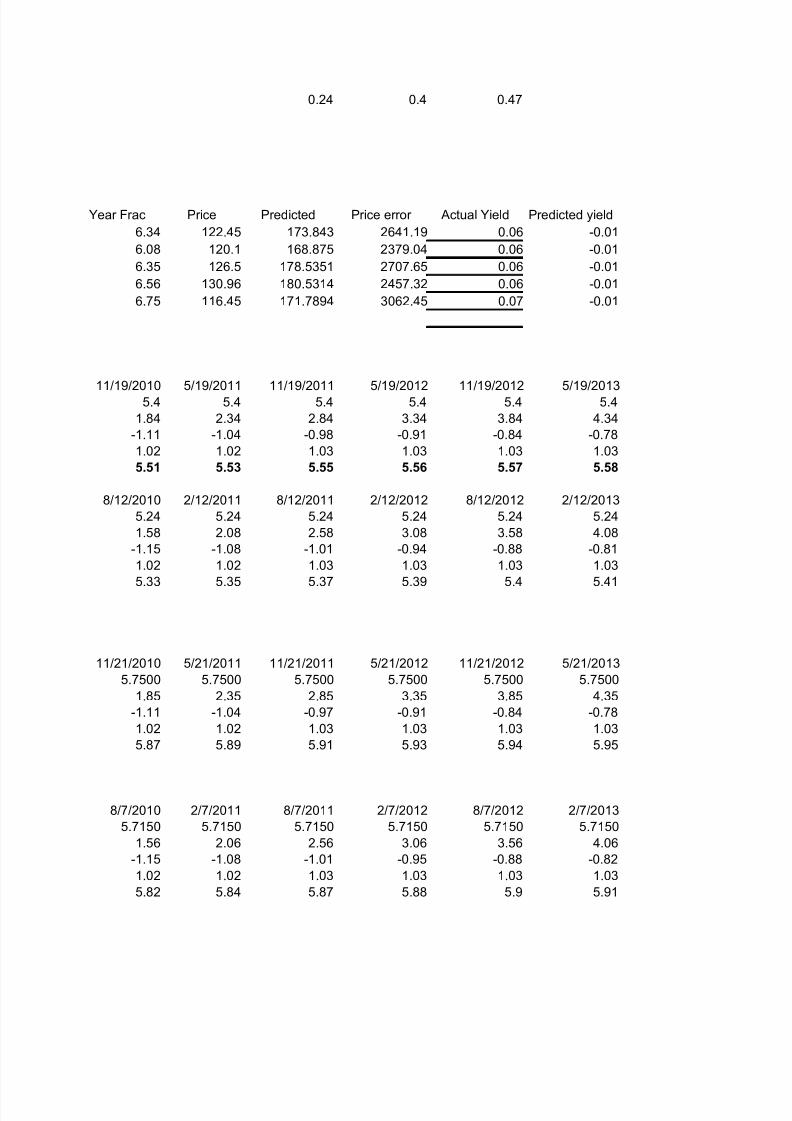
Neilson Seigel and got the predicted price
Price change due to the increase in spread thats is beta1 and the change in beta0beta0 in long term there is large price difference that is the price decreases and tWhen beta1 is changed there is price increase for the long term bonds and not m
The price and duration changes due to the increase in the basis points of yield
Duration and Convexity of the bullet and barbell portfolio. We have found the Dollar duration as same
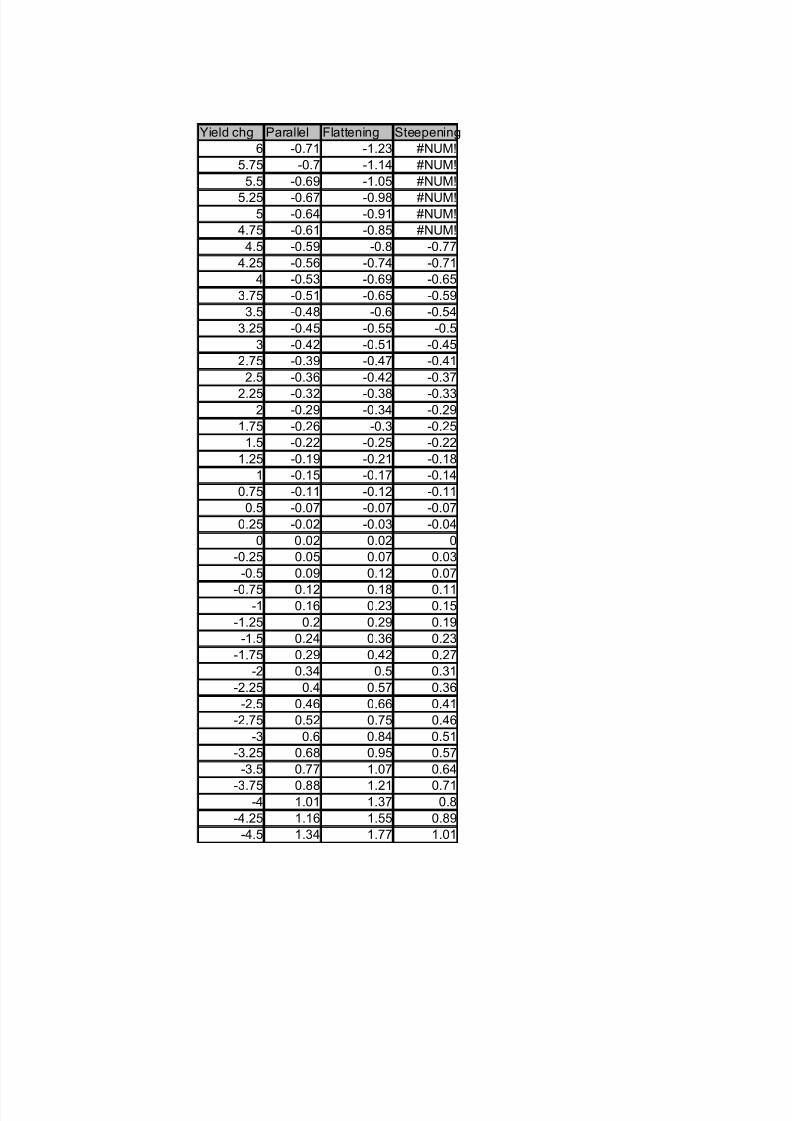
Parallel and Non Parallel shift and have got the flattening and steepening of the yield curve
Interest Rate risks and we noticed that the longer the duration of the bonds the larger is the interest rate

8/7/2019 FIS project
http://slidepdf.com/reader/full/fis-project 5/55
nd 2010 and 2022 maturity and Barbell
. We noticed when we increased thee short term bonds not much change.ch difference for the short term bonds.
and dollar conveity as different.
risk.

8/7/2019 FIS project
http://slidepdf.com/reader/full/fis-project 6/55
Bond Details
ISIN Nomenclature of Security Coupon Maturity DtIN0019900045 90010 11.50% 2010 6/11/1990 11.5 6/11/2010
IN0019820128 82013 8.75% 2010 12/13/1982 8.75 12/13/2010
IN0020020064 2010 7.55% G.S. 2010 5/14/2002 7.55 5/14/2010
IN0020000082 14 11.30% G. S. 2010 7/28/2000 11.3 7/28/2010
IN0019980120 98015 12.25% G. S. 2010 7/2/1998 12.25 7/2/2010
IN0020000033 9 10.79% G. S. 2015 5/19/2000 10.79 5/19/2015
IN0020000132 1001 10.47% G. S. 2015 2/12/2001 10.47 2/12/2015
IN0019850034 85007 11.50% 2015 5/21/1985 11.5 5/21/2015
IN0020000090 15 11.43% G. S. 2015 8/7/2000 11.43 8/7/2015IN0020010099 1011 9.85% G. S. 2015 10/16/2001 9.85 10/16/2015
IN0020020072 2011 8.35% G.S. 2022 5/14/2002 8.35 5/14/2022
IN0020060037 8.20% GOVT.STOCK 2022 2/15/2007 8.2 2/15/2022
IN0020070028 8.08% GOVT.STOCK 2022 8/2/2007 8.08 8/2/2022
IN0020070051 8.13% GOVT.STOCK 2022 9/21/2007 8.13 9/21/2022
RBI Loan
code Issue Dt

8/7/2019 FIS project
http://slidepdf.com/reader/full/fis-project 7/55
Issue Size70 109.23 4.56 1/15/2009 7152.81 822.57
0.05 101.3 7.99 1/15/2009 500.22 43.77
0.5 103.45 4.83 1/15/2009 42000 3,171.00
25 109.55 4.79 1/15/2009 34000 3,842.00
35 110.35 4.85 1/15/2009 15515 1,900.59
1/15/2009
0.4 122.45 6.41 1/15/2009 2683.45 289.54
0.25 120.1 6.41 1/15/2009 6430 673.22
0.04 126.5 6.35 1/15/2009 3560.5 409.46
5 130.96 5.73 1/15/2009 12000 1,371.6010 116.45 6.8 1/15/2009 10000 985
1/15/2009
5 115.1 6.62 1/15/2009 41000 3,423.50
10 113.95 6.59 1/15/2009 15632.33 1,281.85
25 101.52 7.9 1/15/2009 2969.41 239.93
25 101.96 7.9 1/15/2009 2495.28 202.87
Amount (Facevalue in
Rs.Crore)
Price per Rs.100
nominal
Indicative
YTM
Settlement
date
Coupon
Size

8/7/2019 FIS project
http://slidepdf.com/reader/full/fis-project 8/55

8/7/2019 FIS project
http://slidepdf.com/reader/full/fis-project 9/55

8/7/2019 FIS project
http://slidepdf.com/reader/full/fis-project 10/55
Price Chang
Barbell 10 y
118.030
Parameters 119.103beta 0 2.17 111.761
beta 1 -3.56 119.376
beta 2 1.38 18.3219
decay t 15.69 111.6459
114.1857
Barbell 2010 106.92
issue date start date Basis Maturity Coupon Yield Settlement
6/11/1990 20.01.2009 0 6/11/2010 11.50% 4.56% 1/15/2009
12/13/1982 15.01.2009 0 12/13/2010 8.75% 7.99% 1/15/2009
5/14/2002 14.01.2009 0 5/14/2010 7.55% 4.83% 1/15/2009
7/28/2000 13.01.2009 0 7/28/2010 11.30% 4.79% 1/15/2009
7/2/1998 13.01.2009 0 7/2/2010 12.25% 4.85% 1/15/2009
5/12/1980 07.01.2009 0 5/12/2010 7.50% 5.19% 1/15/2009
1/29/1999 16.09.2008 0 1/29/2010 12.29% 8.61% 1/15/2008
1/2/2003 20.01.2009 0 1/2/2010 5.87% 4.57% 1/15/2009
Settlement Date
11-Jun-10 15-Jan-09 Date 12/11/2008 6/11/2009 12/11/2009 6/11/2010
Cash flow 5.75 5.75 105.75YearFrac 0.41 0.91 1.41
Nelson -1.33 -1.25 -1.18
Discount 1.01 1.01 1.02
PV 5.78 5.82 107.52
CP 118.030 AI 1.09
13-Dec-10 15-Jan-09 Date 12/13/2008 6/13/2009 12/13/2009 6/13/2010
Cash flow 4.38 4.38 4.38
YearFrac 0.41 0.91 1.41
Nelson -1.33 -1.25 -1.18
Discount 1.01 1.01 1.02
PV 4.4 4.43 4.45
CP 119.103 AI 0.78
14-May-10 15-Jan-09 Date 11/14/2008 5/14/2009 11/14/2009 5/14/2010
Cash flow 3.7750 3.7750 103.7750
YearFrac 0.33 0.83 1.33
Nelson Spot -1.34 -1.26 -1.19
Discount 1 1.01 1.02

8/7/2019 FIS project
http://slidepdf.com/reader/full/fis-project 11/55
PV 3.79 3.81 105.43
AI 1.28
CP 111.761
28-Jul-10 15-Jan-09 Date 7/28/2008 1/28/2009 7/28/2009 1/28/2010
Cash flow 5.6500 5.6500 5.6500
YearFrac 0.04 0.54 1.04Nelson Spot -1.38 -1.31 -1.23
Discount 1 1.01 1.01
PV 5.65 5.69 5.72
AI 5.24
CP 119.376
2-Jul-10 15-Jan-09 Date 1/2/2009 7/2/2009 1/2/2010 7/2/2010
Cash flow 6.1250 6.1250 6.1250
YearFrac 0.46 0.96 1.46
Nelson Spot -1.32 -1.24 -1.17
Discount 1.01 1.01 1.02
PV 6.16 6.2 6.23AI 0.27
CP 18.322
12-May-10 15-Jan-09 Date 11/12/2008 5/12/2009 11/12/2009 5/12/2010
Cash flow 3.7500 3.7500 103.7500
YearFrac 0.33 0.83 1.33
Nelson Spot -1.34 -1.26 -1.19
Discount 1 1.01 1.02
PV 3.77 3.79 105.4
AI 1.31
CP 111.646
29-Jan-10 15-Jan-08 Date 7/29/2007 1/29/2008 7/29/2008 1/29/2009
Cash flow 6.1450 6.1450 106.1450
YearFrac 0.04 0.54 1.04
Nelson Spot -1.38 -1.31 -1.23
Discount 1 1.01 1.01
PV 6.15 6.19 107.52
AI 5.67
CP 114.186
2-Jan-10 15-Jan-09 Date 1/2/2009 7/2/2009 1/2/2010
Cash flow 2.9350 102.9350
YearFrac 0.46 0.96
Nelson Spot -1.32 -1.24Discount 1.01 1.01
PV 2.95 104.18
AI 0.21
CP 106.920
Barbell 2022

8/7/2019 FIS project
http://slidepdf.com/reader/full/fis-project 12/55
issue date start date Basis Maturity Coupon Yield Settlement
5/14/2002 16.01.2009 0 5/14/2022 8.35% 6.62% 1/15/2009
2/15/2007 16.01.2009 0 2/15/2022 8.20% 6.59% 1/15/2009
8/2/2007 13.03.2008 0 8/2/2022 8.08% 7.90% 1/15/2009
9/21/2007 13.03.2008 0 9/21/2022 8.13% 7.90% 1/15/2009
Settlement Date
14-May-22 15-Jan-09 Date 11/14/2008 5/14/2009 11/14/2009 5/14/2010
Cash flow 4.18 4.18 4.18
YearFrac 0.33 0.83 1.33
Nelson -1.34 -1.26 -1.19
Discount 1 1.01 1.02
PV 4.19 4.22 4.24
CP 212.096 AI 1.41
15-Feb-22 15-Jan-09 Date 8/15/2008 2/15/2009 8/15/2009 2/15/2010
Cash flow 4.1 4.1 4.1
YearFrac 0.08 0.58 1.08
Nelson -1.38 -1.3 -1.22
Discount 1 1.01 1.01
PV 4.1 4.13 4.15
CP 208.337 AI 3.42
2-Aug-22 15-Jan-09 Date 8/2/2008 2/2/2009 8/2/2009 2/2/2010
Cash flow 4.0400 4.0400 4.0400
YearFrac 0.05 0.55 1.05
Nelson Spot -1.38 -1.31 -1.23
Discount 1 1.01 1.01
PV 4.04 4.07 4.09
AI 3.66
CP 209.892
21-Sep-22 15-Jan-09 Date 9/21/2008 3/21/2009 9/21/2009 3/21/2010
Cash flow 4.0650 4.0650 4.0650
YearFrac 0.18 0.68 1.18
Nelson Spot -1.36 -1.28 -1.21
Discount 1 1.01 1.01
PV 4.08 4.1 4.12
AI 2.57
CP 211.511

8/7/2019 FIS project
http://slidepdf.com/reader/full/fis-project 13/55
Bullet 2015
issue date start date Basis Maturity Coupon Yield Settlement
5/19/2000 20.01.2009 0 5/19/2015 10.79% 6.41% 1/15/2009
2/12/2001 20.01.2009 0 2/12/2015 10.47% 6.41% 1/15/2009
5/21/1985 20.01.2009 0 5/21/2015 11.50% 6.35% 1/15/2009
8/7/2000 30.12.2008 0 8/7/2015 11.43% 5.73% 1/15/2009
10/16/2001 11.12.2008 0 10/16/2015 9.85% 6.80% 1/15/2009
Settlement Date
19-May-15 15-Jan-09 Date 11/19/2008 5/19/2009 11/19/2009 5/19/2010
Cash flow 5.4 5.4 5.4
YearFrac 0.34 0.84 1.34
Nelson -1.34 -1.26 -1.19
Discount 1 1.01 1.02
PV 5.42 5.45 5.48
CP 173.843 AI 1.68
12-Feb-15 15-Jan-09 Date 8/12/2008 2/12/2009 8/12/2009 2/12/2010
Cash flow 5.24 5.24 5.24
YearFrac 0.08 0.58 1.08
Nelson -1.38 -1.3 -1.23
Discount 1 1.01 1.01
PV 5.24 5.27 5.3
CP 168.875 AI 4.45
21-May-15 15-Jan-09 Date 11/21/2008 5/21/2009 11/21/2009 5/21/2010
Cash flow 5.7500 5.7500 5.7500
YearFrac 0.35 0.85 1.35
Nelson Spot -1.34 -1.26 -1.19
Discount 1 1.01 1.02
PV 5.78 5.81 5.84
AI 1.73
CP 178.535
7-Aug-15 15-Jan-09 Date 8/7/2008 2/7/2009 8/7/2009 2/7/2010
Cash flow 5.7150 5.7150 5.7150
YearFrac 0.06 0.56 1.06
Nelson Spot -1.38 -1.3 -1.23
Discount 1 1.01 1.01
PV 5.72 5.76 5.79
AI 5.02
8/7/2019 FIS project
http://slidepdf.com/reader/full/fis-project 14/55
CP 180.531
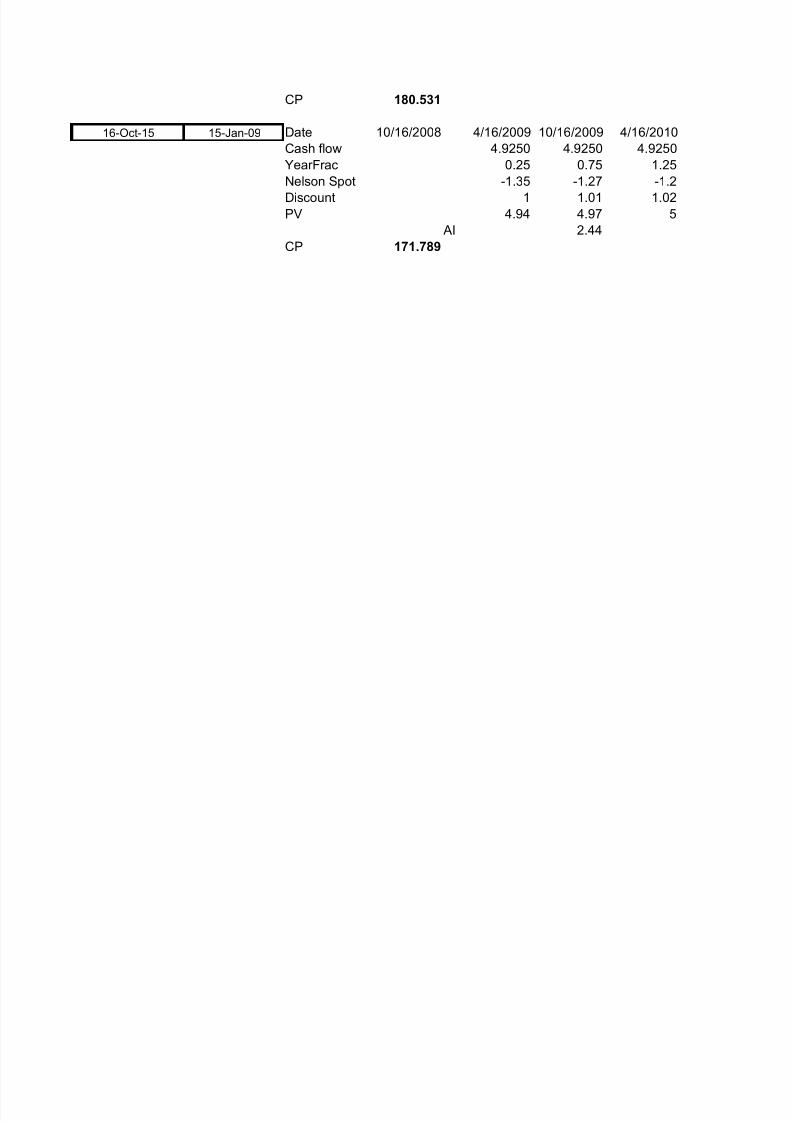
16-Oct-15 15-Jan-09 Date 10/16/2008 4/16/2009 10/16/2009 4/16/2010
Cash flow 4.9250 4.9250 4.9250
YearFrac 0.25 0.75 1.25
Nelson Spot -1.35 -1.27 -1.2
Discount 1 1.01 1.02PV 4.94 4.97 5
AI 2.44
CP 171.789

8/7/2019 FIS project
http://slidepdf.com/reader/full/fis-project 15/55
Beta 0 increases to 5.171378349 Increaing the sp
Bullet 15 yr Barbell 22 yr Barbell 10 year Bullet 15 yr Barbell 22 yr Barbell 10 year
173.84 212.1 113.37 149.2 159.34 121.14
168.88 208.34 112.82 145.63 157.01 123.29
178.54 209.89 107.51 153.42 156.89 114.60
180.53 211.51 114.27 154.48 157.8 122.787%
171.79 17.79 145.95 18.68
107.42 114.48
110.78 116.47
103.91 108.94
Year Frac Price Predicted Price error Actual Yield Predicted yield
1.41 109.23 118.030 77.45 0.05 -0.01
1.91 101.3 119.103 316.94 0.08 -0.01
1.33 103.45 111.761 69.08 0.05 -0.01
1.54 109.55 119.376 96.55 0.05 -0.01
1.46 110.35 18.3219 8469.17 0.05 2
1.33 102.95 111.6459 75.62 0.05 -0.01
2.04 104.62 114.1857 91.5 0.1 0.048922
0.96 101.19 106.92 32.84 0.05 -0.012436
3 5 6
coupon intere 15-Apr-09 14-Jun-09 14-Jul-09
117.25 108.02 2.88% 4.79% 5.75%0.24 0.39 0.46
0.07 106.82 price discounted byyield
12/13/2010
104.38
1.91
-1.1
1.02
106.61

8/7/2019 FIS project
http://slidepdf.com/reader/full/fis-project 16/55
7/28/2010
105.6500
1.54-1.16
1.02
107.55

8/7/2019 FIS project
http://slidepdf.com/reader/full/fis-project 17/55
Year Frac Price Predicted Price error Actual Yield Predicted yield
13.33 115.1 212.096 9408.21 0.07 0
13.08 113.95 208.337 8908.98 0.07 0
13.55 101.52 209.8920 11744.48 0.08 0
13.68 101.96 211.5107 12001.36 0.08 0
11/14/2010 5/14/2011 11/14/2011 5/14/2012 11/14/2012 5/14/2013
4.18 4.18 4.18 4.18 4.18 4.18
1.83 2.33 2.83 3.33 3.83 4.33
-1.12 -1.05 -0.98 -0.91 -0.85 -0.78
1.02 1.02 1.03 1.03 1.03 1.03
4.26 4.28 4.29 4.3 4.31 4.32
8/15/2010 2/15/2011 8/15/2011 2/15/2012 8/15/2012 2/15/2013
4.1 4.1 4.1 4.1 4.1 4.1
1.58 2.08 2.58 3.08 3.58 4.08
-1.15 -1.08 -1.01 -0.94 -0.88 -0.81
1.02 1.02 1.03 1.03 1.03 1.03
4.18 4.19 4.21 4.22 4.23 4.24
8/2/2010 2/2/2011 8/2/2011 2/2/2012 8/2/2012 2/2/2013
4.0400 4.0400 4.0400 4.0400 4.0400 4.0400
1.55 2.05 2.55 3.05 3.55 4.05
-1.16 -1.09 -1.02 -0.95 -0.88 -0.82
1.02 1.02 1.03 1.03 1.03 1.03
4.11 4.13 4.15 4.16 4.17 4.18
9/21/2010 3/21/2011 9/21/2011 3/21/2012 9/21/2012 3/21/2013
4.0650 4.0650 4.0650 4.0650 4.0650 4.0650
1.68 2.18 2.68 3.18 3.68 4.18
-1.14 -1.07 -1 -0.93 -0.86 -0.8
1.02 1.02 1.03 1.03 1.03 1.03
4.14 4.16 4.18 4.19 4.2 4.2
3 5 6
15-Apr-09 14-Jun-09 14-Jul-09
2.09% 3.48% 4.18%
8/7/2019 FIS project
http://slidepdf.com/reader/full/fis-project 18/55
0.24 0.4 0.47
Year Frac Price Predicted Price error Actual Yield Predicted yield
6.34 122.45 173.843 2641.19 0.06 -0.01
6.08 120.1 168.875 2379.04 0.06 -0.01
6.35 126.5 178.5351 2707.65 0.06 -0.01
6.56 130.96 180.5314 2457.32 0.06 -0.01
6.75 116.45 171.7894 3062.45 0.07 -0.01
11/19/2010 5/19/2011 11/19/2011 5/19/2012 11/19/2012 5/19/2013
5.4 5.4 5.4 5.4 5.4 5.4
1.84 2.34 2.84 3.34 3.84 4.34
-1.11 -1.04 -0.98 -0.91 -0.84 -0.78
1.02 1.02 1.03 1.03 1.03 1.03
5.51 5.53 5.55 5.56 5.57 5.58
8/12/2010 2/12/2011 8/12/2011 2/12/2012 8/12/2012 2/12/2013
5.24 5.24 5.24 5.24 5.24 5.24
1.58 2.08 2.58 3.08 3.58 4.08
-1.15 -1.08 -1.01 -0.94 -0.88 -0.81
1.02 1.02 1.03 1.03 1.03 1.03
5.33 5.35 5.37 5.39 5.4 5.41
11/21/2010 5/21/2011 11/21/2011 5/21/2012 11/21/2012 5/21/2013
5.7500 5.7500 5.7500 5.7500 5.7500 5.7500
1.85 2.35 2.85 3.35 3.85 4.35
-1.11 -1.04 -0.97 -0.91 -0.84 -0.78
1.02 1.02 1.03 1.03 1.03 1.03
5.87 5.89 5.91 5.93 5.94 5.95
8/7/2010 2/7/2011 8/7/2011 2/7/2012 8/7/2012 2/7/2013
5.7150 5.7150 5.7150 5.7150 5.7150 5.7150
1.56 2.06 2.56 3.06 3.56 4.06
-1.15 -1.08 -1.01 -0.95 -0.88 -0.82
1.02 1.02 1.03 1.03 1.03 1.03
5.82 5.84 5.87 5.88 5.9 5.91

8/7/2019 FIS project
http://slidepdf.com/reader/full/fis-project 19/55
10/16/2010 4/16/2011 10/16/2011 4/16/2012 10/16/2012 4/16/2013
4.9250 4.9250 4.9250 4.9250 4.9250 4.9250
1.75 2.25 2.75 3.25 3.75 4.25
-1.13 -1.06 -0.99 -0.92 -0.86 -0.79
1.02 1.02 1.03 1.03 1.03 1.035.02 5.04 5.06 5.08 5.09 5.09

8/7/2019 FIS project
http://slidepdf.com/reader/full/fis-project 20/55
ead
Bullet 15 yr Barbell 22 yr
189.74 244.41
183.9 239.83194.74 242.30
197.31 244.32
188.4
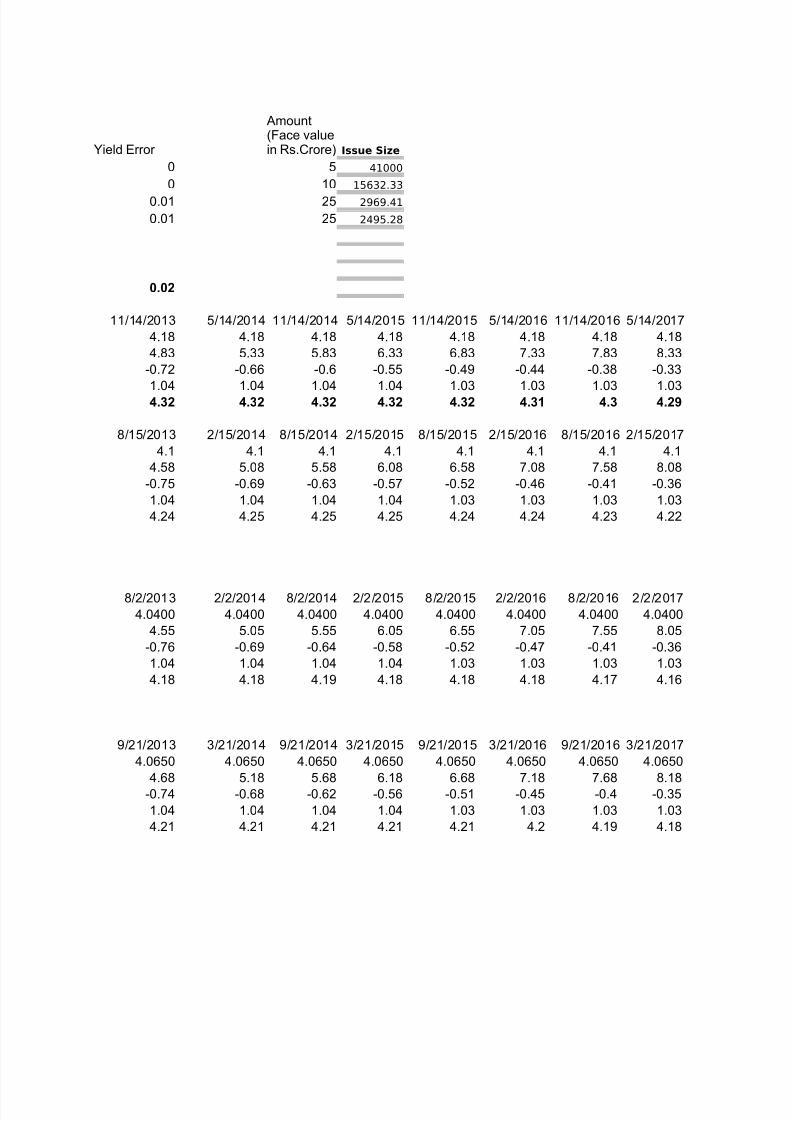
Yield Error Issue Size
0 70 7152.81
0.01 0.05 500.22
0 0.5 42000
0 25 34000
3.81 35 15515
0 0.7 1456.22
0 65 11500
0 70 29000
5 0
3.84 10 100
Amount(Face valuein Rs.Crore)

8/7/2019 FIS project
http://slidepdf.com/reader/full/fis-project 21/55
8/7/2019 FIS project
http://slidepdf.com/reader/full/fis-project 22/55
Yield Error Issue Size
0 5 41000
0 10 15632.33
0.01 25 2969.41
0.01 25 2495.28
0.02
11/14/2013 5/14/2014 11/14/2014 5/14/2015 11/14/2015 5/14/2016 11/14/2016 5/14/2017
4.18 4.18 4.18 4.18 4.18 4.18 4.18 4.18
4.83 5.33 5.83 6.33 6.83 7.33 7.83 8.33
-0.72 -0.66 -0.6 -0.55 -0.49 -0.44 -0.38 -0.33
1.04 1.04 1.04 1.04 1.03 1.03 1.03 1.03
4.32 4.32 4.32 4.32 4.32 4.31 4.3 4.29
8/15/2013 2/15/2014 8/15/2014 2/15/2015 8/15/2015 2/15/2016 8/15/2016 2/15/2017
4.1 4.1 4.1 4.1 4.1 4.1 4.1 4.1
4.58 5.08 5.58 6.08 6.58 7.08 7.58 8.08
-0.75 -0.69 -0.63 -0.57 -0.52 -0.46 -0.41 -0.36
1.04 1.04 1.04 1.04 1.03 1.03 1.03 1.03
4.24 4.25 4.25 4.25 4.24 4.24 4.23 4.22
8/2/2013 2/2/2014 8/2/2014 2/2/2015 8/2/2015 2/2/2016 8/2/2016 2/2/2017
4.0400 4.0400 4.0400 4.0400 4.0400 4.0400 4.0400 4.0400
4.55 5.05 5.55 6.05 6.55 7.05 7.55 8.05
-0.76 -0.69 -0.64 -0.58 -0.52 -0.47 -0.41 -0.36
1.04 1.04 1.04 1.04 1.03 1.03 1.03 1.03
4.18 4.18 4.19 4.18 4.18 4.18 4.17 4.16
9/21/2013 3/21/2014 9/21/2014 3/21/2015 9/21/2015 3/21/2016 9/21/2016 3/21/2017
4.0650 4.0650 4.0650 4.0650 4.0650 4.0650 4.0650 4.0650
4.68 5.18 5.68 6.18 6.68 7.18 7.68 8.18
-0.74 -0.68 -0.62 -0.56 -0.51 -0.45 -0.4 -0.35
1.04 1.04 1.04 1.04 1.03 1.03 1.03 1.03
4.21 4.21 4.21 4.21 4.21 4.2 4.19 4.18
Amount(Face valuein Rs.Crore)

8/7/2019 FIS project
http://slidepdf.com/reader/full/fis-project 23/55
Yield Error Issue Size
0 0.4 2683.45
0 0.25 6430
0 0.04 3560.5
0 5 12000
0.01 10 10000
0.02
11/19/2013 5/19/2014 11/19/2014 5/19/2015
5.4 5.4 5.4 105.4
4.84 5.34 5.84 6.34
-0.72 -0.66 -0.6 -0.54
1.04 1.04 1.04 1.04
5.59 5.59 5.59 109.1
8/12/2013 2/12/2014 8/12/2014 2/12/2015
5.24 5.24 5.24 105.24
4.58 5.08 5.58 6.08
-0.75 -0.69 -0.63 -0.57
1.04 1.04 1.04 1.04
5.42 5.42 5.42 108.98
11/21/2013 5/21/2014 11/21/2014 5/21/2015
5.7500 5.7500 5.7500 105.7500
4.85 5.35 5.85 6.35
-0.72 -0.66 -0.6 -0.54
1.04 1.04 1.04 1.04
5.95 5.96 5.96 109.47
8/7/2013 2/7/2014 8/7/2014 2/7/2015 8/7/2015
5.7150 5.7150 5.7150 5.7150 105.7150
4.56 5.06 5.56 6.06 6.56
-0.75 -0.69 -0.63 -0.58 -0.52
1.04 1.04 1.04 1.04 1.03
5.92 5.92 5.92 5.92 109.39
Amount
(Face valuein Rs.Crore)

8/7/2019 FIS project
http://slidepdf.com/reader/full/fis-project 24/55
10/16/2013 4/16/2014 10/16/2014 4/16/2015 10/16/2015
4.9250 4.9250 4.9250 4.9250 104.9250
4.75 5.25 5.75 6.25 6.75
-0.73 -0.67 -0.61 -0.55 -0.5
1.04 1.04 1.04 1.04 1.035.1 5.1 5.1 5.1 108.52

8/7/2019 FIS project
http://slidepdf.com/reader/full/fis-project 25/55

8/7/2019 FIS project
http://slidepdf.com/reader/full/fis-project 26/55

8/7/2019 FIS project
http://slidepdf.com/reader/full/fis-project 27/55
11/14/2017 5/14/2018 11/14/2018 5/14/2019 11/14/2019 5/14/2020 11/14/2020 5/14/2021 11/14/2021
4.18 4.18 4.18 4.18 4.18 4.18 4.18 4.18 4.18
8.83 9.33 9.83 10.33 10.83 11.33 11.83 12.33 12.83
-0.28 -0.23 -0.19 -0.14 -0.1 -0.05 -0.01 0.03 0.07
1.03 1.02 1.02 1.01 1.01 1.01 1 1 0.99
4.28 4.27 4.25 4.24 4.22 4.2 4.18 4.16 4.14
8/15/2017 2/15/2018 8/15/2018 2/15/2019 8/15/2019 2/15/2020 8/15/2020 2/15/2021 8/15/2021
4.1 4.1 4.1 4.1 4.1 4.1 4.1 4.1 4.1
8.58 9.08 9.58 10.08 10.58 11.08 11.58 12.08 12.58
-0.31 -0.26 -0.21 -0.16 -0.12 -0.07 -0.03 0.01 0.05
1.03 1.02 1.02 1.02 1.01 1.01 1 1 0.99
4.21 4.2 4.18 4.17 4.15 4.13 4.11 4.09 4.07
8/2/2017 2/2/2018 8/2/2018 2/2/2019 8/2/2019 2/2/2020 8/2/2020 2/2/2021 8/2/2021
4.0400 4.0400 4.0400 4.0400 4.0400 4.0400 4.0400 4.0400 4.0400
8.55 9.05 9.55 10.05 10.55 11.05 11.55 12.05 12.55
-0.31 -0.26 -0.21 -0.17 -0.12 -0.08 -0.03 0.01 0.05
1.03 1.02 1.02 1.02 1.01 1.01 1 1 0.99
4.15 4.14 4.12 4.11 4.09 4.07 4.06 4.04 4.02
9/21/2017 3/21/2018 9/21/2018 3/21/2019 9/21/2019 3/21/2020 9/21/2020 3/21/2021 9/21/2021
4.0650 4.0650 4.0650 4.0650 4.0650 4.0650 4.0650 4.0650 4.0650
8.68 9.18 9.68 10.18 10.68 11.18 11.68 12.18 12.68
-0.3 -0.25 -0.2 -0.15 -0.11 -0.07 -0.02 0.02 0.06
1.03 1.02 1.02 1.02 1.01 1.01 1 1 0.99
4.17 4.16 4.14 4.13 4.11 4.09 4.08 4.06 4.03

8/7/2019 FIS project
http://slidepdf.com/reader/full/fis-project 28/55

8/7/2019 FIS project
http://slidepdf.com/reader/full/fis-project 29/55

8/7/2019 FIS project
http://slidepdf.com/reader/full/fis-project 30/55

8/7/2019 FIS project
http://slidepdf.com/reader/full/fis-project 31/55

8/7/2019 FIS project
http://slidepdf.com/reader/full/fis-project 32/55
5/14/2022
104.18
13.33
0.11
0.99
102.64
2/15/2022
104.1
13.08
0.09
0.99
102.85
2/2/2022 8/2/2022
4.0400 104.0400
13.05 13.55
0.09 0.13
0.99 0.98
3.99 102.25
3/21/2022 9/21/2022
4.0650 104.0650
13.18 13.68
0.1 0.14
0.99 0.98
4.01 102.11

8/7/2019 FIS project
http://slidepdf.com/reader/full/fis-project 33/55

8/7/2019 FIS project
http://slidepdf.com/reader/full/fis-project 34/55

8/7/2019 FIS project
http://slidepdf.com/reader/full/fis-project 35/55
Particulars Bullet Barbell
Dollar Duration 5.01 5.01
31.42 52.25
Barbell 2010
Bond A Bond B Bond C Bond D Bond E
Date of Settlement 1/15/2009 1/15/2009 1/15/2009 1/15/2009 1/15/2009
Date of Maturity 6/11/2010 12/13/2010 5/14/2010 7/28/2010 7/2/2010
Coupon 11.50% 8.75% 7.55% 11.30% 12.25%
Yield 4.56% 7.99% 4.83% 4.79% 4.85%
Redemption value 100 100 100 100 100
Coupon frequency 2 2 2 2 2Basis (Actual/365) 0 0 0 0 0
Price per 100 118.03 119.1 111.76 119.38 18.32
Face 700,000,000 500000 5000000 250000000 350000000
Price 826,213,473 595,514 5,588,059 298,439,460 64,126,674
Macauley Duration 1.33 1.79 1.28 1.39 1.38
Modified Duration 1.30 1.72 1.25 1.36 1.35
Weights 0.69 0 0 0.25 0.05
Portfolio Contribution 0.9 0 0.01 0.35 0.07
wt *actual yeild 0.03 0 0 0.01 0Coupon weighted 0.08 0 0 0.03 0.01
price weighted 81.61 0.06 0.52 29.81 0.98
Price - V0 109.34 101.3 103.45 109.53 110.33
Price - V(-) 109.48 101.48 103.58 109.69 110.48
Price - V+ 109.20 101.13 103.32 109.38 110.18
Approximated convexity 2.4 3.94 2.23 2.78 2.55
1.66 0 0.01 0.69 0.14
Barbell 2022
Bond A Bond B Bond C Bond D
Date of Settlement 1/15/2009 1/15/2009 1/15/2009 1/15/2009
Date of Maturity 5/14/2022 2/15/2022 8/2/2022 9/21/2022
Coupon 8.35% 8.20% 8.08% 8.13%
Yield 6.62% 6.59% 7.90% 7.90%
Redemption value 100 100 100 100
Coupon frequency 2 2 2 2
Dollarconvexity

8/7/2019 FIS project
http://slidepdf.com/reader/full/fis-project 36/55
Basis (Actual/365) 0 0 0 0
Price per 100 212.1 208.34 209.89 211.51
Face 50,000,000 100000000 250000000 250000000
Price 106,047,972 208,337,392 524,729,934 528,776,769
Macauley Duration 8.55 8.34 8.22 8.34
Modified Duration 8.27 8.07 7.91 8.03
Weights 0.08 0.15 0.38 0.39
Portfolio Contribution 0.64 1.23 3.03 3.1
wt *actual yeild 0.01 0.01 0.03 0.03
Price - V0 115.11 113.96 101.48 101.88
Price - V(-) 116.08 114.91 102.31 102.72
Price - V+ 114.15 113.01 100.65 101.05
Approximated convexity 94.39 92.56 92.13 93.19weighted convexity 7.32 14.1 35.34 36.02 92.78Bullet 2015
Bond A Bond B Bond C Bond D Bond E
Date of Settlement 1/15/2009 1/15/2009 1/15/2009 1/15/2009 1/15/2009
Date of Maturity 5/19/2015 2/12/2015 5/21/2015 8/7/2015 10/16/2015
Coupon 10.79% 10.47% 11.50% 11.43% 9.85%
Yield 6.41% 6.41% 6.35% 5.73% 6.80%
Redemption value 100 100 100 100 100Coupon frequency 2 2 2 2 2
Basis (Actual/365) 0 0 0 0 0
Price per 100 173.84 168.88 178.54 180.53 171.79
Face 4,000,000 2500000 400000 50000000 100000000
Price 6,953,701 4,221,885 714,140 90,265,678 171,789,390
Macauley Duration 4.86 4.62 4.82 4.85 5.12
Modified Duration 4.71 4.47 4.67 4.72 4.95
Weights 0.03 0.02 0 0.33 0.63
Portfolio Contribution 0.12 0.07 0.01 1.6 3.21
wt *actual yeild 0 0 0 0.02 0.04
weighted coupon 0 0 0 0.04 0.06
Price - V0 122.5 120.14 126.56 130.8 116.27
Price - V(-) 123.09 120.70 127.16 131.45 116.86
Price - V+ 121.92 119.59 125.96 130.16 115.69

8/7/2019 FIS project
http://slidepdf.com/reader/full/fis-project 37/55
Approximated convexity 28.78 27.03 28.44 30.38 32.2
weighted convexity 0.73 0.42 0.07 10.01 20.19
8/7/2019 FIS project
http://slidepdf.com/reader/full/fis-project 38/55
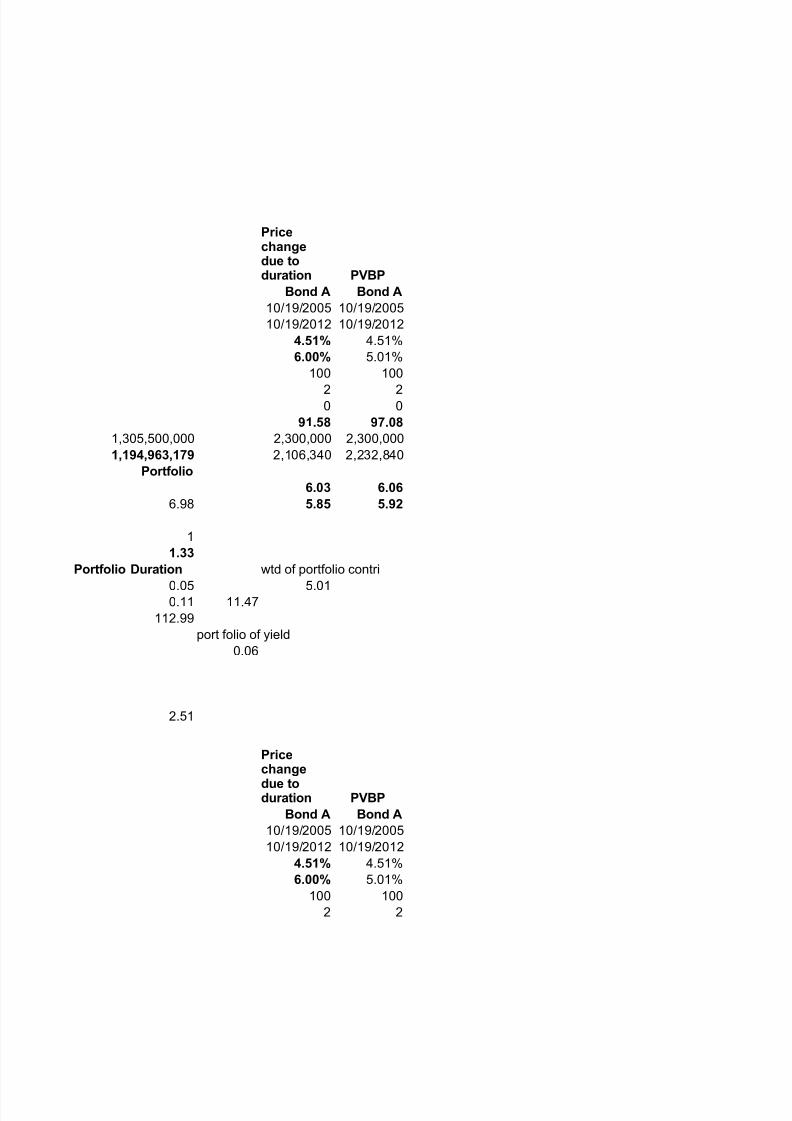
PVBP
Bond A Bond A
10/19/2005 10/19/2005
10/19/2012 10/19/2012
4.51% 4.51%
6.00% 5.01%
100 100
2 20 0
91.58 97.08
1,305,500,000 2,300,000 2,300,000
1,194,963,179 2,106,340 2,232,840
Portfolio
6.03 6.06
6.98 5.85 5.92
1
1.33
Portfolio Duration wtd of portfolio contri
0.05 5.010.11 11.47
112.99
port folio of yield
0.06
2.51
PVBP
Bond A Bond A
10/19/2005 10/19/2005
10/19/2012 10/19/2012
4.51% 4.51%
6.00% 5.01%
100 100
2 2
Pricechangedue toduration
Pricechange
due toduration
8/7/2019 FIS project
http://slidepdf.com/reader/full/fis-project 39/55
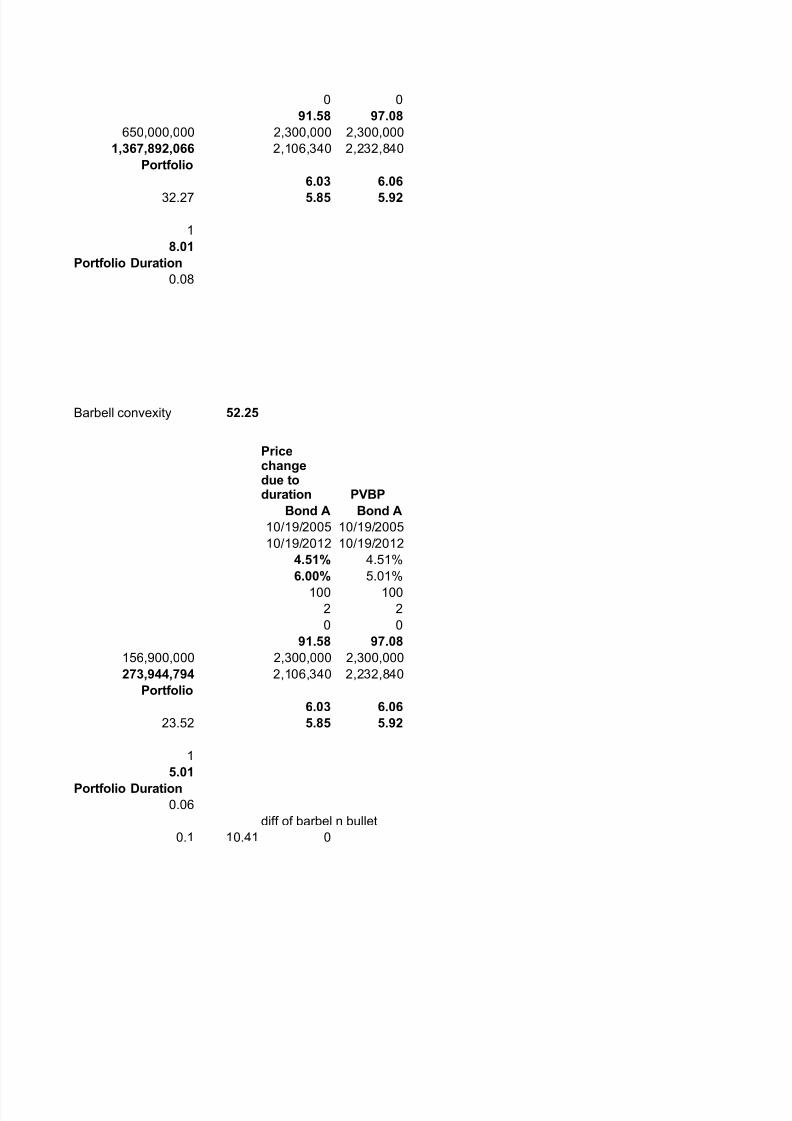
0 0
91.58 97.08
650,000,000 2,300,000 2,300,000
1,367,892,066 2,106,340 2,232,840
Portfolio
6.03 6.06
32.27 5.85 5.92
1
8.01
Portfolio Duration
0.08
Barbell convexity 52.25
PVBP
Bond A Bond A
10/19/2005 10/19/2005
10/19/2012 10/19/2012
4.51% 4.51%
6.00% 5.01%
100 1002 2
0 0
91.58 97.08
156,900,000 2,300,000 2,300,000
273,944,794 2,106,340 2,232,840
Portfolio
6.03 6.06
23.52 5.85 5.92
1
5.01
Portfolio Duration0.06
diff of barbel n bullet
0.1 10.41 0
Pricechangedue toduration

8/7/2019 FIS project
http://slidepdf.com/reader/full/fis-project 40/55
31.42 Bullet convexity
8/7/2019 FIS project
http://slidepdf.com/reader/full/fis-project 41/55
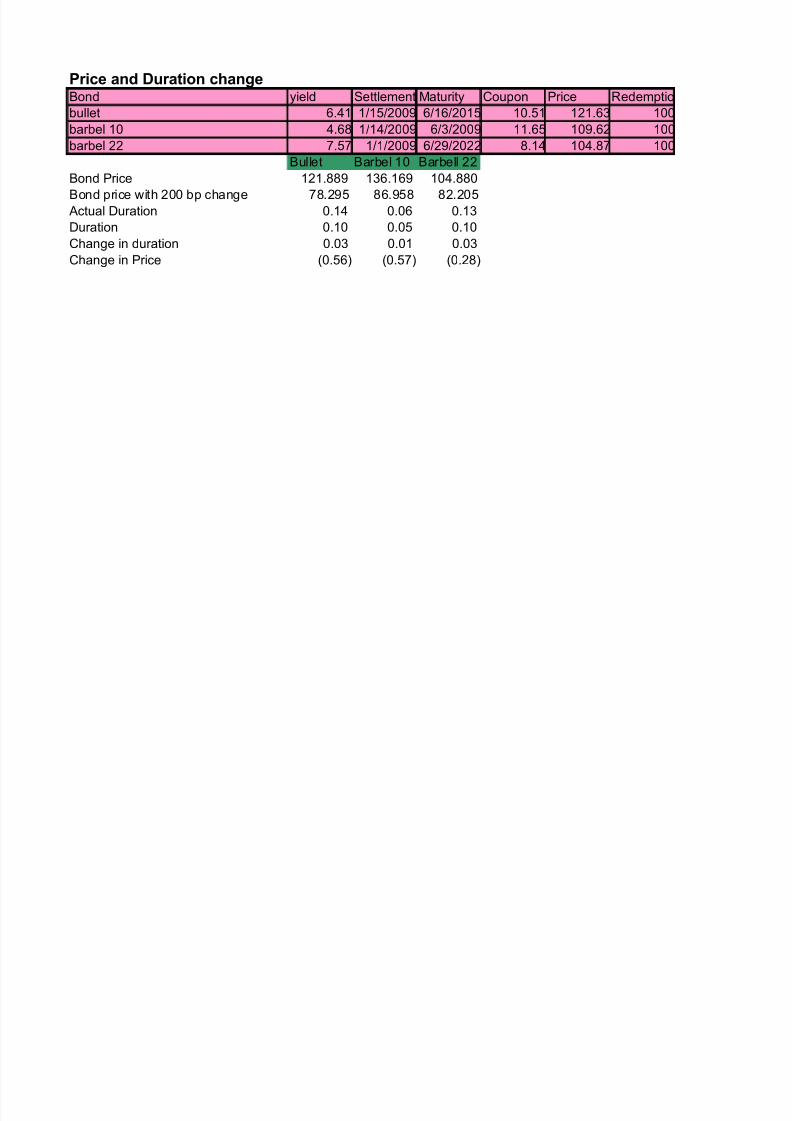
Price and Duration changeBond yield Settlement Maturity Coupon Price Redemptio
bullet 6.41 1/15/2009 6/16/2015 10.51 121.63 100
barbel 10 4.68 1/14/2009 6/3/2009 11.65 109.62 100
barbel 22 7.57 1/1/2009 6/29/2022 8.14 104.87 100
Bullet Barbel 10 Barbell 22
Bond Price 121.889 136.169 104.880
Bond price with 200 bp change 78.295 86.958 82.205Actual Duration 0.14 0.06 0.13
Duration 0.10 0.05 0.10
Change in duration 0.03 0.01 0.03
Change in Price (0.56) (0.57) (0.28)

8/7/2019 FIS project
http://slidepdf.com/reader/full/fis-project 42/55
Basis Freq
0 2
0 2
0 2

8/7/2019 FIS project
http://slidepdf.com/reader/full/fis-project 43/55
Bond yield Settlement Maturity Coupon Price Redemptio
bullet 6.41 1/15/2009 6/16/2015 10.51 121.63 100
barbel 10 4.68 1/14/2009 6/3/2009 11.65 109.62 100
barbel 22 7.57 1/1/2009 6/29/2022 8.14 104.87 100
Parallel Yield cu
Bullet barbel-10
yield chan Yield Bullet TR Price +Couprice Change y price Price +Cou
6 12.41 -0.45 36.98 31.72 5.73 107.52 113.34
5.75 12.16 -0.43 39.04 33.78 5.48 113.69 119.51
5.5 11.91 -0.42 41.17 35.92 5.23 120.24 126.07
5.25 11.66 -0.4 43.4 38.14 5.21 120.92 126.74
5 11.41 -0.39 45.72 40.46 5.18 121.6 127.42
4.75 11.16 -0.37 48.13 42.88 5.16 122.28 128.11
4.5 10.91 -0.35 50.65 45.4 5.13 122.97 128.80
4.25 10.66 -0.34 53.28 48.03 5.11 123.67 129.494 10.41 -0.32 56.03 50.78 5.08 124.37 130.19
3.75 10.16 -0.3 58.91 53.65 5.06 125.07 130.89
3.5 9.91 -0.29 61.93 56.67 5.03 125.78 131.60
3.25 9.66 -0.27 65.09 59.83 5.01 126.49 132.31
3 9.41 -0.25 68.41 63.15 4.98 127.21 133.03
2.75 9.16 -0.23 71.9 66.64 4.96 127.93 133.75
2.5 8.91 -0.21 75.58 70.32 4.93 128.65 134.48
2.25 8.66 -0.19 79.46 74.2 4.91 129.38 135.21
2 8.41 -0.17 83.55 78.29 4.88 130.12 135.94
1.75 8.16 -0.15 87.89 82.63 4.86 130.86 136.68
1.5 7.91 -0.13 92.48 87.22 4.83 131.6 137.42
1.25 7.66 -0.11 97.36 92.1 4.81 132.35 138.171 7.41 -0.08 102.55 97.29 4.78 133.1 138.93
0.75 7.16 -0.06 108.08 102.83 4.76 133.86 139.69
0.5 6.91 -0.03 114 108.74 4.73 134.63 140.45
0.25 6.66 -0.01 120.34 115.08 4.71 135.39 141.22
0 6.41 0.02 127.15 121.89 4.68 136.17 141.99
-0.25 6.16 0.05 134.48 129.22 4.43 144.2 150.03
-0.5 5.91 0.08 142.41 137.15 4.18 152.81 158.63
-0.75 5.66 0.11 151 145.75 3.93 162.05 167.88
-1 5.41 0.15 160.36 155.1 3.68 172.02 177.84
-1.25 5.16 0.18 170.58 165.32 3.43 182.79 188.61
-1.5 4.91 0.22 181.8 176.54 3.18 194.48 200.30
-1.75 4.66 0.26 194.17 188.91 2.93 207.21 213.03-2 4.41 0.31 207.89 202.63 2.68 221.14 226.96
-2.25 4.16 0.35 223.19 217.93 2.43 236.45 242.28
-2.5 3.91 0.41 240.37 235.12 2.18 253.38 259.20
-2.75 3.66 0.46 259.82 254.56 1.93 272.19 278.02
-3 3.41 0.52 282.02 276.76 1.68 293.26 299.08
-3.25 3.16 0.59 307.61 302.35 1.43 317.02 322.84
-3.5 2.91 0.67 337.46 332.2 1.18 344.06 349.89-1
-0.5
0
0.5
1
1.5
2

8/7/2019 FIS project
http://slidepdf.com/reader/full/fis-project 44/55
-3.75 2.66 0.75 372.74 367.49 0.93 375.15 380.97
-4 2.41 0.85 415.14 409.88 0.68 411.32 417.15
-4.25 2.16 0.96 467.07 461.82 0.43 454.01 459.83
-4.5 1.91 1.09 532.24 526.99 0.18 505.26 511.08
Flattening of yie
0.25 -0.25
Bullet barbel-10yield chan Yield Bullet TR Price +Couprice Change y price Price +Cou
6 12.41 -0.45 36.98 31.72 10.68 31.24 37.07
5.75 12.16 -0.43 39.04 33.78 10.43 33.78 39.61
5.5 11.91 -0.42 41.17 35.92 10.18 36.41 42.24
5.25 11.66 -0.4 43.4 38.14 9.93 39.14 44.97
5 11.41 -0.39 45.72 40.46 9.68 41.98 47.80
4.75 11.16 -0.37 48.13 42.88 9.43 44.92 50.74
4.5 10.91 -0.35 50.65 45.4 9.18 47.98 53.80
4.25 10.66 -0.34 53.28 48.03 8.93 51.16 56.98
4 10.41 -0.32 56.03 50.78 8.68 54.47 60.293.75 10.16 -0.3 58.91 53.65 8.43 57.92 63.75
3.5 9.91 -0.29 61.93 56.67 8.18 61.53 67.35
3.25 9.66 -0.27 65.09 59.83 7.93 65.29 71.12
3 9.41 -0.25 68.41 63.15 7.68 69.23 75.05
2.75 9.16 -0.23 71.9 66.64 7.43 73.35 79.17
2.5 8.91 -0.21 75.58 70.32 7.18 77.66 83.49
2.25 8.66 -0.19 79.46 74.2 6.93 82.2 88.02
2 8.41 -0.17 83.55 78.29 6.68 86.96 92.78
1.75 8.16 -0.15 87.89 82.63 6.43 91.97 97.79
1.5 7.91 -0.13 92.48 87.22 6.18 97.25 103.08
1.25 7.66 -0.11 97.36 92.1 5.93 102.83 108.65
1 7.41 -0.08 102.55 97.29 5.68 108.72 114.550.75 7.16 -0.06 108.08 102.83 5.43 114.97 120.79
0.5 6.91 -0.03 114 108.74 5.18 121.6 127.42
0.25 6.66 -0.01 120.34 115.08 4.93 128.65 134.48
0 6.41 0.02 127.15 121.89 4.68 136.17 141.99
-0.25 6.16 0.05 134.48 129.22 4.43 144.2 150.03
-0.5 5.91 0.08 142.41 137.15 4.18 152.81 158.63
-0.75 5.66 0.11 151 145.75 3.93 162.05 167.88
-1 5.41 0.15 160.36 155.1 3.68 172.02 177.84
-1.25 5.16 0.18 170.58 165.32 3.43 182.79 188.61
-1.5 4.91 0.22 181.8 176.54 3.18 194.48 200.30
-1.75 4.66 0.26 194.17 188.91 2.93 207.21 213.03
-2 4.41 0.31 207.89 202.63 2.68 221.14 226.96-2.25 4.16 0.35 223.19 217.93 2.43 236.45 242.28
-2.5 3.91 0.41 240.37 235.12 2.18 253.38 259.20
-2.75 3.66 0.46 259.82 254.56 1.93 272.19 278.02
-3 3.41 0.52 282.02 276.76 1.68 293.26 299.08
-3.25 3.16 0.59 307.61 302.35 1.43 317.02 322.84
-3.5 2.91 0.67 337.46 332.2 1.18 344.06 349.89
-3.75 2.66 0.75 372.74 367.49 0.93 375.15 380.97
1 3 5 7 9 11 13 15 17 19 21 23 25 27 2
12
34
56
7
-0.5
0
0.5
1
1.5
2
2.5
8/7/2019 FIS project
http://slidepdf.com/reader/full/fis-project 45/55
-4 2.41 0.85 415.14 409.88 0.68 411.32 417.15
-4.25 2.16 0.96 467.07 461.82 0.43 454.01 459.83
-4.5 1.91 1.09 532.24 526.99 0.18 505.26 511.08
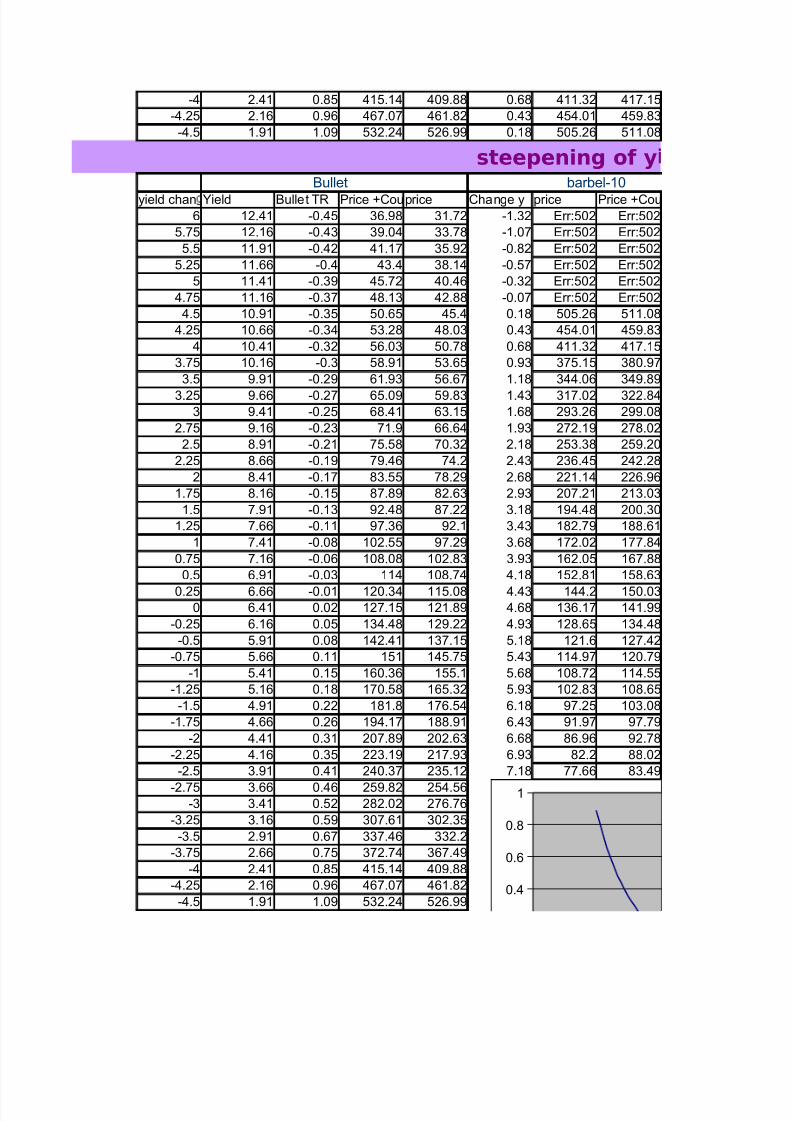
steepening of yBullet barbel-10
yield chan Yield Bullet TR Price +Couprice Change y price Price +Cou6 12.41 -0.45 36.98 31.72 -1.32 Err:502 Err:502
5.75 12.16 -0.43 39.04 33.78 -1.07 Err:502 Err:502
5.5 11.91 -0.42 41.17 35.92 -0.82 Err:502 Err:502
5.25 11.66 -0.4 43.4 38.14 -0.57 Err:502 Err:502
5 11.41 -0.39 45.72 40.46 -0.32 Err:502 Err:502
4.75 11.16 -0.37 48.13 42.88 -0.07 Err:502 Err:502
4.5 10.91 -0.35 50.65 45.4 0.18 505.26 511.08
4.25 10.66 -0.34 53.28 48.03 0.43 454.01 459.83
4 10.41 -0.32 56.03 50.78 0.68 411.32 417.15
3.75 10.16 -0.3 58.91 53.65 0.93 375.15 380.97
3.5 9.91 -0.29 61.93 56.67 1.18 344.06 349.89
3.25 9.66 -0.27 65.09 59.83 1.43 317.02 322.843 9.41 -0.25 68.41 63.15 1.68 293.26 299.08
2.75 9.16 -0.23 71.9 66.64 1.93 272.19 278.02
2.5 8.91 -0.21 75.58 70.32 2.18 253.38 259.20
2.25 8.66 -0.19 79.46 74.2 2.43 236.45 242.28
2 8.41 -0.17 83.55 78.29 2.68 221.14 226.96
1.75 8.16 -0.15 87.89 82.63 2.93 207.21 213.03
1.5 7.91 -0.13 92.48 87.22 3.18 194.48 200.30
1.25 7.66 -0.11 97.36 92.1 3.43 182.79 188.61
1 7.41 -0.08 102.55 97.29 3.68 172.02 177.84
0.75 7.16 -0.06 108.08 102.83 3.93 162.05 167.88
0.5 6.91 -0.03 114 108.74 4.18 152.81 158.63
0.25 6.66 -0.01 120.34 115.08 4.43 144.2 150.030 6.41 0.02 127.15 121.89 4.68 136.17 141.99
-0.25 6.16 0.05 134.48 129.22 4.93 128.65 134.48
-0.5 5.91 0.08 142.41 137.15 5.18 121.6 127.42
-0.75 5.66 0.11 151 145.75 5.43 114.97 120.79
-1 5.41 0.15 160.36 155.1 5.68 108.72 114.55
-1.25 5.16 0.18 170.58 165.32 5.93 102.83 108.65
-1.5 4.91 0.22 181.8 176.54 6.18 97.25 103.08
-1.75 4.66 0.26 194.17 188.91 6.43 91.97 97.79
-2 4.41 0.31 207.89 202.63 6.68 86.96 92.78
-2.25 4.16 0.35 223.19 217.93 6.93 82.2 88.02
-2.5 3.91 0.41 240.37 235.12 7.18 77.66 83.49
-2.75 3.66 0.46 259.82 254.56 7.43 73.35 79.17-3 3.41 0.52 282.02 276.76 7.68 69.23 75.05
-3.25 3.16 0.59 307.61 302.35 7.93 65.29 71.12
-3.5 2.91 0.67 337.46 332.2 8.18 61.53 67.35
-3.75 2.66 0.75 372.74 367.49 8.43 57.92 63.75
-4 2.41 0.85 415.14 409.88 8.68 54.47 60.29
-4.25 2.16 0.96 467.07 461.82 8.93 51.16 56.98
-4.5 1.91 1.09 532.24 526.99 9.18 47.98 53.800.4
0.6
0.8
1

8/7/2019 FIS project
http://slidepdf.com/reader/full/fis-project 46/55
12
34
56
78
910
1112
1
-0.4
-0.2
0
0.2

8/7/2019 FIS project
http://slidepdf.com/reader/full/fis-project 47/55
Basis Freq
0 2
0 2
0 2
ve shift
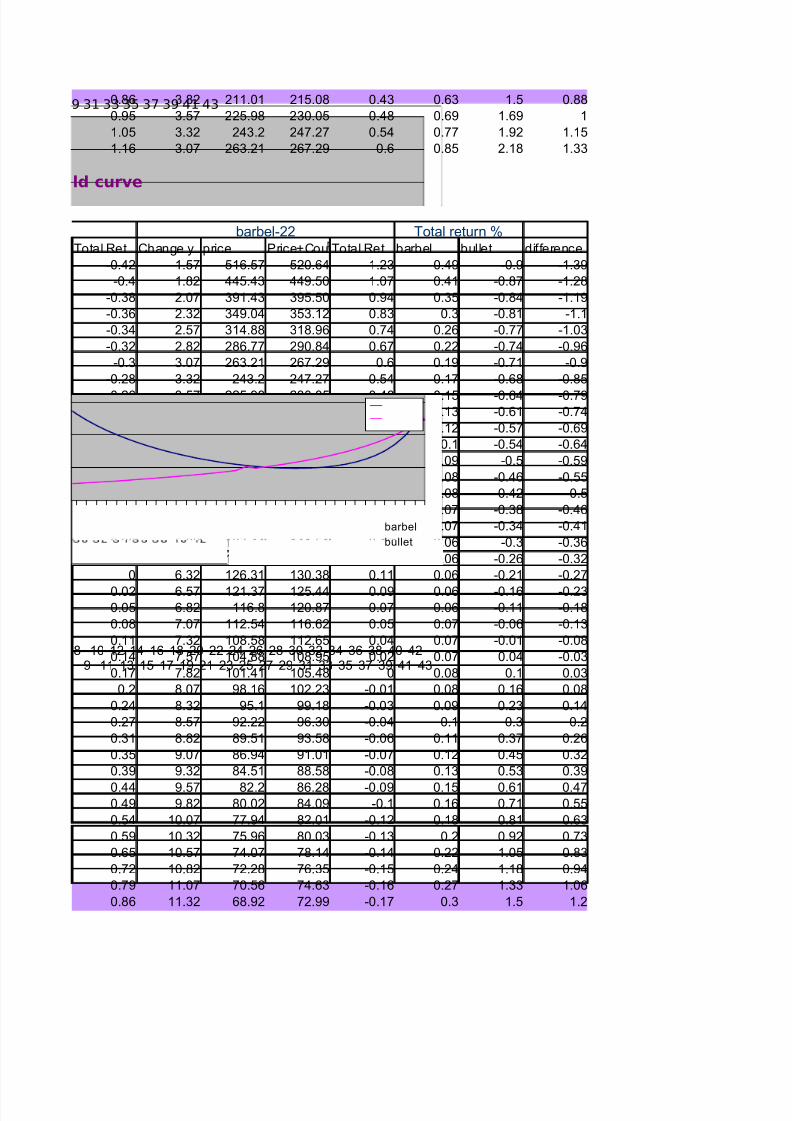
barbel-22 Total return %
Total Ret Change y price Price+Cou Total Ret barbel bullet difference
0.02 13.57 56.85 60.92 -0.24 -0.12 -0.9 -0.77
0.04 13.32 57.99 62.06 -0.23 -0.11 -0.87 -0.76
0.07 13.07 59.17 63.24 -0.22 -0.09 -0.84 -0.75
0.08 12.82 60.4 64.47 -0.22 -0.09 -0.81 -0.72
0.08 12.57 61.68 65.75 -0.21 -0.08 -0.77 -0.69
0.08 12.32 63.01 67.08 -0.2 -0.07 -0.74 -0.67
0.08 12.07 64.39 68.47 -0.19 -0.07 -0.71 -0.64
0.09 11.82 65.84 69.91 -0.18 -0.06 -0.68 -0.610.09 11.57 67.34 71.41 -0.17 -0.06 -0.64 -0.59
0.09 11.32 68.92 72.99 -0.17 -0.05 -0.61 -0.56
0.1 11.07 70.56 74.63 -0.16 -0.04 -0.57 -0.53
0.1 10.82 72.28 76.35 -0.15 -0.04 -0.54 -0.5
0.1 10.57 74.07 78.14 -0.14 -0.03 -0.5 -0.47
0.1 10.32 75.96 80.03 -0.13 -0.02 -0.46 -0.44
0.11 10.07 77.94 82.01 -0.12 -0.02 -0.42 -0.41
0.11 9.82 80.02 84.09 -0.1 -0.01 -0.38 -0.38
0.11 9.57 82.2 86.28 -0.09 0 -0.34 -0.34
0.12 9.32 84.51 88.58 -0.08 0.01 -0.3 -0.31
0.12 9.07 86.94 91.01 -0.07 0.02 -0.26 -0.27
0.12 8.82 89.51 93.58 -0.06 0.02 -0.21 -0.240.13 8.57 92.22 96.30 -0.04 0.03 -0.16 -0.2
0.13 8.32 95.1 99.18 -0.03 0.04 -0.11 -0.16
0.13 8.07 98.16 102.23 -0.01 0.05 -0.06 -0.12
0.14 7.82 101.41 105.48 0 0.06 -0.01 -0.07
0.14 7.57 104.88 108.95 0.02 0.07 0.04 -0.03
0.17 7.32 108.58 112.65 0.04 0.1 0.1 0.01
0.2 7.07 112.54 116.62 0.05 0.12 0.16 0.04
0.24 6.82 116.8 120.87 0.07 0.15 0.23 0.08
0.27 6.57 121.37 125.44 0.09 0.17 0.3 0.12
0.31 6.32 126.31 130.38 0.11 0.2 0.37 0.17
0.35 6.07 131.65 135.72 0.14 0.23 0.45 0.21
0.39 5.82 137.44 141.51 0.16 0.27 0.53 0.260.44 5.57 143.76 147.83 0.19 0.3 0.61 0.31
0.49 5.32 150.67 154.74 0.21 0.34 0.71 0.37
0.54 5.07 158.25 162.32 0.24 0.38 0.81 0.44
0.59 4.82 166.62 170.69 0.28 0.42 0.92 0.51
0.65 4.57 175.9 179.97 0.31 0.46 1.05 0.58
0.72 4.32 186.26 190.33 0.35 0.51 1.18 0.67
0.79 4.07 197.88 201.95 0.39 0.57 1.33 0.76
barbelbullet
8/7/2019 FIS project
http://slidepdf.com/reader/full/fis-project 48/55
0.86 3.82 211.01 215.08 0.43 0.63 1.5 0.88
0.95 3.57 225.98 230.05 0.48 0.69 1.69 1
1.05 3.32 243.2 247.27 0.54 0.77 1.92 1.15
1.16 3.07 263.21 267.29 0.6 0.85 2.18 1.33
ld curve
barbel-22 Total return %Total Ret Change y price Price+Cou Total Ret barbel bullet difference
-0.42 1.57 516.57 520.64 1.23 0.49 -0.9 -1.39
-0.4 1.82 445.43 449.50 1.07 0.41 -0.87 -1.28
-0.38 2.07 391.43 395.50 0.94 0.35 -0.84 -1.19
-0.36 2.32 349.04 353.12 0.83 0.3 -0.81 -1.1
-0.34 2.57 314.88 318.96 0.74 0.26 -0.77 -1.03
-0.32 2.82 286.77 290.84 0.67 0.22 -0.74 -0.96
-0.3 3.07 263.21 267.29 0.6 0.19 -0.71 -0.9
-0.28 3.32 243.2 247.27 0.54 0.17 -0.68 -0.85
-0.26 3.57 225.98 230.05 0.48 0.15 -0.64 -0.79-0.24 3.82 211.01 215.08 0.43 0.13 -0.61 -0.74
-0.22 4.07 197.88 201.95 0.39 0.12 -0.57 -0.69
-0.19 4.32 186.26 190.33 0.35 0.1 -0.54 -0.64
-0.17 4.57 175.9 179.97 0.31 0.09 -0.5 -0.59
-0.15 4.82 166.62 170.69 0.28 0.08 -0.46 -0.55
-0.13 5.07 158.25 162.32 0.24 0.08 -0.42 -0.5
-0.1 5.32 150.67 154.74 0.21 0.07 -0.38 -0.46
-0.08 5.57 143.76 147.83 0.19 0.07 -0.34 -0.41
-0.06 5.82 137.44 141.51 0.16 0.06 -0.3 -0.36
-0.03 6.07 131.65 135.72 0.14 0.06 -0.26 -0.32
0 6.32 126.31 130.38 0.11 0.06 -0.21 -0.27
0.02 6.57 121.37 125.44 0.09 0.06 -0.16 -0.230.05 6.82 116.8 120.87 0.07 0.06 -0.11 -0.18
0.08 7.07 112.54 116.62 0.05 0.07 -0.06 -0.13
0.11 7.32 108.58 112.65 0.04 0.07 -0.01 -0.08
0.14 7.57 104.88 108.95 0.02 0.07 0.04 -0.03
0.17 7.82 101.41 105.48 0 0.08 0.1 0.03
0.2 8.07 98.16 102.23 -0.01 0.08 0.16 0.08
0.24 8.32 95.1 99.18 -0.03 0.09 0.23 0.14
0.27 8.57 92.22 96.30 -0.04 0.1 0.3 0.2
0.31 8.82 89.51 93.58 -0.06 0.11 0.37 0.26
0.35 9.07 86.94 91.01 -0.07 0.12 0.45 0.32
0.39 9.32 84.51 88.58 -0.08 0.13 0.53 0.39
0.44 9.57 82.2 86.28 -0.09 0.15 0.61 0.470.49 9.82 80.02 84.09 -0.1 0.16 0.71 0.55
0.54 10.07 77.94 82.01 -0.12 0.18 0.81 0.63
0.59 10.32 75.96 80.03 -0.13 0.2 0.92 0.73
0.65 10.57 74.07 78.14 -0.14 0.22 1.05 0.83
0.72 10.82 72.28 76.35 -0.15 0.24 1.18 0.94
0.79 11.07 70.56 74.63 -0.16 0.27 1.33 1.06
0.86 11.32 68.92 72.99 -0.17 0.3 1.5 1.2
9 31 33 35 37 39 41 43
8910
1112
1314
1516
1718
1920
2122
2324
2526
2728
2930
3132
3334
3536
3738
3940
4142
43
barbel
bullet

8/7/2019 FIS project
http://slidepdf.com/reader/full/fis-project 49/55
0.95 11.57 67.34 71.41 -0.17 0.33 1.69 1.36
1.05 11.82 65.84 69.91 -0.18 0.37 1.92 1.55
1.16 12.07 64.39 68.47 -0.19 0.41 2.18 1.77
eld curvebarbel-22 Total return %
Total Ret Change y price Price+Cou Total Ret barbel bullet differenceErr:502 13.57 56.85 60.92 -0.24 Err:502 -0.45 Err:502
Err:502 13.32 57.99 62.06 -0.23 Err:502 -0.43 Err:502
Err:502 13.07 59.17 63.24 -0.22 Err:502 -0.42 Err:502
Err:502 12.82 60.4 64.47 -0.22 Err:502 -0.4 Err:502
Err:502 12.57 61.68 65.75 -0.21 Err:502 -0.39 Err:502
Err:502 12.32 63.01 67.08 -0.2 Err:502 -0.37 Err:502
1.16 12.07 64.39 68.47 -0.19 0.41 -0.35 -0.77
1.05 11.82 65.84 69.91 -0.18 0.37 -0.34 -0.71
0.95 11.57 67.34 71.41 -0.17 0.33 -0.32 -0.65
0.86 11.32 68.92 72.99 -0.17 0.3 -0.3 -0.6
0.79 11.07 70.56 74.63 -0.16 0.27 -0.29 -0.55
0.72 10.82 72.28 76.35 -0.15 0.24 -0.27 -0.510.65 10.57 74.07 78.14 -0.14 0.22 -0.25 -0.47
0.59 10.32 75.96 80.03 -0.13 0.2 -0.23 -0.43
0.54 10.07 77.94 82.01 -0.12 0.18 -0.21 -0.39
0.49 9.82 80.02 84.09 -0.1 0.16 -0.19 -0.35
0.44 9.57 82.2 86.28 -0.09 0.15 -0.17 -0.32
0.39 9.32 84.51 88.58 -0.08 0.13 -0.15 -0.28
0.35 9.07 86.94 91.01 -0.07 0.12 -0.13 -0.25
0.31 8.82 89.51 93.58 -0.06 0.11 -0.11 -0.21
0.27 8.57 92.22 96.30 -0.04 0.1 -0.08 -0.18
0.24 8.32 95.1 99.18 -0.03 0.09 -0.06 -0.15
0.2 8.07 98.16 102.23 -0.01 0.08 -0.03 -0.12
0.17 7.82 101.41 105.48 0 0.08 -0.01 -0.080.14 7.57 104.88 108.95 0.02 0.07 0.02 -0.05
0.11 7.32 108.58 112.65 0.04 0.07 0.05 -0.02
0.08 7.07 112.54 116.62 0.05 0.07 0.08 0.02
0.05 6.82 116.8 120.87 0.07 0.06 0.11 0.05
0.02 6.57 121.37 125.44 0.09 0.06 0.15 0.09
0 6.32 126.31 130.38 0.11 0.06 0.18 0.12
-0.03 6.07 131.65 135.72 0.14 0.06 0.22 0.16
-0.06 5.82 137.44 141.51 0.16 0.06 0.26 0.2
-0.08 5.57 143.76 147.83 0.19 0.07 0.31 0.24
-0.1 5.32 150.67 154.74 0.21 0.07 0.35 0.28
-0.13 5.07 158.25 162.32 0.24 0.08 0.41 0.33
-0.15 4.82 166.62 170.69 0.28 0.08 0.46 0.38-0.17 4.57 175.9 179.97 0.31 0.09 0.52 0.43
-0.19 4.32 186.26 190.33 0.35 0.1 0.59 0.49
-0.22 4.07 197.88 201.95 0.39 0.12 0.67 0.55
-0.24 3.82 211.01 215.08 0.43 0.13 0.75 0.62
-0.26 3.57 225.98 230.05 0.48 0.15 0.85 0.7
-0.28 3.32 243.2 247.27 0.54 0.17 0.96 0.79
-0.3 3.07 263.21 267.29 0.6 0.19 1.09 0.9

8/7/2019 FIS project
http://slidepdf.com/reader/full/fis-project 50/55
1415
1617
1819
2021
2223
2425
2627
2829
3031
3233
3435
3637
3839
4041
4243
bullet
8/7/2019 FIS project
http://slidepdf.com/reader/full/fis-project 51/55
Yield chg Parallel Flattening Steepening
6 -0.71 -1.23 #NUM!
5.75 -0.7 -1.14 #NUM!
5.5 -0.69 -1.05 #NUM!
5.25 -0.67 -0.98 #NUM!5 -0.64 -0.91 #NUM!
4.75 -0.61 -0.85 #NUM!
4.5 -0.59 -0.8 -0.77
4.25 -0.56 -0.74 -0.71
4 -0.53 -0.69 -0.65
3.75 -0.51 -0.65 -0.59
3.5 -0.48 -0.6 -0.54
3.25 -0.45 -0.55 -0.5
3 -0.42 -0.51 -0.45
2.75 -0.39 -0.47 -0.41
2.5 -0.36 -0.42 -0.37
2.25 -0.32 -0.38 -0.332 -0.29 -0.34 -0.29
1.75 -0.26 -0.3 -0.25
1.5 -0.22 -0.25 -0.22
1.25 -0.19 -0.21 -0.18
1 -0.15 -0.17 -0.14
0.75 -0.11 -0.12 -0.11
0.5 -0.07 -0.07 -0.07
0.25 -0.02 -0.03 -0.04
0 0.02 0.02 0
-0.25 0.05 0.07 0.03
-0.5 0.09 0.12 0.07
-0.75 0.12 0.18 0.11-1 0.16 0.23 0.15
-1.25 0.2 0.29 0.19
-1.5 0.24 0.36 0.23
-1.75 0.29 0.42 0.27
-2 0.34 0.5 0.31
-2.25 0.4 0.57 0.36
-2.5 0.46 0.66 0.41
-2.75 0.52 0.75 0.46
-3 0.6 0.84 0.51
-3.25 0.68 0.95 0.57
-3.5 0.77 1.07 0.64
-3.75 0.88 1.21 0.71-4 1.01 1.37 0.8
-4.25 1.16 1.55 0.89
-4.5 1.34 1.77 1.01

8/7/2019 FIS project
http://slidepdf.com/reader/full/fis-project 52/55
Interest Change
Interest rate risk increases as the duration increases
Maturity(yrs) 5.5
Price: 100Coupon Rate(BEY) 11.47%
Face Value 1,305,500,000
Purchase Price 1,194,963,179
YTM 4.70%
Interest rate Interest Interest on Price at
Interest end of 5 yrs
16.00% 823,574,675 422,680,046 1,305,500,000
15.00% 823,574,675 389,934,087 1,305,500,000
14.00% 823,574,675 358,150,114 1,305,500,000
13.00% 823,574,675 327,300,556 1,305,500,000
12.00% 823,574,675 297,358,572 1,305,500,000
11.47% 823,574,675 281,848,336 1,305,500,00011.00% 823,574,675 268,298,037 1,305,500,000
10.00% 823,574,675 240,093,518 1,305,500,000
9.00% 823,574,675 212,720,264 1,305,500,000
8.00% 823,574,675 186,154,187 1,305,500,000
7.00% 823,574,675 160,371,845 1,305,500,000
6.00% 823,574,675 135,350,432 1,305,500,000
Maturity (yrs) 15
Price: 100
Coupon Rate= 10.48
Face Value= 156,900,000
Purchase Price 273,944,794YTM 0.06
Yield Interest Interest on Price at
(BEY) Interest end of 5yrs
16.00% 24,664,680,000 68,471,791,716 39,960,228,602
15.00% 24,664,680,000 60,345,759,178 38,386,804,006
14.00% 24,664,680,000 52,996,822,241 36,917,031,772
13.00% 24,664,680,000 46,348,932,725 35,545,599,380
12.50% 24,664,680,000 43,266,170,124 34,895,195,093
12.00% 24,664,680,000 40,333,482,146 34,267,538,871
11.00% 24,664,680,000 34,888,582,827 33,078,212,007
10.00% 24,664,680,000 29,958,417,108 31,973,296,7069.00% 24,664,680,000 25,492,648,360 30,948,774,779
8.00% 24,664,680,000 21,445,888,081 30,000,920,968
7.00% 24,664,680,000 17,777,213,860 29,126,293,364
6.00% 24,664,680,000 14,449,733,475 28,321,725,239
Maturity (yrs) 22
Price: 1,367,892,066
Coupon Rate= 8.140%

8/7/2019 FIS project
http://slidepdf.com/reader/full/fis-project 53/55
YTM 7.50%
Face Value= 650,000,000
Yield Interest Interest on Price at
(BEY) Interest end of 5.5yrs
16.00% 291,005,000 9,152,097,878 341,491,154
15.00% 291,005,000 7,856,261,742 365,069,317
14.00% 291,005,000 6,749,222,120 391,789,64013.00% 291,005,000 5,802,949,872 422,213,304
12.50% 291,005,000 5,382,502,417 439,020,428
12.00% 291,005,000 4,993,593,733 457,017,982
11.00% 291,005,000 4,300,859,945 497,024,278
10.00% 291,005,000 3,707,483,213 543,228,535
9.00% 291,005,000 3,198,775,695 596,843,619
8.00% 291,005,000 2,762,242,660 659,349,723
7.00% 291,005,000 2,387,255,055 732,557,741
6.00% 291,005,000 2,064,770,663 818,688,475
8/7/2019 FIS project
http://slidepdf.com/reader/full/fis-project 54/55
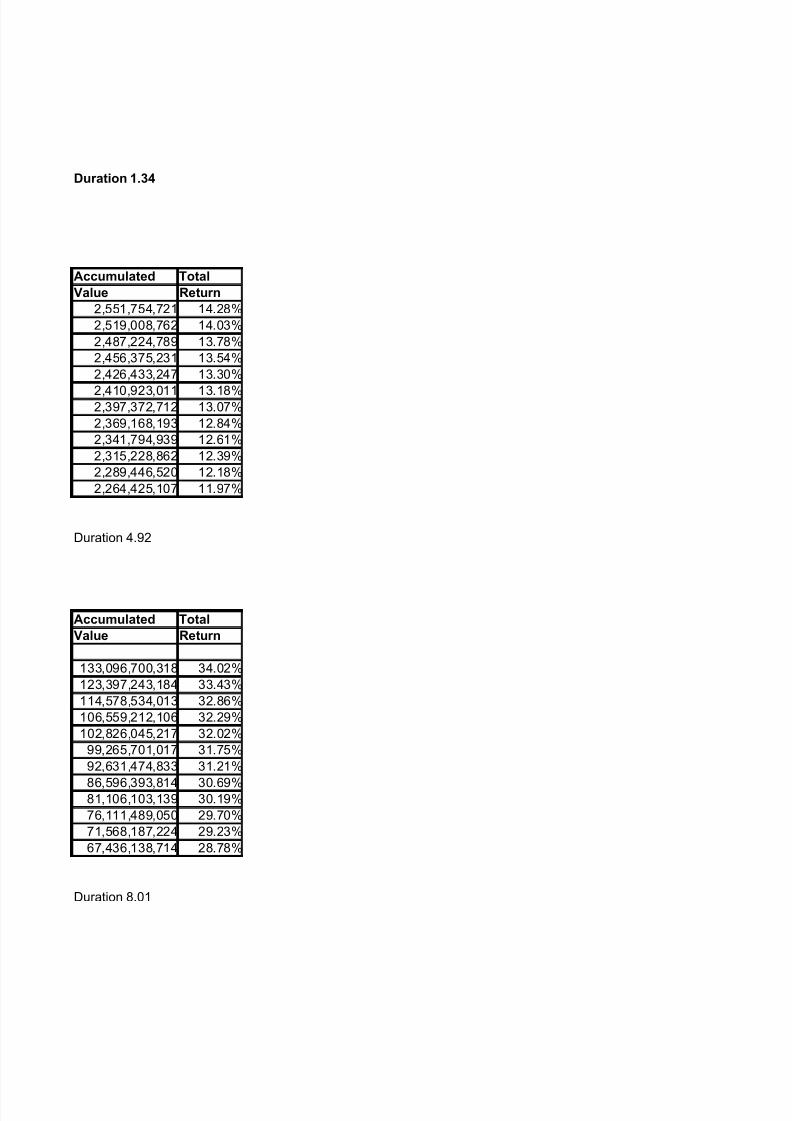
Duration 1.34
Accumulated Total
Value Return
2,551,754,721 14.28%
2,519,008,762 14.03%
2,487,224,789 13.78%
2,456,375,231 13.54%
2,426,433,247 13.30%
2,410,923,011 13.18%2,397,372,712 13.07%
2,369,168,193 12.84%
2,341,794,939 12.61%
2,315,228,862 12.39%
2,289,446,520 12.18%
2,264,425,107 11.97%
Duration 4.92
Accumulated Total
Value Return
133,096,700,318 34.02%
123,397,243,184 33.43%
114,578,534,013 32.86%
106,559,212,106 32.29%
102,826,045,217 32.02%
99,265,701,017 31.75%
92,631,474,833 31.21%
86,596,393,814 30.69%81,106,103,139 30.19%
76,111,489,050 29.70%
71,568,187,224 29.23%
67,436,138,714 28.78%
Duration 8.01

8/7/2019 FIS project
http://slidepdf.com/reader/full/fis-project 55/55
Accumulated Total
Value Return
9,784,594,032 42.13%
8,512,336,059 39.08%
7,432,016,760 36.15%6,516,168,176 33.34%
6,112,527,845 31.99%
5,741,616,715 30.68%
5,088,889,224 28.16%
4,541,716,748 25.81%
4,086,624,315 23.65%
3,712,597,383 21.71%
3,410,817,795 20.01%
3,174,464,138 18.58%