Mamdani fis
12
An easy-to-use MATLAB program (MamLand) for the assessment of landslide susceptibility using a Mamdani fuzzy algorithm $ A. Akgun a , E.A. Sezer b , H.A. Nefeslioglu c , C. Gokceoglu d,n , B. Pradhan e a Middle East Technical University, Mining Engineering Department, Ankara, Turkey b Hacettepe University, Computer Engineering Department, 06800 Beytepe, Ankara, Turkey c General Directorate of Mineral Research and Exploration, Department of Geological Research, 06520 Balgat, Ankara, Turkey d Hacettepe University, Geological Engineering Department, 06800 Beytepe, Ankara, Turkey e Institute of Advanced Technology, Spatial and Numerical Modelling Laboratory, University Putra Malaysia, 43400 Serdang, Malaysia article info Article history: Received 26 January 2011 Received in revised form 13 April 2011 Accepted 15 April 2011 Keywords: Mamdani fuzzy inference system Landslide susceptibility Geographical Information Systems (GIS) Sinop (Turkey) abstract In this study, landslide susceptibility mapping using a completely expert opinion-based approach was applied for the Sinop (northern Turkey) region and its close vicinity. For this purpose, an easy-to-use program, ‘‘MamLand,’’ was developed for the construction of a Mamdani fuzzy inference system and employed in MATLAB. Using this newly developed program, it is possible to construct a landslide susceptibility map based on expert opinion. In this study, seven conditioning parameters characterising topographical, geological, and environmental conditions were included in the FIS. A landslide inventory dataset including 351 landslide locations was obtained for the study area. After completing the data production stage of the study, the data were processed using a soft computing approach, i.e., a Mamdani-type fuzzy inference system. In this system, only landslide conditioning data were assessed, and landslide inventory data were not included in the assessment approach. Thus, a file depicting the landslide susceptibility degrees for the study area was produced using the Mamdani FIS. These degrees were then exported into a GIS environment, and a landslide susceptibility map was produced and assessed in point of statistical interpretation. For this purpose, the obtained landslide susceptibility map and the landslide inventory data were compared, and an area under curve (AUC) obtained from receiver operating characteristics (ROC) assessment was carried out. From this assessment, the AUC value was found to be 0.855, indicating that this landslide susceptibility map, which was produced in a data-independent manner, was successful. & 2011 Elsevier Ltd. All rights reserved. 1. Introduction According to a review of the international landslide literature (Gokceoglu and Sezer, 2009), the most frequently used terms in this field are ‘‘landslide susceptibility’’, and ‘‘Geographical Information Systems, GIS.’’ Several possible reasons mainly include: (a) developments in computer techniques and Geogra- phical Information Systems; (b) increasing awareness of the socio-economic significance of landslides; and (c) the complex nature of landslides. Due to the complex nature of landslides, several methods have been applied for the assessment of land- slide susceptibility at a medium scale. In general, these methods can be classified into three main groups: statistical (e.g., Can et al., 2005; Gokceoglu et al., 2005; Lee, 2005; Clerici et al., 2006; Duman et al., 2006; Pradhan et al., 2006, 2008; Lee and Pradhan, 2006; Akgun and Bulut, 2007; Akgun et al., 2008; Tunusluoglu et al., 2008; Lamelas et al., 2008; Gorum et al., 2008; Turer et al., 2008; Nefeslioglu et al., 2008a; Nefeslioglu and Gokceoglu, 2011), soft computing (e.g., Ercanoglu and Gokceoglu, 2002, 2004; Arora et al., 2004; Lee et al., 2004; Ercanoglu, 2005; Lui et al., 2006; Kanungo et al., 2006; Melchiorre et al., 2008; Nefeslioglu et al., 2008b, 2010; Pradhan et al., 2009, 2010; Caniani et al., 2008; Yilmaz, 2009; Bedarnik et al., 2010; Pradhan, 2010; Sezer et al., 2011), and the combination of index maps (e.g., Anbalagan and Singh, 1996; Gokceoglu and Aksoy, 1996; Turrini and Visintainer, 1998; Ayenew and Barbieri, 2005). In the literature of this field, it is possible to find attempts to assess landslide susceptibility based on expert opinion (Juang et al., 1992; Saboya et al., 2006; Ercanoglu et al., 2008) without constructing an inference system. However, all of the available methods for landslide assessment at a medium scale ( 1:25,000) are associated with uncertainties arising from a lack of knowledge and high variability (Ercanoglu and Gokceoglu, 2002). For these reasons, certain generalizations Contents lists available at ScienceDirect journal homepage: www.elsevier.com/locate/cageo Computers & Geosciences 0098-3004/$ - see front matter & 2011 Elsevier Ltd. All rights reserved. doi:10.1016/j.cageo.2011.04.012 $ Code available from: http://www.iamg.org/CGEditor/index.htm. n Corresponding author. Tel.: þ903122977735; fax: þ903122992034. E-mail address: [email protected] (C. Gokceoglu). Please cite this article as: Akgun, A., et al., An easy-to-use MATLAB program (MamLand) for the assessment of landslide susceptibility using a Mamdani fuzzy algorithm. Computers & Geosciences (2011), doi:10.1016/j.cageo.2011.04.012 Computers & Geosciences ] (]]]]) ]]]–]]]
-
Upload
sapna-thakur -
Category
Documents
-
view
90 -
download
2
Transcript of Mamdani fis
Computers & Geosciences ] (]]]]) ]]]–]]]
Contents lists available at ScienceDirect
Computers & Geosciences
0098-30
doi:10.1
$Codn Corr
E-m
Pleasusing
journal homepage: www.elsevier.com/locate/cageo
An easy-to-use MATLAB program (MamLand) for the assessment of landslidesusceptibility using a Mamdani fuzzy algorithm$
A. Akgun a, E.A. Sezer b, H.A. Nefeslioglu c, C. Gokceoglu d,n, B. Pradhan e
a Middle East Technical University, Mining Engineering Department, Ankara, Turkeyb Hacettepe University, Computer Engineering Department, 06800 Beytepe, Ankara, Turkeyc General Directorate of Mineral Research and Exploration, Department of Geological Research, 06520 Balgat, Ankara, Turkeyd Hacettepe University, Geological Engineering Department, 06800 Beytepe, Ankara, Turkeye Institute of Advanced Technology, Spatial and Numerical Modelling Laboratory, University Putra Malaysia, 43400 Serdang, Malaysia
a r t i c l e i n f o
Article history:
Received 26 January 2011
Received in revised form
13 April 2011
Accepted 15 April 2011
Keywords:
Mamdani fuzzy inference system
Landslide susceptibility
Geographical Information Systems (GIS)
Sinop (Turkey)
04/$ - see front matter & 2011 Elsevier Ltd. A
016/j.cageo.2011.04.012
e available from: http://www.iamg.org/CGEd
esponding author. Tel.: þ903122977735; fax
ail address: [email protected] (C. Gokc
e cite this article as: Akgun, A., et al.a Mamdani fuzzy algorithm. Comp
a b s t r a c t
In this study, landslide susceptibility mapping using a completely expert opinion-based approach was
applied for the Sinop (northern Turkey) region and its close vicinity. For this purpose, an easy-to-use
program, ‘‘MamLand,’’ was developed for the construction of a Mamdani fuzzy inference system and
employed in MATLAB. Using this newly developed program, it is possible to construct a landslide
susceptibility map based on expert opinion. In this study, seven conditioning parameters characterising
topographical, geological, and environmental conditions were included in the FIS. A landslide inventory
dataset including 351 landslide locations was obtained for the study area. After completing the data
production stage of the study, the data were processed using a soft computing approach, i.e., a
Mamdani-type fuzzy inference system. In this system, only landslide conditioning data were assessed,
and landslide inventory data were not included in the assessment approach. Thus, a file depicting the
landslide susceptibility degrees for the study area was produced using the Mamdani FIS. These degrees
were then exported into a GIS environment, and a landslide susceptibility map was produced and
assessed in point of statistical interpretation. For this purpose, the obtained landslide susceptibility
map and the landslide inventory data were compared, and an area under curve (AUC) obtained from
receiver operating characteristics (ROC) assessment was carried out. From this assessment, the AUC
value was found to be 0.855, indicating that this landslide susceptibility map, which was produced in a
data-independent manner, was successful.
& 2011 Elsevier Ltd. All rights reserved.
1. Introduction
According to a review of the international landslide literature(Gokceoglu and Sezer, 2009), the most frequently used termsin this field are ‘‘landslide susceptibility’’, and ‘‘GeographicalInformation Systems, GIS.’’ Several possible reasons mainlyinclude: (a) developments in computer techniques and Geogra-phical Information Systems; (b) increasing awareness of thesocio-economic significance of landslides; and (c) the complexnature of landslides. Due to the complex nature of landslides,several methods have been applied for the assessment of land-slide susceptibility at a medium scale. In general, these methodscan be classified into three main groups: statistical (e.g., Can et al.,2005; Gokceoglu et al., 2005; Lee, 2005; Clerici et al., 2006;
ll rights reserved.
itor/index.htm.
: þ903122992034.
eoglu).
, An easy-to-use MATLAB pruters & Geosciences (2011)
Duman et al., 2006; Pradhan et al., 2006, 2008; Lee and Pradhan,2006; Akgun and Bulut, 2007; Akgun et al., 2008; Tunusluogluet al., 2008; Lamelas et al., 2008; Gorum et al., 2008; Turer et al.,2008; Nefeslioglu et al., 2008a; Nefeslioglu and Gokceoglu, 2011),soft computing (e.g., Ercanoglu and Gokceoglu, 2002, 2004; Aroraet al., 2004; Lee et al., 2004; Ercanoglu, 2005; Lui et al., 2006;Kanungo et al., 2006; Melchiorre et al., 2008; Nefeslioglu et al.,2008b, 2010; Pradhan et al., 2009, 2010; Caniani et al., 2008;Yilmaz, 2009; Bedarnik et al., 2010; Pradhan, 2010; Sezer et al.,2011), and the combination of index maps (e.g., Anbalagan andSingh, 1996; Gokceoglu and Aksoy, 1996; Turrini and Visintainer,1998; Ayenew and Barbieri, 2005). In the literature of this field, itis possible to find attempts to assess landslide susceptibilitybased on expert opinion (Juang et al., 1992; Saboya et al., 2006;Ercanoglu et al., 2008) without constructing an inference system.However, all of the available methods for landslide assessment ata medium scale (�1:25,000) are associated with uncertaintiesarising from a lack of knowledge and high variability (Ercanogluand Gokceoglu, 2002). For these reasons, certain generalizations
ogram (MamLand) for the assessment of landslide susceptibility, doi:10.1016/j.cageo.2011.04.012

A. Akgun et al. / Computers & Geosciences ] (]]]]) ]]]–]]]2
and simplifications are applied during data-driven analyses forlandslide susceptibility mapping at a medium scale. Additionally,these data-driven methods do not require an expert opinion.The data-driven methods include a training phase. After training,testing, and validation stages are employed for assessing the qualityof the model. There are a number of disadvantages associated withthis type of process. First, for selection of the training data and themodeling the system uses different training sets. Second, the resultsproduced are dependent on the dataset employed. Third, themethods used, such as decision trees, support vector machines, orartificial neural networks, are black box approaches, and the user iscompletely isolated from the learning stage. To increase the role ofexpert opinion in such methods and to provide new insight relatedto reusable model production for landslide susceptibility assess-ment, the Mamdani fuzzy inference system (FIS) appears to be apotentially suitable approach.
FIS are capable of reducing uncertainties when solving com-plex problems, and the advantages of FIS are summarized byAlvarez Grima (2000) as follows:
(a)
Plus
FIS allows explicit expression of knowledge of the system viafuzzy ‘‘if–then’’ rules;
(b)
FIS deals with the subjective uncertainty (fuzziness, vague-ness, and imprecision) inherent in the way experts approachtheir problems;(c)
FIS can combine numerical and categorical data; and (d) FIS provides a sound mathematical basis.(2)
In the last decade, the Mamdani FIS has been used extensivelyto solve complex and nonlinear problems of engineering geology.An interesting and perhaps the most attractive characteristic offuzzy models compared with other methods commonly used ingeosciences, such as statistics, is that they are able to describesuch problems in a transparent way (Setnes et al., 1998).A Mamdani FIS (Mamdani and Assilian, 1975) is a transparentand expert opinion-based system. Although several studies usingthis type of system (i.e., Den Hartog et al., 1997; Alvarez Grima andBabuska, 1999; Gokceoglu, 2002; Kayabasi et al., 2003; Sonmezet al., 2003, 2004; Nefeslioglu et al., 2003, 2006; Gokceoglu andZorlu, 2004; Gokceoglu et al., 2009a, b; Yagiz and Gokceoglu, 2010)have been published related to various branches of engineeringgeology, a Mamdani FIS has been applied for a limited number oflandslide susceptibility assessments to date (Lee and Juang, 1992;Juang et al., 1992; Saboya et al., 2006). Lee and Juang (1992) andJuang et al. (1992) proposed a quantitative assessment method toevaluate the slope failure potential. Using fuzzy sets and linguisticrules, they (Lee and Juang, 1992; Juang et al., 1992) assessed theslope failure potential of relatively large areas in Hong Kong. Morethan 10 years later, Saboya et al. (2006) used the Mamdani FIS forassessment of failure susceptibility of soil slopes. Saboya et al.(2006) constructed a Mamdani FIS by considering the opinions ofthe experts. According to the authors (Saboya et al., 2006), theconception of intelligent models by means of fuzzy logic ingeotechnical engineering is quite appropriate as long as in thisexpertise area, the judgement, induction, deduction, and a sense ofimportance are always present. Although useful for assessment oflandslide susceptibility, the Mamdani FIS has not been employedcommonly due to the difficulties when applied in large areaswithout some proper computer program. For this reason, thepurposes of the present study are to develop a MATLAB programfor the construction of a Mamdani FIS and to apply it for landslidesusceptibility evaluation at a medium scale. The present studyincludes four main stages such as (i) development of MATLABprogram, (ii) data production; (iii) construction of the FISand landslide susceptibility mapping; and (iv) assessment of
ease cite this article as: Akgun, A., et al., An easy-to-use MATLAB pring a Mamdani fuzzy algorithm. Computers & Geosciences (2011)
the results. The major benefits to be obtained from the study areas follows:
(a)
ogr, do
The Mamdani FIS can be constructed completely based onexpert opinion without an exhaustive data analysis process.
(b)
An expert can reflect his/her opinions on landslides in aregion in the model via fuzzy if–then rules.(c)
The computational load is low, and results can be obtained ina short time.(d)
Using the MATLAB program developed in this study, aMamdani FIS can be constructed, and production of thedegrees of landslide susceptibility can be easily obtained.2. MATLAB program for Mamdani FIS
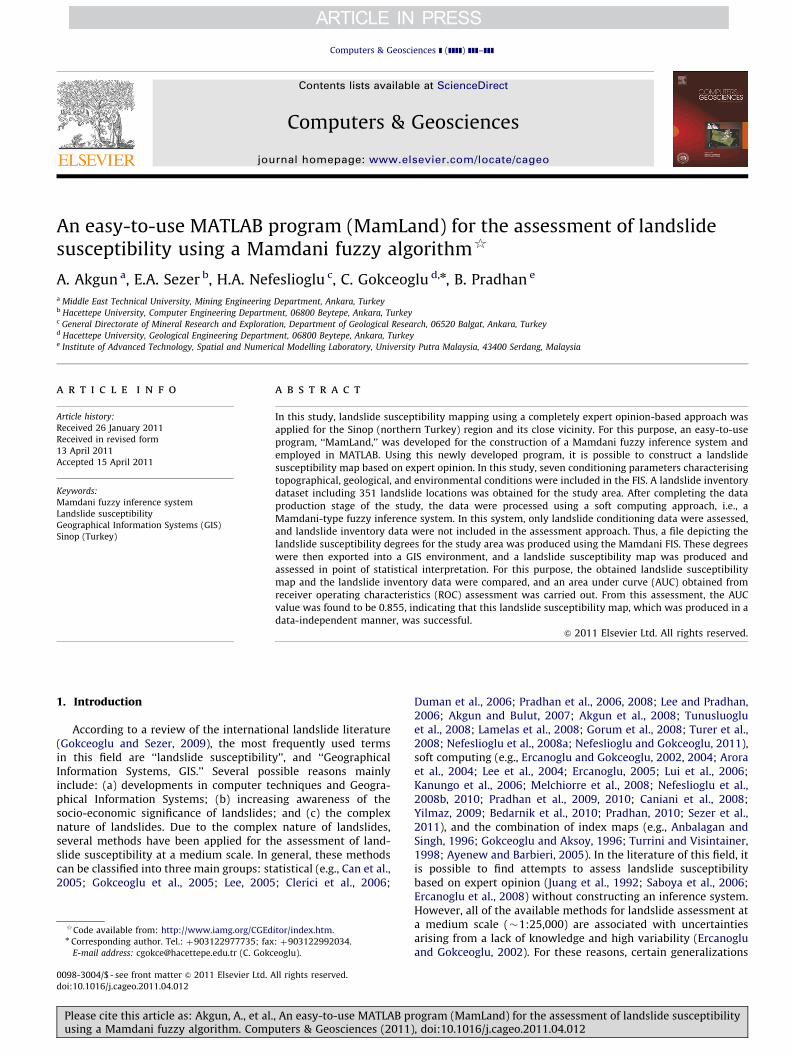
As noted above, several studies applying a Mamdani FIS havebeen performed using MATLAB and published by a number ofresearchers (i.e., Lee and Juang, 1992; Juang et al., 1992; DenHartog et al., 1997; Alvarez Grima and Babuska, 1999; Gokceoglu,2002; Kayabasi et al., 2003; Sonmez et al., 2004; Saboya et al., 2006;Nefeslioglu et al., 2006; Gokceoglu et al., 2009a; Yagiz andGokceoglu, 2010) in the engineering geology literature. Accordingto Setness et al. (1998), fuzzy models are described in the literatureas transparent and interpretable, but in fact, in many engineeringapplications, they are used as a black-box tool. Various fuzzyinference systems have been proposed. The Mamdani FIS (Fig. 1)is one of these systems. The Mamdani FIS is perhaps the mostappealing fuzzy method to employ for engineering geology pro-blems (Alvarez Grima, 2000).
The general characteristics of a Mamdani FIS were describedby Alvarez Grima (2000), and some general information on theMamdani FIS is provided in this section. A Mamdani FISis composed of the membership functions of input(s), fuzzyif–then linguistic rules, and output membership functions. Thegeneral if–then structure of the Mamdani algorithm is given as
Ri : if xi is Ail and. . .then y is Biðfor i¼ 1,2,. . .kÞ, ð1Þ
where k is the numbers of rules; xi is the input variable (ante-cedent variable); and y is the output variable (consequentvariable).
The details of the composition of fuzzy relationships were givenby Ross (1995). Although many methods for the composition offuzzy relations (e.g., min–max, max–max, min–min, max–min, etc.)are available in the literature, the max–min and max–productmethods are the two most commonly used techniques (Ross,1995). The basic form of a fuzzy composition process is given as
B~¼ A
~3R~, ð2Þ
where A~
is the antecedent defined on universe X; B~
is the consequentdefined on universe Y; and R
~is the fuzzy relation characterising the
relation between specific inputs (X) and specific outputs (Y).The calculation procedure of a Mamdani FIS can be given as
follows (Alvarez Grima, 2000):
(1)
Compute the degree of fulfilment (aI) of the input for eachrule (i) by considering the degree of membership (m)ai ¼ mA~i1ðX1Þ4mA
~i2ðX2Þ4 � � �4mA
~inðXnÞ: ð3Þ
For each rule, derive the output fuzzy set B~ i
using theminimum t-norm
mB~
0
iðyÞ ¼ ai4mB
~
0
iðyÞ: ð4Þ
am (MamLand) for the assessment of landslide susceptibilityi:10.1016/j.cageo.2011.04.012
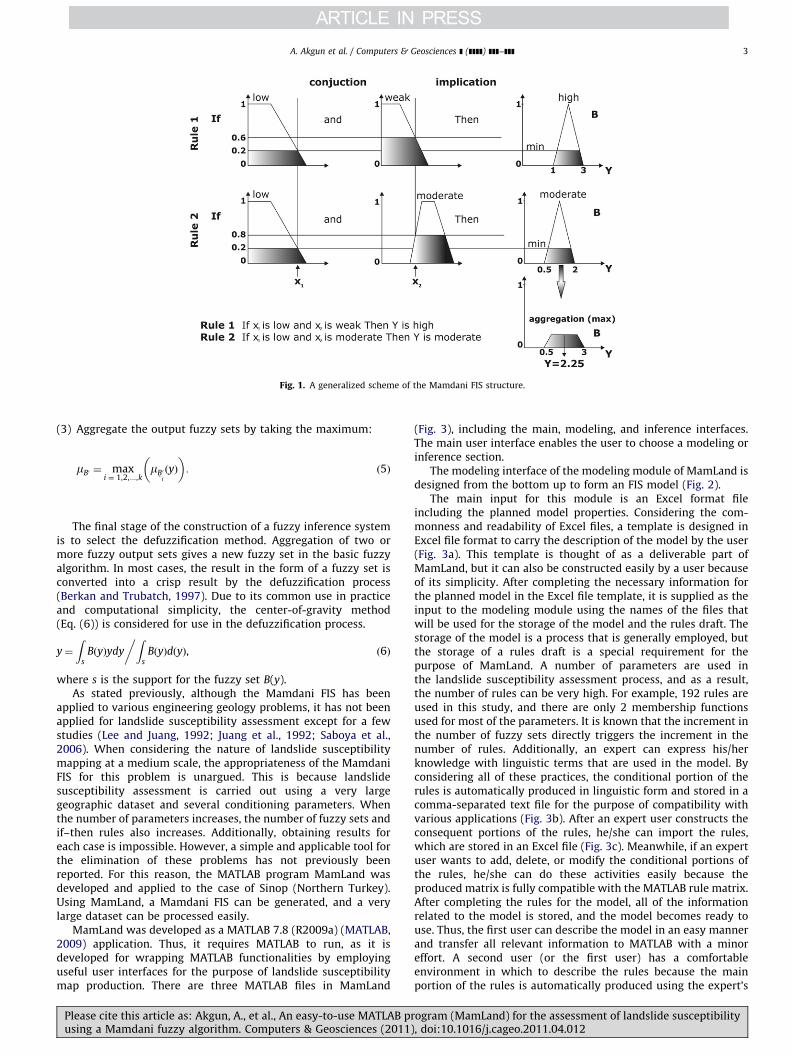
Fig. 1. A generalized scheme of the Mamdani FIS structure.
A. Akgun et al. / Computers & Geosciences ] (]]]]) ]]]–]]] 3
(3)
Plus
Aggregate the output fuzzy sets by taking the maximum:
mB0 ¼ maxi ¼ 1,2,...,k
mB~ i
0 ðyÞ
� �: ð5Þ
The final stage of the construction of a fuzzy inference systemis to select the defuzzification method. Aggregation of two ormore fuzzy output sets gives a new fuzzy set in the basic fuzzyalgorithm. In most cases, the result in the form of a fuzzy set isconverted into a crisp result by the defuzzification process(Berkan and Trubatch, 1997). Due to its common use in practiceand computational simplicity, the center-of-gravity method(Eq. (6)) is considered for use in the defuzzification process.
y¼
Zs
BðyÞydy
Zs
BðyÞdðyÞ,
�ð6Þ
where s is the support for the fuzzy set B(y).As stated previously, although the Mamdani FIS has been
applied to various engineering geology problems, it has not beenapplied for landslide susceptibility assessment except for a fewstudies (Lee and Juang, 1992; Juang et al., 1992; Saboya et al.,2006). When considering the nature of landslide susceptibilitymapping at a medium scale, the appropriateness of the MamdaniFIS for this problem is unargued. This is because landslidesusceptibility assessment is carried out using a very largegeographic dataset and several conditioning parameters. Whenthe number of parameters increases, the number of fuzzy sets andif–then rules also increases. Additionally, obtaining results foreach case is impossible. However, a simple and applicable tool forthe elimination of these problems has not previously beenreported. For this reason, the MATLAB program MamLand wasdeveloped and applied to the case of Sinop (Northern Turkey).Using MamLand, a Mamdani FIS can be generated, and a verylarge dataset can be processed easily.
MamLand was developed as a MATLAB 7.8 (R2009a) (MATLAB,2009) application. Thus, it requires MATLAB to run, as it isdeveloped for wrapping MATLAB functionalities by employinguseful user interfaces for the purpose of landslide susceptibilitymap production. There are three MATLAB files in MamLand
ease cite this article as: Akgun, A., et al., An easy-to-use MATLAB pring a Mamdani fuzzy algorithm. Computers & Geosciences (2011)
(Fig. 3), including the main, modeling, and inference interfaces.The main user interface enables the user to choose a modeling orinference section.
The modeling interface of the modeling module of MamLand isdesigned from the bottom up to form an FIS model (Fig. 2).
The main input for this module is an Excel format fileincluding the planned model properties. Considering the com-monness and readability of Excel files, a template is designed inExcel file format to carry the description of the model by the user(Fig. 3a). This template is thought of as a deliverable part ofMamLand, but it can also be constructed easily by a user becauseof its simplicity. After completing the necessary information forthe planned model in the Excel file template, it is supplied as theinput to the modeling module using the names of the files thatwill be used for the storage of the model and the rules draft. Thestorage of the model is a process that is generally employed, butthe storage of a rules draft is a special requirement for thepurpose of MamLand. A number of parameters are used inthe landslide susceptibility assessment process, and as a result,the number of rules can be very high. For example, 192 rules areused in this study, and there are only 2 membership functionsused for most of the parameters. It is known that the increment inthe number of fuzzy sets directly triggers the increment in thenumber of rules. Additionally, an expert can express his/herknowledge with linguistic terms that are used in the model. Byconsidering all of these practices, the conditional portion of therules is automatically produced in linguistic form and stored in acomma-separated text file for the purpose of compatibility withvarious applications (Fig. 3b). After an expert user constructs theconsequent portions of the rules, he/she can import the rules,which are stored in an Excel file (Fig. 3c). Meanwhile, if an expertuser wants to add, delete, or modify the conditional portions ofthe rules, he/she can do these activities easily because theproduced matrix is fully compatible with the MATLAB rule matrix.After completing the rules for the model, all of the informationrelated to the model is stored, and the model becomes ready touse. Thus, the first user can describe the model in an easy mannerand transfer all relevant information to MATLAB with a minoreffort. A second user (or the first user) has a comfortableenvironment in which to describe the rules because the mainportion of the rules is automatically produced using the expert’s
ogram (MamLand) for the assessment of landslide susceptibility, doi:10.1016/j.cageo.2011.04.012
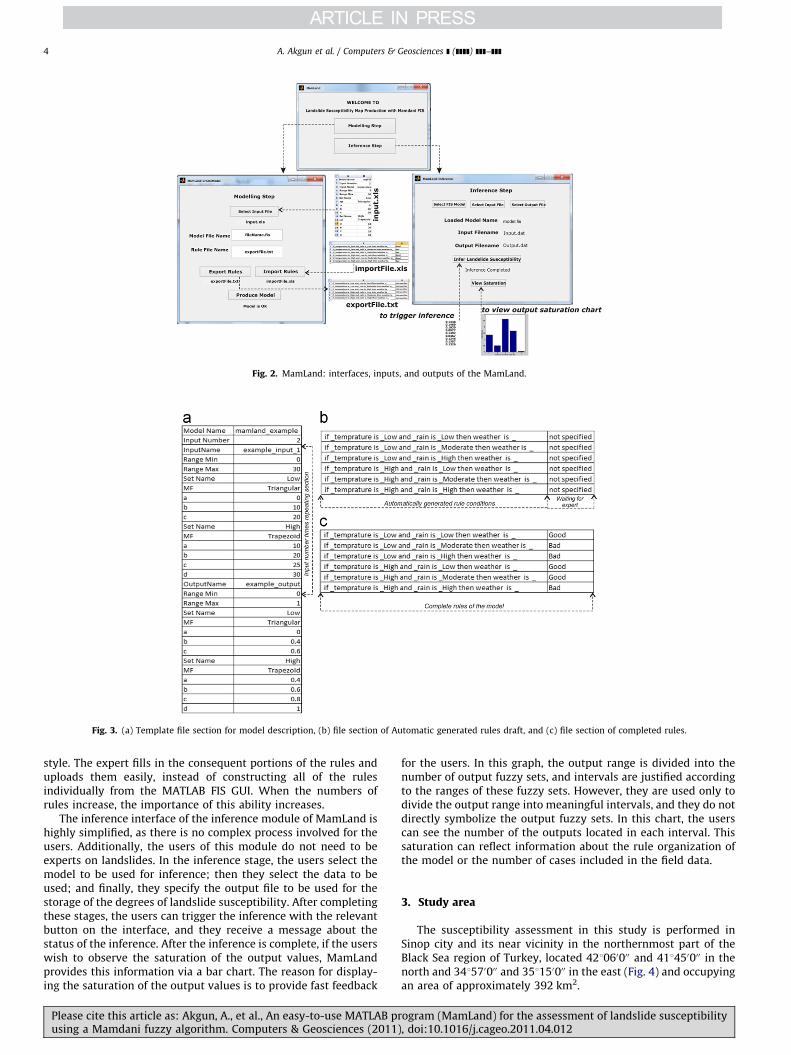
Fig. 3. (a) Template file section for model description, (b) file section of Automatic generated rules draft, and (c) file section of completed rules.
Fig. 2. MamLand: interfaces, inputs, and outputs of the MamLand.
A. Akgun et al. / Computers & Geosciences ] (]]]]) ]]]–]]]4
style. The expert fills in the consequent portions of the rules anduploads them easily, instead of constructing all of the rulesindividually from the MATLAB FIS GUI. When the numbers ofrules increase, the importance of this ability increases.
The inference interface of the inference module of MamLand ishighly simplified, as there is no complex process involved for theusers. Additionally, the users of this module do not need to beexperts on landslides. In the inference stage, the users select themodel to be used for inference; then they select the data to beused; and finally, they specify the output file to be used for thestorage of the degrees of landslide susceptibility. After completingthese stages, the users can trigger the inference with the relevantbutton on the interface, and they receive a message about thestatus of the inference. After the inference is complete, if the userswish to observe the saturation of the output values, MamLandprovides this information via a bar chart. The reason for display-ing the saturation of the output values is to provide fast feedback
Please cite this article as: Akgun, A., et al., An easy-to-use MATLAB prusing a Mamdani fuzzy algorithm. Computers & Geosciences (2011)
for the users. In this graph, the output range is divided into thenumber of output fuzzy sets, and intervals are justified accordingto the ranges of these fuzzy sets. However, they are used only todivide the output range into meaningful intervals, and they do notdirectly symbolize the output fuzzy sets. In this chart, the userscan see the number of the outputs located in each interval. Thissaturation can reflect information about the rule organization ofthe model or the number of cases included in the field data.
3. Study area
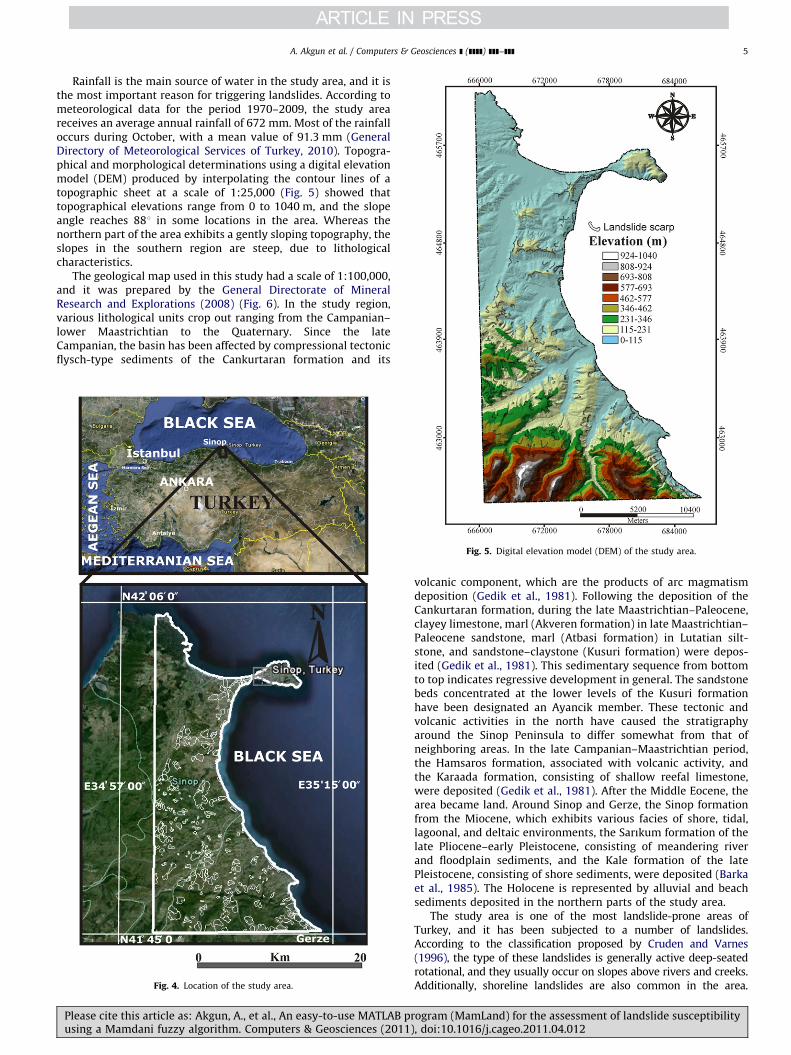
The susceptibility assessment in this study is performed inSinop city and its near vicinity in the northernmost part of theBlack Sea region of Turkey, located 421060000 and 411450000 in thenorth and 341570000 and 351150000 in the east (Fig. 4) and occupyingan area of approximately 392 km2.
ogram (MamLand) for the assessment of landslide susceptibility, doi:10.1016/j.cageo.2011.04.012
A. Akgun et al. / Computers & Geosciences ] (]]]]) ]]]–]]] 5
Rainfall is the main source of water in the study area, and it isthe most important reason for triggering landslides. According tometeorological data for the period 1970–2009, the study areareceives an average annual rainfall of 672 mm. Most of the rainfalloccurs during October, with a mean value of 91.3 mm (GeneralDirectory of Meteorological Services of Turkey, 2010). Topogra-phical and morphological determinations using a digital elevationmodel (DEM) produced by interpolating the contour lines of atopographic sheet at a scale of 1:25,000 (Fig. 5) showed thattopographical elevations range from 0 to 1040 m, and the slopeangle reaches 881 in some locations in the area. Whereas thenorthern part of the area exhibits a gently sloping topography, theslopes in the southern region are steep, due to lithologicalcharacteristics.
The geological map used in this study had a scale of 1:100,000,and it was prepared by the General Directorate of MineralResearch and Explorations (2008) (Fig. 6). In the study region,various lithological units crop out ranging from the Campanian–lower Maastrichtian to the Quaternary. Since the lateCampanian, the basin has been affected by compressional tectonicflysch-type sediments of the Cankurtaran formation and its
Fig. 4. Location of the study area.
Fig. 5. Digital elevation model (DEM) of the study area.
Please cite this article as: Akgun, A., et al., An easy-to-use MATLAB prusing a Mamdani fuzzy algorithm. Computers & Geosciences (2011)
volcanic component, which are the products of arc magmatismdeposition (Gedik et al., 1981). Following the deposition of theCankurtaran formation, during the late Maastrichtian–Paleocene,clayey limestone, marl (Akveren formation) in late Maastrichtian–Paleocene sandstone, marl (Atbasi formation) in Lutatian silt-stone, and sandstone–claystone (Kusuri formation) were depos-ited (Gedik et al., 1981). This sedimentary sequence from bottomto top indicates regressive development in general. The sandstonebeds concentrated at the lower levels of the Kusuri formationhave been designated an Ayancik member. These tectonic andvolcanic activities in the north have caused the stratigraphyaround the Sinop Peninsula to differ somewhat from that ofneighboring areas. In the late Campanian–Maastrichtian period,the Hamsaros formation, associated with volcanic activity, andthe Karaada formation, consisting of shallow reefal limestone,were deposited (Gedik et al., 1981). After the Middle Eocene, thearea became land. Around Sinop and Gerze, the Sinop formationfrom the Miocene, which exhibits various facies of shore, tidal,lagoonal, and deltaic environments, the Sarıkum formation of thelate Pliocene–early Pleistocene, consisting of meandering riverand floodplain sediments, and the Kale formation of the latePleistocene, consisting of shore sediments, were deposited (Barkaet al., 1985). The Holocene is represented by alluvial and beachsediments deposited in the northern parts of the study area.
The study area is one of the most landslide-prone areas ofTurkey, and it has been subjected to a number of landslides.According to the classification proposed by Cruden and Varnes(1996), the type of these landslides is generally active deep-seatedrotational, and they usually occur on slopes above rivers and creeks.Additionally, shoreline landslides are also common in the area.
ogram (MamLand) for the assessment of landslide susceptibility, doi:10.1016/j.cageo.2011.04.012
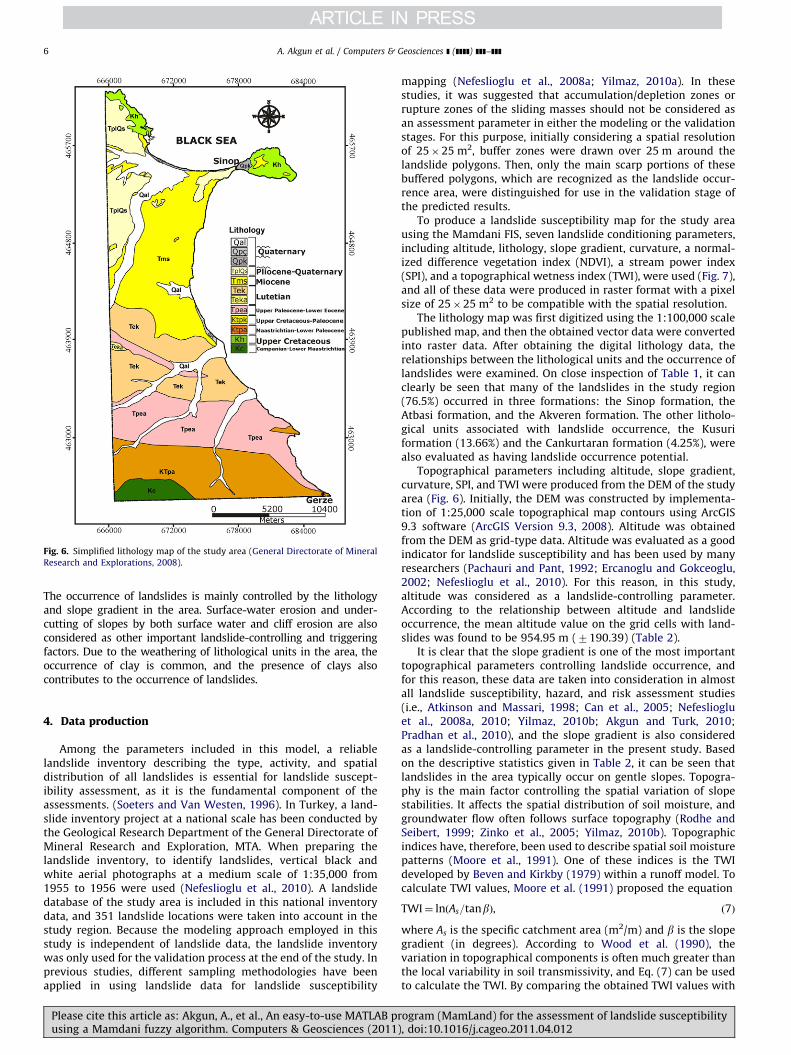
Fig. 6. Simplified lithology map of the study area (General Directorate of Mineral
Research and Explorations, 2008).
A. Akgun et al. / Computers & Geosciences ] (]]]]) ]]]–]]]6
The occurrence of landslides is mainly controlled by the lithologyand slope gradient in the area. Surface-water erosion and under-cutting of slopes by both surface water and cliff erosion are alsoconsidered as other important landslide-controlling and triggeringfactors. Due to the weathering of lithological units in the area, theoccurrence of clay is common, and the presence of clays alsocontributes to the occurrence of landslides.
4. Data production
Among the parameters included in this model, a reliablelandslide inventory describing the type, activity, and spatialdistribution of all landslides is essential for landslide suscept-ibility assessment, as it is the fundamental component of theassessments. (Soeters and Van Westen, 1996). In Turkey, a land-slide inventory project at a national scale has been conducted bythe Geological Research Department of the General Directorate ofMineral Research and Exploration, MTA. When preparing thelandslide inventory, to identify landslides, vertical black andwhite aerial photographs at a medium scale of 1:35,000 from1955 to 1956 were used (Nefeslioglu et al., 2010). A landslidedatabase of the study area is included in this national inventorydata, and 351 landslide locations were taken into account in thestudy region. Because the modeling approach employed in thisstudy is independent of landslide data, the landslide inventorywas only used for the validation process at the end of the study. Inprevious studies, different sampling methodologies have beenapplied in using landslide data for landslide susceptibility
Please cite this article as: Akgun, A., et al., An easy-to-use MATLAB prusing a Mamdani fuzzy algorithm. Computers & Geosciences (2011)
mapping (Nefeslioglu et al., 2008a; Yilmaz, 2010a). In thesestudies, it was suggested that accumulation/depletion zones orrupture zones of the sliding masses should not be considered asan assessment parameter in either the modeling or the validationstages. For this purpose, initially considering a spatial resolutionof 25�25 m2, buffer zones were drawn over 25 m around thelandslide polygons. Then, only the main scarp portions of thesebuffered polygons, which are recognized as the landslide occur-rence area, were distinguished for use in the validation stage ofthe predicted results.
To produce a landslide susceptibility map for the study areausing the Mamdani FIS, seven landslide conditioning parameters,including altitude, lithology, slope gradient, curvature, a normal-ized difference vegetation index (NDVI), a stream power index(SPI), and a topographical wetness index (TWI), were used (Fig. 7),and all of these data were produced in raster format with a pixelsize of 25�25 m2 to be compatible with the spatial resolution.
The lithology map was first digitized using the 1:100,000 scalepublished map, and then the obtained vector data were convertedinto raster data. After obtaining the digital lithology data, therelationships between the lithological units and the occurrence oflandslides were examined. On close inspection of Table 1, it canclearly be seen that many of the landslides in the study region(76.5%) occurred in three formations: the Sinop formation, theAtbasi formation, and the Akveren formation. The other litholo-gical units associated with landslide occurrence, the Kusuriformation (13.66%) and the Cankurtaran formation (4.25%), werealso evaluated as having landslide occurrence potential.
Topographical parameters including altitude, slope gradient,curvature, SPI, and TWI were produced from the DEM of the studyarea (Fig. 6). Initially, the DEM was constructed by implementa-tion of 1:25,000 scale topographical map contours using ArcGIS9.3 software (ArcGIS Version 9.3, 2008). Altitude was obtainedfrom the DEM as grid-type data. Altitude was evaluated as a goodindicator for landslide susceptibility and has been used by manyresearchers (Pachauri and Pant, 1992; Ercanoglu and Gokceoglu,2002; Nefeslioglu et al., 2010). For this reason, in this study,altitude was considered as a landslide-controlling parameter.According to the relationship between altitude and landslideoccurrence, the mean altitude value on the grid cells with land-slides was found to be 954.95 m (7190.39) (Table 2).
It is clear that the slope gradient is one of the most importanttopographical parameters controlling landslide occurrence, andfor this reason, these data are taken into consideration in almostall landslide susceptibility, hazard, and risk assessment studies(i.e., Atkinson and Massari, 1998; Can et al., 2005; Nefesliogluet al., 2008a, 2010; Yilmaz, 2010b; Akgun and Turk, 2010;Pradhan et al., 2010), and the slope gradient is also consideredas a landslide-controlling parameter in the present study. Basedon the descriptive statistics given in Table 2, it can be seen thatlandslides in the area typically occur on gentle slopes. Topogra-phy is the main factor controlling the spatial variation of slopestabilities. It affects the spatial distribution of soil moisture, andgroundwater flow often follows surface topography (Rodhe andSeibert, 1999; Zinko et al., 2005; Yilmaz, 2010b). Topographicindices have, therefore, been used to describe spatial soil moisturepatterns (Moore et al., 1991). One of these indices is the TWIdeveloped by Beven and Kirkby (1979) within a runoff model. Tocalculate TWI values, Moore et al. (1991) proposed the equation
TWI¼ lnðAs=tanbÞ, ð7Þ
where As is the specific catchment area (m2/m) and b is the slopegradient (in degrees). According to Wood et al. (1990), thevariation in topographical components is often much greater thanthe local variability in soil transmissivity, and Eq. (7) can be usedto calculate the TWI. By comparing the obtained TWI values with
ogram (MamLand) for the assessment of landslide susceptibility, doi:10.1016/j.cageo.2011.04.012
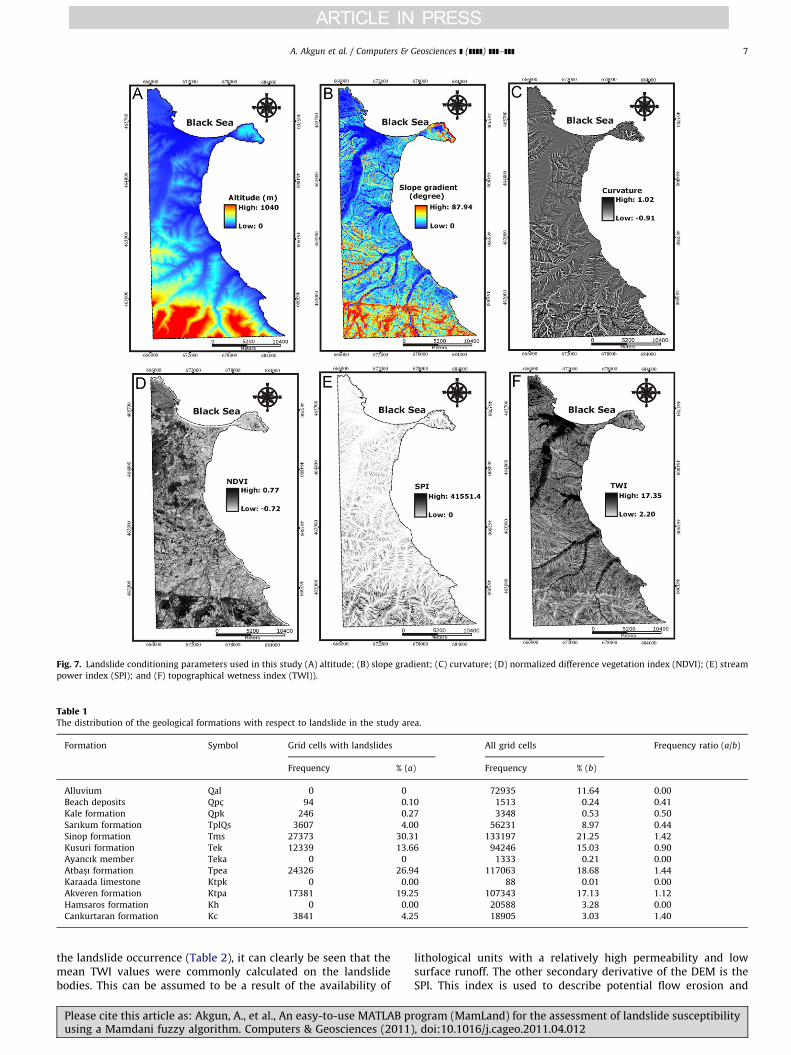
Fig. 7. Landslide conditioning parameters used in this study (A) altitude; (B) slope gradient; (C) curvature; (D) normalized difference vegetation index (NDVI); (E) stream
power index (SPI); and (F) topographical wetness index (TWI)).
Table 1The distribution of the geological formations with respect to landslide in the study area.
Formation Symbol Grid cells with landslides All grid cells Frequency ratio (a/b)
Frequency % (a) Frequency % (b)
Alluvium Qal 0 0 72935 11.64 0.00
Beach deposits Qpc- 94 0.10 1513 0.24 0.41
Kale formation Qpk 246 0.27 3348 0.53 0.50
Sarıkum formation TplQs 3607 4.00 56231 8.97 0.44
Sinop formation Tms 27373 30.31 133197 21.25 1.42
Kusuri formation Tek 12339 13.66 94246 15.03 0.90
Ayancık member Teka 0 0 1333 0.21 0.00
Atbas-ı formation Tpea 24326 26.94 117063 18.68 1.44
Karaada limestone Ktpk 0 0.00 88 0.01 0.00
Akveren formation Ktpa 17381 19.25 107343 17.13 1.12
Hamsaros formation Kh 0 0.00 20588 3.28 0.00
Cankurtaran formation Kc 3841 4.25 18905 3.03 1.40
A. Akgun et al. / Computers & Geosciences ] (]]]]) ]]]–]]] 7
the landslide occurrence (Table 2), it can clearly be seen that themean TWI values were commonly calculated on the landslidebodies. This can be assumed to be a result of the availability of
Please cite this article as: Akgun, A., et al., An easy-to-use MATLAB prusing a Mamdani fuzzy algorithm. Computers & Geosciences (2011)
lithological units with a relatively high permeability and lowsurface runoff. The other secondary derivative of the DEM is theSPI. This index is used to describe potential flow erosion and
ogram (MamLand) for the assessment of landslide susceptibility, doi:10.1016/j.cageo.2011.04.012
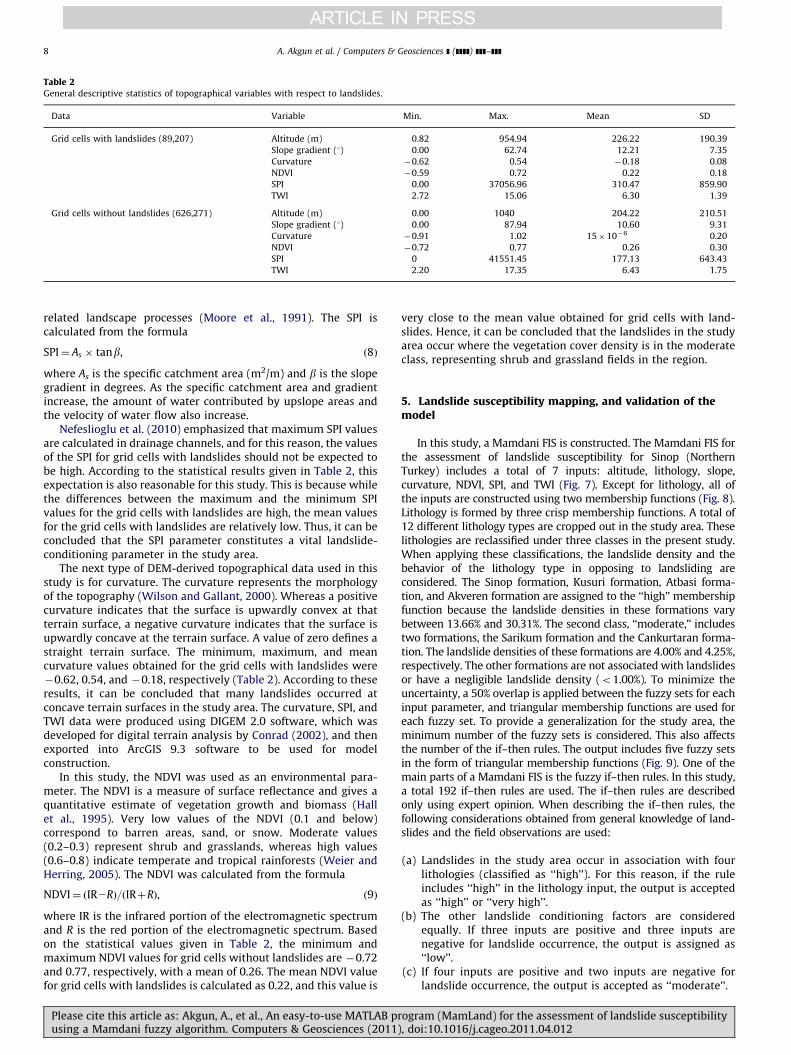
Table 2General descriptive statistics of topographical variables with respect to landslides.
Data Variable Min. Max. Mean SD
Grid cells with landslides (89,207) Altitude (m) 0.82 954.94 226.22 190.39
Slope gradient (1) 0.00 62.74 12.21 7.35
Curvature �0.62 0.54 �0.18 0.08
NDVI �0.59 0.72 0.22 0.18
SPI 0.00 37056.96 310.47 859.90
TWI 2.72 15.06 6.30 1.39
Grid cells without landslides (626,271) Altitude (m) 0.00 1040 204.22 210.51
Slope gradient (1) 0.00 87.94 10.60 9.31
Curvature �0.91 1.02 15�10�6 0.20
NDVI �0.72 0.77 0.26 0.30
SPI 0 41551.45 177.13 643.43
TWI 2.20 17.35 6.43 1.75
A. Akgun et al. / Computers & Geosciences ] (]]]]) ]]]–]]]8
related landscape processes (Moore et al., 1991). The SPI iscalculated from the formula
SPI¼ As � tanb, ð8Þ
where As is the specific catchment area (m2/m) and b is the slopegradient in degrees. As the specific catchment area and gradientincrease, the amount of water contributed by upslope areas andthe velocity of water flow also increase.
Nefeslioglu et al. (2010) emphasized that maximum SPI valuesare calculated in drainage channels, and for this reason, the valuesof the SPI for grid cells with landslides should not be expected tobe high. According to the statistical results given in Table 2, thisexpectation is also reasonable for this study. This is because whilethe differences between the maximum and the minimum SPIvalues for the grid cells with landslides are high, the mean valuesfor the grid cells with landslides are relatively low. Thus, it can beconcluded that the SPI parameter constitutes a vital landslide-conditioning parameter in the study area.
The next type of DEM-derived topographical data used in thisstudy is for curvature. The curvature represents the morphologyof the topography (Wilson and Gallant, 2000). Whereas a positivecurvature indicates that the surface is upwardly convex at thatterrain surface, a negative curvature indicates that the surface isupwardly concave at the terrain surface. A value of zero defines astraight terrain surface. The minimum, maximum, and meancurvature values obtained for the grid cells with landslides were�0.62, 0.54, and �0.18, respectively (Table 2). According to theseresults, it can be concluded that many landslides occurred atconcave terrain surfaces in the study area. The curvature, SPI, andTWI data were produced using DIGEM 2.0 software, which wasdeveloped for digital terrain analysis by Conrad (2002), and thenexported into ArcGIS 9.3 software to be used for modelconstruction.
In this study, the NDVI was used as an environmental para-meter. The NDVI is a measure of surface reflectance and gives aquantitative estimate of vegetation growth and biomass (Hallet al., 1995). Very low values of the NDVI (0.1 and below)correspond to barren areas, sand, or snow. Moderate values(0.2–0.3) represent shrub and grasslands, whereas high values(0.6–0.8) indicate temperate and tropical rainforests (Weier andHerring, 2005). The NDVI was calculated from the formula
NDVI¼ ðIR2RÞ=ðIRþRÞ, ð9Þ
where IR is the infrared portion of the electromagnetic spectrumand R is the red portion of the electromagnetic spectrum. Basedon the statistical values given in Table 2, the minimum andmaximum NDVI values for grid cells without landslides are �0.72and 0.77, respectively, with a mean of 0.26. The mean NDVI valuefor grid cells with landslides is calculated as 0.22, and this value is
Please cite this article as: Akgun, A., et al., An easy-to-use MATLAB prusing a Mamdani fuzzy algorithm. Computers & Geosciences (2011)
very close to the mean value obtained for grid cells with land-slides. Hence, it can be concluded that the landslides in the studyarea occur where the vegetation cover density is in the moderateclass, representing shrub and grassland fields in the region.
5. Landslide susceptibility mapping, and validation of themodel
In this study, a Mamdani FIS is constructed. The Mamdani FIS forthe assessment of landslide susceptibility for Sinop (NorthernTurkey) includes a total of 7 inputs: altitude, lithology, slope,curvature, NDVI, SPI, and TWI (Fig. 7). Except for lithology, all ofthe inputs are constructed using two membership functions (Fig. 8).Lithology is formed by three crisp membership functions. A total of12 different lithology types are cropped out in the study area. Theselithologies are reclassified under three classes in the present study.When applying these classifications, the landslide density and thebehavior of the lithology type in opposing to landsliding areconsidered. The Sinop formation, Kusuri formation, Atbasi forma-tion, and Akveren formation are assigned to the ‘‘high’’ membershipfunction because the landslide densities in these formations varybetween 13.66% and 30.31%. The second class, ‘‘moderate,’’ includestwo formations, the Sarikum formation and the Cankurtaran forma-tion. The landslide densities of these formations are 4.00% and 4.25%,respectively. The other formations are not associated with landslidesor have a negligible landslide density (o1.00%). To minimize theuncertainty, a 50% overlap is applied between the fuzzy sets for eachinput parameter, and triangular membership functions are used foreach fuzzy set. To provide a generalization for the study area, theminimum number of the fuzzy sets is considered. This also affectsthe number of the if–then rules. The output includes five fuzzy setsin the form of triangular membership functions (Fig. 9). One of themain parts of a Mamdani FIS is the fuzzy if–then rules. In this study,a total 192 if–then rules are used. The if–then rules are describedonly using expert opinion. When describing the if–then rules, thefollowing considerations obtained from general knowledge of land-slides and the field observations are used:
(a)
ogr, do
Landslides in the study area occur in association with fourlithologies (classified as ‘‘high’’). For this reason, if the ruleincludes ‘‘high’’ in the lithology input, the output is acceptedas ‘‘high’’ or ‘‘very high’’.
(b)
The other landslide conditioning factors are consideredequally. If three inputs are positive and three inputs arenegative for landslide occurrence, the output is assigned as‘‘low’’.(c)
If four inputs are positive and two inputs are negative forlandslide occurrence, the output is accepted as ‘‘moderate’’.am (MamLand) for the assessment of landslide susceptibilityi:10.1016/j.cageo.2011.04.012

Fig. 8. Mamdani FIS application scheme, followed in this study.
Fig. 9. Landslide susceptibility index map obtained by Mamdani-type FIS
methodology.
A. Akgun et al. / Computers & Geosciences ] (]]]]) ]]]–]]] 9
Please cite this article as: Akgun, A., et al., An easy-to-use MATLAB prusing a Mamdani fuzzy algorithm. Computers & Geosciences (2011)
(d)
ogr, do
If five inputs are positive and one input is negative forlandslide occurrence, the output is accepted as ‘‘high’’.
(e)
If six inputs are positive for landslide occurrence, the outputis accepted as ‘‘very high’’.(f)
If the lithology is ‘‘low,’’ the output is accepted as ‘‘very low’’.After modeling the Mamdani FIS and producing the suscept-ibility values using MamLand, the susceptibility values werestored as a text file. Then, this file was exported into ArcGIS9.3 software as point data containing output database informa-tion. After exporting the data into point-type data, they wereconverted into a raster file type so that they could be evaluated,and a landslide susceptibility map was obtained (Fig. 9).
For visual interpretation of this map, the necessity of classify-ing data into categorical susceptibility classes arose. Four dataclassifiers for this purpose are reported in the literature: equalinterval, standard deviation, natural break, and quantile classifi-cation (Ayalew et al., 2005; Akgun et al., 2008). When consideringall of these classifiers, the distribution of the data should be takeninto account because class intervals change based on the chosenclassifier (Ayalew et al., 2005). For example, if the data distribu-tion is close to normal, equal interval or standard deviationclassifiers should be used. If the data distribution has a positiveor negative skewness, the quantile or natural break distributionclassifiers could be chosen. In this study, before choosing the bestdata classifier for the obtained data, the data distribution histo-gram was taken into consideration (Fig. 10). Then, all of theclassifiers noted above were applied to the data. The equalinterval and standard deviation classifiers were found to begenerally unsuccessful due to the fact that the data distributionskewed positively. Additionally, the natural break classifierclassified the data into categorical susceptibility classes that wereinferior to the quantile classifier. Therefore, the quantile dataclassification approach was chosen, and the landslide suscept-ibility index map was classified into five susceptibility classes:very low, low, moderate, high, and very high (Fig. 11).
am (MamLand) for the assessment of landslide susceptibilityi:10.1016/j.cageo.2011.04.012
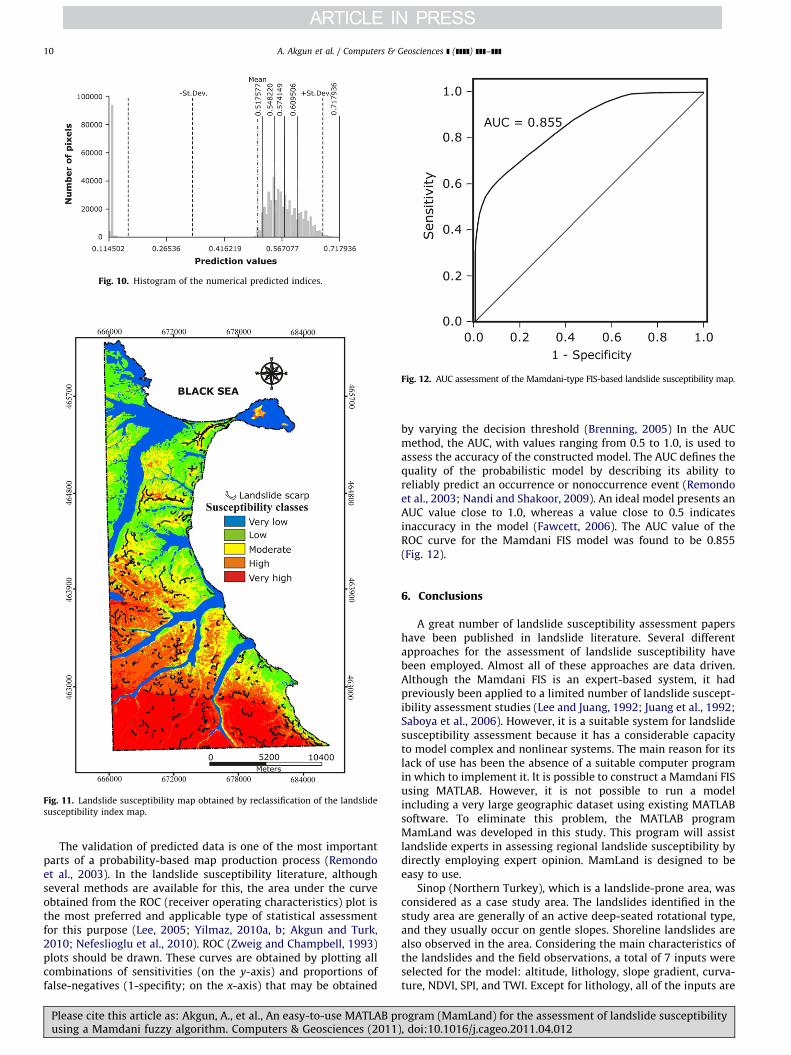
Fig. 11. Landslide susceptibility map obtained by reclassification of the landslide
susceptibility index map.
Fig. 12. AUC assessment of the Mamdani-type FIS-based landslide susceptibility map.
Fig. 10. Histogram of the numerical predicted indices.
A. Akgun et al. / Computers & Geosciences ] (]]]]) ]]]–]]]10
The validation of predicted data is one of the most importantparts of a probability-based map production process (Remondoet al., 2003). In the landslide susceptibility literature, althoughseveral methods are available for this, the area under the curveobtained from the ROC (receiver operating characteristics) plot isthe most preferred and applicable type of statistical assessmentfor this purpose (Lee, 2005; Yilmaz, 2010a, b; Akgun and Turk,2010; Nefeslioglu et al., 2010). ROC (Zweig and Champbell, 1993)plots should be drawn. These curves are obtained by plotting allcombinations of sensitivities (on the y-axis) and proportions offalse-negatives (1-specifity; on the x-axis) that may be obtained
Please cite this article as: Akgun, A., et al., An easy-to-use MATLAB prusing a Mamdani fuzzy algorithm. Computers & Geosciences (2011)
by varying the decision threshold (Brenning, 2005) In the AUCmethod, the AUC, with values ranging from 0.5 to 1.0, is used toassess the accuracy of the constructed model. The AUC defines thequality of the probabilistic model by describing its ability toreliably predict an occurrence or nonoccurrence event (Remondoet al., 2003; Nandi and Shakoor, 2009). An ideal model presents anAUC value close to 1.0, whereas a value close to 0.5 indicatesinaccuracy in the model (Fawcett, 2006). The AUC value of theROC curve for the Mamdani FIS model was found to be 0.855(Fig. 12).
6. Conclusions
A great number of landslide susceptibility assessment papershave been published in landslide literature. Several differentapproaches for the assessment of landslide susceptibility havebeen employed. Almost all of these approaches are data driven.Although the Mamdani FIS is an expert-based system, it hadpreviously been applied to a limited number of landslide suscept-ibility assessment studies (Lee and Juang, 1992; Juang et al., 1992;Saboya et al., 2006). However, it is a suitable system for landslidesusceptibility assessment because it has a considerable capacityto model complex and nonlinear systems. The main reason for itslack of use has been the absence of a suitable computer programin which to implement it. It is possible to construct a Mamdani FISusing MATLAB. However, it is not possible to run a modelincluding a very large geographic dataset using existing MATLABsoftware. To eliminate this problem, the MATLAB programMamLand was developed in this study. This program will assistlandslide experts in assessing regional landslide susceptibility bydirectly employing expert opinion. MamLand is designed to beeasy to use.
Sinop (Northern Turkey), which is a landslide-prone area, wasconsidered as a case study area. The landslides identified in thestudy area are generally of an active deep-seated rotational type,and they usually occur on gentle slopes. Shoreline landslides arealso observed in the area. Considering the main characteristics ofthe landslides and the field observations, a total of 7 inputs wereselected for the model: altitude, lithology, slope gradient, curva-ture, NDVI, SPI, and TWI. Except for lithology, all of the inputs are
ogram (MamLand) for the assessment of landslide susceptibility, doi:10.1016/j.cageo.2011.04.012
A. Akgun et al. / Computers & Geosciences ] (]]]]) ]]]–]]] 11
formed by two membership functions, while lithology includesthree input membership functions. To minimize the uncertainty, a50% overlap is applied between the membership functions. Theoutput, the landslide susceptibility degree, is formed by fivemembership functions (Fig. 9). The FIS constructed for the studyarea has a total of 192 if–then rules. The if–then rules aredescribed only using expert opinion. The AUC value of the ROCcurve for the Mamdani FIS model constructed in the present studywas found to be 0.855. Finally, we conclude that this methodologywill present new opportunities for landslide researchers, as theycan employ their knowledge in this model via membershipfunctions and if–then rules.
Appendix A. Supplementary material
Supplementary data associated with this article can be foundin the online version at doi:10.1016/j.cageo.2011.04.012.
References
Akgun, A., Bulut, F., 2007. GIS-based landslide susceptibility for Arsin-Yomra(Trabzon, North Turkey) region. Environmental Geology 51, 1377–1387.
Akgun, A., Dag, S., Bulut, F., 2008. Landslide susceptibility mapping for a landslide-prone area (Findikli, NE of Turkey) by likelihood frequency ratio and weightedlinear combination models. Environmental Geology 54 (6), 1127–1143.
Akgun, A., Turk, N., 2010. Landslide susceptibility mapping for Ayvalik (WesternTurkey) and its vicinity by multicriteria decision analysis. Environmental EarthSciences 61 (3), 595–611.
Alvarez Grima, M., 2000. Neuro-Fuzzy Modeling in Engineering Geology. A.A.Balkema, Rotterdam, 244pp.
Alvarez Grima, M., Babuska, R., 1999. Fuzzy model for the prediction of unconfinedcompressive strength of rock samples. International Journal of Rock Mechanicsand Mining Science 36 (3), 339–349.
Anbalagan, R., Singh, B., 1996. Landslide hazard and risk assessment mapping ofmountainous terrains—a case study from Kumaun Himalaya, India. Engineer-ing Geology 43 (4), 237–246.
ArcGIS (Version 9.3), 2008. Integrated GIS Software. ESRI, CA.Arora, M.K., Gupta, A.S.D., Gupta, R.P., 2004. An artificial neural network approach
for landslide hazard zonation in the Bhagirathi (Ganga) Valley, Himalayas.International Journal of Remote Sensing 25 (3), 559–572.
Atkinson, P.M., Massari, R., 1998. Generalized linear modelling of susceptibility tolandsliding in the central Appennines, Italy. Computers and Geosciences 24(4), 373–385.
Ayalew, L., Yamagishi, H., Marui, H., Kanno, T., 2005. Landslide in Sado Island ofJapan: part II. GIS-based susceptibility mapping with comparison of resultsfrom two methods and verifications. Engineering Geology 81, 432–445.
Ayenew, T., Barbieri, G., 2005. Inventory of landslides and susceptibility mappingin the Dessie area, northern Ethiopia. Engineering Geology 77 (1–2), 1–15.
Barka, A., Sutcu, Y.F., Gedik, I., Tekin, T.F., Arel, E., Ozdemir, M, Erkal, T., 1985. SinopNukleer Enerji Santraline Iliskin Jeolojik Arastirmalar Sonuc Raporu: MTADerleme Rapor No. 7963. Ankara, Turkey, 50pp, unpublished.
Bednarik, M., Magulova, B., Matys, M., Marschalko, M., 2010. Landslide suscept-ibility assessment of the Kral’ovany–Liptovsky Mikulas railway case study.Physics and Chemistry of the Earth, Parts A/B/C 35 (3–5), 162–171.
Berkan, R.C., Trubatch, S.L., 1997. Fuzzy System Design Principles, Building FuzzyIf–Then Rule Bases. The Institute of Electrical and Electronics Engineers, NewYork, 496pp.
Beven, K.J., Kirkby, M.J., 1979. A physically based, variable contributing area modelof basin hydrology. Hydrological Sciences Bulletin 24, 43–69.
Brenning, A., 2005. Spatial prediction models for landslide hazards: review,comparison and evaluation. Natural Hazards and Earth System Sciences 5,853–862.
Can, T., Nefeslioglu, H.A., Gokceoglu, C., Sonmez, H., Duman, T.Y., 2005. Suscept-ibility assessment of shallow earthflows triggered by heavy rainfall at threesubcatchments by logistic regression analyses. Geomorphology 72, 250–271.
Caniani, D., Pascale, S., Sdao, F., Sole, A., 2008. Neural networks and landslidesusceptibility: a case study of the urban area of Potenza. Natural Hazards 45,55–72.
Clerici, A., Perego, S., Tellini, C., Vescovi, P., 2006. A GIS-based automatedprocedure for landslide susceptibility mapping by the conditional analysismethod: the Baganza valley case study (Italian Northern Apennines). Environ-mental Geology 50, 941–961.
Conrad, O., 2002. Digitales Gelande-modell (DiGeM) Terrain Analysis Software./http://www.geogr.unigoettingen.de/pg/saga/digem/S (accessed 18.04.06.).
Cruden, D.M., Varnes, D.J., 1996. Landslide types and processes. In: Turner, A.K.,Shuster, R.L. (Eds.), Landslides: Investigation and Mitigation. TransportationResearch Board Special Report 247. pp. 36–75.
Please cite this article as: Akgun, A., et al., An easy-to-use MATLAB prusing a Mamdani fuzzy algorithm. Computers & Geosciences (2011)
Den Hartog, M.H., Babuska, R., Deketh, H.J.R., Alvarez Grima, M., Verhoef, P.N.W.,Verbruggen, H.B., 1997. Knowledge-based fuzzy model for performanceprediction of a rock cutting trencher. International Journal of ApproximateReasoning 16, 43–66.
Duman, T.Y., Can, T., Gokceoglu, C., Nefeslioglu, H.A., Sonmez, H., 2006. Applicationof logistic regression for landslide susceptibility zoning of Cekmece Area,Istanbul, Turkey. Environmental Geology 51, 241–256.
Ercanoglu, M., 2005. Landslide susceptibility assessment of SE Bartin (West BlackSea region, Turkey) by artificial neural networks. Natural Hazards and EarthSystem Sciences 5, 979–992.
Ercanoglu, M., Gokceoglu, C., 2002. Assessment of landslide susceptibility for alandslide-prone area (north of Yenice, NW Turkey) by fuzzy approach.Environmental Geology 41, 720–730.
Ercanoglu, M., Gokceoglu, C., 2004. Use of fuzzy relations to produce landslidesusceptibility map of a landslide prone area (West Black Sea Region, Turkey).Engineering Geology 75, 229–250.
Ercanoglu, M., Kasmer, O., Temiz, N., 2008. Adaptation and comparison of expertopinion to analytical hierarchy process for landslide susceptibility mapping.Bulletin of Engineering Geology and the Environment 67, 565–578.
Fawcett, T., 2006. An introduction to ROC analysis. Pattern Recognition Letters 27,861–874.
Gedik, A., Ozbudak, N., Korkmaz, S., Iztan, H., Agridag, D.S., 1981. Sinop havzasininjeolojisi ve petrol olanaklari ile ilgili on sonuclar. In: TJK, 35. Bilim ve TeknikKurultayi, Bildiri Ozetleri, Ankara. pp. 35–36.
General Directory of Meteorological Services of Turkey, 2010. /http://www.dmi.gov.trS (accessed 25.12.10.).
General Directorate of Mineral Research and Explorations, 2008. 1:100,000 ScaleGeology Maps of Turkey, Sinop D33-E33 Sheets. MTA Publications, Ankara.
Gokceoglu, C., 2002. A fuzzy triangular chart to predict the uniaxial compressivestrength of the Ankara agglomerates from their petrographic composition.Engineering Geology 66 (1–2), 39–51.
Gokceoglu, C., Aksoy, H., 1996. Landslide susceptibility mapping of the slopes inthe residual soils of the Mengen region (Turkey) by deterministic stabilityanalyses and image processing techniques. Engineering Geology 44, 147–161.
Gokceoglu, C., Sezer, E., 2009. A statistical assessment on international landslideliterature (1945–2008). Landslides 6, 345–351.
Gokceoglu, C., Sonmez, H., Nefeslioglu, H.A., Duman, T.Y., Can, T., 2005. The 17March 2005 Kuzulu landslide (Sivas, Turkey) and landslide-susceptibility mapof its near vicinity. Engineering Geology 81, 65–83.
Gokceoglu, C., Sonmez, H., Zorlu, K., 2009a. Estimating the uniaxial compressivestrength of some clay bearing rocks selected from Turkey by nonlinearmultivariable regression and rule-based fuzzy models. Expert Systems 26(2), 176–190.
Gokceoglu, C., Zorlu, K., 2004. A fuzzy model to predict the uniaxial compressivestrength and the modulus of elasticity of a problematic rock. EngineeringApplications of Artificial Intelligence 17 (1), 61–72.
Gokceoglu, C., Zorlu, K., Ceryan, S., Nefeslioglu, H.A., 2009b. A comparative studyon indirect determination of degree of weathering of granites from somephysical and strength parameters by two soft computing techniques. MaterialsCharacterization 60, 1317–1327.
Gorum, T., Gonencgil, B., Gokceoglu, C., Nefeslioglu, H.A., 2008. Implementation ofreconstructed geomorphologic units in landslide susceptibility mapping: theMelen Gorge (NW Turkey). Natural Hazards 46 (3), 323–351.
Hall, F.G., Towhshend, J.R., Engman, E.T., 1995. Status of remote sensing algorithmsfor estimation of land surface state parameters. Remote Sensing of Environ-ment 51, 138–156.
Juang, C.H., Lee, D.H., Sheu, C., 1992. Mapping slope failure potential using fuzzysets. Journal of Geotechnical Engineering ASCE 118, 475–494.
Kanungo, D.P., Arora, M.K., Sarkar, S., Gupta, R.P., 2006. A comparative study ofconventional, ANN black box, fuzzy and combined neural and fuzzy weightingprocedures for landslide susceptibility zonation in Darjeeling Himalayas.Engineering Geology 85 (3–4), 347–366.
Kayabasi, A., Gokceoglu, C., Ercanoglu, M., 2003. Estimating the deformationmodulus of rock masses: a comparative study. International Journal of RockMechanics and Mining Science 40 (1), 55–63.
Lamelas, M.T., Marinoni, O., Hoppe, A., De La Riva, J., 2008. Doline probability mapusing logistic regression and GIS technology in the central Ebro Basin (Spain).Environmental Geology 54, 963–977.
Lee, D.H., Juang, C.H., 1992. Evaluation of failure potential in mudstone slopesusing fuzzy sets. ASCE Geotechnical Special Publication 31, Stability andPerformance of Slopes and Embankment-II, vol. 2; pp. 1137–1151.
Lee, S., 2005. Application of logistic regression model and its validation forlandslide susceptibility mapping using GIS and remote sensing data. Interna-tional Journal of Remote Sensing 26, 1477–1491.
Lee, S., Pradhan, B., 2006. Probabilistic landslide hazards and risk mapping onPenang Island, Malaysia. Earth System Science 115 (6), 661–672.
Lee, S., Ryu, J.H., Won, J.S., Park, H., 2004. Determination and application of theweights for landslide susceptibility mapping using an artificial neural net-work. Engineering Geology 71, 289–302.
Lui, Y., Guo, H.C., Zou, R., Wang, L.J., 2006. Neural network modelling for regionalhazard assessment of debris flow in Lake Qionghai Watershed, China.Environmental Geology 49, 968–976.
Mamdani, E.H., Assilian, S., 1975. An experiment in linguistic synthesis with afuzzy logic controller. International Journal of Man–Machine Studies 7 (1),1–13.
MATLAB, 2009. User’s Guide Version 7.8, R2009a. MathWorks Co., USA.
ogram (MamLand) for the assessment of landslide susceptibility, doi:10.1016/j.cageo.2011.04.012

A. Akgun et al. / Computers & Geosciences ] (]]]]) ]]]–]]]12
Melchiorre, C., Matteucci, M., Azzoni, A., Zanchi, A., 2008. Artificial neural net-works and cluster analysis in landslide susceptibility zonation. Geomorphol-ogy 94, 379–400.
Moore, I.D., Grayson, R.B., Ladson, A.R., 1991. Digital terrain modeling: a review ofhydrological, geomorphological and biological applications. Hydrological Pro-cesses 13 (4), 305–320.
Nandi, A., Shakoor, A., 2009. A GIS-based landslide susceptibility evaluation usingbivariate and multivariate statistical analyses. Engineering Geology 110,11–20.
Nefeslioglu, H.A., Duman, T.Y., Durmaz, S., 2008a. Landslide susceptibility mappingfor a part of tectonic Kelkit Valley (Eastern Black Sea region of Turkey).Geomorphology 94 (3–4), 401–418.
Nefeslioglu, H.A., Gokceoglu, C., 2011. Probabilistic risk assessment in mediumscale for rainfall induced earthflows: Catakli catchment area (Cayeli, Rize,Turkey). Mathematical Problems in Engineering Article ID 280431.
Nefeslioglu, H.A., Gokceoglu, C., Sonmez, H., 2008b. An assessment on the use oflogistic regression and artificial neural networks with different samplingstrategies for the preparation of landslide susceptibility maps. EngineeringGeology 97, 171–191.
Nefeslioglu, H.A., Gokceoglu, C., Sonmez, H., 2003. A Mamdani model to predict theweighted joint density. Lecture Notes in Artificial Intelligence 2773,1052–1057.
Nefeslioglu, H.A., Gokceoglu, C., Sonmez, H., 2006. Indirect determination of blocksize by empirical and fuzzy models: Supren (Eskisehir, Turkey) Marbles.Engineering Geology 85, 251–269.
Nefeslioglu, H.A., Sezer, E., Gokceoglu, C., Bozkir, A.S., Duman, T.Y., 2010. Assess-ment of landslide susceptibility by decision trees in the metropolitan area ofIstanbul, Turkey. Mathematical Problems in Engineering, 1–15. doi:10.1155/2010/901095.
Pachauri, A.K., Pant, M., 1992. Landslide hazard mapping based on geologicalattributes. Engineering Geology 32, 81–100.
Pradhan, B., 2010. Remote sensing and GIS-based landslide hazard analysis andcross-validation using multivariate logistic regression model on three testareas in Malaysia. Advances in Space Research 45 (10), 1244–1256.
Pradhan, B., Lee, S., Buchroithner, M.F., 2009. Use of geospatial data for thedevelopment of fuzzy algebraic operators to landslide hazard mapping: a casestudy in Malaysia. Applied Geomatics 1, 3–15.
Pradhan, B., Lee, S., Mansor, S., Buchroithner, M.F., Jallaluddin, N., Khujaimah, Z.,2008. Utilization of optical remote sensing data and geographic informationsystem tools for regional landslide hazard analysis by using binomial logisticregression model. Applied Remote Sensing 2, 1–11.
Pradhan, B., Sezer, E.A., Gokceoglu, C., Buchroithner, M.F., 2010. Landslide suscept-ibility mapping by neuro-fuzzy approach in a landslide prone area (CameronHighland, Malaysia). IEEE Transactions on Geoscience and Remote Sensing 48(12), 4164–4177.
Pradhan, B., Singh, R.P., Buchroithner, M.F., 2006. Estimation of stress and its use inevaluation of landslide prone regions using remote sensing data. Advances inSpace Research 37, 698–709.
Remondo, J., Gonzalez, A., Diaz de Teran, J.R., Cendrero, A., Fabbri, A., Cheng, C.F.,2003. Validation of landslide susceptibility maps: examples and applicationsfrom a case study in Northern Spain. Natural Hazards 30 (3), 437–449.
Rodhe, A., Seibert, J., 1999. Wetland occurrence in relation to topography: a test oftopographic indices as moisture indicators. Agricultural and Forest Meteorol-ogy 98–99, 325–340.
Please cite this article as: Akgun, A., et al., An easy-to-use MATLAB prusing a Mamdani fuzzy algorithm. Computers & Geosciences (2011)
Ross, T.J., 1995. Fuzzy Logic with Engineering Applications. McGraw-Hill Inc., NewYork 579pp.
Saboya Jr., F., Alves, M.G., Pinto, W.D., 2006. Assessment of failure susceptibility ofsoil slopes using fuzzy logic. Engineering Geology 86, 211–224.
Setnes, M., Babuska, R., Verbruggen, H.B., 1998. Rule-based modeling: precisionand tranparency. IEEE Transactions on Systems Man and Cybernetics, Part C28, 165–169.
Sezer, E.A., Pradhan, B., Gokceoglu, C., 2011. Manifestation of an adaptive neuro-fuzzy model on landslide susceptibility mapping: Klang valley, Malaysia.Expert Systems with Applications 38 (7), 8208–8219.
Soeters, R., Van Westen, C.J., 1996. Slope instability recognition analysis andzonation. In: Turner, K.T., Schuster, R.L. (Eds.), Landslides: Investigation andMitigation. Transportation Research Board National Research Council,Washington, DC, pp. 129–177 Special Report No. 247.
Sonmez, H., Gokceoglu, C., Ulusay, R., 2003. An application of fuzzy sets to the GSIsystem in rock engineering. Engineering Applications of Artificial Intelligence16 (3), 251–269.
Sonmez, H., Tuncay, E., Gokceoglu, C., 2004. Models to predict the uniaxialcompressive strength and the modulus of elasticity for Ankara agglomerates.International Journal of Rock Mechanics and Mining Science 41 (5), 717–729.
Tunusluoglu, M.C., Gokceoglu, C., Nefeslioglu, H.A., Sonmez, H., 2008. Extraction ofpotential debris source areas by logistic regression technique: a case studyfrom Barla, Besparmak and Kapi mountains (NW Taurids, Turkey). Environ-mental Geology 54, 9–22.
Turer, D., Nefeslioglu, H.A., Zorlu, K., Gokceoglu, C., 2008. Assessment of geoenvironmental problems of the Zonguldak province NW Turkey. Environmen-tal Geology 55 (5), 1001–1014.
Turrini, M.C., Visintainer, P., 1998. Proposal of a method to define areas oflandslide hazard and application to an area of the Dolomites, Italy. EngineeringGeology 50, 255–265.
Weier, J., Herring, D., 2005. Measuring Vegetation (NDVI and EVI). Earth Observa-tory Library of NASA. /http://earthobservatory.nasa.gov/Library/Measuring-VegetationS.
Wilson, J.P., Gallant, J.C., 2000. Terrain Analysis: Principles and Applications. JohnWiley and Sons, New York, 469pp.
Wood, E.F., Sivapalan, M., Beven, K.J., 1990. Similarity and scale catchment stormresponse. Reviews in Geophysics 28, 1–18.
Yagiz, S., Gokceoglu, C., 2010. Application of fuzzy inference system and nonlinearregression models for predicting rock brittleness. Expert Systems withApplications 37, 2265–2272.
Yilmaz, I., 2009. Landslide susceptibility mapping using frequency ratio, logisticregression, artificial neural networks and their comparison: a case study fromKat landslides (Tokat-Turkey). Computers and Geosciences 35 (6), 1125–1138.
Yilmaz, I., 2010a. The effect of the sampling strategies on the landslide suscept-ibility mapping by conditional probability (CP) and artificial neural network(ANN). Environmental Earth Sciences 60, 505–519.
Yilmaz, I., 2010b. Comparison of landslide susceptibility mapping methodologiesfor Koyulhisar, Turkey: conditional probability, logistic regression, artificialneural networks, and support vector machine. Environmental Earth Sciences61, 821–836.
Zinko, U., Seibert, J., Dynesius, M., Nilsson, C., 2005. Plant species numberspredicted by a topography based groundwater-flow index. Ecosystems 8,430–441.
Zweig, M.H., Campbell, G., 1993. Receiver-operating characteristic (ROC) plots.Clinical Chemistry 39, 561–577.
ogram (MamLand) for the assessment of landslide susceptibility, doi:10.1016/j.cageo.2011.04.012