First Quarter 2009 Results - Norfolk Southern Quarter 2009 Results ... Merchandise. $2,083 $36 2%....
20
First Quarter 2009 Results Donald W. Seale Executive Vice President and Chief Marketing Officer
Transcript of First Quarter 2009 Results - Norfolk Southern Quarter 2009 Results ... Merchandise. $2,083 $36 2%....

First Quarter 2009 ResultsDonald W. SealeExecutive Vice President and Chief Marketing Officer
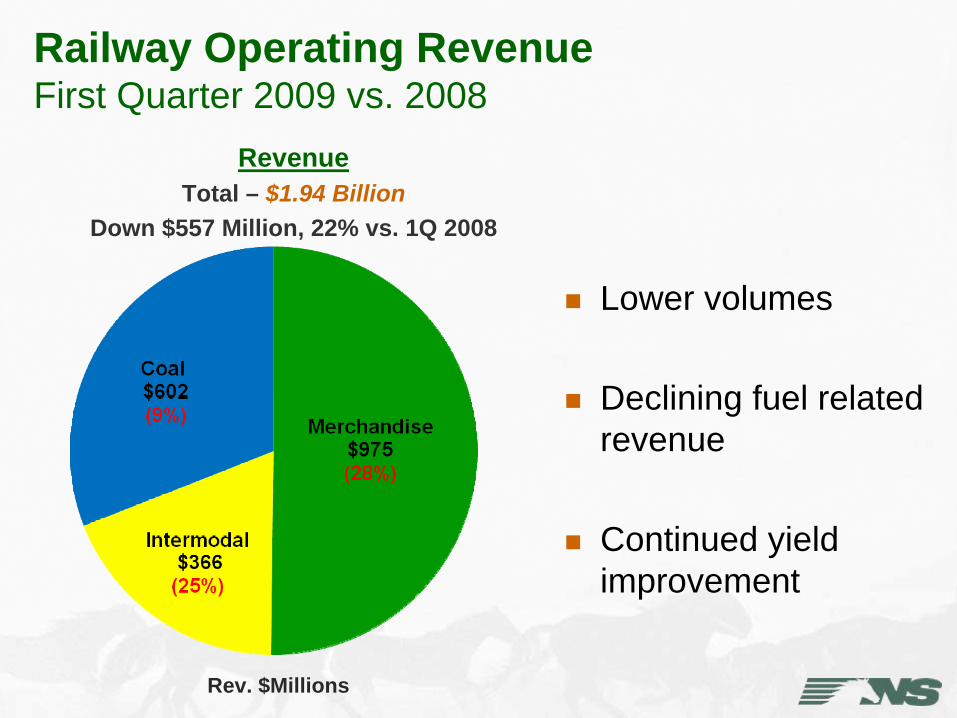
Railway Operating Revenue First Quarter 2009 vs. 2008
RevenueTotal – $1.94 Billion
Down $557 Million, 22% vs. 1Q 2008
Rev. $Millions
Lower volumes
Declining fuel related revenue
Continued yield improvement

Revenue Per Unit First Quarter 2009 vs. 2008
1Q 2009 vs. 1Q 2008
Rev/Unit Abs. % Chg.
Agriculture $2,129 $161 8%
MetCon $1,514 ($122) (7%)
Paper $2,222 $83 4%
Chemicals $2,941 ($45) (2%)
Automotive $1,817 ($91) (5%)
Merchandise $2,083 $36 2%
Intermodal $604 ($52) (8%)
Coal $1,581 $30 2%
Total $1,335 ($32) (2%)
Declining fuel related revenue
Negative RCAF impact
Continued yield improvement
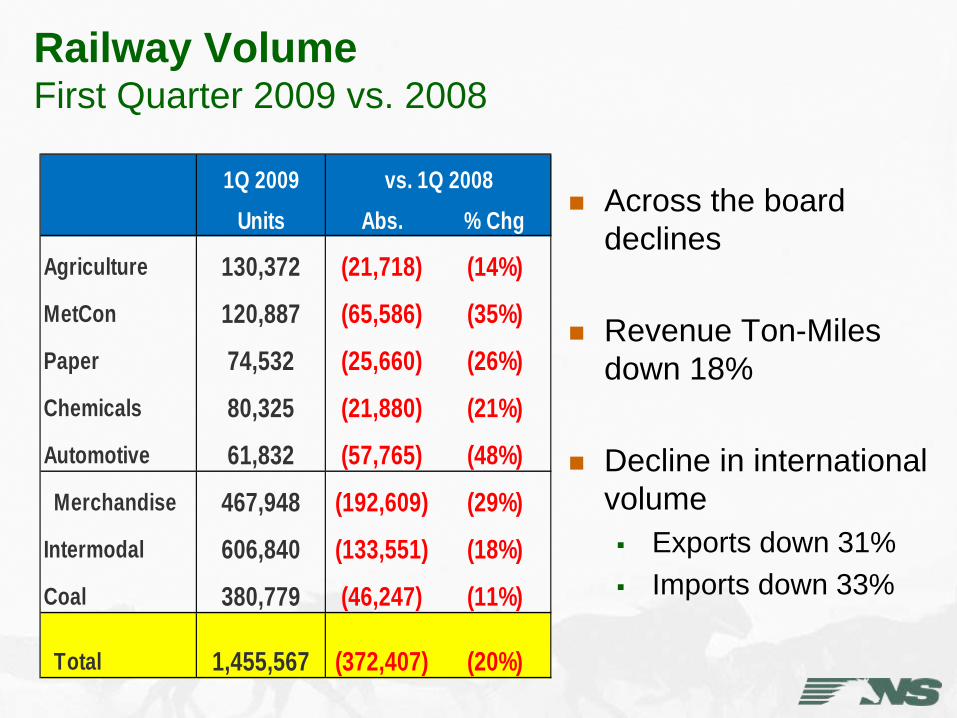
Railway Volume First Quarter 2009 vs. 2008
1Q 2009 vs. 1Q 2008Units Abs. % Chg
Agriculture 130,372 (21,718) (14%)MetCon 120,887 (65,586) (35%)Paper 74,532 (25,660) (26%)Chemicals 80,325 (21,880) (21%)Automotive 61,832 (57,765) (48%) Merchandise 467,948 (192,609) (29%)Intermodal 606,840 (133,551) (18%)Coal 380,779 (46,247) (11%)
Total 1,455,567 (372,407) (20%)
Across the board declines
Revenue Ton-Miles down 18%
Decline in international volume
Exports down 31%Imports down 33%

Coal Variance Analysis First Quarter 2009 vs. 2008
Revenue Carloads Rev/Car
1Q 2009 1Q 2008 ChangeRevenue ($Millions) $602 $662 ($60)
Volume 380,779 427,026 (46,247)
Rev/Car $1,581 $1,551 $30

Coal Markets First Quarter 2009 vs. 2008
Lower electricity demand & higher stockpiles
Competition from natural gas
Decline in domestic & global steel production
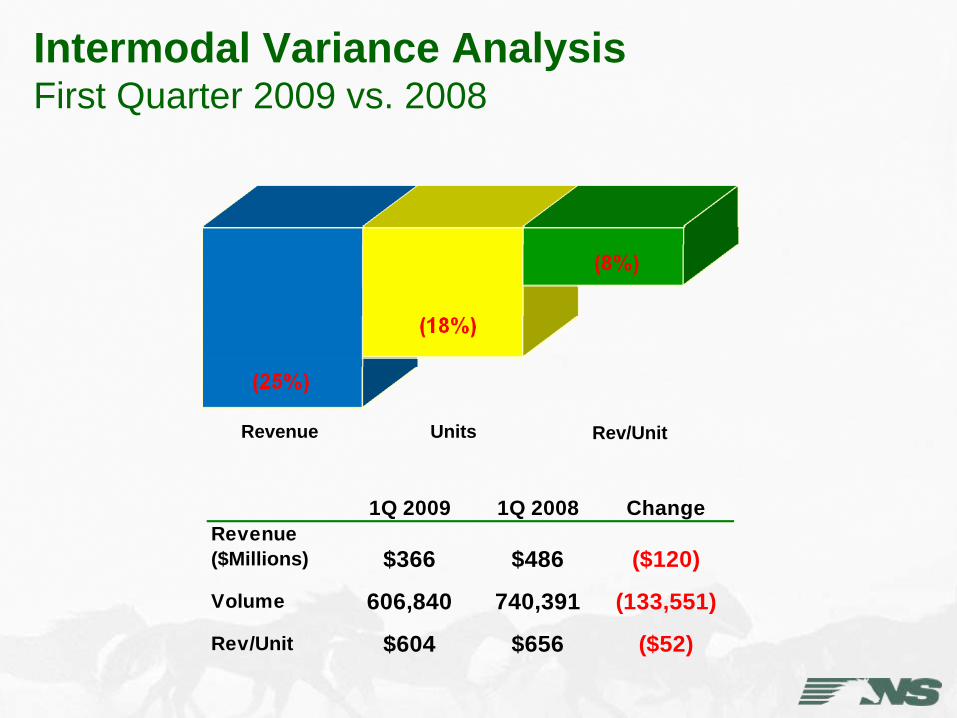
Intermodal Variance Analysis First Quarter 2009 vs. 2008
Revenue Units Rev/Unit
1Q 2009 1Q 2008 ChangeRevenue ($Millions) $366 $486 ($120)
Volume 606,840 740,391 (133,551)
Rev/Unit $604 $656 ($52)
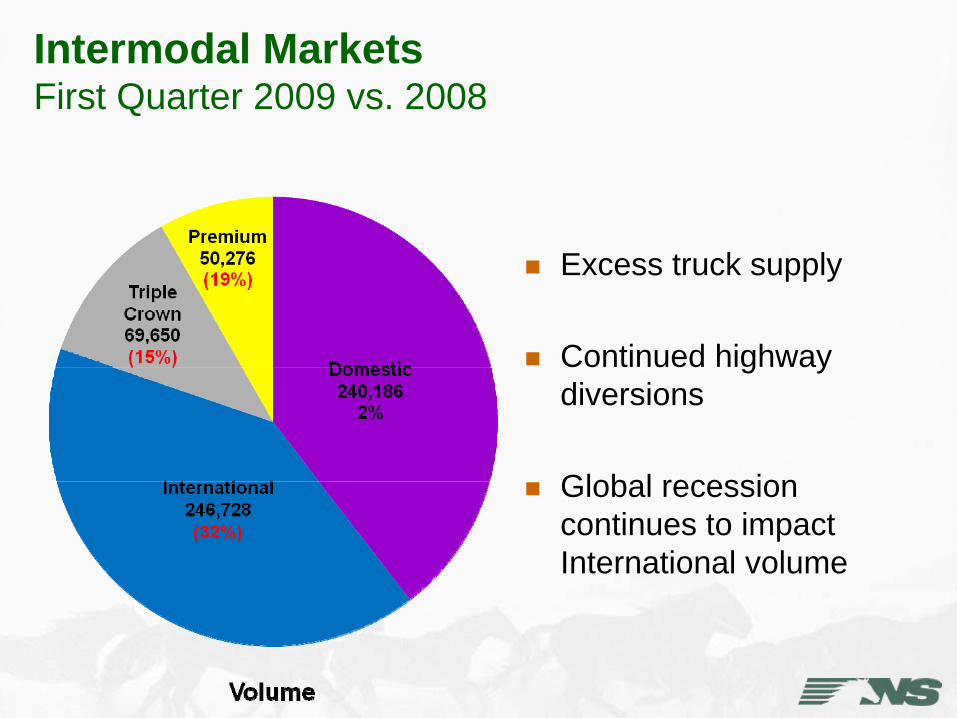
Intermodal Markets First Quarter 2009 vs. 2008
Excess truck supply
Continued highway diversions
Global recession continues to impact International volume

Merchandise Variance Analysis First Quarter 2009 vs. 2008
Revenue Carloads Rev/Car
1Q 2009 1Q 2008 ChangeRevenue ($Millions) $975 $1,352 ($377)
Volume 467,948 660,557 (192,609)
Rev/Car $2,083 $2,047 $36

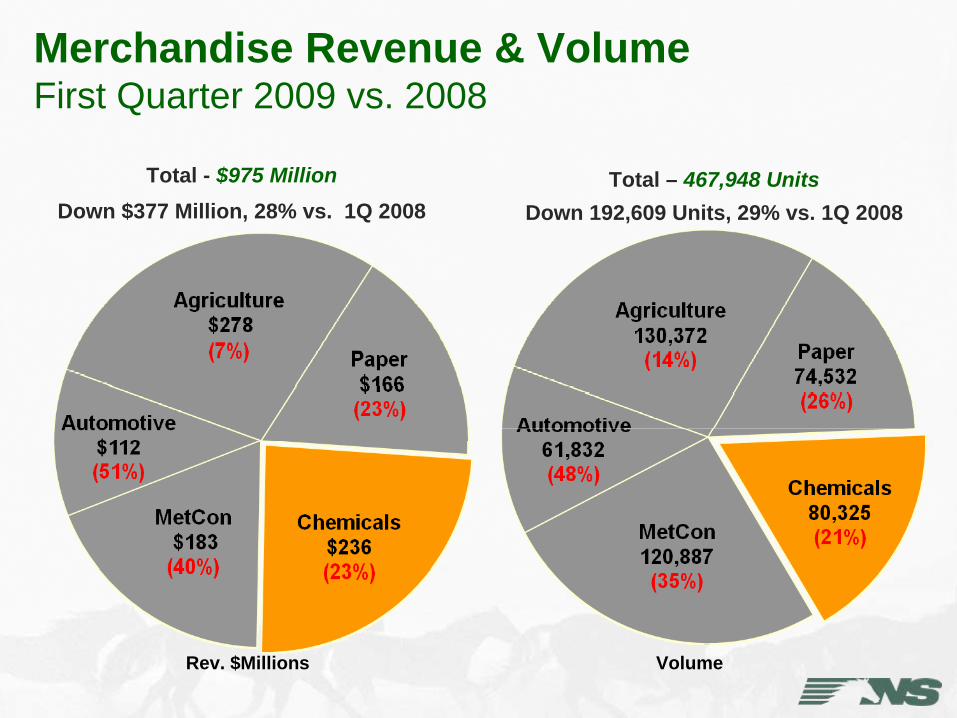
Merchandise Revenue & Volume First Quarter 2009 vs. 2008
Total - $975 MillionDown $377 Million, 28% vs. 1Q 2008
Rev. $Millions
Total – 467,948 UnitsDown 192,609 Units, 29% vs. 1Q 2008
Volume

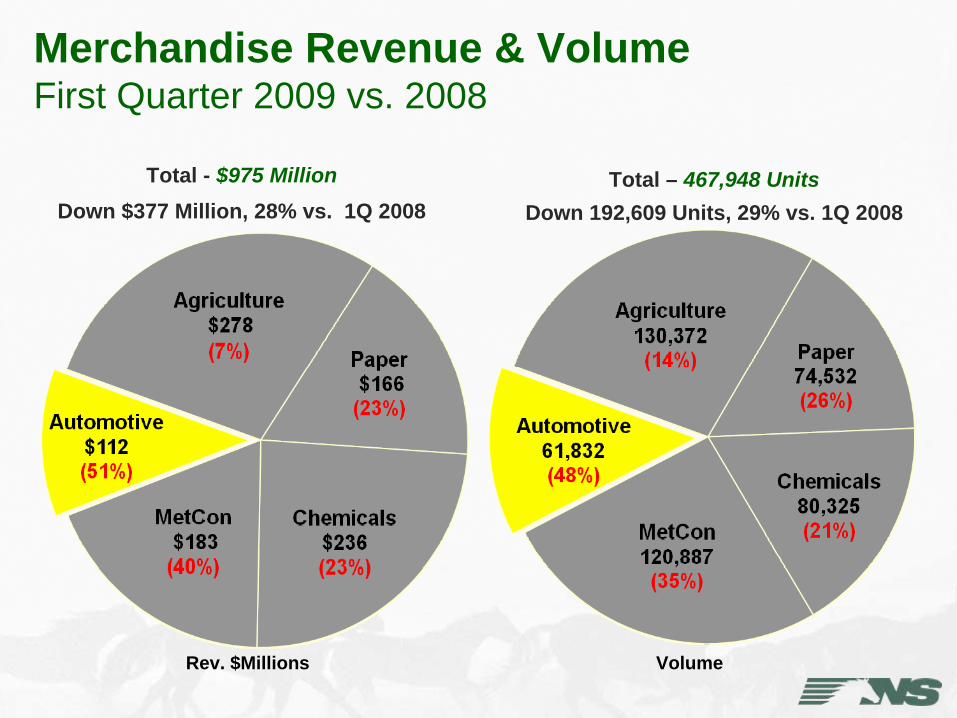
Merchandise Revenue & Volume First Quarter 2009 vs. 2008
Total - $975 MillionDown $377 Million, 28% vs. 1Q 2008
Rev. $Millions
Total – 467,948 UnitsDown 192,609 Units, 29% vs. 1Q 2008
Volume
Merchandise Revenue & Volume First Quarter 2009 vs. 2008
Total - $975 MillionDown $377 Million, 28% vs. 1Q 2008
Rev. $Millions
Total – 467,948 UnitsDown 192,609 Units, 29% vs. 1Q 2008
Volume

Merchandise Revenue & Volume First Quarter 2009 vs. 2008
Total - $975 MillionDown $377 Million, 28% vs. 1Q 2008
Rev. $Millions
Total – 467,948 UnitsDown 192,609 Units, 29% vs. 1Q 2008
Volume
Merchandise Revenue & Volume First Quarter 2009 vs. 2008
Total - $975 MillionDown $377 Million, 28% vs. 1Q 2008
Rev. $Millions
Total – 467,948 UnitsDown 192,609 Units, 29% vs. 1Q 2008
Volume

Looking Ahead
Coal
Merchandise
Weak metallurgical demand in U.S. and export markets
Lower electricity demand
Stockpiles at or above target levels
Competition from Natural Gas
Automotive and housing markets – the bottom may be at handProject growth – Scrubber Stone, AgriFuels, Military Traffic and Waste Products

Looking Ahead
IntermodalLocal domestic market growth
Weak international shipments
Continued progress on corridor initiatives and new products

CN-NS MidAmericaCorridor Initiative
In partnership with the CN and WTNN Railroad
Shorter/Faster routes between Midwest and Southeast
New coal route – Illinois Basin to Southeast
Longer term potential as Intermodal route from Chicago to Florida

Titusville, Florida Intermodal Terminal
Opened February 16, 2009
Access to Orlando and Tampa markets
New Intermodal services between major markets
It’s a BLAST!

Joint Venture with Pan Am Railways
STB approved March 10
Closed on April 9
Faster, more reliable service into New England
Expanded auto, Intermodal and transload terminals
Looking Ahead
Pricing EnvironmentStrong safety and service performance
Lower fuel revenue
Continued yield growth reflecting the value of our product
70% of book priced for 2009 on January 1
80% of book priced through first quarter