Third Quarter 2015 Results
16
©2015 Google Genworth MI Canada Inc. Third Quarter 2015 Results October 30 th , 2015
-
Upload
genworthfinancial -
Category
Investor Relations
-
view
411 -
download
0
Transcript of Third Quarter 2015 Results

©2015 Google
Genworth MI Canada Inc.
Third Quarter 2015
Results
October 30th, 2015

Q3 2015 Genworth MI Canada Inc. 2
Forward-Looking and Non-IFRS Statements
Public communications, including oral or written communications such as this document, relating to Genworth MI Canada Inc. (the
“Company”, “Genworth Canada” or “MIC”) often contain certain forward-looking statements. These forward-looking statements
include, but are not limited to, statements with respect to the Company’s future operating and financial results, expectations
regarding premiums written, losses on claims and investment income, the Canadian housing market, and other statements that are
not historical facts. These forward-looking statements may be identified by their use of words such as “may”, “would”, “could”, “will,”
“intend”, “plan”, “anticipate”, “believe”, “seek”, “propose”, “estimate”, “expect”, and similar expressions. These statements are based
on the Company’s current assumptions, including assumptions regarding economic, global, political, business, competitive, market
and regulatory matters. These forward-looking statements are inherently subject to significant risks, uncertainties and changes in
circumstances, many of which are beyond the control of the Company. The Company’s actual results may differ materially from
those expressed or implied by such forward-looking statements, including as a result of changes in the facts underlying the
Company’s assumptions, and the other risks described in the Company’s Annual Information Form dated March 23, 2015, its Short
Form Base Shelf Prospectus dated June 18, 2014, the Prospectus Supplements thereto, its most recently issued Management’s
Discussion and Analysis and all documents incorporated by reference in such documents. Management’s current views regarding
the Company’s financial outlook are stated as of the date hereof and may not be appropriate for other purposes. Other than as
required by applicable laws, the Company undertakes no obligation to publicly update or revise any forward-looking statement,
whether as a result of new information, future developments or otherwise.
To supplement its financial statements, the Company uses select non-IFRS financial measures. Non-IFRS financial measures
include net operating income, interest and dividend income (net of investment expenses), operating earnings per common share
(basic), operating earnings per common share (diluted), shareholders’ equity excluding accumulated other comprehensive income
(“AOCI”), operating return on equity and underwriting ratios such as loss ratio, expense ratio and combined ratio. The Company
believes that these non-IFRS financial measures provide meaningful supplemental information regarding its performance and may
be useful to investors because they allow for greater transparency with respect to key metrics used by management in its financial
and operational decision making. Non-IFRS measures do not have standardized meanings and are unlikely to be comparable to any
similar measures presented by other companies. These measures are defined in the Company’s glossary, which is posted on the
Company’s website at http://investor.genworthmicanada.ca. A reconciliation from non-IFRS financial measures to the most readily
comparable measures calculated in accordance with IFRS, where applicable can be found in the Company’s most recent
management’s discussion and analysis, which is posted on the Company’s website and is also available at www.sedar.com.

Q3 2015 Genworth MI Canada Inc. 3
$0.96 $1.03
$1.04 $0.99
$0.97 $1.00
2014 YTD 2015 YTD
$34.57$35.02
$36.07 $36.18 $36.14
Q3 2014 Q4 2014 Q1 2015 Q2 2015 Q3 2015
Q3 2015 financial results
$MM except ROE,
EPS and MCT
Q3
2015
Q2
2015
Q3
2014
Q/Q Y/Y
Premiums written $260 $205 $217 +27% +20%
Loss ratio 21% 17% 21% +4 pts Flat
Net Operating Income $92 $92 $93 Flat Flat
Operating ROE 12% 12% 12% Flat Flat
Operating EPS
(diluted)
$1.00 $0.99 $0.97 +1% +3%
MCT 1 227% 231% 224% -4 pts +3 pts
Book Value Per Share (diluted, including AOCI)
Highlights
Strong top line growth of +20% Y/Y
Loss ratio of 21%
Operating income flat Q/Q
Consistent ROE performance
Ongoing capital strength
Q4 dividend increase of 8% to $0.42 per share
Operating EPS (diluted)
1 3Q15 based on company estimate.
$2.96
Q1
Q2
Q3
$3.02
Q3 2015 Genworth MI Canada Inc. 4
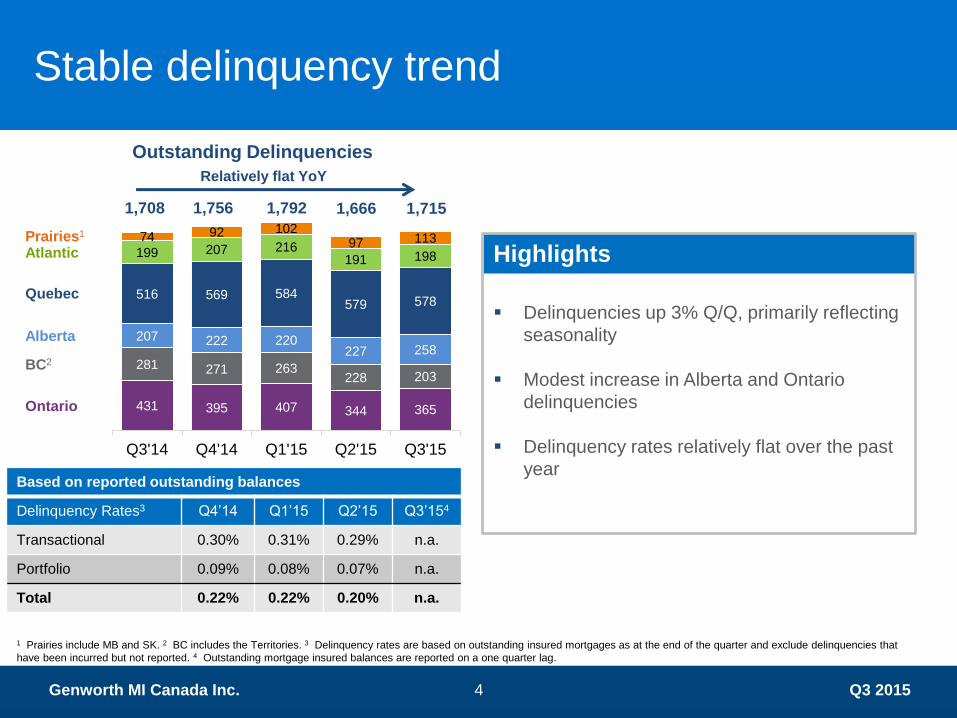
431 395 407 344 365
281 271 263 228 203
207 222 220 227 258
516 569 584 579 578
199 207 216 191 198
74 92 102 97 113
Q3'14 Q4'14 Q1'15 Q2'15 Q3'15
1,708 1,756 1,792 1,666 1,715
Outstanding Delinquencies
Ontario
BC2
Alberta
Quebec
Atlantic Highlights
Delinquencies up 3% Q/Q, primarily reflecting
seasonality
Modest increase in Alberta and Ontario
delinquencies
Delinquency rates relatively flat over the past
year
Prairies1
Based on reported outstanding balances
Delinquency Rates3 Q4’14 Q1’15 Q2’15 Q3’154
Transactional 0.30% 0.31% 0.29% n.a.
Portfolio 0.09% 0.08% 0.07% n.a.
Total 0.22% 0.22% 0.20% n.a.
1 Prairies include MB and SK. 2 BC includes the Territories. 3 Delinquency rates are based on outstanding insured mortgages as at the end of the quarter and exclude delinquencies that
have been incurred but not reported. 4 Outstanding mortgage insured balances are reported on a one quarter lag.
Stable delinquency trend
Relatively flat YoY

Q3 2015 Genworth MI Canada Inc. 5
STRONG CREDIT PROFILE WITH AVERAGE CREDIT SCORE OF 744
Q3 2015 Genworth’s served market
City Average Home Price Average
Income
Average
Gross Debt
Servicing
Average
Credit
Score
Genworth Market % Variance Genworth Genworth Genworth
Vancouver $519K $881K -41% $125K 28% 754
Toronto $472K $626K -25% $107K 29% 750
Calgary $425K $454K -6% $109K 27% 749
Montreal $280K $340K -18% $86K 25% 750
Rest of
Canada $297K $376K -21% $95K 23% 742
Canada $328K $442K -26% $97K 24% 744
Note: Q3’15 data; Genworth averages for purchase deals only, market averages from CREA; market “Rest of Canada” calculated by using weighted averages of CREA cities
GENWORTH’S AVERAGE HOME PRICE ~26% LOWER THAN MARKET AVERAGE…

Q3 2015 Genworth MI Canada Inc. 6
($MM except EPS and BVPS) Q3’15 Q2’15 Q3’14
Transactional premiums written $236 $183 $191
Portfolio premiums written 24 22 25
Premiums written $260 $205 $217
Premiums earned 148 144 140
Losses on claims (31) (25) (30)
Expenses (28) (29) (24)
Underwriting income $89 $90 $87
Investment income (excl. realized gains / losses)
42 42 43
Net operating Income $92 $92 $93
Diluted operating EPS $1.00 $0.99 $0.97
Book value per share (diluted, incl. AOCI)
$36.14 $36.18 $34.57
Highlights
Premiums Written higher by 20% Y/Y
primarily due to market penetration and
2014 & 2015 premium rate increases
Premiums Earned increased by 3% Q/Q
and 5% Y/Y as a result of the larger
recent books
Loss ratio of 21%, up 4 pts Q/Q
consistent with typical seasonality
Consistent investment income Q/Q
Core operating income flat Q/Q
Book value per share up 5% Y/Y
Solid financial performance

Q3 2015 Genworth MI Canada Inc. 7
$73 $71 $104
$111 $128
$183
$144 $191
$236 $119
$165
2013 YTD 2014 YTD 2015 YTD
Premiums Earned ($ millions)
Transactional Premiums Written ($ millions)
Q1
Q2
Q3
Strong premiums written growth
Portfolio
Total
$55 $70 $71
$383 $461 $595
3QYTD
= $328
Vol = $75
Price = $57
$141 $143
$141 $144
$140 $148
2014 YTD 2015 YTD
$422 $435
Unearned Premiums
Reserve ($B) $1.8 $2.0
Q1
Q2
Q3
3QYTD
= $390
Q4
3QYTD
= $523
1 Based on 2014 & 2015 price increases, assuming $22 billion of Transactional NIW, consistent with 2014 actual results.
45
100
130 130
0
50
100
150
2014 2015 2016 2017
Premiums Written Premiums Earned
2 15 40
65
0
20
40
60
80
2014 2015 2016 2017
+13
+63
+132 +3%
+25
+25
Cumulative Impact of 2014 & 2015 Price Increases1 - ($ millions)
PREMIUMS WRITTEN INCREASE PROVIDES TAILWIND FOR PREMIUMS EARNED

Q3 2015 Genworth MI Canada Inc. 8
87 76
87 90 89
24 30
24 29 28
30 37 31 25 31
Q3'14 Q4'14 Q1'15 Q2'15 Q3'15
Underwriting Profitability
Underwriting
profit
Expenses
Losses on claims
Loss ratio 21% 26% 22% 17% 21%
Expense ratio 17% 21% 17% 20% 19%
Combined ratio 38% 47% 39% 37% 40%
New delinquencies
net of cures 412 489 432 319 440
($millions)
Highlights
Consistently strong underwriting
performance
YTD loss ratio of 20% at bottom of full
year loss ratio target range of 20 to 30%
New delinquencies net of cures
normalized in Q3 from seasonal low in Q2
Modest increase in the number of new
delinquencies in Alberta
Expense ratio of 19% in line with target
Premiums earned $140 $143 $143 $144 $148
Solid underwriting profitability

Q3 2015 Genworth MI Canada Inc. 9
Total Invested Assets
1 Market value, includes CLOs. 2 Pre-tax equivalent book yield after dividend gross-up of general portfolio (as at September 30, 2015).
Portfolio
Invested assets and cash (market value) $5.7 billion
Pre-tax yield2 3.3%
Duration 3.8 years
Highlights
Focus on high quality investments
93%1 of the portfolio is fixed income, 100%
of which is Investment Grade
Low rate environment continues to pressure
investment yield
Investments contribute steady income
Corporates, 41%
Federal, 34%
Provincial, 18%
Cash, 4%
Fixed income rating distribution:
AAA = 43%
AA = 20%
A = 27%
BBB = 10%
High-quality
fixed income
securities
Preferred
Equity, 3%
Total
Portfolio
of C$5.7
billion
Q3 2015 Genworth MI Canada Inc. 10
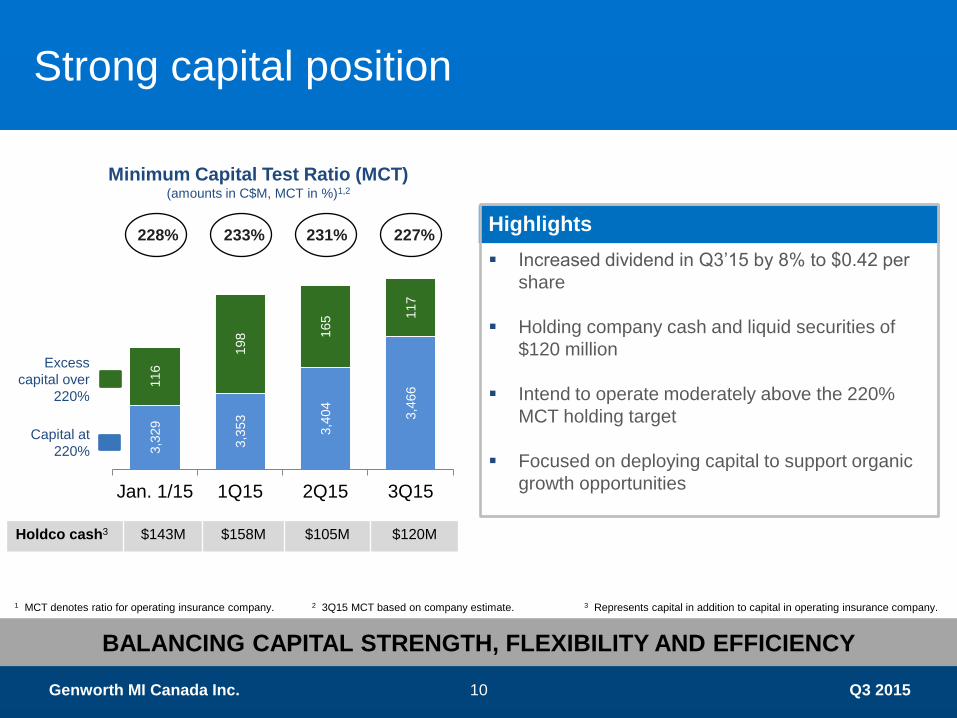
3,3
29
3,3
53
3,4
04
3,4
66 116
198 165 117
Jan. 1/15 1Q15 2Q15 3Q15
Minimum Capital Test Ratio (MCT) (amounts in C$M, MCT in %)1,2
Capital at
220%
Excess
capital over
220%
Highlights
Increased dividend in Q3’15 by 8% to $0.42 per
share
Holding company cash and liquid securities of
$120 million
Intend to operate moderately above the 220%
MCT holding target
Focused on deploying capital to support organic
growth opportunities
BALANCING CAPITAL STRENGTH, FLEXIBILITY AND EFFICIENCY
Strong capital position
228% 233% 231% 227%
Holdco cash3 $143M $158M $105M $120M
1 MCT denotes ratio for operating insurance company. 2 3Q15 MCT based on company estimate. 3 Represents capital in addition to capital in operating insurance company.

Q3 2015 Genworth MI Canada Inc. 11
Alberta: Proactive risk management
Regional NIW Dispersion (Transactional)1
27% 24% 21%
37% 35% 42%
12% 16% 10%
12% 13% 13%
13% 11% 13%
0%
20%
40%
60%
80%
100%
2014 1H2015 3Q2015
Alberta Ontario Quebec B.C. Other
Highlights
Underwriting actions resulting in smaller but
better quality Alberta portfolio in 2015
Reduced exposure to areas in Alberta that are
more dependent on oil and gas sector
Slower housing markets in Calgary and
Edmonton however prices remain flat year-to-
date
GEOGRAPHICALLY DIVERSIFIED … ALBERTA EXPOSURE REDUCED TO 21%
1 BC includes the Territories.
Alberta

Q3 2015 Genworth MI Canada Inc. 12
Alberta: Portfolio quality
Highlights
Steady credit score improvement year-
over-year
Less exposure to higher risk products
and borrowers for > 80% LTV
No > 95% LTVs
No re-finances
No > 25 year amortization mortgages
No investment properties
Modest home price increases
Stable debt servicing ratios
Average
Credit Score
Average
Home Price
Average
Gross Debt
Service Ratio
17%
5%
713
738
0%
5%
10%
15%
20%
'07 '08 '09 '10 '11 '12 '13 '14 ' 15YTD
700
710
720
730
740
750
% Score <660 (R) Avg Score (L)
25 25 24 25 25 24 24 25 24
'07 '08 '09 '10 '11 '12 '13 '14 '15 YTD
(%)
317 332 327 344 352 355 359 374 382
'07 '08 '09 '10 '11 '12 '13 '14 '15 YTD
ALBERTA PORTFOLIO QUALITY SIGNIFICANTLY IMPROVED COMPARED TO ‘07/08
Q3 2015 Genworth MI Canada Inc. 13
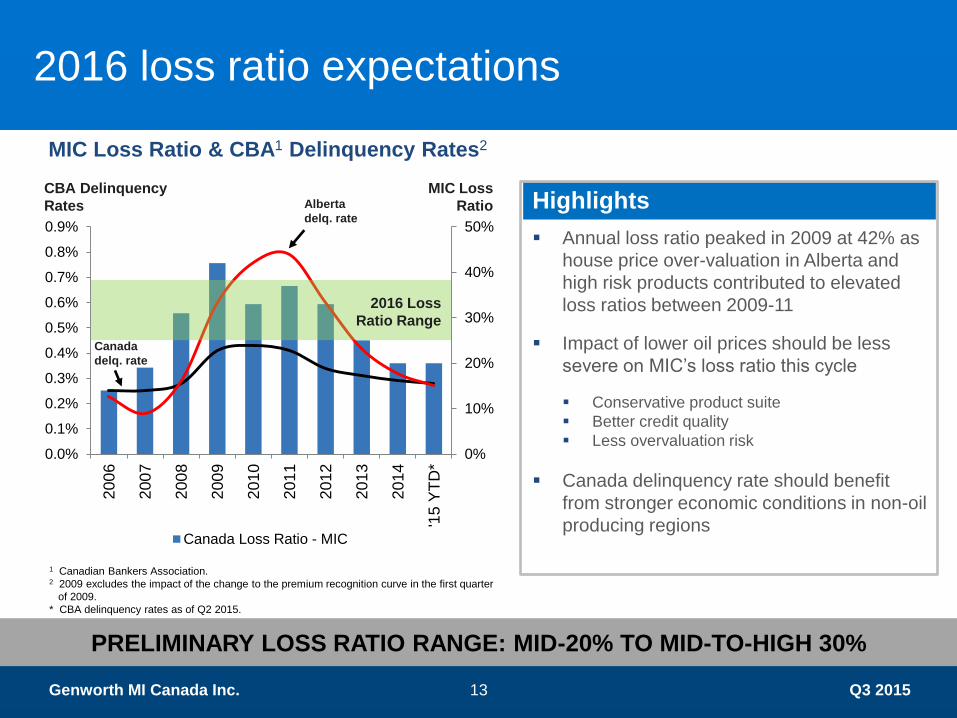
2016 loss ratio expectations
PRELIMINARY LOSS RATIO RANGE: MID-20% TO MID-TO-HIGH 30%
1 Canadian Bankers Association. 2 2009 excludes the impact of the change to the premium recognition curve in the first quarter
of 2009.
* CBA delinquency rates as of Q2 2015.
0%
10%
20%
30%
40%
50%
0.0%
0.1%
0.2%
0.3%
0.4%
0.5%
0.6%
0.7%
0.8%
0.9%
200
6
200
7
200
8
200
9
201
0
201
1
201
2
201
3
201
4
'15 Y
TD
*
Canada Loss Ratio - MIC
2016 Loss
Ratio Range
Highlights
Annual loss ratio peaked in 2009 at 42% as
house price over-valuation in Alberta and
high risk products contributed to elevated
loss ratios between 2009-11
Impact of lower oil prices should be less
severe on MIC’s loss ratio this cycle
Conservative product suite
Better credit quality
Less overvaluation risk
Canada delinquency rate should benefit
from stronger economic conditions in non-oil
producing regions
MIC Loss Ratio & CBA1 Delinquency Rates2
Alberta
delq. rate
Canada
delq. rate
CBA Delinquency
Rates
MIC Loss
Ratio

Q3 2015 Genworth MI Canada Inc. 14
2015
Objective
2015
YTD Observations
New Insurance Written
Transactional Volume Moderate
Growth 19%
Realizing market share gains in a larger
origination market while maintaining strong
portfolio quality Average Credit Score > 725 742
Gross Debt Servicing < 26% 24%
Losses on Claims
Loss Ratio 20 to 30% 20% Reflects stable unemployment and modest
house price appreciation combined with
proactive risk management Workout Penetration > 50% 57%
Underwriting performance scorecard
EXECUTING WELL ON 2015 OBJECTIVES

Q3 2015 Genworth MI Canada Inc. 15
Key takeaways
Solid results this quarter with strong
profitability and top line growth
Prudent market share expansion with
keen focus on portfolio quality &
diversification
Proven business model
Well-positioned for solid operating
performance

Q3 2015 Genworth MI Canada Inc. 16
Genworth MI Canada Inc.
Question & Answer
Session
Investor Relations
investor.genworthmicanada.ca
Jonathan A. Pinto, MBA, LL.M
Vice President, Investor Relations
905.287.5482