First-principles calculations of electronic, optical and ...
29
HAL Id: hal-00671933 https://hal.archives-ouvertes.fr/hal-00671933 Submitted on 20 Feb 2012 HAL is a multi-disciplinary open access archive for the deposit and dissemination of sci- entific research documents, whether they are pub- lished or not. The documents may come from teaching and research institutions in France or abroad, or from public or private research centers. L’archive ouverte pluridisciplinaire HAL, est destinée au dépôt et à la diffusion de documents scientifiques de niveau recherche, publiés ou non, émanant des établissements d’enseignement et de recherche français ou étrangers, des laboratoires publics ou privés. First-principles calculations of electronic, optical and elastic properties of ZnAlS and ZnGaO M.G. Brik To cite this version: M.G. Brik. First-principles calculations of electronic, optical and elastic properties of ZnAlS and ZnGaO. Journal of Physics and Chemistry of Solids, Elsevier, 2010, 71 (10), pp.1435. 10.1016/j.jpcs.2010.07.007. hal-00671933
Transcript of First-principles calculations of electronic, optical and ...

HAL Id: hal-00671933https://hal.archives-ouvertes.fr/hal-00671933
Submitted on 20 Feb 2012
HAL is a multi-disciplinary open accessarchive for the deposit and dissemination of sci-entific research documents, whether they are pub-lished or not. The documents may come fromteaching and research institutions in France orabroad, or from public or private research centers.
L’archive ouverte pluridisciplinaire HAL, estdestinée au dépôt et à la diffusion de documentsscientifiques de niveau recherche, publiés ou non,émanant des établissements d’enseignement et derecherche français ou étrangers, des laboratoirespublics ou privés.
First-principles calculations of electronic, optical andelastic properties of ZnAlS and ZnGaO
M.G. Brik
To cite this version:M.G. Brik. First-principles calculations of electronic, optical and elastic properties of ZnAlSand ZnGaO. Journal of Physics and Chemistry of Solids, Elsevier, 2010, 71 (10), pp.1435.�10.1016/j.jpcs.2010.07.007�. �hal-00671933�

www.elsevier.com/locate/jpcs
Author’s Accepted Manuscript
First-principles calculations of electronic, optical andelastic properties of ZnAl2S4 and ZnGa2O4
M.G. Brik
PII: S0022-3697(10)00208-8DOI: doi:10.1016/j.jpcs.2010.07.007Reference: PCS6214
To appear in: Journal of Physics andChemistry of Solids
Received date: 2 February 2010Revised date: 9 April 2010Accepted date: 7 July 2010
Cite this article as: M.G. Brik, First-principles calculations of electronic, optical and elas-tic properties of ZnAl2S4 and ZnGa2O4, Journal of Physics and Chemistry of Solids,doi:10.1016/j.jpcs.2010.07.007
This is a PDF file of an unedited manuscript that has been accepted for publication. Asa service to our customers we are providing this early version of the manuscript. Themanuscript will undergo copyediting, typesetting, and review of the resulting galley proofbefore it is published in its final citable form. Please note that during the production processerrorsmay be discoveredwhich could affect the content, and all legal disclaimers that applyto the journal pertain.
First-principles calculations of electronic, optical and elastic properties of ZnAl2S4 and ZnGa2O4
M.G. Brik
Institute of Physics, University of Tartu, Riia 142, Tartu 51014, Estonia. E-mail: [email protected]
Abstract
The optimized crystal structures, band structures, partial and total densities of states (DOS),
dielectric functions, refractive indexes and elastic constants for ZnAl2S4 and ZnGa2O4 were calculated
using the CASTEP module of Materials Studio package. Pressure effects were modeled by performing
these calculations for different values of external hydrostatic pressure up to 50 GPa. Obtained
dependencies of the unit cell volume on pressure were fitted by the Murnaghan equation of state, and
the relative changes of different chemical bond lengths were approximated by quadratic functions of
pressure. Variations of applied pressure were shown to produce considerable re-distribution of the
electron densities around ions in both crystals, which is evidenced in different trends for the effective
Mulliken charges of the constituting ions and changes of contour plots of the charge densities. The
longitudinal and transverse sound velocities and Debye temperatures for both compounds were also
estimated using the calculated elastic constants.
Key words: A. inorganic compounds; C. Ab initio calculations; D. electronic structure;
1. Introduction
A large group of compounds with spinel structure are generally described by the AB2X4 formula
(where A and B are di- and trivalent cations, respectively, and X is a divalent anion). There are two
types of cation sites in the spinel structure: tetrahedral for A species and octahedral for B species.
Compounds from this family usually have wide band gaps, which can be attractive for various optical
applications [1]. Wide band gap also makes these compounds suitable for doping with different
impurities to get luminescence in particular spectral region. Optical properties of several impurity ions
in these compounds were studied previously, e.g. Cr3+ in ZnAl2S4 [2–7], Fe in ZnGa2O4 [8]; Mn in
ZnGa2O4 [9]; optical properties of ZnGa2O4 nanoparticles were reported in Ref. [10]. Structural and
elastic properties of ZnX2O4 (X=Al, Ga, In) were calculated from first principles in Ref. [11].
In spite of considerable efforts on both experimental and theoretical studies of these compounds,
previously reported results for the calculated properties of the bulk materials are somewhat different
(comparison between the previous and present calculations will be given below). Besides, it turned out
that ab initio calculations of the optical properties and careful studies of the pressure effects on the
interionic distances and electron density distribution around ions in these compounds (especially
ZnAl2S4) are lacking, to the best of the author’s knowledge. So, this was one of motivations for the
present study, which reports the results of first-principles calculations of a wide range of physical
properties for ZnAl2S4 and ZnGa2O4 single crystals. The calculated results include the optimized
crystal structures (for various pressures from 0 to 50 GPa), band structures and density of states,
dielectric functions and refractive indexes, elastic constants, dependencies of the chemical bond
lengths and unit cell volumes on pressure, sound velocities and Debye temperatures. In addition,
influence of the applied pressure on the charge density distributions, Mulliken charges, and chemical
bond orders was considered.
The paper is structured as follows: in the next section the crystal structure of the considered
crystals and the computational details will be described briefly, then the calculated results will be
presented and compared with available experimental data and results of other calculations. The paper
will be concluded with a short summary.
2. Crystal structure and computational details
Both considered crystals have a cubic crystal structure, space group Fd-3m with lattice constants
(in Å) 8.3342 for ZnGa2O4 [12] and 10.009 for ZnAl2S4 [13]. There are eight formula units in one unit
cell. Each Al (Ga) atom is six-fold coordinated by the S (O) ions, respectively; each Zn ion is
surrounded by 4 anions (O or S). The experimental crystal structural data were taken as an initial input
for optimizing the crystal structure and calculations of the electronic, optical and elastic properties, as
described below.
All calculations were performed in the density functional theory (DFT) framework, using the
CASTEP (Cambridge Serial Total Energy Package) module [14] of Materials Studio 4.0. The total
plane-wave pseudopotential method forms a basis of the CASTEP calculations. The exchange-
correlation effects were treated within the generalized gradient approximation (GGA) with the Perdew-
Burke-Ernzerhof functional [15]. The Monkhorst-Pack scheme k-points grid sampling was set at
5×5×5 for the Brillouin zone. The plane-wave basis set energy cutoff was set at 310 eV for ZnAl2S4
and 340 eV for ZnGa2O4; ultrasoft pseudopotentials were used for all chemical elements. The
convergence parameters were as follows: total energy tolerance – 1×10⁻⁵ eV/atom, maximum force
tolerance 0.03 eV/nm, maximal stress component 0.05 GPa and maximal displacement 0.001 Å.
3. Results of calculations
3.1. Optimized crystal structures, electronic and optical properties
The optimized lattice constants are shown in Table 1, in comparison with experimental findings
and results of other available calculations for ZnGa2O4. As seen from this Table, agreement between
the results of the present calculations and experimental data is very good. Structural properties of

ZnGa2O4 were calculated by other authors as well (with rather wide range of the calculated lattice
constants), whereas similar calculations for ZnAl2S4 are scarce.
Calculated band structures of ZnAl2S4 and ZnGa2O4 are shown in Figures 1 and 2, respectively.
Coordinates of the special points of the Brillouin zone are as follows (in terms of unit vectors of the
reciprocal lattice): W(0.5, 0.25, 0.75), L(0.5, 0.5, 0.5), G(0, 0, 0), X(0.5, 0, 0.5), K(0.375, 0.375,
0.750). The calculated band gaps Eg were 2.699 eV (ZnAl2S4) and 2.571 eV (ZnGa2O4), whereas the
corresponding experimental values are 3.42 eV (ZnAl2S4, [18]) and 4.0 eV (ZnGa2O4, [19]). Such an
underestimation of the calculated band gaps is related to well-known DFT limitations, namely not
taking into account the discontinuity in the exchange-correlation potential [20], and is a common
feature of all DFT calculations. In order to overcome such a discrepancy, the so called scissor operator
[21] can be used. This operator produces a simple rigid shift of the unoccupied conduction band with
respect to the valence band, and thus effectively eliminates the difference between the theoretical and
experimental gap values. In this case the value of the scissor operator was 0.7 eV for ZnAl2S4 and 1.5
eV for ZnGa2O4. The calculated band structures in Figs. 1 and 2 are corrected with inclusion of the
corresponding scissor operators. As seen from these figures, both compounds have indirect band gap,
which is in agreement with previous literature data [8, 18]. However, there exists some difference in
how this “indirect character” of the band gap is formed in both compounds. The top of the valence
band for ZnAl2S4 is flat near the G point, whereas in ZnGa2O4 the top of the valence band and the
bottom of the conduction band are simply realized at different points of the Brillouin zone. The
“zoomed” views of the band gaps for both crystals clearly illustrate this difference. Since both energy
gaps are indirect, the phonon contribution to the absorption processes should be important.
Composition of the calculated energy bands can be resolved with the help of partial density of
states (PDOS) and total density of states (DOS) diagrams. Figs. 3 and 4 show the PDOS and total DOS
for ZnAl2S4 and ZnGa2O4, respectively. These diagrams allow concluding that the conduction band in
ZnAl2S4 is about 5 eV wide and is formed by the Al 3s and 3p states, which are hybridized with the S
3p states and Zn 4s, 4p states. The valence band is wide – about 7 eV – and consists of two sub-bands,
clearly seen in the band structure as well: the upper one (between -6 and 0 eV) is a mixture of the S 3p
states and Al 3s, 3p states. The lower one is narrow (between -7 and -6 eV) and is due to the
completely filled Zn 3d states. Another band between -14 and -11 eV is created by the S 3s states with
a minor contribution coming from the Al 3s, 3p states as well.
The conduction band in ZnGa2O4 is considerably wider (about 7 eV) than in ZnAl2S4 and is
composed of Zn 4s, 4p states, Ga 4s, 4p states and O 2p states. The valence band is somewhat
narrower in ZnGa2O4 (about 6 eV in comparison with 7 eV in ZnAl2S4) and does not exhibit any sub-
band structure. 4s states of Ga occupy the bottom of the valence band, whereas the rest of the valence
band consists of the Zn 3d states and O 2p states. Two remaining narrow bands at low energies are due
to the Ga 3d states (at about -12.5 eV) and O 2s states (between -18 eV and -16 eV). It is also

noticeable that the Zn 3d states in ZnGa2O4 are spread over a wider region (almost 6 eV), whereas in
ZnAl2S4 the Zn 3d states are localized in vicinity of -7 eV, at the very bottom of the valence band.
One of the main optical characteristics of a solid is its complex dielectric function
21)( εεωε i+= . The imaginary part )Im(2 εε = of dielectric function is calculated in CASTEP
numerically by a direct evaluation of the matrix elements between the occupied and unoccupied
electronic states. The real part )Re(1 εε = of )(ωε is calculated then using the Kramers-Kronig
transform. Such an approach, of course, has certain limitations. First of all, the local field effects
(related to the fact that the electric field experienced at a particular site of a crystal lattice is screened
by the polarizability of the atom at this site) are neglected. Also phonon contributions to the optical
spectra, which are especially important for the crystals with indirect band gap, are also not taken into
account, when calculating optical properties in CASTEP. However, even with these limitations the
calculated spectra give reasonable agreement with experimental results (see, for example, calculations
of absorption spectra for PbWO4 [22, 23], TiO2 [24] etc).
The dielectric functions for ZnAl2S4 and ZnGa2O4 are shown in Figs. 5 and 6, respectively. The
instrumental smearing of 0.2 eV was used to model the broadening effects. The regions, in which the
imaginary part 2ε is different from zero, can be related to the absorption spectrum (which, in this case,
will be due to the electronic transitions from the valence band to the conduction band). So, from these
figures absorption starts at about 3 eV for ZnAl2S4 and 4 eV for ZnGa2O4, in agreement with the band
gap estimations. The real part of )(ωε in the limit of zero energy (or infinite wavelength) is equal to
the square of the refractive index n. From Figs. 5 and 6 it is possible to estimate the value of n to be
2.24 for ZnAl2S4 and 1.65 for ZnGa2O4. Unfortunately, no experimental values of the refraction index
were found in the literature, so these estimations remain to be purely theoretical.
Difference in electronic and band structure of these two compounds is also manifested in
different shapes of the imaginary part of the dielectric function. Different band gaps are obviously
related to different absorption edges. Besides, the widths of non-zero part of imaginary component of
dielectric functions (in other words, the total width of the absorption spectra) are also different. It is
directly linked with the widths of the conduction bands: a wider conduction band in ZnGa2O4
corresponds to a more extended absorption spectrum. In addition, a greater number of absorption peaks
in ZnGa2O4 can be attributed to more significant contribution of the Zn 3d states to the total absorption,
since they are distributed almost over the whole valence band (in ZnAl2S4 they are localized at the
bottom of the valence band).
A further insight into the electronic properties of these compounds and chemical bond formation
can be gained by considering the charge densities distributions (Figs. 7 and 8; one primitive cell is
shown). As seen from these figures, in ZnAl2S4 there is strong hybridization between the S and Zn

atoms, whereas interaction between the Al and S atoms is not that pronounced. On the contrary, in
ZnGa2O4 oxygen atoms interact strongly with both Zn and Ga atoms as well.
Different character of charge density distributions can be also seen in different values of the
Mulliken charges [25] for ions in both compounds. They are as follows: Zn (+0.96), Ga (+1.22), O (–
0.85) in ZnGa2O4 and Zn (+0.79), Al (+0.72), S (–0.56) in ZnAl2S4. Increased positive value of the
Mulliken charge for Zn ions in ZnGa2O4 can be attributed to the stronger mixture with surrounding
oxygen ions, when the negative charge is shifted towards oxygen ions, thus resulting in a greater
absolute value of the anion’s (oxygen) charge as well, when compared with that of sulfur in ZnAl2S4.
This is also in line with a shorter calculated Zn – O distance (1.99713 Å) in comparison with Zn – S
separation of 2.35347 Å. Additional confirmation of the obtained result can be based on the optical
electronegativities of oxygen and sulfur ions, which would enhance covalency when going from O2- to
S2- ligands [26].
3.2. Elastic properties and pressure effects
Elastic properties of cubic crystals are described by three independent elastic moduli
441211 ,, CCC [27], with the following identities 332211 CCC == , 312312 CCC == , 665544 CCC == .
Calculations of these constants were performed for zero-th external pressure and optimized crystal
structures; the results are shown in Table 2. For both compounds the values of the 11C constant are
approximately 2-2.2 times greater than each of two remaining constants, which is in line with a well-
known observation that for cubic crystals elastic constants decrease with increase of the lattice
parameter [27]. It is also easy to notice that all elastic constants for ZnAl2S4 are about twice as small as
those for ZnGa2O4, suggesting that the same external pressure should produce greater deformations in
the former host.
Variations of the interionic distances with external hydrostatic pressure were studied by
optimizing crystal structures for both considered crystal in the pressure range from 0 to 50 GPa. Fig. 9
shows the relative 0yy variation of the Ga–O, Zn–O distances in ZnGa2O4 and Al–S, Zn–S distances
in ZnAl2S4 crystals (y stands for the interionic distance at some pressure P, whereas y0 is the same
distance at ambient pressure). The Ga–O chemical bond appears to be the stiffest, whereas the Zn–S
bond is the weakest among the four considered ones.
Relative variations of these interionic distances were approximated by the quadratic least-
squares fits 2210 PbPbayy ++= . Approximation functions are plotted by solid lines in Fig. 9; they
excellently follow the calculated values shown by different symbols for each chemical bond. The
values of the approximation coefficients are listed in Table 3. They can be readily used for estimations

of the interionic distances for any arbitrary pressure up to 50 GPa, which is especially important for
doped crystals, when the pressure dependent luminescence of dopants is studied.
Dependence of volume V on pressure P for solids can be modeled by the Murnaghan equation
[28]
'1
00
0
0
'1B
BPB
VV
−
⎟⎟⎠
⎞⎜⎜⎝
⎛+= (1)
where V0 is the volume at ambient pressure, 0B and '0B are the bulk modulus and its pressure derivative,
respectively. The 0VV ratios for unit cells of both crystals were calculated for pressures 0, 10, 20, 30,
40, and 50 GPa (Fig. 10, symbols). The least-squares fits to Eq. (1) are shown in Fig. 10 by solid lines.
From these approximations, the values of 0B and '0B for ZnAl2S4 are 78.91 ± 0.47 GPa and 3.97 ± 0.04,
respectively and for ZnGa2O4 163.46 ± 1.31 GPa, 4.40 ± 0.09, accordingly. The extracted from the
plots values of the bulk moduli 0B are very close to those obtained as the results of the elastic constants
calculations (Table 2). Estimated pressure derivatives of the bulk moduli are also within the typical
range for solids. It is easy to note from Table 2 that the Cauchy condition for cubic crystals 4412 CC =
[29] is practically fulfilled. S. Haussühl [30] formulated that exactly this relation holds true for atoms,
which interact only by central forces. It has been also noted [30-32] that 04412 <− CC (negative
Cauchy pressure) for covalent compounds and 04412 >− CC (positive Cauchy pressure) for mostly
ionic compounds. Application of the last two conditions to the data from Table 2 leads to the
conclusion that ZnAl2S4 is a mostly covalent crystal, whereas ZnGa2O4 can be described in terms of
more ionic bonds. It is also worthwhile to note here that another relation ( ) 32 121144 CCC −= has been
suggested in Ref. [33] as a better replacement for the 4412 CC = condition. Indeed, it works almost
perfectly for ZnAl2S4 and somewhat worse for ZnGa2O4.
Dependence of the calculated band gaps for both compounds on pressure is presented in Fig. 11.
Linear fits (also shown in the Figure) describe well the behavior of the calculated band gaps. However,
the value of Eg increases with pressure for ZnGa2O4 and exhibits opposite behavior for ZnAl2S4.
Usually, band gaps increase with pressure, which also can be interpreted in terms of a blue shift of
charge transfer transitions (which are, in other words, band-to-band transitions) with applied
hydrostatic pressure [34]. Nevertheless, examples of decreased band gaps with applied pressure have
been reported for a number of compounds: PbS [35], Li3N [36], BN nanotubes [37], MnIn2S4 [38],
Li4CaB2O6 [39]. The reason for such a behavior can be either a high covalency of chemical bond, or
significant re-distribution of electron density in the space between atoms [39]. Speaking about the
crystals considered in the present paper, it can be mentioned that ZnAl2S4 is a more covalent
compound than ZnGa2O4, with a quite considerable contribution of the sulfur ions into the conduction
bands (hybridization with Zn and Al ions), which falls in line with some of the above given examples.

Finally, variation of the chemical bonds lengths with pressure should affect the charge densities
distributions as well. Figs. 12 and 13 show how the charge density distributions are modified at the
highest considered pressure of 50 GPa for ZnAl2S4 and ZnGa2O4, respectively (these figures should be
compared with Figs. 7 and 8; in all figures one primitive cell is depicted for the sake of simplicity).
Enhanced interactions in the Zn–O, Ga–O, Zn–S pairs are clearly seen form the shown contour plots.
It is also interesting to follow dependence of the Mulliken charges on pressure, which is
represented in Table 4. In ZnGa2O4 the absolute values of the oxygen and gallium Mulliken charges
are increasing with pressure, whereas the zinc Mulliken charge is decreasing. Such a result can be
interpreted as re-distribution of the electron densities between these ions, namely, a shift of the
electron density (negative charge) from gallium ions towards oxygen ions and from oxygen ions
towards zinc ions, with the former shift dominating over the latter one.
In ZnAl2S4 the absolute values of the Mulliken charges for all three ions are decreasing, which
can be thought of as a shift of electron density (negative charge) from sulfur ions towards zinc and
aluminum ions. Additional information about the nature of the chemical bond between atoms can be
extracted by using the concept of the Mulliken bond order. Although the absolute values of the bond
order depend on the choice of the basis set, and thus their validity should not be overestimated [40],
their relative values, calculated consistently for similar or even identical systems under various
external conditions, like pressure, for example, can reveal some trends in behavior of particular
chemical bonds and ions involved into their formation. A greater value of this parameter indicates the
covalent character of the considered bond, whereas lower values of the bond order stress the ionic
nature of the bond [40]. Analysis of the calculated Mulliken bond orders (Table 5) indicates that the
Ga – O bond is the most ionic, whereas the Zn – S bond is the most covalent. On average, chemical
bonds in ZnAl2S4 are more covalent than in ZnGa2O4 – this conclusion is also in line with the results
of elastic constants estimations. Increase of pressure leads to a monotonic increase of the bond order
(increased covalency) for each individual bond.
The results of calculation of the elastic constants can be used further to estimate one of the most
important thermal characteristics of the studied compounds, the Debye temperature Dθ . This parameter
is very important for an analysis of the specific heat, thermal conductivity and melting temperature. It
can be estimated in the framework of the Debye-Grüneisen model by means of the following simple
equation [41]
mA
D vM
Nnkh
3/1
43
⎥⎦
⎤⎢⎣
⎡⎟⎠⎞
⎜⎝⎛= ρ
πθ , (2)
where h and k are the Planck’s and Boltzmann’s constants, respectively, NA is the Avogadro’s number,
ρ is the crystal’s density, M is the molecular weight, n denotes the number of atoms per unit cell (56

for both studied compounds), mv is the mean sound velocity expressed in terms of the longitudinal lv
and transversal tv sound velocities as follows:
3/1
3312
31
−
⎥⎦
⎤⎢⎣
⎡⎟⎟⎠
⎞⎜⎜⎝
⎛+=
ltm vv
v . (3)
The lv and tv sound velocities are calculated as [42–44]
ρ343 GBvl
+= , ρGvt = , (4)
with B being the bulk modulus and 2
RV GGG += the isotropic shear modulus, which is calculated as
the average value of the Voigt’s shear modulus GV (an upper limit for G values) and the Reuss’s shear
modulus GR (a lower limit for G values). Analytical expressions for GV and GR are as follows:
441211
441211 345,5
3CCCG
CCCGR
V +−
=+−= , (5)
and the values of the elastic constants 441211 ,, CCC are given in Table 2.
The density of ZnAl2S2 is 3.29 g/cm3 [45] and the corresponding value for ZnGa2O4 is 6.17 g/cm3 [46].
A summary of calculated values obtained from Eqs. (2) – (5) is presented in Table 6.
The ZnGa2O4 shear moduli, like other elastic constants, are approximately twice as large as their
ZnAl2S4 counterparts. Also the sound velocities for ZnGa2O4 are somewhat greater than for ZnAl2S4.
The values of Debye temperature decrease with increasing the lattice constants and anion’s atomic
number and weight; therefore, the highest acoustic phonons frequency should be greater in ZnGa2O4.
4. Conclusion
The first-principles calculations of the structural, electronic, optical and elastic properties for
ZnAl2S4 and ZnGa2O4 have been performed using the CASTEP module of Materials Studio package.
Both crystals are characterized as indirect band compounds. Structure of the calculated energetic bands
was analyzed using the partial density of states diagrams. Although the structure of both crystals is the
same, their electronic, elastic and bonding properties are quite different. It was shown that the
conduction band is considerably wider in ZnGa2O4, whereas the valence band is spread over a wider
energy interval in ZnAl2S4. The Zn 3d states are localized at the very bottom of the valence band in
ZnAl2S4, whereas the same Zn 3d states occupy practically the whole valence band in ZnGa2O4.
Special attention has been paid to pressure effects and their influence on the electronic and
structural properties. Variations of the Ga – O, Zn – O, Al – S, Zn – S chemical bonds lengths with
pressure were approximated by the quadratic functions of applied pressure. It was shown that the Ga –
O bond is the stiffest, and the Zn – S is the weakest one. Dependencies of the unit cell volumes on

pressure were fitted by the Murnaghan equation of state; determined from these fits the bulk moduli
for both compounds are very close to those obtained from available in CASTEP direct calculations of
elastic constants.
Analysis of the chemical bonds in both crystals (with calculations of the Mulliken bond orders)
showed ZnAl2S4 to be considerably more covalent than ZnGa2O4. In addition, chemical bonds in the
tetrahedral complexes formed by Zn ions and its neighbors (oxygen or sulfur) are more covalent than
the chemical bonds in the octahedral complexes formed by the (Ga,O) and (Al, S) ions. Detailed
analysis of the applied hydrostatic pressure effects has shown that it not only decreases the interionic
distances, but also causes considerable re-distribution of the electron density, which was confirmed by
calculating effective Mulliken charges for different pressures and following different trends of their
variation. Finally, the calculated elastic constants were used to estimate the sound velocities and Debye
temperatures for both compounds.
Acknowledgment: The author thanks Prof. Ü. Lille (Tallinn University of Technology) for allowing
to use the computational facilities and Materials Studio package. Financial support from Estonian
Science Foundation (Grants No. 7456, JD69, 6999 and 6660) is also appreciated. References
[1] N. Ueda, T. Omata, N. Hikuma, K. Ueda, H. Hizoguchi, T. Hashimoto, H. Kawazoe, Appl. Phys. Lett. 61 (1992) 1954.
[2] I. Broussell, E. Fortin, L. Kulyuk, S. Popov, A. Anedda, R. Corpino, J. Appl. Phys. 84 (1998) 533.
[3] Z. Mazurak, J. Cisowski, J. Heimann, A. Naterpov, M. Czaja, Chem. Phys. 254 (2000) 25. [4] S.I. Klokishner, O.V. Kulikova, L.L. Kulyuk, A.A. Naterpov, A.N. Naterpov, S.M. Ostrovsky,
A.V. Palii, O.S. Reu, A.V. Siminel, Opt. Mater. 31 (2008) 284. [5] B.R. Jovanić, I. Broussell, B. Panić, B. Radenković, M. Despotović, Mat. Res. Bull. 45 (2010)
186. [6] M.G. Brik, Eur. Phys. J. B 49 (2006) 269. [7] M.G. Brik, N.M. Avram, C.N. Avram, J. Mater. Sci: Mater. Electron. 20 (2009) S30. [8] L. Pisani, T. Maitra, R. Valenti, Phys. Rev. B 73 (2006) 205204. [9] J.S. Kim, H.L. Park, G.C. Kim, T.W. Kim, Y.H. Hwang, H.K. Kim, S.I. Mho, S.D. Han, Solid
State Commun. 126 (2003) 515. [10] H. Naito, S. Fujihara, T. Kimura, J. Sol-Gel Sci. Technol. 26 (2003) 997. [11] A. Bouhemadou, R. Khenata, Phys. Lett. A 360 (2006) 339. [12] M. Wendschuh-Josties, H.S.C. O’Neill, K. Bente, G. Brey, Neues Jahrbuch fuer Mineralogie.
Monatshefte 6 (1995) 273. [13] H.J. Berthold, K. Koehler, R. Wartchow, Zeitschrift fuer Anorganische und Allgemeine
Chemie 496 (1983) 7. [14] M.D. Segall, P.J.D. Lindan, M.J. Probert, C.J. Pickard, P.J. Hasnip, S.J. Clark, M.C. Payne, J.
Phys.: Condens. Matter 14 (2002) 2717. [15] J.P. Perdew, K. Burke, M. Ernzerhof, Phys. Rev. Lett. 77 (1996) 3865. [16] R. Pandey, J.D. Gale, S.K. Sampath, J.M. Recio, J. Am. Ceram. Soc. 82 (1999) 3337. [17] J.M. Recio, R. Franco, A.M. Pandas, M.A. Blanco, L. Pueyo, Phys. Rev. B 63 (2001) 184101. [18] S. Güner, F. Yıldız, B. Rameev, B. Akta , J. Phys.: Condens. Matter 17 (2005) 3943. [19] S.K. Sampath, D.G. Kanhere, R. Pandey, J. Phys.: Condens. Matter 11 (1999) 3635. [20] J.P. Perdew, M. Levy, Phys. Rev. Lett. 51 (1983) 1884.

[21] Z.H. Levine, D.C. Allane, Phys. Rev. B 43 (1991) 4187. [22] Liu Tingyu, Shen Jianqi, Zhang Qiren, Solid State Commun. 135 (2005) 382. [23] Liu Tingyu, Shen Jianqi, Zhang Qiren, Zhuang Songlin, J. Lumin. 126 (2007) 239. [24] R.Shirley, M. Kraft, O.R. Inderwildi, Phys. Rev. B 81 (2010) 075111. [25] R.S. Mulliken, J. Chem. Phys. 23 (1955) 1833. [26] C.K. Jorgensen, in Progress in Inorganic Chemistry, edited by S. Lippard (Wiley-Interscience,
New York, 1970), vol. 12, p. 101. [27] C. Kittel, Introduction to Solid State Physics, John Wiley and Sons, 8th edition, 2004. [28] F.D. Murnaghan, Proc. Natl. Ac. Sci. 30 (1944) 244. [29] N.F. Mott, H. Jones, The Theory of the Properties of Metals and Alloys, Dover Publications,
Inc., 1958. [30] S. Haussühl, Phys. Kondens. Mater. 6 (1967) 181. [31] V.P. Mikhal’chenko, Phys. Solid State 45 (2003) 453. [32] H. Ledbetter, A. Migliori, Phys. Stat. Solidi B 245 (2008) 44. [33] F. Milstein, D. J. Rasky, Solid State Commun. 55 (1985) 729. [34] M. Moreno, M.T. Barriuso, J.A. Aramburu, P. Garcia-Fernandez, J.M. Garcia-Lastra, J. Phys.:
Condens. Matter 18 (2006) R315. [35] Li Wei, Chen Jun-fang, Wang Teng, Physica B 405 (2010) 1279. [36] Wei Li, Jun-fang Chen, Teng Wang, Physica B 405 (2010) 400. [37] S.S. Coutinho, V. Lemos, S. Guerini, Phys. Rev. B 80 (2009) 193408. [38] J. Ruiz-Fuertes, D. Errandonea, F.J. Manjon, D. Martinez-Garcia, A. Segura, V.V. Ursaki, I.M.
Tiginyanu, J. Appl. Phys. 103 (2008) 063710. [39] Zhang Hong, Tang Jin, Cheng Xin-Lu, Chin. Phys. Lett. 25 (2008) 552. [40] M.D. Segall, R. Shah, C.J. Pickard, M.C. Payne, Phys. Rev. B 54 (1996) 16317. [41] O.L. Anderson, J. Phys. Chem. Solids 24 (1963) 909. [42] E. Schreiber, O.L. Anderson, N. Soga, Elastic Constants and Their Measurements McGraw-
Hill, New York, 1973. [43] M.B. Kanoun, S. Goumri-Said, A.H. Reshak, Comput. Mater. Sci. 47 (2009) 491. [44] C. Çoban, K. Çolakoğlu, E. Deligöz, Y. Ő Çiftçi, Comput. Mater. Sci. 47 (2010) 758. [45] G.A. Steigmann, Acta Cryst. 23 (1967) 142. [46] L. Wang, Z. Hou, Z. Quan, H. Lian, P. Yang, J. Lin, Mat. Res. Bull. 44 (2009) 1978.

Table 1. Crystal lattice constants a and unit cell volume V for ZnGa2O4 and ZnAl2S4 crystals
ZnGa2O4 ZnAl2S4
Exp.a Calc.b Calc.c Calc.d Calc.e Calc.f Exp.g Calc.b
a, Å 8.3342 8.4412 8.4063 8.38 8.174 7.977 10.009 10.0340
V, Å3 578.884 601.468 594.039 588.480 546.140 507.597 1002.702 1010.235 aRef. [12]; bThis work; cRef. [11]; d Ref. [16]; e Ref. [19]; f Ref. [17]; g Ref. [13]
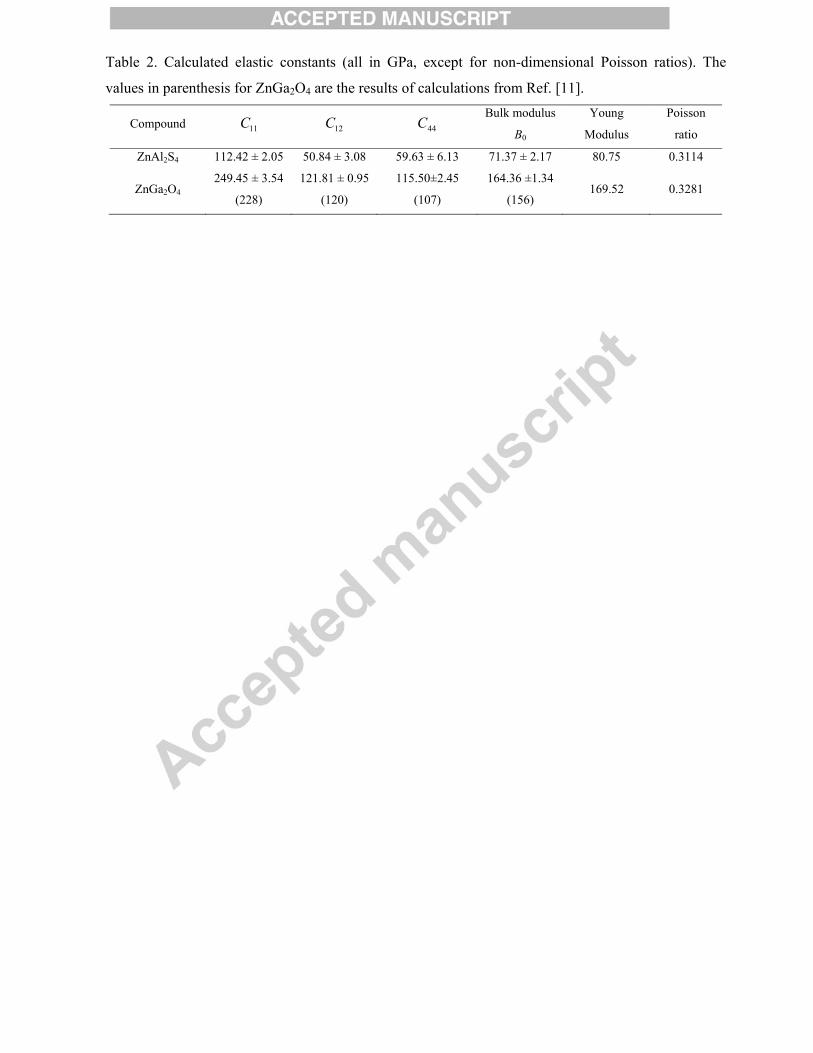
Table 2. Calculated elastic constants (all in GPa, except for non-dimensional Poisson ratios). The
values in parenthesis for ZnGa2O4 are the results of calculations from Ref. [11].
Compound 11C 12C 44C Bulk modulus
B0
Young
Modulus
Poisson
ratio
ZnAl2S4 112.42 ± 2.05 50.84 ± 3.08 59.63 ± 6.13 71.37 ± 2.17 80.75 0.3114
ZnGa2O4 249.45 ± 3.54
(228)
121.81 ± 0.95
(120)
115.50±2.45
(107)
164.36 ±1.34
(156) 169.52 0.3281

Table 3. Coefficients of quadratic approximations 2210 PbPbayy ++= (P is pressure in GPa) of
relative bond changes 0yy for ZnGa2O4 and ZnAl2S4.
Bond y0, Å a b1, GPa-1 b2, GPa-2
Ga–O 2.01716 0.99959±5.5999×10⁻⁴ -0.00155±5.26746×10⁻⁵ 9.18547×10⁻⁶±1.01123×10⁻⁶
Zn–O 1.99713 0.99943±8.30818×10⁻⁴ -0.00226±7.81491×10⁻⁵ 1.48713×10⁻⁵±1.50028×10⁻⁶
Al–S 2.40852 0.99884±0.00155 -0.00285±1.45810×10⁻⁴ 2.16545×10⁻⁵±2.79921×10⁻⁶
Zn–S 2.35347 0.99784±0.00282 -0.00400±2.65208×10⁻⁴ 3.40235×10⁻⁵±5.09137×10⁻⁶

Table 4. Mulliken charges of individual ions in ZnGa2O4 and ZnAl2S4 as a function of external
pressure Pressure,
GPa
ZnGa2O4 ZnAl2S4
Zn Ga O Zn Al S
0 0.96 1.22 – 0.85 0.79 0.72 – 0.56
10 0.93 1.25 – 0.86 0.79 0.72 – 0.56
20 0.91 1.27 – 0.86 0.78 0.71 – 0.55
30 0.90 1.29 – 0.87 0.77 0.70 – 0.54
40 0.90 1.30 – 0.88 0.76 0.70 – 0.54
50 0.89 1.32 – 0.88 0.76 0.69 – 0.53
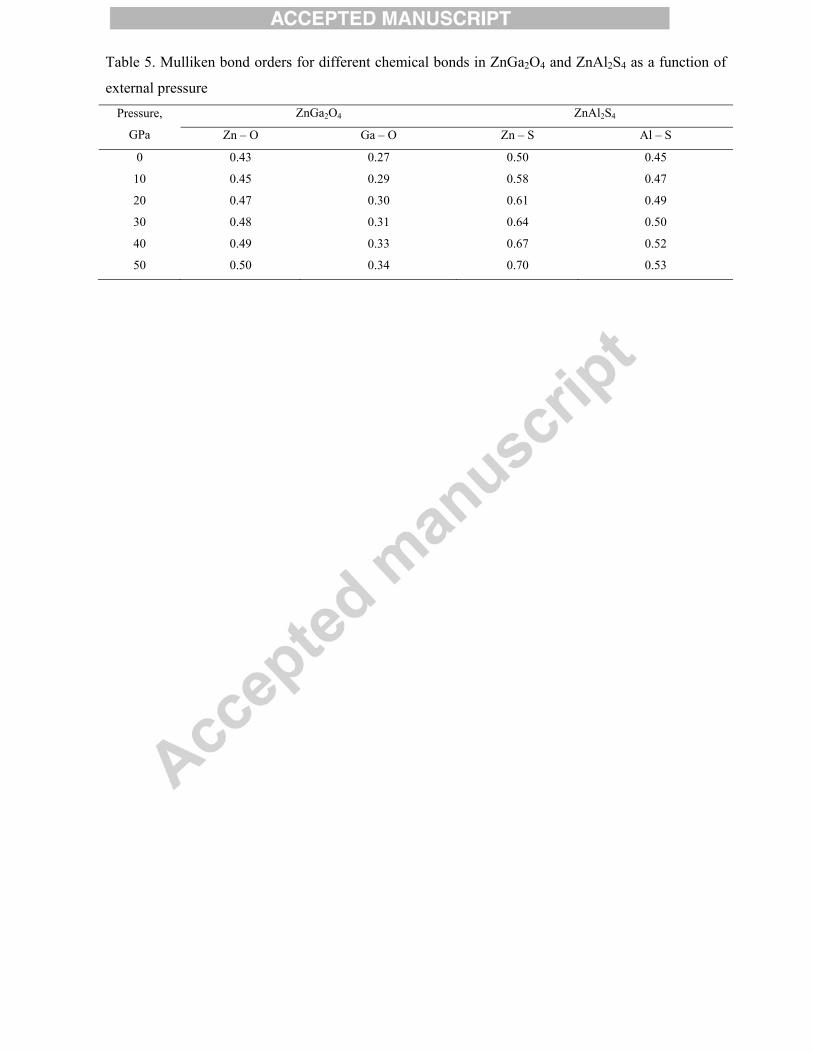
Table 5. Mulliken bond orders for different chemical bonds in ZnGa2O4 and ZnAl2S4 as a function of
external pressure Pressure,
GPa
ZnGa2O4 ZnAl2S4
Zn – O Ga – O Zn – S Al – S
0 0.43 0.27 0.50 0.45
10 0.45 0.29 0.58 0.47
20 0.47 0.30 0.61 0.49
30 0.48 0.31 0.64 0.50
40 0.49 0.33 0.67 0.52
50 0.50 0.34 0.70 0.53

Table 6. Calculated shear moduli, sound velocities and Debye temperatures for ZnAl2S4 and ZnGa2O4
Compound GV, GPa GR, GPa G, GPa lv , m/s tv , m/s mv , m/s Dθ , K
ZnAl2S4 48.09 43.37 45.73 6342.4 3728.4 4132.5 943.8
ZnGa2O4 94.83 87.24 91.04 6805.2 3841.2 4272.6 1170.8

05
1015200.0
0.5
1.0
0.00.40.81.21.6
-15 -10 -5 0 5 100
10
20
30
40
s states p states d states
Zn PDOS
s states p statesAl PDOS
s states p statesS PDOS
Den
sity
of s
tate
s, e
lect
rons
/eV
Energy, eV
Total DOS
Fig. 3. Partial and total densities of states for ZnAl2S4. From top to bottom: sulfur, aluminum, zinc PDOS and total DOS.

0
1
2
048
1216
0
4
8
-20 -15 -10 -5 0 5 10 150
20
40
60
s states p states
O PDOS
s states p states d states
Ga PDOS
s states p states d states
Zn PDOS
Den
sity
of s
tate
s, e
lect
rons
/eV
Energy, eV
Total DOS
Fig. 4. Partial and total densities of states for ZnGa2O4. From top to bottom: oxygen, gallium, zinc
PDOS and total DOS.

0.0 2.5 5.0 7.5 10.0 12.5 15.0
-6
-4
-2
0
2
4
6
8
10
12
14
Die
lect
ric fu
nctio
n
Energy, eV
Re(ε) Im(ε)
Fig. 5. Calculated dielectric function of ZnAl2S4.

0 5 10 15 20
-2
-1
0
1
2
3
4
5
Die
lect
ric fu
nctio
n
Energy, eV
Re(ε) Im(ε)
Fig. 6. Calculated dielectric function for ZnGa2O4.

Fig. 7. A contour plot of the charge-density distribution in ZnAl2S4 (a normal to the shown slice is
[0.707, -0.707, 0.000])
Zn
Al
S
Zn
Zn
Zn S
S
S
Al
Al
Al
S
Al

Fig. 8. A contour plot of the charge-density distribution in ZnGa2O4 (a normal to the shown slice is
[0.707, -0.707, 0.000])
Zn
Zn
Zn
Zn
O
O
O
O
Ga Ga
Ga
Ga
Ga
O
O

0 10 20 30 40 500.86
0.88
0.90
0.92
0.94
0.96
0.98
1.00
1.02
Rel
ativ
e bo
nd le
ngth
cha
nge
Pressure, GPa
Ga-O Zn-O Al-S Zn-S
Fig. 9. Relative bond length changes for ZnGa2O4 and ZnAl2S4. The calculated values are shown by
symbols, and the quadratic approximations (Table 3) are shown by solid lines.

0 10 20 30 40 50
0.72
0.76
0.80
0.84
0.88
0.92
0.96
1.00
V /
V0
Pressure, GPa
ZnGa2O4
ZnAl2S4
Fig. 10. Dependence of relative change of volume on pressure for ZnGa2O4 and ZnAl2S4. The
calculated values are shown by symbols, and the fits to the Murnaghan equation (1) by solid lines.

0 10 20 30 40 502.5
3.0
3.5
4.0
4.5
5.0
5.5
6.0
Eg=3.407 - 0.008P
Ban
d ga
p, E
g
Pressure P, GPa
ZnGa2O4
ZnAl2S4
Eg=4.145 + 0.028P
Fig. 11. Pressure dependence of the calculated band gaps Eg for ZnGa2O4 (squares) and ZnAl2S4 (circles). Linear fits and their equations are also shown.

Fig. 12. A contour plot of the charge-density distribution in ZnAl2S4 (a normal to the shown slice is
[0.707, -0.707, 0.000]; pressure 50 GPa)
Zn
Al
S Zn
S
Al
Al
Zn S S
S
Zn
S
Al
Al

Fig. 13. A contour plot of the charge-density distribution in ZnGa2O4 (a normal to the shown slice is
[0.707, -0.707, 0.000]; pressure 50 GPa)
Zn
Zn
Zn
Zn
O
O
O
O
Ga Ga
Ga
Ga
Ga
O
O