First Half 2014 Results - Air France KLM
44
First Half 2014 Results 25 July 2014
Transcript of First Half 2014 Results - Air France KLM

First Half 2014 Results
25 July 2014

First Half 2014 results
Highlights of the Second Quarter
2
Economic environment remains
weak
Further significant currency
impact on revenues
Stable fuel price after decline
in Q1
Industry overcapacity on certain
long-haul routes, notably North
America and Asia
Slower than expected recovery
in cargo demand
Operating environment
Robust passenger revenue
performance thanks to strict capacity
discipline
Ongoing unit cost reduction: -1.7%*,
in line with Q1
Further improvement in operating
result, up €155 million
Full-freighter exposure to be further
reduced: €106 million impairment
charge booked in Q2
Launch of new Air France long-haul
product
Successful €600 million bond issue
Air France-KLM
* Like-for-like

Results

First Half 2014 results
Key data
4
In € millions Q2 2014 Q2 2013(1) Change H1 2014 H1 2013(1) Change
Revenues 6,451 6,541 -1.4% 12,005 12,222 -1.8%
Change like-for-like(3) +1.7% +1.0%
EBITDA(2) 641 510 +131m 591 394 +197m
Operating result 238 84 +154m -207 -448 +241m
Net result, group share -6 -158 +152m -614 -799 +185m
Adjusted net result(2) 143 -34 +177m -342 -686 +344m
Operating free cash flow(2) 181 528 -347m 95 566 -471m
Net debt at end of period(2) 5,414 5,348(4) +66
(1)2013 restated for IFRIC 21, CityJet reclassified as discontinued operation
(2)See definition in press release
(3)Like-for-like: change at constant currency and scope
(4)Net debt at 31st December 2013

First Half 2014 results
Significant currency impact
5
-2.2%
-1.4% -1.8%
+0.2%
+1.7%
+1.0%
Q1 2014 Q2 2014 H1 2014
Reported change Like-for-like: change at constant currency and scope
+87
+154
+241
+114
+176
+290
Q1 2014 Q2 2014 H1 2014
Revenues (% change)
Operating result (€m improvement)

First Half 2014 results
Second Quarter: Contribution by business segment
6
Cargo
Maintenance
79% 5.11
0.67
0.29
0.38
-0.2%
-5.1%
-10.3%
-2.9%
Reported
change
(%)
Revenue
(€bn)
Other
+2.4%
-1.9%
-7.2%
+4.6%
Change
Like-for-like(1)
(%)
10%
4%
6%
255
-45
30
-2
Op. result
(€m)
+159
+5
-7
-2
Reported
change
(€m)
+178
+8
-2
-8
Change
Like-for-like(1)
(€m)
Passenger
Total 6.45 -1.4% +1.7% 238 +155 +176
(1)Like for Like: At constant currency and scope

First Half 2014 results
Passenger activity in Second Quarter
7
Disciplined capacity growth
Load factor up 1.5 points
Unit revenue up 1.3%* Long-haul up +1.6%*
Premium: +3.5%*
Economy: +2.0%*
Positive impact of capacity reduction
on medium-haul
Unit cost reduced by 2.3%*
Profitability improvement
in all regions except Latin America Impact of Venezuela
€159m improvement
in operating result
-2.9%
-1.1%
-4.4%
-0.4%
1.3%
-2.3%
RRPK RASK CASK
Reported Like-for-like
Q2 2013 Q2 2014
Traffic (RPK)
Capacity (ASK)
Load factor +1.0%
+2.8%
83.3% 84.8%
+1.5 pt
Activity
Unit revenue Unit cost
* Like for like

First Half 2014 results
Passenger unit revenue by network in Second Quarter
8
1.5%
ASK
3.1%
RPK
1.6%
RASK
0.6%
ASK
5.7%
RPK
3.1%
RASK
1.0%
ASK
2.8%
RPK
1.3%
RASK
6.9%
ASK
5.3%
RPK
-2.1%
RASK
0.0%
ASK
3.8%
RPK
4.1%
RASK
-1.9%
ASK
-0.4%
RPK
-0.5%
RASK
3.6%
ASK
4.1%
RPK
3.0%
RASK
1.3%
ASK
3.2%
RPK
-0.9%
RASK
-7.1%
ASK
-4.5%
RPK
10.6%
RASK
Short and medium-haul point-to-point
Short and medium-haul hubs North America
Africa and Middle East Latin America Asia
-0.7%
ASK
1.6%
RPK
1.7%
RASK
Total short and medium-haul
Caribbean & Indian Ocean Total long-haul Total

First Half 2014 results
Cargo activity in Second Quarter
9
Slower than expected recovery Load factor up +0.3 point
Slight improvement in yield
Full-freighter capacity further
reduced: -8.6%
Slight improvement in profitability,
but remains insufficient
Further reduction of full-
freighter exposure;
€106m impairment
charge booked in Q2
-2.5% -2.1% -2.4%
0.7% 1.1% 0.2%
RRTK RATK CATK
Reported Like-for-like
Q2 2013 Q2 2014
Traffic (RTK)
Capacity (ATK)
Load factor
-2.0%
-1.6%
62.9% 63.2% +0.3 pt
Activity
Unit revenue Unit cost

First Half 2014 results
Maintenance activity in Second Quarter
10
Order book Third party revenue: -7.2%*
Reflects tough comps vs Q2-13
boosted by high volume from GE
engine contract
Revenue pick-up expected in H2
Lower operating result reflecting
weaker dollar and one-off items
Development of higher margin
activities to support improvement
in operating profitability
In € millions Q2-14 Q2-13 Change
Total revenue 810 846 -4.0%
Third party revenue 286 320 -10.3%
at constant currency -7.2%
Operating result 30 37 -7
Operating margin 3.7% 4.4% -0.7 pt
31 Dec
2013
30 June
2014
€4.4bn
€5.1bn +16%
* At constant currency

First Half 2014 results
Other businesses in Second Quarter: Transavia
11
Ramp-up of Transavia France
on track Capacity up 10% in Q2 with load
factor above 85% on newly opened
routes
H2 capacity targeted up 30% with
good bookings for Summer
Transavia Netherlands accelerating shift to LCC model
Scheduled capacity up 12% in Q2
Charter capacity down 6% in Q2
Strong development of ancillary
revenues on scheduled activity
All-time-high load factor in spite
of capacity growth
Q2 2013 Q2 2014
Traffic (RPK)
Capacity (ASK) Load factor
+4.8%
+6.0%
89.8% 90.7% +0.9 pt
Transavia activity
In € millions Q2-14 Q2-13 Change
Total revenue 296 282 +5.0%
RRPK (€ cts per RPK) 5.18 5.32 -2.8%
RASK (€ cts per ASK) 4.70 4.78 -1.7%
CASK (€ cts per ASK) 4.80 4.84 -0.8%
Operating result -6 -3 -3

First Half 2014 results
Second Quarter: Change in operating costs
12
726
1,546
6,214
-3.2%
-0.4%
-1.5%
323 +2.5%
25%
12%
5%
-6.4%
-2.0%
-3.8%
-2.7%
4,578 -2.2% -3.1%
1,636 +0.2% 27%
-5.6%
+0.9%
Aircraft costs(2)
Supplier costs(1) excluding fuel and
purchasing of maintenance services and parts
Grand total of operating costs
Purchasing of maintenance services
and parts
Operating costs ex-fuel(3)
Fuel
Reported
change €m
Change
at constant
currency
1,934 -3.2% 29%
-3.4% Total employee costs including temps
Capacity (EASK)
(1)Catering, handling charges, commercial and distribution, landing fees and air-route
charges, other external expenses, excluding temps
(2)Chartering (capacity purchases), aircraft operating leases, amortization, depreciation
and provisions
(3)Including other taxes, other revenues, other income and expenses

First Half 2014 results
Update on employee costs
13
Q2 2013
2,002 1,934
-47
Q2 2014
-2.3%
Net
change
Pension
expense and
consolidation
impact
-21
Further headcount reduction
in Q2: -1,200 FTEs
General pay freeze
at both Air France and KLM
On track to achieve targeted
labor cost reduction in 2014 Tougher comps in H2
Change in total employee costs (€m, including temporary staff)
H1: -106
Q1 Q2 Q3 Q4
99,700 99,600 99,500
97,500 97,000 98,400
2013 2014 2014 activity in EASK

First Half 2014 results
Second Quarter: Further reduction in unit costs
14
-1.9% --0.0% -1.7%
Net change Excluding change
in pension expense
-2.1%
-0.2%
Net Costs: € 5,554m (-2.9%) Capacity in EASK: 85,807m (+0.9%) Unit cost per Equivalent Available-Seat Kilometer (EASK): €6.47 cents
Change at constant currency
Reported
change
Change in
pension
expense (non cash)
Fuel price effect
Currency effect
-4.0%

First Half 2014 results
Operating result up €154 million driven by improvement
in both unit revenue and unit cost
15
Operating result, in million euros
Q2 2013* Q2 2014
84
238
Unit
revenue
Fuel price
ex-currency
+2
+1
Unit
cost +9 +94
Currency
Impact
Revenues: -168
Costs: -148
-20 REASK:
+1.1%
CEASK:
-1.7%
+68
Activity
change
Change
in pension
expense (non cash)
+154m
* Restated for IFRIC 21, CityJet reclassified as discontinued operation

First Half 2014 results
Second Quarter: Significantly positive adjusted net result
16
-7
o/w cargo
deferred
tax assets: -26
142
Adjusted net result
2
Asset
valuation
+26
Value of
hedging
portfolio Non current
expenses
Cargo impairment: -106,
Other: -16
Net result,
group share
-122 Discontinued
operations (CityJet)
-61
Calculation of Second Quarter adjusted net result, in million euros
First Half 2014 results
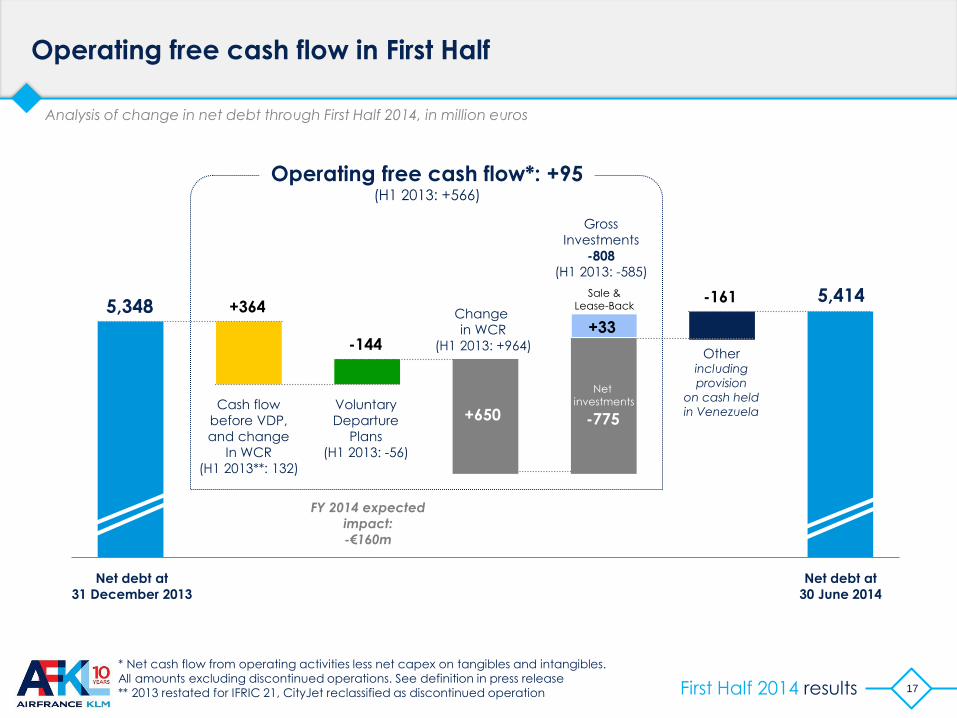
Operating free cash flow in First Half
17
Analysis of change in net debt through First Half 2014, in million euros
5,348 5,414 -161
Other including provision
on cash held
in Venezuela
Net debt at
31 December 2013
Net debt at
30 June 2014
FY 2014 expected
impact:
-€160m
Cash flow
before VDP,
and change
In WCR
(H1 2013**: 132)
Change
in WCR
(H1 2013: +964)
Net investments
+650
+364
Operating free cash flow*: +95 (H1 2013: +566)
Gross
Investments
-808
(H1 2013: -585)
Voluntary
Departure
Plans
(H1 2013: -56)
-144
-775
Sale & Lease-Back
+33
* Net cash flow from operating activities less net capex on tangibles and intangibles.
All amounts excluding discontinued operations. See definition in press release
** 2013 restated for IFRIC 21, CityJet reclassified as discontinued operation

First Half 2014 results
Financial ratios at 30 June 2014, sliding 12 months
18
31/12/2012* 30/06/2013** 31/12/2013** 30/06/2014
3.9x 3.5x
4.6x 4.0x
31/12/2012* 30/06/2013** 31/12/2013** 30/06/2014 31/12/2012* 30/06/2013** 31/12/2013** 30/06/2014
31/12/2012* 30/06/2013** 31/12/2013** 30/06/2014
4.3x
2.9x
5.4x
4.2x
Adjusted net debt(2) / EBITDAR EBITDAR / adjusted net
interest costs(1)
EBITDA / net interest costs Net debt / EBITDA
4.3x
2.6x
5.3x
4.0x
3.2x 4.3x
4.6x 3.7x
* Restated for IAS19
** Restated for IFRIC 21, CityJet reclassified as discontinued operation
(1)Adjusted by the portion of financial costs within operating leases (34%)
(2)Adjusted for the capitalization of operating leases (7x yearly expense)

First Half 2014 results
Good level of liquidity and active debt management
19
Cash of €3.9 billion at 30 June 2014
Undrawn credit lines of €1.80 billion Air France: €1.06 billion until 2016
KLM: €540 million until 2016
Air France-KLM: €150 million until 2017
Active debt refinancing program Repayment of €700 million bond in January
Successful €600 million bond issue in June
Bonds representing €94 million euros repurchased in framework of tender offer
Amadeus shares worth more than €900 million

First Half 2014 results
Outlook for Full Year 2014
20
Positive effects of Transform 2015 Initial measures fully delivering
Additional measures will deliver as of H2 2014
Operating environment remains tough Persistently weak cargo demand
Challenging situation in Venezuela
Impact of industry overcapacity on certain long-haul routes
EBITDA expected between €2.2bn and €2.3bn
Net debt reduction on track towards 2015 objective of €4.5bn

Strategy
First Half 2014 results
Agenda
22
Update on Transform 2015
Key considerations for next strategic plan

First Half 2014 results
Where we are today
23
Transform 2015 has fully delivered on structural cost reduction
leading to a significant improvement in the financial situation
Short and medium-haul restructuring back on track thanks
to additional measures announced in October 2013
Development of Transavia France accelerated as a key
component of short and medium-haul strategy
Successful roll-out of new long-haul products
underpinning upscaling strategy
Cargo measures on track but absence of market recovery

First Half 2014 results
Transform 2015 has delivered on unit cost reduction…
24
Q1 12 Q2 12 Q3 12 Q4 12 Q1 13 Q2 13 Q3 13 Q4 13 Q1 14 Q2 14 Q3 14 Q4 14
+1.0%
-1.7% -1.9%
-1.2%
-1.9%
-2.6%
-1.8%
+50 -100 -120 -90 -100 -160 -110 -100 -90 -94
2013 vs 2012:
-€470m
Net unit cost per EASK in € cents, at constant currency, fuel price and pension expense
-1.8%
2012 vs 2011:
-€260m
-1.7%
Equivalent impact
on costs (€m)
2014 vs 2013:
-€300 to €400m
-1.7%
Change in unit cost
Costs reduced by over €1 billion in 3 years

First Half 2014 results
…leading to a strong improvement in financial situation
25
178
290
152
394
591
H1
2010
H1
2011
H1
2012
H1
2013
H1
2014
4.9
4.3
2.9 2.6
Dec
2011
Dec
2012
Dec
2013
June
2014
-197
-133 -85
133
294
H1
2010
H1
2011
H1
2012
H1
2013
H1
2014
Reported Half-Year
EBITDA Net debt/EBITDA ratio
sliding 12 months
Half-Year
Operating cash flow before change in WCR
and Voluntary Departure Plans
H1 2014 vs H1 2010:
+€410m
H1 2014 vs H1 2010:
+€490m
June 2014 vs Dec 2011:
almost halved

First Half 2014 results
Short and medium-haul restructuring on track
New measures announced
in October 2013 all deployed
Paris-CDG hub: additional fleet
reduction and productivity
improvements
Amsterdam hub: further actions
to increase asset utilization
Point-to-point: capacity cuts,
new offers for business travelers
Success of Voluntary Departure Plan
26
Fares without bag
New discount passes
Ongoing operating result
improvement
191 190 182 177
177 176 181 145
23 23
June 2011 June 2012 June 2013 June 2014
Narrowbody fleet (Air France+KLM)
Regional fleet (Hop!, KLM Cityhopper, CityJet until sale)
Short and medium-haul
fleet evolution (number of aircraft)
Regional fleet of Airlinair, integrated in 2013

First Half 2014 results
Accelerated development and repositioning of Transavia
Transavia France opening 19 new routes during Summer 2014
Investing in future brand
positioning on home markets Brand awareness in Paris up 11 points
Transavia Netherlands accelerating
shift to LCC model
Development of new distribution
channels
Leveraging group assets Access to Orly slots
Link with Flying Blue
Air France-KLM sales and distribution
Tools to handle disruptions
27
34 34 35 35 35
11 14 19 24 29
Summer
2012
Summer
2013
Summer
2014
Summer
2015
Summer
2016
Netherlands (incl. summer lease)
France (incl. summer wet lease from Air France)
Transavia fleet plan (number of aircraft)

First Half 2014 results
Long-haul product upgrade well underway
28
New World Business Class already deployed
on 22 KLM aircraft B777 fleet to follow as of next September
First Air France 777 equipped
with new cabins launched in June 2014 Strongly positive qualitative feedback
New Air France La Première suite launch
in September 2014 On top of “Best first-class lounge in the world”
Skytrax award

First Half 2014 results
Cargo: reduced exposure to full-freighter activity
29
Net full-freighter cargo capacity (billion ATKs)
9.1
5.6
4.5
-20%
-38%
Minimal exposure
to full-freighter activity by 2016
New measures announced
in October 2013 on track H1 full-freighter capacity down 7.2%,
planning similar reduction in H2
Orly warehouse subcontracted
as of 15 July
210 departures in framework
of Voluntary Departure Plan
Investigating further scenarios Partnership/Joint Venture/Partial sale
More radical downsizing of full-freighter
fleet
Protect belly and remaining full-freighter
businesses

First Half 2014 results
Agenda
Update on Transform 2015
Key considerations for next strategic plan
30

First Half 2014 results
Key considerations for next strategic plan
31
Growth opportunities, but tough competition
Enhanced competitiveness and business de-risking as conditions for growth
Reinforcing long-haul development levers
Adapted product offer and more effective marketing
Strengthening of hubs
Partnerships with focus on Asia
Further segmentation of medium-haul including accelerated development
in low cost segment
Cargo: reducing exposure to full-freighter activity, protecting the belly
business
Portfolio development: low cost, maintenance and catering

First Half 2014 results
~ +7%
~ +3%
~ +3%
~ +6%
~ +6%
~ +3%
North America
~ +2%
Latin America
~ +3%
~ +2%*
~ +3%
Total Europe-Long-Haul
Asia-Pacific
Sub-Saharan Africa ~ +7% ~ +4%*
Middle-East and India
Growth opportunities, but tough competition
32
Example: H2 2014 long-haul passenger industry supply and demand
~ +x%
~ +x% Underlying demand to/from Europe based on GDP forecasts
Industry capacity development
* Demand adjusted for diversion through Gulf

First Half 2014 results
Two prerequisites: competitiveness and further de-risking of group
profile
Competitors continue to improve their cost positions
Further improvement in our competitiveness is essential Addressing all uncompetitive activities and underperforming assets
Further unit cost reduction
Further de-risking of group profile More balanced business mix
Improved credit ratios
33

First Half 2014 results
Reinforcing long-haul development levers
34
Upgraded product offer
Further investments
in product
and services
Stepping up marketing
initiatives
Evolution of sales
and distribution
Strengthening of hubs Long-haul partnerships
Ongoing improvement
of feeding network
Stronger relationship
with hub airports
Building joint-ventures
and strategic
partnerships on all key
markets
Ongoing focus
on Asia

First Half 2014 results
Effective segmentation of short and medium-haul point-to-point
35
Transavia development
Leisure/price driven segment Basic offer Low prices, comparable
to competitors
Business/network driven segment High network quality: destinations,
schedule, frequency… Simple offer with innovative features Attractive prices, especially to catch
non-business traffic
Offensive strategy to seize
development opportunity
in home markets
Pan-European ambition
Essential to maintain low cost
structure
Capacity reduction
Cost reduction, addressing
activities where costs remain
significantly above competitors
Single business unit regrouping
Air France point-to-point
and Hop
Further adaptation

First Half 2014 results
Portfolio development: maintenance and catering
Clear growth opportunities Long-term global maintenance market
growth: 4% per year
Air France-KLM positioned on higher
growth segments: very large engines,
repairs, components
Robust Air France-KLM positions Investments in new facilities
and international network of shops
Leveraging link with large airline group
Strong increase in order book
Consistently profitable
Development opportunities in catering
36
Engines
49% Components
36%
Airframe
15%
Europe
34%
Americas
24%
Asia
33%
Africa
Middle-East
9%
Maintenance external
revenue breakdown
Maintenance order book
by region (€5.1 bn at 30 June 2014)

First Half 2014 results
Air France-KLM in 2020
37
Long-haul operations at the center of a global network
of world class partners
A strong brand portfolio addressing all customer segments
An efficient short and medium-haul business including
a strengthened low-cost operation
A more balanced portfolio of service activities around
the air transport industry: cargo, maintenance and catering
A de-risked business and a deleveraged balance sheet,
delivering healthy ROCE
Delivering growth and remuneration to shareholders

First Half 2014 results
Save the date
38
on
11 September 2014
Paris
Morning: presentations
Afternoon: visit Grand Palais exhibition “Air France, France is in the air”
on new Air France products and services
Investor day

Appendix
First Half 2014 results
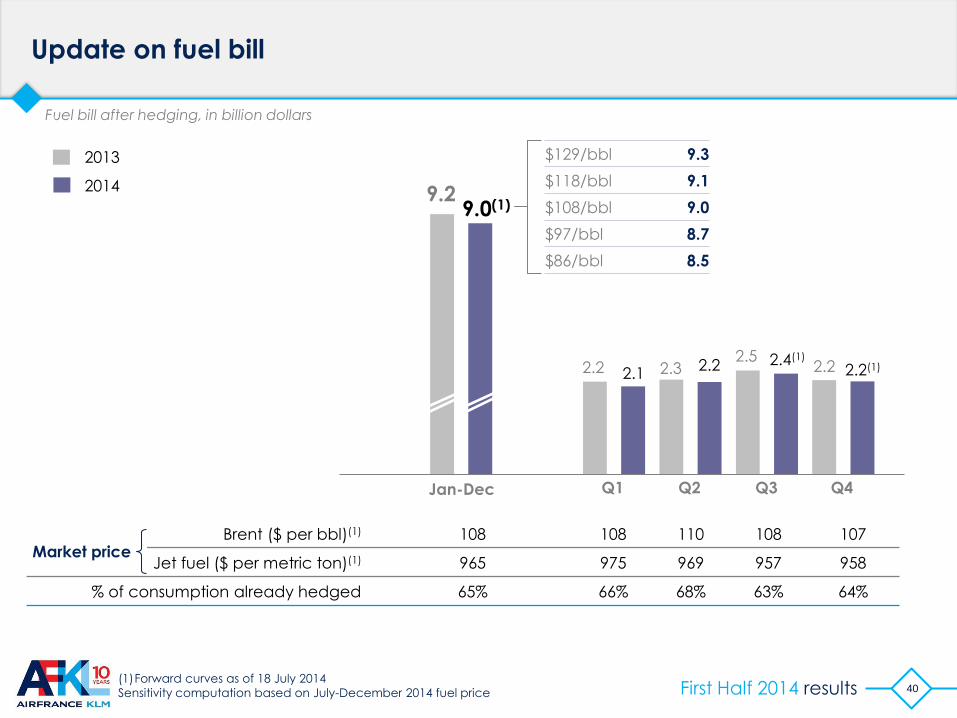
Update on fuel bill
40
Jan-Dec Q1
2.2
9.2 9.0(1)
2013
2014
Q2 Q3 Q4
2.3 2.5
2.2 2.1 2.2 2.4(1) 2.2(1)
$129/bbl 9.3
$118/bbl 9.1
$108/bbl 9.0
$97/bbl 8.7
$86/bbl 8.5
Fuel bill after hedging, in billion dollars
Brent ($ per bbl)(1) 108 108 110 108 107
Jet fuel ($ per metric ton)(1) 965 975 969 957 958
% of consumption already hedged 65% 66% 68% 63% 64%
(1)Forward curves as of 18 July 2014
Sensitivity computation based on July-December 2014 fuel price
Market price

First Half 2014 results
Other businesses in Second Quarter: Catering
41
Catering Q2-14 Q2-13 Change
Total revenue 222 247 -9.0%
Third party revenue 77 103 -25.2%
At constant scope* +6.9%
Operating result 5 2 +3
* Q2 2013 restated for sale of Air Chef
Increase in third party
revenues excluding impact
of disposal of Air Chef Development in Africa and French
Caribbean
Impact of recent contract wins
Improvement in profitability
while continuing to reduce
cost for internal customers
Launch of operations in Brazil
serving GOL from Rio and
Sao

First Half 2014 results 42
Cargo
Maintenance
79% 9.48
1.34
0.58
0.61
-1.0%
-4.3%
-7.2%
-2.9%
Reported
Change
(%)
Revenue
(€ bn)
Other
+1.4%
-1.6%
-3.4%
+5.2%
Change
Like for like(1)
(%)
11%
5%
5%
-123
-79
52
-57
Op. result
(€m)
+228
+21
-5
-3
Change
(€m)
+268
+25
+4
-7
Change
Like for like(1)
(€m)
Passenger
Total 12.01 -1.8% +1.0% -207 +241 +290
First Half: Contribution by business segment
(1)Like-for-Like: At constant currency and scope

First Half 2014 results 43
1,436
3,054
12,213
-4.3%
+0.6%
-1.7%
643 +5.3%
25%
12%
5%
-6.6%
-0.8%
-3.6%
+1.1%
9,024 -1.8% -2.7%
3,189 -1.5% 27%
-5.9%
+1.0%
Aircraft costs(2)
Supplier costs(1) excluding fuel and
purchasing of maintenance services and parts
Grand total of operating costs
Purchasing of maintenance services
and parts
Operating costs ex-fuel(3)
Fuel
Reported
change €m
Change
at constant
currency
3,780 -3.4% 29%
-3.6% Total employee costs including temps
Capacity (EASK)
First Half: Change in operating costs
(1)Catering, handling charges, commercial and distribution, landing fees and air-route
charges, other external expenses, excluding temps
(2)Chartering (capacity purchases), aircraft operating leases, amortization, depreciation
and provisions
(3)Including other taxes, other revenues, other income and expenses

First Half 2014 results
Debt reimbursement profile at 30 June 2014*
770 900
560
880
690 560
460 370
180
370
606 500
600
H1 2014 2015 2016 2017 2018 2019 2020 2021 2022 Beyond
Convertible bonds
Plain vanilla bonds
Other long-term debt - mainly asset-
backed (net of deposits )
October 2016: Air France-KLM 6.75% (€700m)
January 2018: Air France-KLM 6.25% (€500m)
June 2021: Air France-KLM 3.875% (€600m)
2005 2.75% convertible
bond (€420m)
Maturity: April 2020
2nd put: April 2016
Conv. price: €20.50
2009 4.97% convertible
bond (€661m)
Maturity: April 2015
Conv. price: €11.80 2013 2.03% convertible
bond (€550m)
Maturity: Feb. 2023
Put: Feb. 2019
Conv. price: €10.30
44 * In € millions, net of deposits on financial leases and excluding KLM perpetual debt (€570m)