AIR FRANCE-KLM RESULTS PRESENTATION
25
AIR FRANCE-KLM RESULTS PRESENTATION First quarter 2018 4 th May 2018
Transcript of AIR FRANCE-KLM RESULTS PRESENTATION

AIR FRANCE-KLM RESULTS PRESENTATION
First quarter 2018
4th May 2018
FIRST QUARTER 2018: KEY HIGHLIGHTS
RASK(1)
At constant currencyOperating resultPassengers
• Positive business environment in line with
expectations
• First results from enhanced partnership
with Jet Airways
• Continuing commercial momentum (Flying
Blue, branded fares)
Adj. operating
free cash flow(3)
Strong ongoing demand Results impacted by strike
Q1 18Q1 17
-118
Q1 17 Q1 18
-33
142
324
Q1 17 Q1 18
2
Q1 18Q1 17(2) (2)
• Strikes due to wage dispute impacting Air
France result by around €75 m in Q1 2018
• KLM and Transavia performance improving
• Implementation of new accounting standards
IFRS 9, 15 and 16
-€182 m-€85 m
(1) Group Revenue per Available Seat Kilometer (RASK) Passenger + Transavia
(2) 2017 restated for implementation of accounting standards IFRS
(3) Adjusted operating free cash flow = Operating cash flow with deduction of repayment of lease debt
+5.2% +1.2%
FINANCIAL REVIEW
First Quarter 2018

(1) 2017 restated for implementation of accounting standards IFRS 9, 15 and 16
(2) Adjusted operating cash flow = Operating cash flow with deduction of repayment of lease debt
(3) ROCE 12 months sliding, for new definition see press release
FIRST QUARTER 2018
4
(1)
(1) Change
at constant currency
Revenues (€ bn) 5.81 5.71 +1.8% +5.9%
EBITDA (€ m) 621 648 -27 m -42 m
Operating result (€ m) -118 -33 -85 m -105 m
Operating margin -2.0% -0.6% -1.5 pt -1.8 pt
Net result, group share (€ m) -269 -143 -126 m
Adjusted operating free cash flow (€ m)(2) 142 324 -182 m
ROCE(3) 14.1% 9.8% +4.3 pt
Q1 2018 31 Dec 2017 Change
Net debt (€ m) 6,282 6,567 -285 m
Q1 2018 Q1 2017 Change(1)
(1)
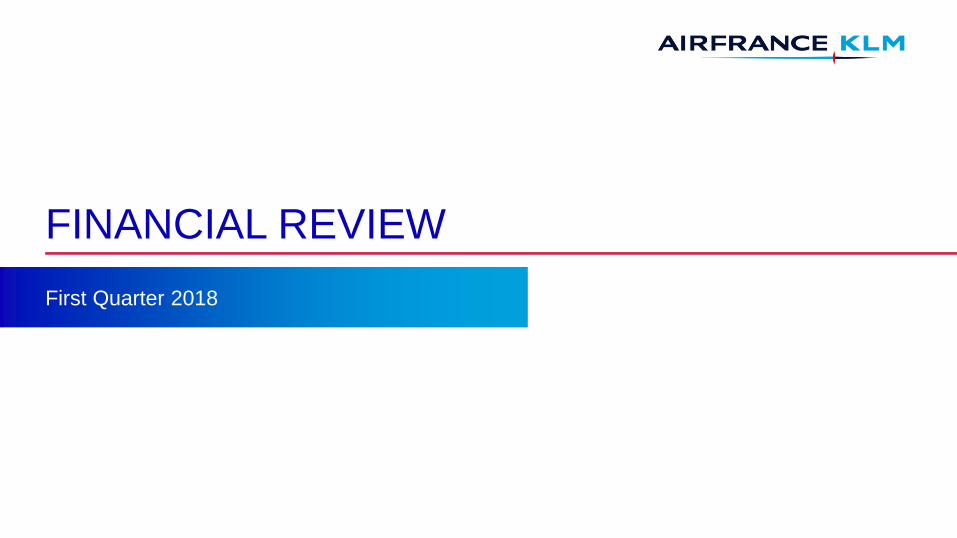
IFRS RESTATEMENT OF Q1 AND FULL YEAR 2017 CONSOLIDATED INCOME STATEMENT
5
Published
accounts
Restated
accountsChange
Published
accounts
Restated
accountsChange Impact by:
Revenues 5,709 5,705 -4 25,784 25,860 76 IFRS 15
External expenses -5,155 -5,057 98 -21,432 -21,086 346 IFRS 15 & 16
Operating leases -285 0 285 -1,088 0 1,088 IFRS 16
EBITDA 269 648 379 3,264 4,774 1,510 IFRS 15 & 16
Amortizations and depreciation -412 -681 -269 -1,776 -2,837 -1,061 IFRS 16
Current operating income -143 -33 110 1,488 1,937 449 IFRS 15 & 16
Cost of financial debt -56 -140 -84 -214 -537 -322 IFRS 16
Operating income -/- cost of debt -199 -173 26 1,273 1,400 127 IFRS 15 & 16
Other financial items -31 46 77 116 582 466 IFRS 9 & 16
Income tax 9 -21 -30 229 74 -155
Net result -216 -143 73 -274 162 436
Full year 2017
In € m
First quarter 2017
(1) Full year 2017 restated accounts have not yet been audited and could be subject to changes
(1)

REVENUE GROWTH IN ALL BUSINESSES, NETWORK MARGIN IMPACTED BY STRIKE
6
(1) Passenger airlines capacity is Available Seat Kilometer, Cargo capacity is Available Ton Kilometer
(2) Unit Revenue: Passenger airlines is Revenue per Available Seat Kilometer, Cargo is Revenue per Available Ton Kilometer
(3) 2017 restated for implementation of accounting standards IFRS
Capacity (1)Unit Revenue (2)
Constant Currency
Revenues
(€ m)Change
Operating
result (3)
(€ m)
ChangeOperating
margin (3)Change
+3.2% +1.0%
+0.6% +7.3%
Transavia +10.1% +8.4% 235 +19.3% -58 +7 m -24.7% +8.3 pt
Maintenance 471 +5.1% 27 -17 m 2.5% -1.7 pt
5,806 +1.8% -118 -85 m -2.0% -1.5 pt
-76 m -1.7% -1.5 pt
Total
Network 5,090 +0.8% -86

NETWORK: STRONG ONGOING DEMAND FOR LONG-HAUL AND HUBS, PRESSURE IN POINT-TO-POINT
North America
4.9%4.5%1.6%
AsiaCaribbean & Indian Ocean
Latin America Africa & Middle East Total long-haul
Q1 2018 Total
Medium-haul point-to-point Medium-haul hubs Total medium-haul
2.4%3.3%2.1%
-1.3%
2.0%1.4%6.2%12.6%10.3%
1.0%4.9%3.2%
2.3%7.2%4.3%
-8.9%-4.2%-4.3% -0.9%
5.2%2.6%
1.9%4.8%3.3%
-2.7%
3.5%3.4%
ASK RPK RASK ex cur. ASK RPK RASK ex cur.ASK RPK RASK ex cur.
ASK RPK RASK ex cur. ASK RPK RASK ex cur. ASK RPK RASK ex cur.
ASK RPK RASK ex cur.
ASK RPK RASK ex cur. ASK RPK RASK ex cur. ASK RPK RASK ex cur.
Premium
+7.6%
Economy
-0.1%
RASK ex cur.
7

SUCCESSFUL COMMERCIAL DEVELOPMENTS
8
• Enhanced partnership with Jet Airways is delivering promising first results
• Successful introduction of branded fares, first period shows significant upsell rates
• Revamped Flying Blue program launched with positive feedback
• New distribution strategy implemented
> As of 1 April 2018, Air France-KLM implemented a Distribution Surcharge for sales generated through
GDS.
> In order to accompany the transition to the new NDC technology, Air France-KLM has also negotiated
“private agreements” with Amadeus and Travelport that will enable their customers to access a private
channel without additional distribution surcharge.

9
(1) 2017 restated for implementation of accounting standards IFRS
+2.1%
At constant
currency, fuel
and pension
expenses
Fuel price effect
-1.7%
Currency effect
+4.0%
Reported change
-0.1%
(1)
Of which:
• Strikes at Air France +1.7%
• Exceptional +0.4%
• Productivity & labor cost -0.3%
UNIT COST IMPACTED MAINLY BY AIR FRANCE STRIKE

INCREASED PRODUCTIVITY SUPPORTED BY CAPACITY GROWTH
Change in total staff costs
Continuous focus on productivity improvement:
> First quarter 2018 average FTEs at 83,750, up
900 FTEs compared to first quarter 2017 average
• -300 Ground staff FTEs
• +1100 Cabin and +100 cockpit FTEs due to capacity
growth
> Employee productivity(1) +2.1% in Q1 18
(capacity measured in EASK +3.3%)
First quarter 2018 net change in staff cost
+1.9% compared to last year
-250 FTE
+ 2.7%
productivity(1)
52,000 51,750
30,850 32,000
+1,150 FTE
+ 0.9%
productivity(1)
Q1 2017 Q1 2018
Employee productivityAverage FTEs, including temporary staff
+6+35
Q1 2017
1,812
Q1 2018
1,853
PensionNet change
10
Q1 2017 Q1 2018
(1) Productivity measured by EASK/FTE
In € m, including temporary staff

OPERATING RESULT DOWN - €85 M
-72
In € m
-6
-83
0
-118
-33
Q1 2018Change in
pension-related
expense
(non-cash)
Currency impact
+20
Fuel price
ex-currency
Unit cost at
constant
currency, fuel
and pension
expenses
-106
Unit revenue
+91
Activity changeQ1 2017
Revenue: -224 m
Cost: -245 m
11
(1)
(1) Restated post implementation of accounting standards IFRS

AIR FRANCE IMPACTED BY STRIKE AND DOMESTIC MARKET, KLM IMPROVING AND BENEFITTING FROM ROBUST DEMAND
In € mRevenue EBITDA
Operating result Operating margin
313266
305
384
Q1 2018Q1 2017Q1 2018Q1 2017
2,3872,222
3,5533,583
Q1 2018Q1 2017Q1 2018Q1 2017
2.5%1.3%
-5.0%
-1.6%
Q1 2018Q1 2017Q1 2018Q1 2017
6028
-178
-57
Q1 2017 Q1 2018 Q1 2017 Q1 2018
12(1) Restated post implementation of accounting standards IFRS
(1)(1)
(1)(1)
(1)
(1) (1)
(1)
In € m
In € m

ADJUSTED OPERATING FREE CASH FLOW + €142 M
13
(1) Restated post implementation of accounting standards IFRS
(2) Adjusted operating cash flow = Operating cash flow with deduction of repayment of lease debt
In € m
142
512
+807
Adjusted operating
free cash flow
Payment of lease debt
-242
Net investments
-913
Voluntary Departure Plans
-22
Change in WCRCash flow before VDP
and change in WCR
(Q1 2017: +561)
(2)
(Q1 2017: -257)
(Q1 2017: 324)
(1)
(Q1 2017: -625)
Gross investments:939(Q1 2017: +682)
(Q1 2017: -37)

BALANCE SHEET CONTINUES TO IMPROVE
162
Net debt at 31 Mar 2018
6,282
Currency & other
-63
(Re)newed lease debtAdjusted operating
free cash flow
-142
Payment of lease debt
-242
Net debt at 31 Dec 2017
6,567
14
1.4x 1.3x
31 Dec 2017 31 Mar 2018
Change in Net Debt / EBITDA
--0.1
(1) 2017 restated for implementation of accounting standards IFRS
(2) Adjusted operating cash flow = Operating cash flow with deduction of repayment of lease debt
(3) Net Debt / EBITDA: see calculation in press release. EBITDA 12 months sliding
(1)
(3)
(2)(1)
In € m

OUTLOOK
2018
REVENUE OUTLOOK
16
Long Haul forward booking load factorActual Long haul load factor
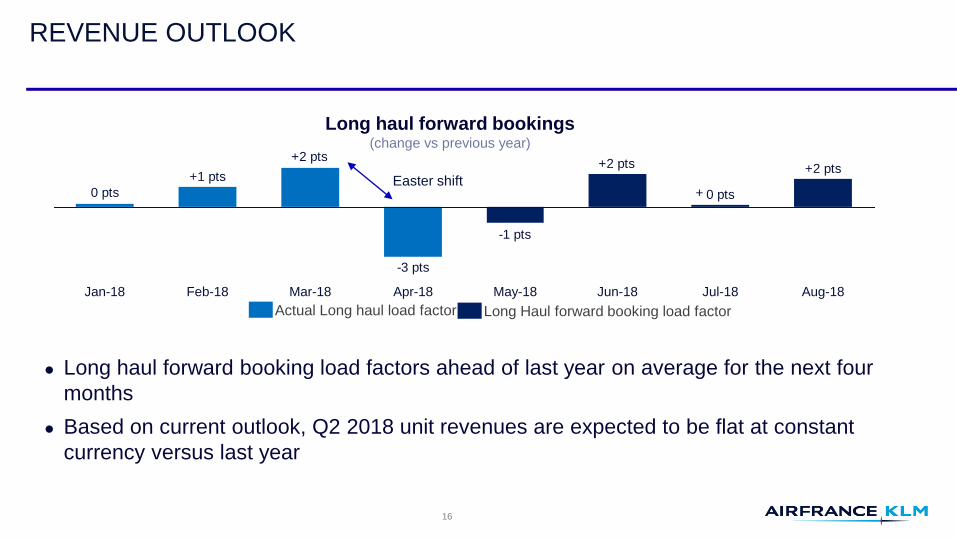
Long haul forward bookings(change vs previous year)
+2 pts
0 pts
+2 pts
-1 pts
-3 pts
+2 pts
+1 pts
0 pts
May-18 Aug-18Jul-18Jun-18Apr-18Mar-18Feb-18Jan-18
+Easter shift
Long haul forward booking load factors ahead of last year on average for the next four
months
Based on current outlook, Q2 2018 unit revenues are expected to be flat at constant
currency versus last year

FUEL BILL INCREASE ESTIMATED AT + €350 M
FY Q1 Q2 Q3 Q4
1.2
5.0
6.0(1)
1.31.5
(1) 1.5(1)
Jan-Dec
Brent ($ per bbl)(1)
71 67 73 72 71
Jet fuel ($ per metric ton)(1)
681 647 699 692 685
% of consumption already hedged 59% 62% 62% 55% 58%
Hedge result (in $ m) 750 150 250 200 150
MARKETPRICE
2017:
fuel bill €4.5 bn
2018:
fuel bill €4.9 bn(2)
2019:
fuel bill €5.1 bn(2)
(1) Based on forward curve at April 27th 2018. Sensitivity computation based on 2018 fuel price, assuming constant crack spread between Brent and Jet Fuel
(2) Assuming average exchange rate of US dollar per euro 1.23 for 2018 and 1.25 for 2019
2017
2018
1.3(1) 1.7
(1)
1.3 1.3
$ bn
6.4(1)
2019
17

FULL YEAR 2018 GUIDANCE
18
Previous guidance 2018 New Guidance 2018
Passenger +3% to +4% +2.5% to +3.5% > Downwards adjustment due to Air France strikes
Transavia +6% to +7% +6% to +7% > Unchanged
+€150 m +€350 m > Reflecting expected further increase of oil price
throughout the year
€0 to €50 m tailwind Circa €100 m headwind > Euro strengthening compared to other currencies
-1.0 to -1.5% 0% to +1.0%> Adjusted target including strike related cost and
associated lower capacity
€2.0 bn to €2.5 bn €2.0 bn to €2.5 bn > Unchanged
Net debt below 2017> Net Debt 31 Dec 2018 expected to decrease
compared to 31 Dec 2017Debt
Capacity
Fuel
Currency
Unit cost at constant
currency, fuel and pension-
expense
Capex
With strike effects estimated at least at 300 million euros integrated in the above
guidance elements and taking into account fuel and currency headwinds, the full year
2018 operating result is expected to be notably below 2017
APPENDIX
First Quarter 2018

IFRS RESTATEMENT FOR 2017 BALANCE SHEET AND Q1 2017 OPERATING FREE CASH FLOW
20
In € bnPublished
accounts
Restated
accountsChange
Published
accounts
Restated
accountsChange
Asset 24.4 30.2 5.8 Liabilities & Equity 24.4 30.2 5.8
Fixed Assets: equipments 11.4 11.1 -0.3 Equity 3.0 2.5 -0.5
Fixed Assets: right of use 0.0 5.9 5.9 Liabilities 21.4 27.7 6.3
Deferred tax asset 0.2 0.5 0.2 Lease debt 0.0 5.1 5.1
Provision maintenance 2.2 3.2 1.0
Balance sheet restatement per 31 Dec 2017
Cashflow restatement Q1 2017
Published
accounts
Restated
accountsChange
Operating free cash flow 329 581 252
Cash flow from financing activities -192 -444 -252
Change in cash and cash equivalents 126 126 0
In € m
(1) Only accounts impacted by new accounting standards IFRS
(1)
(1)

FUEL BILL SENSITIVITY
21
Based on forward curve at April 27th 2018. Sensitivity computation based on 2018 fuel price, assuming constant crack spread between Brent and Jet Fuel
Assuming average exchange rate of US dollar per euro 1.23 for 2018
0 $ Bln
1 $ Bln
2 $ Bln
3 $ Bln
4 $ Bln
5 $ Bln
6 $ Bln
7 $ Bln
8 $ Bln
9 $ Bln
10 $ Bln
35 40 45 50 55 60 65 70 75 80 85 90 95 100
Fue
l bil
l
Brent price in USD/bl
Fuel expenses without hedging
Fuel expenses with hedging
Market 70.7 $/bblAFKL price 2018 62.3 $/bblHedge gain + 8.4 $/bbl
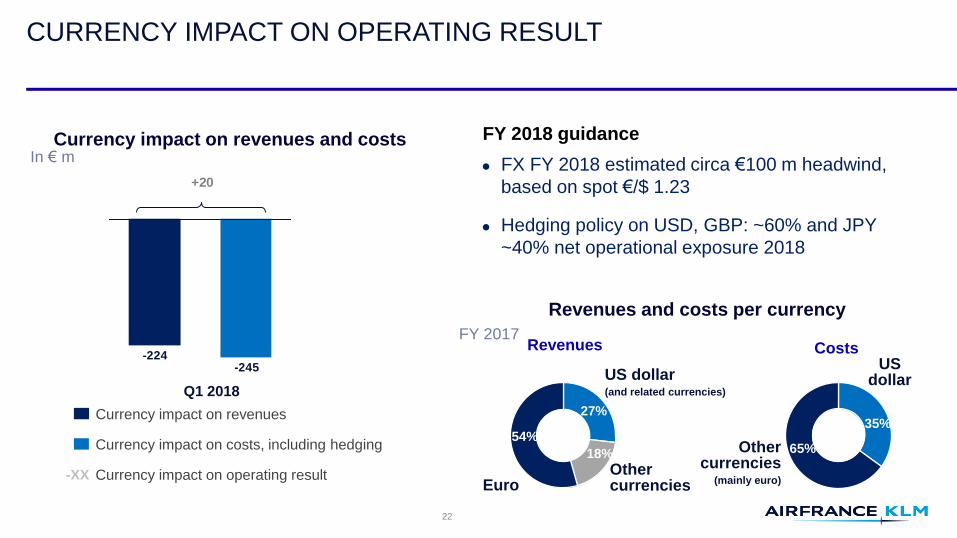
CURRENCY IMPACT ON OPERATING RESULT
FX FY 2018 estimated circa €100 m headwind,
based on spot €/$ 1.23
Hedging policy on USD, GBP: ~60% and JPY
~40% net operational exposure 2018
Revenues
Euro
US dollar(and related currencies)
27%
18%
Othercurrencies
54%
Costs
35%
65%Other currencies
(mainly euro)
US dollar
Currency impact on revenues
Currency impact on costs, including hedging
Currency impact on operating result-XX
In € m
FY 2018 guidance
FY 2017
Revenues and costs per currency
Currency impact on revenues and costs
+20
Q1 2018
-245-224
22
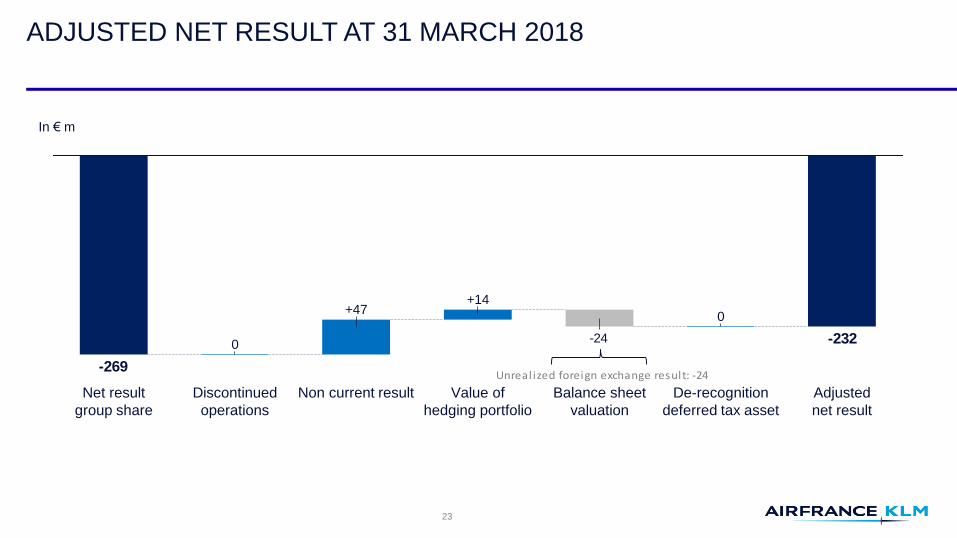
ADJUSTED NET RESULT AT 31 MARCH 2018
-24 -232
-269
Adjusted
net result
De-recognition
deferred tax asset
0
Balance sheet
valuation
Value of
hedging portfolio
+14
Non current result
+47
Discontinued
operations
0
Net result
group share
Unrealized foreign exchange result: -24
23
In € m

PENSION DETAILS AT 31 MARCH 2018
+359
-657Net balance sheet situation by airlineNet balance sheet situation by airline
Air France
Air France end of service benefit plan (ICS): pursuant to French regulations and the company agreement, every employee receives an end of
service indemnity payment on retirement (no mandatory funding requirement). ICS represents the main part of the Air France position
Air France pension plan (CRAF): related to ground staff affiliated to the CRAF until 31 December, 1992
KLM
Defined benefit schemes for Ground Staff
+67
-1,679
+89
-1,662
-1,573-1,612
31 Dec 2017 31 Mar 2018
24
In € m

FINANCIAL DEBT REIMBURSEMENT PROFILE AT 31 MARCH 2018
Plain vanilla bondsJune 2021: Air France-KLM 3.875% (€600 m)
October 2022: Air France-KLM 3.75% (€400 m)
December 2026: Air-France KLM 4.35% ($145 m)Other long-term debt – mainly
asset-backed (net of deposits)
Hybrid bond (recognized as equity)
2015 6.25% undated hybrid bond
(€600 m)
Call: October 2020
Debt Reimbursement Profile(1)
800550
750 800
450 350200
1,050
600
400
100600
2018 2019 2020 2021 2022 2023 2024 2025 and beyond
In € m
25
(1) Net of deposits on financial leases and excluding Operating lease debt payments and KLM perpetual debt


![AIRF2011 RFS EN CH01 [P] - Air France KLM...Leo van Wijk (2) 64 years June 24, 2004 September 15, 2004 Air Transport (KLM) Vice-Chairman of the Air France-KLM Board of Directors Maryse](https://static.fdocuments.us/doc/165x107/610792459080553b0d46678b/airf2011-rfs-en-ch01-p-air-france-leo-van-wijk-2-64-years-june-24-2004.jpg)