
Firm Size Distribution, Production Efficiency, and Returns to … · 2017-04-20 · Firm Size...
35
Firm Size Distribution, Production Efficiency, and Returns to Scale: A Stochastic Frontier Approach * Hien Thu Pham † Shino Takayama ‡ April 19, 2017 Abstract This paper empirically investigates the relationship between firm size, production efficiency, and returns to scale. Using a recently developed stochastic frontier approach and data from Viet- nam, our analysis shows that across all of the sectors we consider, production efficiency is most variable among middle-sized firms, with these firms across all sectors tending to have the lowest production efficiency. While most firms across different sized groups show constant returns-to- scale technologies, our analysis using Spearman coefficients shows that there is a significant dif- ference in technologies and this difference varies substantially across size groups in all sectors. Furthermore, we show that the least-efficient size also differs across sectors. Although our analy- sis is a snapshot of the Vietnamese manufacturing industry, the diverse production efficiencies in the middle-sized groups can be thought of as a risk that small-sized firms would face in expanding their business. Key Words: Firm size distribution, Missing middle, Productivity, Efficiency, Stochastic frontier. JEL Classification Numbers: D21, D22, L25. * The authors would like to thank Jaap Bos, Fabrizio Carmignani, Tim Coelli, Begona Dominguez, Eric Eisenstat, Mohamad Khaled, Andrew McLennan, Antonio Peyrache, Prasada Rao, Rodney Strachan, Satoshi Tanaka, Yuichiro Waki, Paul Wilson, Haishan Yuan, Valentin Zelenyuk, Xiaohui Zhang, and other participants at the University of Queensland Macro Workshop. We are also grateful to the Vietnamese General Statistical Office for granting permission to use the microdata in the enterprise surveys. Any remaining errors are our own. ST acknowledges funding from the Zengin Foundation for Studies on Economics and Finance. † Pham (corresponding author); School of Economics, University of Queensland; e-mail: [email protected] ‡ Takayama; School of Economics, University of Queensland; email: [email protected]; tel: +61-7-3346- 7379; fax: +61- 7-3365-7299.
Transcript of Firm Size Distribution, Production Efficiency, and Returns to … · 2017-04-20 · Firm Size...

Firm Size Distribution, Production Efficiency, and
Returns to Scale: A Stochastic Frontier Approach ∗
Hien Thu Pham † Shino Takayama‡
April 19, 2017
Abstract
This paper empirically investigates the relationship between firm size, production efficiency,
and returns to scale. Using a recently developed stochastic frontier approach and data from Viet-
nam, our analysis shows that across all of the sectors we consider, production efficiency is most
variable among middle-sized firms, with these firms across all sectors tending to have the lowest
production efficiency. While most firms across different sized groups show constant returns-to-
scale technologies, our analysis using Spearman coefficients shows that there is a significant dif-
ference in technologies and this difference varies substantially across size groups in all sectors.
Furthermore, we show that the least-efficient size also differs across sectors. Although our analy-
sis is a snapshot of the Vietnamese manufacturing industry, the diverse production efficiencies in
the middle-sized groups can be thought of as a risk that small-sized firms would face in expanding
their business.
Key Words: Firm size distribution, Missing middle, Productivity, Efficiency, Stochastic frontier.
JEL Classification Numbers: D21, D22, L25.
∗The authors would like to thank Jaap Bos, Fabrizio Carmignani, Tim Coelli, Begona Dominguez, Eric Eisenstat,
Mohamad Khaled, Andrew McLennan, Antonio Peyrache, Prasada Rao, Rodney Strachan, Satoshi Tanaka, Yuichiro Waki,
Paul Wilson, Haishan Yuan, Valentin Zelenyuk, Xiaohui Zhang, and other participants at the University of Queensland
Macro Workshop. We are also grateful to the Vietnamese General Statistical Office for granting permission to use the
microdata in the enterprise surveys. Any remaining errors are our own. ST acknowledges funding from the Zengin
Foundation for Studies on Economics and Finance.†Pham (corresponding author); School of Economics, University of Queensland; e-mail: [email protected]‡Takayama; School of Economics, University of Queensland; email: [email protected]; tel: +61-7-3346-
7379; fax: +61- 7-3365-7299.

1 Introduction
The missing-middle phenomenon, as first documented by Liedholm and Mead (1987), refers to the
empirical feature that most employment in developing countries is located in either small- or large-
sized firms. Tybout (2000) also finds that there is a large spike in the size distribution for small-sized
firms, but that this drops off quickly among middle-sized firms in the poorest countries, and thus
argues that strong business regulation could be a reason behind the existence of too many small
firms1.
Considering that the missing middle is more evident in developing nations, we envisage that there
are some reasons for its existence that particularly apply to developing countries, but not so much to
developed countries. In search of these reasons, we employ firm-level data from Vietnam and examine
whether there is any difference in production efficiency across different firm sizes. For this purpose,
we estimate each firm’s production efficiency and returns to scale (RTS) in particular manufacturing
sectors. Using a recently developed stochastic frontier approach and data from Vietnam, our anal-
ysis shows that across all of the sectors we consider, production efficiency is most variable among
middle-sized firms, with these same firms across all sectors tending to have the lowest production
efficiency. While most firms across different size groups show constant returns-to-scale technologies,
our analysis using Spearman coefficients shows that there is a significant difference in technologies
and this difference varies substantially with size groups across sectors. Furthermore, we show that the
least-efficient size also differs across sectors. This suggests the necessity of sector-by-sector analysis
when considering the underlying mechanism for the missing-middle phenomenon.
We also find that there are many firms whose efficiency is low; in fact, the efficiency of some
firms is less than 70% of that of the most efficient firms, across the different firm sizes in all sectors.
Almost half a century ago, Leibenstein (1966) introduced the concept of X-efficiency, with the argu-
ment that this inefficiency, unlike allocative efficiency, is mainly the result of incentive misalignment
in the workplace. Leibenstein (1966) reviews several empirical studies and shows that allocative in-
efficiency, such as that caused by a tax, could account for only very small losses in total production
whereas improving management or motivational efficiency in a workplace could increase production
1See also Little et al. (1987) for South Korea and Steel and Webster (1992) for Ghana. The presence of the missing-
middle phenomenon and our definition have been intensively discussed in the literature (see Hsieh and Olken, 2014;
Tybout, 2014a,b).
1

by approximately 50%. Although it is generally difficult to separate these inefficiencies empirically,
our results suggest that there are many inefficient firms of different sizes in each sector and that this
feature is more prominent in middle-sized firms across the different sectors.
Hsieh and Olken (2014) consider the possibility that regulatory obstacles generate the missing-
middle phenomenon, but find no evidence of discontinuities in the firm size distribution. In contrast,
Tybout (2014b) claims that the missing middle is at least partly policy induced and states that when
policies are imperfectly enforced, producers tend to prefer to remain small in order to avoid taxes
and costly regulations. One difference of our approach from the previous literature is that rather
than looking at taxes or regulations themselves, we study production efficiency as a manifestation
of the business environment in developing countries. Certainly, business environments vary across
countries. However, while it is difficult to measure precisely the health of the business environment
or how well managed the firms are, production efficiency can yield evidence about the management
of an organization. We provide empirical evidence that the use of resources in developing countries
might be less than efficient and that this inefficiency is more prominent in middle-sized firms.
We begin with a test of the firm size distribution against bimodal and unimodal distributions. The
bimodality statistics for the entire sample of the manufacturing industry that we examine imply the
existence of bimodality in Vietnam. We then study the relationship between production efficiency and
firm size for various sectors of the manufacturing industry by using the stochastic frontier approach.
Our first contribution is to show that production efficiency is most diverged in the group of middle-
sized firms. We obtain this same finding using a nonparametric approach, which we also present in
this paper. Like our companion paper, Pham and Takayama (2015), which provides evidence that the
likelihood of paying bribes increases with firm size, this paper provides evidence that some middle-
sized firms are disadvantaged in production. Further, our paper extends the analyses in Pham and
Takayama (2015) by using a stochastic frontier approach, which allows us to consider the relationship
between returns to scale, technological differences for each firm, and firm sizes. As mentioned,
most firms show constant returns-to-scale technologies, although our detailed analysis of Spearman
coefficients across different size groups shows that firms’ technologies are significantly different.
Overall, our analysis shows that the middle-sized group is a ‘mixed bag’ in the sense that firms
with very high and very low production efficiencies coexist in this size group. Meanwhile, there is a
significant heterogeneity in firms’ technologies. Although our analysis is a snapshot of the Vietnamese
manufacturing industry, the diverse production efficiencies in the middle-sized groups can be thought
2

of as a risk that small-sized firms would face in expanding their businesses.
In recent years, many methods have been developed to estimate production efficiency using the
frontier approach.2 Comparing average products across different inputs is a complicated task. As
pointed out by Ray (2004), measures of a firm’s productivity relying on a single input disregarding
other inputs may fail to reflect total factor productivity. Taking this into account, we use the frontier
approach.3
Aigner et al. (1977) and Meeusen and van den Broeck (1977) propose a stochastic production
frontier approach. This approach uses a parametric estimation method, where the form of the produc-
tion function is known and can be estimated statistically. The advantages of this approach are then
that hypotheses can be tested with statistical rigor, and that we can apply some known functional form
between outputs and inputs. Using this approach, we can simultaneously estimate technical efficiency
and returns to scale. Several studies have already measured the performance of manufacturing sec-
tors using this method (see Caves and Barton, 1990; Greene and Mayes, 1991). However, both these
studies assumed that firms share the same technology.
One of the challenges in the stochastic frontier literature is the treatment of heterogeneity and
analyzing its effects on efficiency estimations.4 For this reason, a random coefficient stochastic fron-
tier model has been developed to incorporate heterogeneous effects. For example, Tsionas (2002)
uses Gibbs sampling to estimate the random coefficient stochastic frontier model for US electric util-
ity companies in 1970, and provides evidence that the random coefficient model is a better fit than
the fixed coefficient model. Elsewhere, using a similar method Diaz and Sanchez (2008) shows that
compared with larger-sized firms, small and middle-sized firms in Spain tend to be more efficient.
As pointed out by Feng and Zhang (2014), not considering the technological heterogeneity of an
2Production frontiers can be estimated using parametric estimates (so-called deterministic or stochastic frontier anal-
ysis) or calculated using nonparametric approaches (such as the free-disposal hull). For details, see Kalirajan and Shand
(1994).3Some other studies, including the following, estimate total factor productivity (TFP). Johannes (2005) provides ev-
idence on the differences in the evolution of firm size and the productivity distribution across nine sub-Saharan African
countries and developed countries, including the US. Banerjee and Duflo (2005) provide a survey and analyze what ac-
counts for lower TFP, such as access to technology or human capital, in poor countries (which they call “macro puzzles”).4The omission of heterogeneity in stochastic frontier models has been well documented to produce biased efficiency
estimations (see Greene, 2008; Kumbhakar and Lovell, 2000, for complete reviews). Empirical studies have also shown
relevant implications of heterogeneity in the estimation of both efficiency levels and rankings (see Bos et al., 2009; Greene
and Mayes, 2004, for examples in the banking and health sector).
3

individual firm even within a single sector can cause bias in measuring returns to scale. Consolidating
data from multiple sectors may further distort the estimation of returns to scale. It is particularly im-
portant to study this measure at the sectoral level, as the underlying technology in each sector would
not be much different in comparison with different sectors. To the best of our knowledge, we know
of no other studies that use a random stochastic frontier analysis to consider firms’ heterogenous
technologies and estimate production efficiencies across different firm sizes in various sectors of a
developing country in the context of the missing-middle phenomenon. In particular, this is because
analysis of the underlying mechanisms for the observed firm size distribution is less developed, per-
haps because of the lack of detailed data.5 The dataset we use is the Enterprise Census conducted
by the General Statistics Office of Vietnam (GSO) containing information on all registered firms in
Vietnam. Our data include capital, labor, and intermediate materials as inputs, and goods measured
in monetary terms as the output. Table 1 details the seven sectors6 we examine in this paper.
Our work also relates to the literature on estimating returns to scale. By using a similar method,
Feng and Zhang (2014) investigate the returns to scale of large banks in the US over the period
1997–2010 by considering technological heterogeneity and show that most bank production functions
exhibit constant returns to scale. Some other works estimate returns to scale for an entire industry.
For instance, Basu and Fernald (1997) employ US data to estimate returns to scale and find that a
typical industry appears to have constant or slightly decreasing returns to scale. Diewert et al. (2011)
find a similar result using Japanese data over the period 1964 to 1988 (see also Miller and Noulas,
5Recently, there has been growing interest in the relationship between the firm size distribution and productivity in de-
veloped countries. For example, Leung et al. (2008) investigate differences between the US and Canada in the distribution
of employment over firm size, and confirm that a larger average-sized firm supports higher productivity at both the plant
and firm levels. Crosato et al. (2009) investigate data from a micro-survey in Italy, and using nonparametric estimates,
reveal that firms in the concave part of a Zipf plot of the Italian firm distribution overwhelmingly experience increasing
returns to scale, while firms in the linear part are mainly characterized by constant returns to scale. Elsewhere, Diaz and
Sanchez (2008) employ a stochastic frontier model to investigate small- and medium-sized manufacturing enterprises in
Spain and find that these firms tend to be less efficient than their larger peers.6These sector codes are based on International Standard Industrial Classification (ISIC) codes. There are 14 sectors
with more than 200 observations each year, for which we can ensure the robustness of the empirical results. Then we
choose five sectors among them, using the convergence criterion for the Markov Chain Monte Carlo (MCMC) procedure
in our model of translog production functions. For the other nine sectors, we have used a Cobb–Douglas production
function, which provides a better fit for these nine sectors. A summary of the results for the other nine sectors is available
in Section 6.2 and the details are available upon request from the authors.
4

1996; Doraszelski, 2004). Our paper is one of the first to apply a random coefficient model to estimate
returns to scale for each firm using the stochastic frontier approach to data from a developing country.
We intensively study inefficiencies and returns to scale across different firm sizes at the sectoral level.
The remainder of the paper is organized as follows. Section 2 describes our dataset. Section 3
provides some data statistics about the size distribution of Vietnamese firms. Section 4 describes our
methodology for estimating production efficiency and returns to scale. Section 5 presents the main
results. Section 6 further examines the main results. The final section concludes.
Table 1: ISIC Codes and Industry Description
ISIC Industry Description ISIC Industry Description18 Wearing apparel etc. 20 Wood and wood products26 Nonmetallic mineral products 28 Fabricated metal products36 Furniture
2 Data Description
An enterprise census has been conducted annually in Vietnam since 2000, where an enterprise is
defined as “an economic unit that independently keeps a business account and acquires its own legal
status”. In this paper, we focus on the nine-year period from 2000 to 2008. We exclude recent years
(from 2009 to the present) to separate the size distribution from the effects of the global financial
crisis and certain size-biased policies such as a 30% reduction in corporate income tax for qualifying
entities implemented in the fourth quarter of 2008 and all of 20097 or the tax reduction for small
and middle-sized firms involved in labor-intensive production and processing activities under Decree
60/2011. We also exclude inconsistent data from our sample, such as twice-recorded observations
for the same firm in the same year, firms with negative or zero revenue values, and firms with an
implausibly large number of employees. We primarily present the results for five industries that have
at least 200 annual observations and for which translog specifications of the production functions
provide the best fit. In our main analysis, we have chosen firms that have data for at least four years.
In our analysis, the size of a firm is related to a head-count of the number of workers in the firm
at the end of the fiscal year. Labor is measured as the total income of employees in a firm. This
includes total wages and other employee labor-related costs such as social security, insurance, and7See Circular No. 03/2009/TT-BTC published in January 2009 by Vietnam’s Ministry of Finance.
5

other benefits. Intermediate materials include costs such as fuel and the value of other materials.
Capital is measured as assets used in production.
We should note that at the firm level, prices and quantities may not be well measured, and therefore
revenue, rather than gross output or cost, is normally used. Hsieh and Klenow (2009) discuss some of
the problems: if products are differentiated, revenue-based productivity measures may mainly reflect
market distortions, mark-ups, and adjustment costs. Basu and Fernald (1997) provide evidence that
elasticities of labor and capital in revenue estimations are downward biased. Klette and Griliches
(1996) report that changes in sector prices are substantially diversified and correlated with changes
in labor and capital. Ideally, physical output should be used to eliminate the price bias that arises
if output is constructed by deflating firm revenues by an industry-level price index. Owing to data
constraints, we use the deflated revenue as a proxy for physical output. Moreover, because our main
interest is the relative ranking rather than the level of firm efficiencies, we expect that the estimations
relying on revenue data do not markedly affect our discussion.8
All variable values are adjusted for inflation. The annual inflation data are from the World Bank.
Detailed descriptions of the variables can be found in Table 7.
3 Preliminary Statistics: The Missing Middle
3.1 The Bimodality Coefficient
We now present some statistics and provide a more detailed analysis of the firm size distribution. First,
we conduct the bimodality coefficient test. This test examines the relationship between the bimodality,
skewness, and kurtosis of the distribution. The bimodality coefficient (BC) is m20+1
m1+3(n−1)2
(n−2)(n−3)
, wherem0
is skewness and m1 is the excess kurtosis. In words, BC is proportional to the division of squared
skewness by uncorrected kurtosis. This is consistent with the logic that the bimodal distribution tends
to have low kurtosis and/or asymmetric characteristics.
The BC statistics range from 0 to 1. The maximum value of 1 is obtained if the population has
only two distinct values. Heavy-tailed distributions will have small values of BC, regardless of the
number of modes (see Knapp, 2007). A BC that exceeds 0.55 (the value of a uniform population)
8Strategies for dealing with revenue data range from calibrated modeling Hsieh and Klenow (see 2009) to econometric
estimators that take a stand on the nature of consumer preferences (see Loecker et al., 2015; Loecker and Warzynski,
2012; Loecker, 2011; Katayama et al., 2009; Klette and Griliches, 1996).
6

Table 2: The Dip Statistics and Bimodality Coefficients for Each Sector
Sec 18 20 26 28 36
Dip 0.016 0.025 0.014 0.030 0.022
p-value 0 0 0 0 0 0
BC 0.62 0.68 0.37 0.66 0.69
Note - BC indicates the Bimodality Coefficients.
suggests bimodality. 9 As shown, all BC statistics are larger than 0.55, which indicates the existence
of bimodality. The BC test, however, is criticized because of its sensitivity to the skewness of the
distribution. Thus, we also include the results of the Dip test, which is considered to be more robust
(see Freeman and Dale, 2013).
3.2 The Dip Test
Based on the fact that a truly bimodal distribution should have a large dip between the two modes,
Hartigan and Hartigan (1985) develops the dip test to distinguish between unimodality and bimodality.
In particular, the test examines the departure of the observed density function from the unimodal one
which is assumed to have a single inflection point between the convex and concave segments Freeman
and Dale (2013). Therefore, Dip statistics tend to be robust to skewness as they test the observed
function against the presence of a single rejection point. By using the Dip test, we can study the null
hypothesis H0 that the sample distribution has a unimodal density, against the alternative hypothesis
H1 that the sample distribution has more than one mode. Hartigan and Hartigan (1985) define the
Dip statistics as follows. Let ρ(F,G) = supx |F (x)−G(x)| for any bounded functions F , G. Define
ρ(F,A ) = infG∈A ρ(F,G) for any class A of bounded functions. Let U be the class of unimodal
distribution functions. The Dip statistics of a distribution are defined byD(F ) = ρ(F,U ). According
to the results of the Dip test, the null hypothesis is rejected at the 5% significance level for all years,
which indicates the presence of bimodality or multimodality.10
Table 2 presents the results for the bimodality coefficients and the Dip tests. The BCs indicate
that the five sectors’ firm size distributions are bimodal. This is consistent with the results of the Dip
tests.11
9For more details, see p. 1258 in SAS Institute Inc. (2008).10A more detailed interpretation of this statistic is found in Freeman and Dale (2013).11Pham and Takayama (2017) expands the set of sectors to 14 sectors, and presents the results of the bimodality
coefficients and the Dip tests including the other nine sectors.
7

Table 3: The Dip Statistics and Bimodality Coefficients for Each Sector and Each Year
Bimodality Coefficients
Sec. 18 20 26 28 36
2000 0.69 0.70 0.64 0.72 0.69
2001 0.64 0.74 0.67 0.72 0.78
2002 0.63 0.71 0.68 0.74 0.75
2003 0.59 0.72 0.66 0.75 0.66
2004 0.59 0.73 0.66 0.78 0.74
2005 0.67 0.76 0.67 0.71 0.70
2006 0.67 0.66 0.65 0.69 0.75
2007 0.64 0.58 0.66 0.69 0.72
2008 0.66 0.71 0.80 0.72 0.71
The Dip Statistics (p-value)
Sec. 18 20 26 28 36
20000.021 0.024 0.025 0.020 0.021
(0.30) (0.01) (0.00) (0.19) (0.29)
20010.016 0.023 0.016 0.026 0.016
(0.42) (0.02) (0.06) (0.00) (0.43)
20020.018 0.021 0.016 0.29 0.018
(0.14) (0.02) (0.05) (0.00) (0.14)
20030.016 0.017 0.017 0.025 0.016
(0.10) (0.03) (0.02) (0.00) (0.10)
20040.016 0.021 0.014 0.027 0.016
(0.05) (0.00) (0.07) (0.00) (0.06)
20050.019 0.021 0.015 0.022 0.019
(0.00) (0.00) (0.03) (0.00) (0.00)
20060.026 0.031 0.017 0.057 0.026
(0.00) (0.00) (0.01) (0.00) (0.00)
20070.023 0.026 0.014 0.033 0.022
(0.00) (0.00) (0.02) (0.00) (0.00)
20080.034 0.030 0.018 0.035 0.034
(0.00) (0.00) (0.00) (0.00) (0.00)
Note: Variables inside parentheses are the p-values. The p-value is calculated by comparing the Dip statistics obtained
from the data, and the one from random resamplings by using STATA.
8

We have also computed the BCs for each sector by year as shown in Table 3. Because the number
of observations in each year for each sector decreases, the results fluctuate. In the yearly results,
the BCs tend to increase, and even for sectors 26, the BCs are higher than 0.65. Perhaps sector 26
is the interesting case. Although it shows the lowest score for any year, sector 26’s score for each
year is higher than 0.65. We further analyzed sector 26’s histograms of firm size distribution for each
year and found that small firms grew noticeably in this sector year by year. According to Anh et al.
(2014), the nonmetallic mineral products industry is one of the “sunrise” industries in Vietnam. This
industry’s ranking in the share of total output has increased from eighth (in 2001) to second in 2007,
and continues to be the second highest after Food products.
Finally, we present the Dip test results for each sector by year in Table 3. According to the results
of the Dip test, in more recent years, the null hypothesis is rejected at the 5% significance level for
all sectors, which indicates the presence of bimodality or multimodality, although between 2000 and
2004, we cannot reject the null hypothesis for some sectors.
4 Estimation Methodology
The stochastic frontier method is selected because it allows for statistical noise resulting from events
outside the firm’s control as well as other types of specification error and the omitted variable problem.
Moreover, the random coefficient model is chosen. The advantage of our method is that it allows
us to capture the unobserved technological heterogeneity across different firms in an industry. By
allowing the coefficient to vary across firms, we can estimate the returns to scale for each firm in the
industry. In particular, we allow the coefficient of the standard fixed coefficient stochastic frontier
model to vary by decomposing the firm-specific coefficients into two parts: the mean vector and the
random vector. The random vector is drawn from a multivariate normal distribution of mean zero.
The fixed coefficient model can be obtained easily by excluding the random components.
In general, the advantage of our random coefficient model over the fixed version is that it provides
a better approximation of the underlying heterogeneity of technologies across different firms and thus
allows us to estimate the returns to scale of each firm more accurately. With this method, we can
obtain, for each firm, a separate production frontier and thus estimate the returns to scale of each firm
according to its own frontier. This method is especially useful when there exists a high degree of
heterogeniety across observations.
9

We employ both the fixed and random coefficient methods to estimate the efficiency of production.
Our main analysis employs a stochastic frontier (SF) model using panel data. In this section, we
briefly detail the Bayesian procedure for estimating the random coefficient SF model. We adopt the
methodology detailed in O’Donnell and Coelli (2005) and Feng and Zhang (2014). The Bayesian
approach is preferable over the maximum likelihood estimation because the first method does not
require the specification of an explicit distribution for the inefficiency term. At the same time, the
estimation can utilize prior information to update the posterior estimation. We estimate the following
translog production function:
ln y = a0 +∑3
n bn lnxn + 12
∑3n
∑3j bnj lnxn × lnxj
+σtt+ 12σttt
2 +∑3
n ρnt lnxn + u+ v.(1)
The translog function allows interactions between inputs and is widely used in the literature. We
compare the deviance information criterion (DIC) between that from the Cobb–Douglas analysis and
that from the translog function analysis. Because that in the translog analysis shows better fit, we
mainly report the results from the translog analysis.
Let ln y = qit for some i, t, and we rewrite (1) as:
qit = xitβi + uit + vit, (2)
where βi follows a multivariance normal distribution: βi ∼ i.i.d.N(β,Ω). Also, vit ∼ i.i.d.N(0, σ2v)
and uit ∼ i.i.d. exp(λ−1).
Decomposing βi into its mean vector of β and a random vector δi yields
βi = β + δi, (3)
where δi ∼ i.i.d.N(0,Ω).
Given these specifications, we can rewrite the stochastic frontier model as
qit = z′itβ + z′itδi + uit + vit, (4)
where vit and uit are defined as above. When δi = 0s×1, the random coefficient translog SF model
reduces to the fixed coefficient SF model. Now, we briefly describe the Bayesian procedure for
estimating the random coefficient SF model. We use a flat prior for β, as
p(β) ∝ 1, (5)
10

and the following distribution for hv ≡ 1σ2v,
p(hv) ∝1
hv. (6)
The prior for uit can be written as
p(uit|λ−1) = fGamma(uit|1, λ−1). (7)
To obtain the prior, we use:
p(λ−1) = fGamma(λ−1|1,− ln τ ∗). (8)
We use the median values from our nonparametric analysis, which we discuss in the next section,
as the prior for each sector. For priors of δi and Ω, we follow the following:
δi ∼ i.i.d.N(0,Ω) and Ω ∝ IW (1,Ω) (9)
where IW (1,Ω) is an inverse Wishart density with 1 degree of freedom and scale matrix Ω = 10−6Is.
Let K be the total number of firms in the dataset and Ti be the set of time periods for which firm
i’s sample is taken in the dataset. Let N be the total number of observations in the dataset. The
likelihood function is
L(q|β, hv, u, λ−1, δ,Ω) =K∏i=1
∏t∈Ti
[√hv2π
exp(qit − z′itβ − zitδi − uit
)2]
∝ (hv)N2 exp
[−hv
2v′v
],
(10)
where v is a N × 1 vector such that v = qit − z′itβ − zitδi − uit.
By Bayes’ Theorem, using the likelihood function (10) and the prior distributions (5) to (9), we
obtain the posterior joint density function
f(β, hv,u, λ−1, δ,Ω|q) ∝ hN/2−1v exp
[−hv
2v′v
] K∏i=1
[|Ω|−1/2 exp
(−1
2δ′iΩ
−1δi
)]
×K∏i=1
∏t∈Ti
[λ−1 exp(−λ−1uit) exp(λ−1 ln τ ∗)× |Ω|
t+s+12 exp
[−1
2tr(ΦΩ−1)
]].
(11)
11

Table 4: Priors for MCMC
Sector 18 20 26 28 36
Prior 0.29 0.25 0.22 0.28 0.27
Then, the system of the full conditional posterior distribution is:
p(β|q, hv,u, λ−1,∆,Ω) ∝ fNormal(β|b, h−1v , (zz′)−1)
p(hv|q, β,u, λ−1,∆,Ω) ∝ fGamma(hv|N2 ,12v′v)
p(yit|q, β, hv, λ−1,∆,Ω) ∝ fNorma(uit|qit − z′itβ − z′itδi − (hvλ)−1, h−1v ) · I(uit ≥ 0)
p(λ−1|q, β, hv,u,∆,Ω) ∝ fGamma(λ−1|N + 1,u′ιN − ln τ∗)
p(δi|q, β, hv,u, λ−1,Ω) ∝ fNormal(δi|δ, (Ω−1 + hvzz′i)−1)
p(Ω|q, β, hv,u, λ−1,∆) ∝ IW (r +K,Φ + ∆∆′).
The efficiency score is given by exp(−uit) for each i, t. We then compute the returns to scale. To
do so, we take the first derivative of ln y with respect to each lnx. This gives us the measure of RTS.
Now,d ln y
d lnxi= bi +
1
2bni lnxn + ρit, (12)
and RTS is given by
RTSi =3∑i
d ln y
d lnxi. (13)
To estimate the model, we use the Gibbs sampling algorithm, which draws from the joint posterior
density by sampling from a series of conditional posteriors. Once draws from the joint distribution
have been obtained, any posterior feature of interest can be calculated. When estimating the model
for each sector, we discard the first 10,000 as a burn-in and then repeat the procedure 390,000 times
for each sector.12 All the results are based on the last 200,000 times after ensuring convergence.
As mentioned, we use the mean values of the estimates in the nonparametric analysis or free-
disposal hull, described in Section 6.4, as the priors for the MCMC. The following table summarizes
these.
Finally, we compute RTS by using (13) and categorize firms into three groups, namely, Increasing
Returns to Scale (IRS), Decreasing Returns to Scale (DRS), and Constant Returns to Scale (CRS) by
12We have chosen this by checking convergence using a scale reduction factor (SRF).
12

examining whether the 95% credible intervals are strictly greater than 1.0 (IRS), strictly less than 1.0
(DRS), or include 1.0 (CRS). These definitions are also adopted in Orea (2002), or Feng and Zhang
(2014).13
4.1 Spearman Test
Spearman rank correlation is used to test the association between two ranked variables without requir-
ing knowledge of the joint probability distribution of the variables. For a sample of size n, let rg(Xi)
denote the ranking of firm i’s RTS using the fixed-effect estimation, and rg(Yi) denote the ranking of
firm i’s RTS using the random-effect estimation. Then the Spearman correlation coefficient ρs can be
computed using the formula:
rs = 1− 6∑d2i
n(n2 − 1),
where di = rg(Xi)− rg(Yi), is the difference between the two ranks of each observation and n is the
number of observations.
A Spearman correlation of zero indicates that there is no tendency for a variable to either increase
or decrease when the other one increases. The Spearman correlation increases in magnitude as the
two variables become closer to being perfect monotone functions of each other.
5 The Main Results
To start, Tables 9 and 10 present our estimated results. We also present the scale reduction factor
(SRF) and simulation inefficiency factor (SIF) for each coefficient, and the deviance information
criterion (DIC) for the model. The first two factors help us check the convergence of MCMC, while
the last factor helps us choose which production function is more appropriate for our analysis. For
brevity, we only present the estimation results for Sectors 18 and 36. We have made sure of the
convergence by using SRF and SIF across all sectors and a similar result holds. The estimation
results for the other sectors are available upon request. As shown in the tables, SRF and SIF show
good convergence in our results across sectors. Furthermore, we also check convergence by visually
checking the trace, mean, and density plots (see Figure 1).
Table 2 presents the estimated results for the efficiency scores.14 Figure 2 presents a scatterplot of
the efficiency scores computed using the SF method for some of our sample industries for the entire13For a more detailed discussion, see Caves et al. (1982) or Ch. 5 in Fare and Grosskopf (1994).14The figures for the other sectors are available upon request.
13
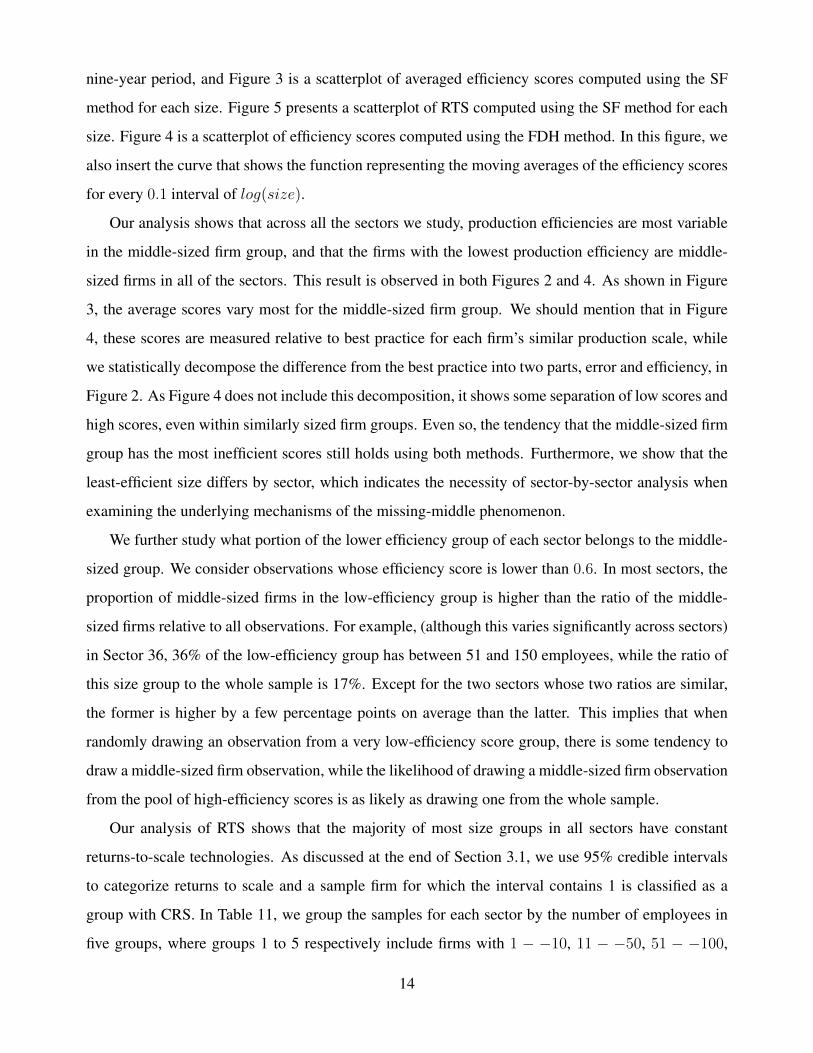
nine-year period, and Figure 3 is a scatterplot of averaged efficiency scores computed using the SF
method for each size. Figure 5 presents a scatterplot of RTS computed using the SF method for each
size. Figure 4 is a scatterplot of efficiency scores computed using the FDH method. In this figure, we
also insert the curve that shows the function representing the moving averages of the efficiency scores
for every 0.1 interval of log(size).
Our analysis shows that across all the sectors we study, production efficiencies are most variable
in the middle-sized firm group, and that the firms with the lowest production efficiency are middle-
sized firms in all of the sectors. This result is observed in both Figures 2 and 4. As shown in Figure
3, the average scores vary most for the middle-sized firm group. We should mention that in Figure
4, these scores are measured relative to best practice for each firm’s similar production scale, while
we statistically decompose the difference from the best practice into two parts, error and efficiency, in
Figure 2. As Figure 4 does not include this decomposition, it shows some separation of low scores and
high scores, even within similarly sized firm groups. Even so, the tendency that the middle-sized firm
group has the most inefficient scores still holds using both methods. Furthermore, we show that the
least-efficient size differs by sector, which indicates the necessity of sector-by-sector analysis when
examining the underlying mechanisms of the missing-middle phenomenon.
We further study what portion of the lower efficiency group of each sector belongs to the middle-
sized group. We consider observations whose efficiency score is lower than 0.6. In most sectors, the
proportion of middle-sized firms in the low-efficiency group is higher than the ratio of the middle-
sized firms relative to all observations. For example, (although this varies significantly across sectors)
in Sector 36, 36% of the low-efficiency group has between 51 and 150 employees, while the ratio of
this size group to the whole sample is 17%. Except for the two sectors whose two ratios are similar,
the former is higher by a few percentage points on average than the latter. This implies that when
randomly drawing an observation from a very low-efficiency score group, there is some tendency to
draw a middle-sized firm observation, while the likelihood of drawing a middle-sized firm observation
from the pool of high-efficiency scores is as likely as drawing one from the whole sample.
Our analysis of RTS shows that the majority of most size groups in all sectors have constant
returns-to-scale technologies. As discussed at the end of Section 3.1, we use 95% credible intervals
to categorize returns to scale and a sample firm for which the interval contains 1 is classified as a
group with CRS. In Table 11, we group the samples for each sector by the number of employees in
five groups, where groups 1 to 5 respectively include firms with 1 − −10, 11 − −50, 51 − −100,
14

Table 5: % Difference in Spearman Coefficient for Each Group
Sector G1 G2 G3 G4 G5 Total
Sector 18 0.4891 0.0898 0.2458 0.3297 0.1632 0.1810
Sector 20 0.3616 0.2858 0.3372 0.3671 0.3646 0.3298
Sector 26 0.0072 0.2592 0.1464 0.1235 0.1477 0.1795
Sector 28 0.1306 0.1470 0.2032 0.4130 0.2818 0.2053
Sector 36 -0.2463 0.2781 0.1573 0.1509 0.1008 0.1352
101−−200, and 201 or more employees.
The differences in technologies are more striking in Table 5. This table presents how different each
group’s Spearman coefficient is, compared with the one for the whole sector. In this analysis, G1 or
G2 tend to show lower coefficients than for the overall sample or other groups. This shows that these
groups tend to have more heterogenous technologies among them. Moreover, our results show that
there is a significant heterogeneity in firms’ technologies. This also justifies our methodology of using
a random coefficient stochastic frontier approach, which considers firms’ technological heterogeneity.
In summary, our analysis so far indicates that the middle-sized group is a ‘mixed bag’ where
firms with very high and very low production efficiencies coexist. This shows a possible risk for a
small-sized firm’s expanding the business. Meanwhile, there is a significant heterogeneity in firms’
technologies across different size groups. The heterogeneity in technologies may make a small-sized
firm to clearly predict how their expansion of size would result in, because even if some firm succeeds
in expanding, the firm’s technologies are different. We would not know how the heterogeneity of
technologies affect the future productivity of the firm. Although our analysis is a snapshot of the
Vietnamese manufacturing industry, the diverse production efficiencies in the middle-sized groups
can be thought of as a risk that small-sized firms would face in expanding their businesses.
6 Further Examination of the Results
6.1 Further Robustness Checks
Furthermore, to check the robustness of the findings in this analysis, we also measure the efficiency
of production using a nonparametric method, which imposes no or only very limited assumptions on
15

the data. In addition, we also conduct the same analysis by using Cobb–Douglas functions and by
using the data of firms that have more than two observations. Finally, we have also conducted the
same analysis using a half-normal distribution function instead of an exponential distribution for the
efficiency terms.
The following results still hold in these analyses of different settings.
• The efficiency is most diverse in the middle-sized firms across sectors.
• The lowest efficiency firms belong to the middle-sized groups.
• The majority of firms show constant returns-to-scale technologies.
6.2 A Cobb–Douglas Production Function
As we mentioned in Footnote 6, we started with 14 sectors that have more than 200 observations in
each year, so that we can ensure the robustness of the empirical results. Based on the convergence cri-
terion for the MCMC procedure, we have chosen 5 sectors in Table 1 for the translog production func-
tions analyses as in the previous section and we also conduct similar analyses using Cobb–Douglas
production functions for the other 9 sectors, which are found in Table 6. The above-mentioned results
still hold.
Table 6: ISIC Codes and Industry Description
ISIC Industry Description ISIC Industry Description14 Other mining and quarrying 15 Food products and beverages17 Textiles 19 Tanning and dressing leather21 Paper and paper products 22 Publishing, printing, etc.24 Chemical products, etc. 25 Rubber and plastic products29 Machinery and equipment, etc.
6.3 Locations and Ownership of Firms
In this section, we group firms based on their locations and ownership types and study whether our
findings are still robust. The results suggest are findings are robust. The groups of locations we
consider consist of nine groups: northern midland and mountainous area, Red River delta, north
central coast, south central coast, central highlands, southeast area, Mekong River delta, Hanoi, and
16

Ho Chi Minh City. The ownership types we consider are the following three types: state-owned firms,
private firms, foreign firms.
As presented in Figures 6 and 7, for the middle-sized groups, the efficiency scores are relatively
diversified across firms and regions, and different ownership types still remain. Table 12 presents
the means and variances of the efficiency scores for each size group in Sector 36. It varies across
ownership types, although the middle-sized groups tend to have higher variances. We further study
whether a higher variance is caused by a larger number of firms. Although it also depends on the
sector, in the groups of state-owned firms, across sectors, a size group with a higher number of firms
tends to have a higher variance, while in the groups of foreign firms, a size group with a higher number
of firms tends to have a smaller variance.
6.4 Nonparametric Estimation: FDH
Pham and Takayama (2015) measures the efficiency of production using a nonparametric method
called free-disposal hull (hereafter, FDH). The results in their paper support our findings. Here, we
briefly discuss their method and summarize the results so that we can see how robust our findings are
across different methodologies of estimating efficiency scores.
Suppose there are L industrial sectors in the economy. Take a sector l ∈ 1, · · · , L where inputs
x ∈ IR3+ are used to produce an output y ∈ IR+. Let N l denote the number of firms in Sector l of
the dataset. Firm i’s input and output combination is called a productive unit, denoted by (xi, yi) with
xi ∈ IR3+ and yi ∈ IR+. The efficiency score for a productive unit (xi, yi) is defined by:
E(xi, yi) = infθθ : (θxi, yi) ∈ Ψl, (14)
where the production set is given by: for some λ = λi with∑n
i=1 λi = 1 and λi ∈ IR+ for every i,
Ψl = (x, y) : x ≥N l∑i=1
λixi, y ≤N l∑i=1
λiyi. (15)
The efficiency score is the distance between the observed quantity of inputs and outputs, and
the quantity of inputs and outputs at the production possibility frontier, which is the best possible
outcome for a firm in its cluster (industry). The efficiency score15 lies between 0 and 1, and represents
15This is called the “input-oriented” efficiency score. There is an alternative in the form of the “output-oriented”
efficiency score. In this analysis, we use the input-oriented efficiency score because the results do not change substantially.
17

the minimal proportional reduction of all inputs while maintaining the same output level within the
production set. Solving Problem (14) requires constructing the production set. Hence, by using the
data, and through linear programming, we need to calculate λs so that the assumptions required by
each method are satisfied. The FDH approach does not require the convexity of the production set.
Table 4 provides the distributions of the efficiency scores through this method.16 As we see, the
middle-sized firms are a ‘mixed bag’. Furthermore, there are many middle-sized firms with the lowest
efficiency scores.
7 Concluding Remarks
In this paper, we focused on the relationship between firm size and production efficiency using Viet-
namese data. Using a recently developed stochastic frontier approach and data from Vietnam, our
analysis has shown that across all the sectors we studied, production efficiencies are most variable
among middle-sized firms, most large-sized firms tend to exhibit constant returns-to-scale technolo-
gies, and middle-sized firms tend to have the lowest production efficiency. Furthermore, we have
shown that the least efficient size differs across sectors, which indicates the necessity of sector-by-
sector analyses when considering the underlying mechanism for the missing-middle phenomenon,
which refers to the feature that most employment in developing countries is located in either small-
or large-sized firms.17 Moreover, the heterogeneity of firm size at the bottom of the U-shaped curve
across industries indicates the importance of sector-level analysis in investigating the missing middle.
Our analysis also contributes in this regard.
Needless to say, one might question whether our findings from a transition economy—namely,
Vietnam—provide a sufficient basis for generalization, particularly because much of the missing mid-
dle literature concerns Africa. Business environments and their features vary substantially from coun-
try to country. It would then be interesting to see if we observe a similar feature in a different country.
Several interesting future research paths follow from our analysis. A next step is to conduct a
similar analysis using data from developed countries to measure production efficiency and to com-16In this paper, we use the R-package FEAR (see Wilson, 2008) to compute the scores.17In the literature, there has been an increasing interest in the relationship between firm size and other characteristics,
such as innovation and market structure (see Acs and Audretsch, 1987), growth and productivity (see Bentzen et al., 2011),
and job creation (see Dalton et al., 2011). However, few empirical studies consider the relationship between firm size and
the level of efficiency, particularly in a developing country context. Also, in preceding works, large firms are found to be
the most efficient (see Angelini and Generate, 2008; Leung et al., 2008).
18

pare the results for Vietnam. If we still observe lower productivity for middle-sized firms, we could
then consider the cause. If we only observe this U-shaped pattern in developing countries, we could
examine the reasons that this pattern exists in developing countries, but not developed countries.
Finally, it would be very interesting and important to study the causes of these differences in
productivity across different firm sizes in developing countries. OECD Publishing (2013) reports two
main reasons for the differences in productivity across different firm sizes: (i) firm size matters for
productivity, and (ii) structural differences in the industrial composition of economies influence the
relative performance of large and small firms across countries. First, in most countries, there is the
possibility for improving production efficiency by increasing firm size. Larger firms are on average
more productive than smaller ones, and this generally holds for all industries. Second, in countries
with large industrial sectors and relatively low per capita income, large firms are, on average, 2–3
times as productive as small firms. However, in countries with large service sectors and relatively
high income per capita, small firms are often more productive than large firms. It would be interesting
to investigate whether these factors are also important in developing countries.
19

List of Tables and Figures
Table 7: Summary of Enterprise Census Data Statistics (Firm Size)
Size Capital Material
Sector # Observations Mean Median St. Dev. Mean Median St. Dev. Mean Median St. Dev.
Sector 18 3181 674.59 330.00 1030.94 6770.87 2199.87 49571.76 21614.99 6380.57 49571.76
Sector 20 3261 110.72 35.00 228.37 881.06 194.01 19669.44 6385.77 1219.79 19669.44
Sector 26 5543 190.69 80.00 353.33 2297.49 535.73 219330.93 38622.39 2525.31 219330.93
Sector 28 4041 103.66 33.00 219.02 1379.89 299.78 48581.66 17672.86 2554.10 48581.66
Sector 36 2846 341.42 132.00 634.71 3830.20 1108.38 50102.10 21685.72 5418.01 50102.10
1 Size measured using the number of employees.2 Capital and Material are listed in the home currency (inflation adjusted).3 St. Dev. is standard deviation.
20

Table 8: Summary of Enterprise Census Data Statistics (Number of Observations and Firms)
Year Total Sec 18 Sec 20 Sec 26 Sec 28 Sec 36
2000 1513 267 259 561 250 176
2001 2092 357 373 688 399 275
2002 2061 353 364 670 401 273
2003 2078 345 367 684 401 281
2004 1972 341 337 639 386 269
2005 2292 380 391 577 551 393
2006 2292 379 391 577 551 394
2007 2290 380 390 575 551 394
2008 2282 379 389 572 551 391
# Total 18872 3181 3261 5543 4041 2846
# Firms 743 773 1277 962 679
Note: Figures except for the last row are the number of observations
in each sector for each industry in each year. The last row shows the
total number of firms in each sector.
21

Table 9: Sector 18
a0 b1 b2 b3 b11 b12 b13 b21 b22 b23 b31 b32 b33 σt σtt
-0.127 0.678 0.210 0.145 0.165 -0.107 -0.029 0.120 -0.007 0.027 0.023 -0.003 -0.010 0.005 -0.006
95%
CI
-0.845 0.395 -0.129 0.039 -0.101 -0.331 -0.139 -0.146 -0.101 -0.017 -0.200 -0.041 -0.062 -0.029 -0.025
0.594 0.958 0.549 0.251 0.430 0.117 0.085 0.391 0.085 0.070 0.252 0.036 0.041 0.040 0.013
SRF∗ 1.021 1.067 1.022 1.006 1.023 1.000 1.001 1.004 1.000 1.000 1.017 1.002 1.051 1.009 1.007
SIF† 34.764 37.138 34.235 34.069 36.460 34.045 33.211 30.809 28.696 27.142 27.735 22.919 35.215 33.410 33.911
DIC‡ -1459.12
Table 10: Sector 36
a0 b1 b2 b3 b11 b12 b13 b21 b22 b23 b31 b32 b33 σt σtt
-0.100 0.580 0.348 0.082 0.148 -0.121 -0.015 0.141 -0.025 0.039 0.040 -0.004 0.009 -0.016 0.002
95%
CI
-0.814 0.036 -0.293 -0.224 0.032 -0.254 -0.096 -0.045 -0.085 -0.020 -0.207 -0.052 -0.047 -0.095 -0.032
0.605 1.129 0.973 0.387 0.255 0.015 0.066 0.323 0.037 0.100 0.297 0.044 0.064 0.065 0.036
SRF∗ 1.005 1.001 1.007 1.013 1.018 1.056 1.006 1.048 1.002 1.029 1.002 1.001 1.014 1.019 1.003
SIF† 32.583 41.173 36.548 30.901 32.577 32.058 32.540 31.786 31.029 27.396 27.276 25.596 38.132 33.630 29.479
DIC‡ -2346.54
Note: ∗ SRF is Scale Reduction Factor; † SIF is simulation inefficiency factor; ‡ DIC is deviance information criterion.
22

Figure 1: Trace Plots, Density Plots and Mean Plot of Parameters for Sector 36
b1 Wage b2 Capital b3 Material
b1 Wage b2 Capital b3 Material Mean Plots
23

Figure 2: Distribution of SF Efficiency Scores across Different Firm Sizes
Sector 18
Firm size
Sector 20
Firm size
Sector 26
Firm size
Sector 28
Firm size
Sector 36
Firm size
24

Figure 3: Distribution of Average Efficiency Scores across Different Firm Sizes
Sector 18
Firm size
Sector 20
Firm size
Sector 26
Firm size
Sector 28
Firm size
Sector 36
Firm size
25

Figure 4: Distribution of FDH Efficiency Scores across Different Firm Sizes
Sector 18
Firm size
Sector 20
Firm size
Sector 26
Firm size
Sector 28
Firm size
Sector 36
Firm size
Note: The curve represents the smooth trend line of the efficiency scores for every 0.1 interval of log(size). We use Matlab’s smooth
command. This inserts a smooth trend line using the local regression method.
26

Figure 5: Distribution of RTS across Different Sizes
RT
S
Sector 18
Firm size
Sector 20
Firm size
Sector 26
Firm size
Sector 28
Firm size
Sector 36
Firm size
27

Table 11: Distribution of RTS across Different Firm Sizes
(%) IRS DRS CRS
G1 0.00 0.00 100.00
G2 2.02 3.03 94.95
G3 0.00 2.99 97.01
G4 0.00 8.89 91.11
G5 2.37 4.53 93.10
Sector 18
(%) IRS DRS CRS
G1 1.67 16.67 81.67
G2 1.22 10.09 88.69
G3 2.59 9.48 87.93
G4 2.00 16.00 82.00
G5 0.91 14.55 84.55
Sector 20
(%) IRS DRS CRS
G1 3.45 3.45 93.10
G2 2.30 1.84 95.85
G3 4.15 3.23 92.63
G4 3.27 0.47 96.26
G5 2.26 2.54 95.20
Sector 26
(%) IRS DRS CRS
G1 3.36 6.72 89.92
G2 1.52 5.84 92.64
G3 3.38 8.78 87.84
G4 1.65 4.13 94.21
G5 2.68 8.93 88.39
Sector 28
(%) IRS DRS CRS
G1 3.03 3.03 93.94
G2 3.35 5.59 91.06
G3 5.41 4.05 90.54
G4 6.73 6.73 86.54
G5 3.11 5.19 91.70
Sector 36
Note: G1, G2, G3, G4, and G5 indicate firms with 1−−10, 11−−50, 51−−100, 101−−200, and 201 or more employees, respectively.
28

Figure 6: Efficiency and Ownership in Sector 36
State owned
Firm size
Private
Firm size
Foreign
Firm size
Table 12: Mean and Variance of Efficiency Scores across Different Firm Sizes
Mean Variance Samples
G1 0.7738 0.0153 233
G2 0.7844 0.0168 741
G3 0.7973 0.0133 336
G4 0.7992 0.0147 420
G5 0.8103 0.0094 1059
Total 0.7970 0.0133 2789
All Samples
Mean Variance Samples
0.7791 0.0150 71
0.7809 0.0180 237
0.8055 0.0073 99
0.8017 0.0140 108
0.8194 0.0074 329
0.8013 0.0121 844
State-Owned
Mean Variance Samples
0.7768 0.0145 156
0.7848 0.0158 421
0.7917 0.0140 139
0.7988 0.0144 157
0.7991 0.0110 308
0.7901 0.0140 1181
Private
Mean Variance Samples
0.8064 0.0050 6
0.7882 0.0214 83
0.7956 0.0177 98
0.7970 0.0162 155
0.8123 0.0098 422
0.8044 0.0133 764
Foreign
Note: G1, G2, G3, G4, and G5 indicate firms with 1−−10, 11−−50, 51−−100, 101−−200, and 201 or more employees, respectively.
29

Figure 7: Efficiency and Locations in Sector 36
Location 1
Firm size
Location 2
Firm size
Location 3
Firm size
Location 4
Firm size
Location 5
Firm size
Location 6
Firm size
Location 7
Firm size
Location 8
Firm size
Location 9
Firm size
Note: Location 1 - northern midland and mountainous area; Location 2 - Red River delta; Location 3 - north central coast; Location 4 -
south central coast; Location 5 - central highlands; Location 6 - southeast area; Location 7 - Mekong River delta; Location 8 - Hanoi;
Location 9 - Ho Chi Minh City.
30

References
Acs, Zoltan J. and David B. Audretsch, “Innovation, marketstructures, and firm size,” Review of
Economics and Statistics, 1987, 69, 567–74.
Aigner, D. J., C. A. K. Lovell, and P. Schmidt, “Formulation and estimation of stochastic frontier
production functions,” Journal of Econometrics, 1977, 6, 21–37.
Angelini, P. and A. Generate, “On the evolution of firm size distribution,” American Economic
Review, 2008, 98, 426–438.
Anh, Nguyen Thi Tue, Luu Minh Duc, and Trinh Duc Chieu, “The Evolution of Vietnamese
Industry,” WIDER Working Paper, 2014, 2014/76.
Banerjee, Abhijit V. and Esther Duflo, “Growth theory through the lens of development economics,”
in Philippe Aghion and Steven Durlauf, eds., Handbook of Economic Growth, Vol. 1a, Amsterdam:
Elsevier, 2005, chapter 7, pp. 473–552.
Basu, S. and J. G. Fernald, “Returns to scale in U.S. production: estimates and implications,” Jour-
nal of Political Economy, 1997, 105 (2), 249–283.
Bentzen, J., E. S. Madsen, and V. Smith, “Do firms’ growth rates depend on firm size?,” Small
Business Economics, 2011, 39 (4), 937–47.
Bos, J., M. Koetter, J. Kolari, and C. Kool, “Effects of heterogeneity on bank efficiency scores,”
European Journal of Operational Research, 2009, 195, 251261.
Caves, Douglas W, Laurits R Christensen, and Walter Diewert, “The economic theory of index
numbers and the measurement of input, output, and productivity,” Econometrica, 1982, 50 (6),
1393–1414.
Caves, R. E. and D. R. Barton, “Efficiency in U.S. manufacturing industries,” Cambridge, MA: MIT
Press., 1990.
Crosato, L., S. Destefanis, and P. Ganugi, “Firms size distribution and returns to scale. Non-
parametric frontier estimates from Italian manufacturing,” in A.M. Ferragina, E. Taymaz, and
K. Yilmaz, eds., Innovation, globalization and firm dynamics lessons for enterprise policy,
Rouledge, London, 2009, pp. 71–94.
Dalton, Sherry, Erik Friesenhahn, James Spletzer, and David Talan, “Employment growth by
size class: firm and establishment data,” Monthly Labor Review, 2011, 134, 3–24.
Diaz, M. A. and R. Sanchez, “Firm size and productivity in Spain: a stochastic frontier analysis,”
31

Small Business Economics, 2008, 30, 315–323.
Diewert, W. Erwin, Takanobu Nakajima, Alice Nakamura, Emi Nakamura, and Masao Naka-
mura, “Returns to scale: concept, estimation and analysis of Japan’s turbulent 1964-88 economy,”
Canadian Journal of Economics, 2011, 44 (2), 451–485.
Doraszelski, Ulrich, “Measuring returns to scale in nineteenth-century French industry,” Explo-
rations in Economic History, 2004, 41, 256–281.
Fare, Rolf and S. Grosskopf, Cost and revenue constrained production, New York: Springer Verlag,
1994.
Feng, Guohua and Xiaohui Zhang, “Returns to scale at large banks in the US: A random coefficient
stochastic frontier approach,” Journal of Banking & Finance, 2014, 39 (C), 135–145.
Freeman, Jonathan B. and Rick Dale, “Assessing bimodality to detect the presence of a dual cog-
nitive process,” Behavioral Research Methods, 2013, 45 (1), 83–97.
Greene, A. and D. G. Mayes, “Technical efficiency in manufacturing industries,” The Economic
Journal, 1991, 101, 523538.
and , “Distinguishing between heterogeneity and inefficiency: Stochastic frontier analysis of
the World Health Organizations panel data on national health care systemses,” Health Economicsl,
2004, 13, 959980.
Greene, W.H., The econometric approach to efficiency analysis. In: Fried, H.O. The Measurement of
Productive Efficiency and Productivity Change., Lovell, C.A.K., Schmidt, S.S. (Eds.), , New York:
Oxford University Press., 2008.
Hartigan, J.A. and P. M. Hartigan, “The Dip test of unimodality,” The Annals of Statistics, 1985,
13 (1), 70–84.
Hsieh, Chang-Tai and Benjamin A. Olken, “The missing “missing middle”,” Journal of Economic
Perspectives, 2014, 28 (3), 89–108.
and Peter J. Klenow, “Misallocation and Manufacturing TFP in China and India,” Quarterly
Journal of Economics, 2009, 124 (4), 1403–48.
Johannes, V. B., “Firm size matters: growth and productivity growth in African manufacturing,”
University of Chicago Press, 2005, 53 (3), 651–672.
Kalirajan, K.P. and R.T. Shand, “Modelling and measuring economic efficiency under risk,” Indian
Journal of Agricultural Economics, 1994, 49, 579–90.
Katayama, Hajime, Shihua Lu, and James R. Tybout, “Firm level productivity studies: illusions
32

and a solution,” International Journal of Industrial Organization, 2009, 27, 403–413.
Klette, T. and Z. Griliches, “The inconsistency of common scale estimators when output prices are
unobserved and endogenous,” Journal of Applied Econometric, 1996, 11, 343–361.
Knapp, Thomas R., “Bimodality Revisited,” Journal of Modern Applied Statistics Methods, 2007,
6, 8–20.
Kumbhakar, S. and C. Lovell, “Stochastic Frontier Analysis,” New York: Cambridge University
Press, 2000, 3.
Leibenstein, Harvey, “Allocative efficiency vs. “X-efficiency”,” American Economic Review, 1966,
56 (3), 392–415.
Leung, D., C. Meh, and Y. Terajima, “Productivity in Canada: does firm size matter?,” Bank of
Canada Review, 2008, 1.
Liedholm, Carl and Donald C. Mead, “Small Scale Industries in Developing Countries: Empirical
Evidence and Policy Implications,” Technical Report, Michigan State University, Department of
Agricultural, Food, and Resource Economics 1987.
Little, I.M., D. Mazumdar, and J.M. Page Jr, “Small manufacturing enterprises: a comperative
analysis of India and other economies,” Technical Report 10118, A World Bank research publica-
tion 1987.
Loecker, Jan De, “Product differentiation, multiproduct firms, and estimating the impact of trade
liberalization on productivity,” Econometrica, 2011, 79.
and Frederic Michel Patrick Warzynski, “Markups and firm-level export status,” American Eco-
nomic Review, 2012, 102.
, Pinelopi K. Goldberg, Amit K. Khandelwal, and Nina Pavcnik, “Prices, markups and trade
reform,” Econometrica, 2015.
Meeusen, W. and J. van den Broeck, “Effciency estimation from Cobb-Douglas production func-
tions with composed error,” International Economic Review, 1977, 18, 435–444.
Miller, Stephen M. and Athanasios G. Noulas, “The technical efficiency of large bank production,”
Journal of Banking & Finance, 1996, 20, 495–509.
O’Donnell, Christopher J. and Timothy J. Coelli, “A Bayesian approach to imposing curvature on
distance functions,” Journal of Econometrics, 2005, 126, 493–523.
OECD Publishing, “Enterpreneurship at a glance 2013,” 2013. OECD.
Orea, Luis, “Parametric decomposition of a generalized malmquist productivity index,” Journal of
33

Productivity Analysis, 2002, 18 (1), 5–22.
Pham, Hien Thu and Shino Takayama, “Revisiting the Missing Middle: Production and Corrup-
tion,” CEPA Working Paper Series, 2015, No. WP02/2015.
and , “Revisiting the “Missing Middle”: Productivity Analysis,” Working Paper, 2017.
Ray, S. C., Data envelopment analysis, Cambridge, United Kingdom: Cambridge University Press,
2004.
SAS Institute Inc., “SAS/STAT user’s guide 9.2,” 2008. Cary, NC: SAS Institute.
Steel, W. F. and L. M. Webster, “How small enterprises in Ghana have responded to adjustment,”
World Bank Economic Review, 1992, 6, 423–438.
Tsionas, E.G., “Stochastic frontier models with random coefficients,” Journal of Applied Economet-
rics, 2002, 17, 127–147.
Tybout, James R., “Manufacturing firms in developing countries: How well do they and why?,”
Journal of Economic Literature, 2000, 38, 11–44.
, “Correspondence,” Journal of Economic Perspectives, 2014, 28 (4), 235–236.
, “The missing middle, revisited,” 2014. mimeo.
Wilson, Paul W., “FEAR 1.0: A software package for frontier efficiency analysis with R,” Socio-
Economic Planning Sciences, 2008, 42, 247–254.
34


