fires in the Central Western State of São over ... · ÓPTICA PURA Y APLICADA. . Opt. Pura Apl. 44
9
ÓPTICA PURA Y APLICADA. www.sedoptica.es Opt. Pura Apl. 44 (1) 83‐91 (2011) ‐ 83 ‐ © Sociedad Española de Óptica Sección Especial / Special Section: V Workshop on Lidar Measurements in Latin America Emissions from sugar cane fires in the Central & Western State of São Paulo and aerosol layers over metropolitan São Paulo observed by IPEN´s lidar: Is there a connection? Gerhard Held (1,*) , Eduardo Landulfo (2) , Fabio J. S. Lopes (2) , Joaquim Arteta (3,4) , Virginie Marecal (3) and José Marcio Bassan (1) 1. Instituto de Pesquisas Meteorológicas, Universidade Estadual Paulista, Bauru, S.P., Brazil. 2. Instituto de Pesquisas Energéticas e Nucleares, Universidade São Paulo, São Paulo, Brazil. 3. Laboratoire de Physique et Chimie de l’Environnement et de l’Espace, CNRS, Université d’Orleans, France. 4. Current affiliation: CNRM/GAME/CARMA, Meteo‐France, Toulouse, France. (*) Email: [email protected] S: miembro de SEDOPTICA / SEDOPTICA member Recibido / Received: 16/11/2010. Versión revisada / revised versión: 01/03/2011. Aceptado / Accepted: 02/03/2011 REFERENCES AND LINKS [1] A. Stohl, “The FLEXTRA Trajectory Model, Version 3.0: User Guide”. Lehrstuhl für Bioklimatologie und Immissionsforschung, University of Munich, Freising, Germany (1999). Available from: http://www.forst.uni‐muenchen.de/LST/METEOR/stohl/flextra.htm . [2] G. Held, A. M. Gomes, R. V. Calheiros, Instituto de Pesquisas Meteorológicas (IPMet): Serviços para a Sociedade no Estado de São Paulo. Boletim da SBMET, 32, n.1, 27‐33, (2008). [3] E. Landulfo, A. Papayannis, P. Artaxo, A.D.A. Castanho, A.Z. de Freitas, R.F. Souza, N.D. Vieira Junior, M. P. M. P. Jorge, O. R. Sánchez‐Ccoyllo, D. S. Moreira, “Synergetic measurements of aerosols over São Paulo, Brazil using LIDAR, sunphotometer and satellite data during the dry season”, Atmos. Chem. Phys. 3, 1523‐1539 (2003). [4] A. Stohl, G. Wotawa, P. Seibert, H. Kromp‐Kolb, “Interpolation errors in wind fields as a function of spatial and temporal resolution and their impact on different types of kinematic trajectories”, J. Appl. Meteorol. 34, 2149‐2165 (1995). ABSTRACT: The central and western parts of the State of São Paulo are well‐known for vast sugar cane plantations, which during the harvest time are traditionally burnt about 12 hours before manual cutting. This procedure causes the release of large quantities of aerosols and a variety of gases, which can be observed by IPMet’s radars, located in Bauru and Presidente Prudente, on days with no or little rain. Depending on the distance of these plumes from the radar, they can be detected up to 5 km amsl or more, and are subsequently being transported by winds to other regions. During the dry winter season of 2008, such plumes, attributed to cane fires, were frequently observed by IPMet’s radars and documented in terms of radar reflectivity, time and location during the period 10 th – 21 st July 2008. At the same time, IPEN’s Elastic Backscatter Lidar in São Paulo observed layers of aerosols of variable strength and heights above the city. The most significant days, viz. 14 and 15 July 2008 had been selected for calculating backward, as well as forward trajectories, deploying the European Flextra 3.3 Trajectory Model, which was initiated with ECMWF historic data with a 0,25º×0,25º grid spacing. The results presented here show an excellent match between the radar‐detected sources of the plumes on 11 th July 2008 in the central parts of the State and the observations by IPEN’s Lidar over Metropolitan São Paulo on 14 th July 2008, both in terms of forward and backward trajectories, as well as their heights, with a transport duration of approximately 70 hours under the prevailing meteorological conditions. Key words: Sugar Cane Fires, Radar Observations, Elastic Backscatter Lidar, Aerosol Trajectories, Flextra 3.3 Trajectory Model, State of São Paulo, Brazil..
Transcript of fires in the Central Western State of São over ... · ÓPTICA PURA Y APLICADA. . Opt. Pura Apl. 44

ÓPTICA PURA Y APLICADA. www.sedoptica.es
Opt. Pura Apl. 44 (1) 83‐91 (2011) ‐ 83 ‐ © Sociedad Española de Óptica
Sección Especial / Special Section: V Workshop on Lidar Measurements in Latin America
Emissions from sugar cane fires in the Central & Western State of São Paulo and aerosol layers over metropolitan São Paulo observed by
IPEN´s lidar: Is there a connection?
Gerhard Held(1,*), Eduardo Landulfo(2), Fabio J. S. Lopes(2), Joaquim Arteta(3,4),
Virginie Marecal(3) and José Marcio Bassan(1)
1. Instituto de Pesquisas Meteorológicas, Universidade Estadual Paulista, Bauru, S.P., Brazil.
2. Instituto de Pesquisas Energéticas e Nucleares, Universidade São Paulo, São Paulo, Brazil.
3. Laboratoire de Physique et Chimie de l’Environnement et de l’Espace, CNRS, Université d’Orleans, France.
4. Current affiliation: CNRM/GAME/CARMA, Meteo‐France, Toulouse, France.
(*) Email: [email protected] S: miembro de SEDOPTICA / SEDOPTICA member
Recibido / Received: 16/11/2010. Versión revisada / revised versión: 01/03/2011. Aceptado / Accepted: 02/03/2011
REFERENCES AND LINKS
[1] A. Stohl, “The FLEXTRA Trajectory Model, Version 3.0: User Guide”. Lehrstuhl für Bioklimatologie und Immissionsforschung, University of Munich, Freising, Germany (1999). Available from: http://www.forst.uni‐muenchen.de/LST/METEOR/stohl/flextra.htm.
[2] G. Held, A. M. Gomes, R. V. Calheiros, Instituto de Pesquisas Meteorológicas (IPMet): Serviços para a Sociedade no Estado de São Paulo. Boletim da SBMET, 32, n.1, 27‐33, (2008).
[3] E. Landulfo, A. Papayannis, P. Artaxo, A.D.A. Castanho, A.Z. de Freitas, R.F. Souza, N.D. Vieira Junior, M. P. M. P. Jorge, O. R. Sánchez‐Ccoyllo, D. S. Moreira, “Synergetic measurements of aerosols over São Paulo, Brazil using LIDAR, sunphotometer and satellite data during the dry season”, Atmos. Chem. Phys. 3, 1523‐1539 (2003).
[4] A. Stohl, G. Wotawa, P. Seibert, H. Kromp‐Kolb, “Interpolation errors in wind fields as a function of spatial and temporal resolution and their impact on different types of kinematic trajectories”, J. Appl. Meteorol. 34, 2149‐2165 (1995).
ABSTRACT:
The central and western parts of the State of São Paulo are well‐known for vast sugar cane plantations, which during the harvest time are traditionally burnt about 12 hours before manual cutting. This procedure causes the release of large quantities of aerosols and a variety of gases, which can be observed by IPMet’s radars, located in Bauru and Presidente Prudente, on days with no or little rain. Depending on the distance of these plumes from the radar, they can be detected up to 5 km amsl or more, and are subsequently being transported by winds to other regions. During the dry winter season of 2008, such plumes, attributed to cane fires, were frequently observed by IPMet’s radars and documented in terms of radar reflectivity, time and location during the period 10th – 21st July 2008. At the same time, IPEN’s Elastic Backscatter Lidar in São Paulo observed layers of aerosols of variable strength and heights above the city. The most significant days, viz. 14 and 15 July 2008 had been selected for calculating backward, as well as forward trajectories, deploying the European Flextra 3.3 Trajectory Model, which was initiated with ECMWF historic data with a 0,25º×0,25º grid spacing. The results presented here show an excellent match between the radar‐detected sources of the plumes on 11th July 2008 in the central parts of the State and the observations by IPEN’s Lidar over Metropolitan São Paulo on 14th July 2008, both in terms of forward and backward trajectories, as well as their heights, with a transport duration of approximately 70 hours under the prevailing meteorological conditions.
Key words: Sugar Cane Fires, Radar Observations, Elastic Backscatter Lidar, Aerosol Trajectories, Flextra 3.3 Trajectory Model, State of São Paulo, Brazil..

ÓPTICA PURA Y APLICADA. www.sedoptica.es.
Opt. Pura Apl. 44 (1) 83‐91 (2011) ‐ 84 ‐ © Sociedad Española de Óptica
[5] S. Petterssen, Weather Analysis and Forecasting, pp 221–223, Mc‐Graw‐Hill Book Company, New York (1940).
[6] A. Stohl, N. E. Knoffi, “Evaluation of trajectories calculated from ECMWF data against constant volume balloon flights during ETEX”, Atmos. Environ. 24, 4151–4156 (1998).
[7] K. Baumann, A. Stohl, “Validation of a long‐range trajectory model using gas balloon tracks from the Gordon Bennett Cup 95”, J. Appl. Meteorol. 36, 711–720 (1997).
[8] A. Stohl, P. Seibert, “Accuracy of trajectories as determined from the conservation of meteorological tracers”, Q. J. Roy. Meteor. Soc. 124, 1465‐1484 (1998).
[9] Free R Software available at: http://www.r‐project.org/
[10] E. Landulfo, F. J. S. Lopes, G. L. Mariano, A. S. Torres, W. C. de Jesus, W. M. Nakaema, M. P. P. M Jorge, R. Mariani, “Study of the properties of aerosols and the air quality index using a backscatter lidar system and Aeronet sunphotometer in the city of São Paulo, Brazil”, J. Air Waste Manage. 60, 386–392 (2010).
1. Introduction
The central and western parts of the State of São
Paulo are well‐known for vast sugar cane
plantations, which during the harvest time
(approximately April – November) are
traditionally burnt about 12 hours before
manual cutting. This procedure causes the
release of large quantities of aerosols and a
variety of gases, which can be observed by
IPMet’s (Instituto de Pesquisas Meteorológicas)
radars, located in Bauru and Presidente
Prudente (Fig. 1), on days with no or little rain.
Depending on the temperature of these plumes,
surface winds and their distance from the radar,
they can be detected up to 5 km amsl (above
mean sea level) or more by the radars, but the
diluted plume certainly rises much higher than
that, and is subsequently being transported by
winds to other regions.
During the dry winter season of 2008, such
plumes, attributed to cane fires, were frequently
observed by IPMet’s radars and documented in
terms of radar reflectivity, time and location
during the period 10th – 21st July 2008. During
this period, IPEN’s Elastic Backscatter Lidar in
São Paulo observed layers of aerosols of variable
strength and heights above the city. The most
significant days, viz. 14th and 15th July 2008 had
been selected for calculating backward, as well
as forward trajectories. Initial attempts, using
locally available trajectory models, like HYSPLIT
and BRAMS, turned out to be unsuccessful,
possibly due to insufficient resolution or a
limited domain. Therefore, a joint project was
established during a technical visit in Orleans,
France, to run backward and forward
trajectories in collaboration with the
Laboratoire de Physique et Chimie de
l’Environnement et de l’Espace (LPC2E), CNRS
(Centre National de la Recherche Scientifique),
Université d’Orleans with the European Flextra
3.3 Trajectory model [1], using ECMWF historic
data.
Fig. 1. PMet’s Radar Network (PPR = Presidente Prudente; BRU = Bauru), showing 240 and 450 km range rings. The location of IPEN in São Palo is also shown.
2. Method and data
2.1 Radar
Figure 1 shows the range of the IPMet S‐band
Doppler radars, located in Bauru (Lat: 22°21’28”
S, Lon: 49°01’36” W, 624 m amsl) and in
Presidente Prudente, 240 km west of Bauru
(Lat: 22°10’30” S, Lon: 51°22’22” W, 460 m
amsl). Both have a 2° beam width and a range of
450 km for surveillance, but when operated in
volume‐scan mode every 7,5 minutes it is
limited to 240 km, with a resolution of 250 m
ÓPTICA PURA Y APLICADA. www.sedoptica.es.
Opt. Pura Apl. 44 (1) 83‐91 (2011) ‐ 85 ‐ © Sociedad Española de Óptica
radially and 1° in azimuth, recording
reflectivities and radial velocities [2]. The
reflectivity threshold for this study was set at
6 dBZ. Both radars have Sigmet processors and
run under the IRIS Operating System. Radar
images are presented as PPI (Plan Position
Indicator) or CAPPI (Constant Altitude PPI, 240
km range) either individually per radar or
merged.
2.2 IPEN’s aerosol lidar
The IPEN Elastic Backscatter Lidar System is
permanently installed in São Paulo and based on
the Campus of the University of São Paulo (Lat:
23°33’ S, Lon: 46°44’ W, 840 m amsl; Figure 1).
It comprises a commercial Nd:YAG laser
operating at the second harmonic frequency at
532 nm wavelength, with a repetition rate of 20
Hz and energy pulse as high as 100 mJ. The
optical receiver system consists of a Newtonian
telescope with a 30 cm diameter, a 1‐2 mrad of
field of view and 1.3 m focal length. The
backscatter laser radiation is detected by a
Hamamatsu R7400 photomultiplier coupled to
narrow band interferences filters with 1 nm
FWHM. The photomultiplier output signal is
digitalized and stored by a Lidar Transient
Recorder LR 20‐80/160 (LICEL‐GmBh) which
has an acquisition analog channel with 12 bits of
resolution at 40 MHz. The data are averaged
with a typical spatial resolution of 15 to 30 m. A
more detailed description is provided in [3].
2.3 Flextra trajectory model
The Lagrangian model FLEXTRA is a kinematic
trajectory model initially developed in at the
Universität für Bodenkultur in Vienna (Version
2; [4]) and later refined at the University Munich
(Version 3.3; [1]), to calculate different types of
forward and backward trajectories, specifically
for long time sequences for many receptor
locations. It was deployed to calculate three‐
dimensional 96‐ and 120‐hour backward and
forward trajectories. The FLEXTRA model uses
bicubic horizontal, quadratic vertical and linear
time interpolation to determine the three wind
components at a trajectory position and employs
the numerical method of Petterssen [5] for the
trajectory calculation. The model has been
validated with constant level balloon flights [6],
manned gas balloon flights [7] and
meteorological tracers [8].
The model was driven with wind fields
extracted from ECMWF (European Centre for
Medium‐Range Weather Forecasts) for a domain
from ‐180° to +180° longitude and ‐05° to ‐40°
latitude and 91 levels, every 6 hours, ensuring
sufficient boundary conditions for the
trajectories to be generated.
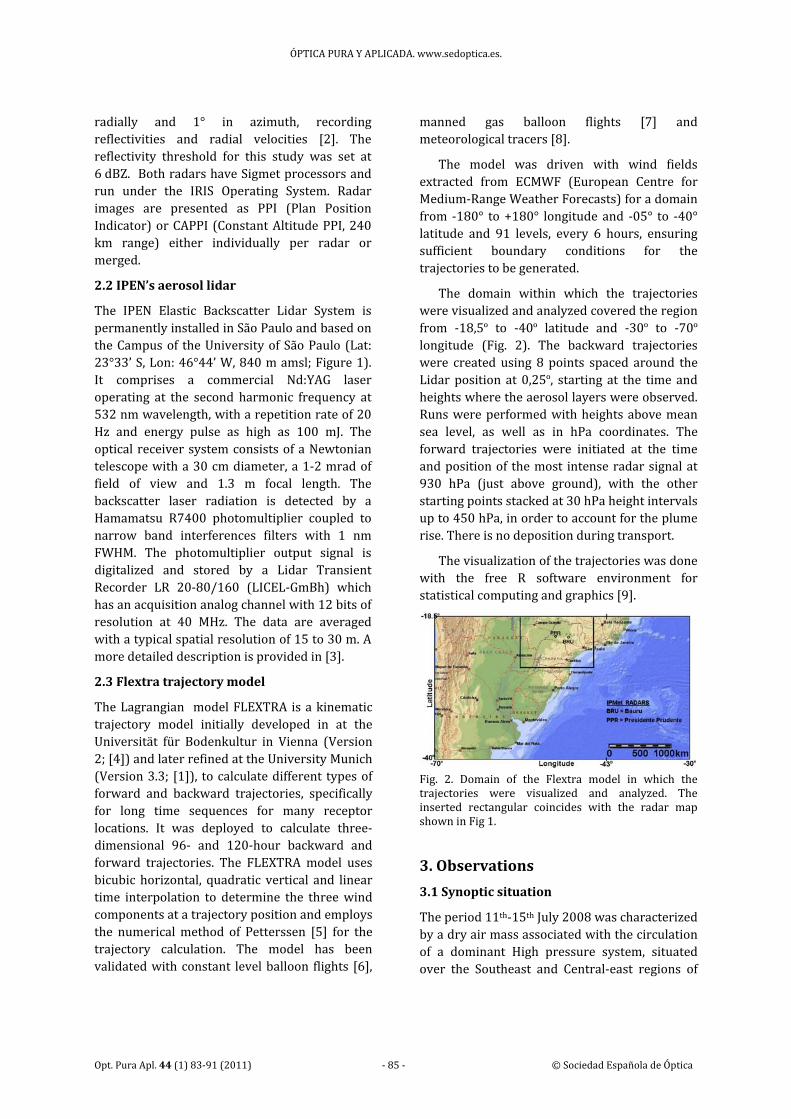
The domain within which the trajectories
were visualized and analyzed covered the region
from ‐18,5º to ‐40º latitude and ‐30º to ‐70º longitude (Fig. 2). The backward trajectories
were created using 8 points spaced around the
Lidar position at 0,25º, starting at the time and heights where the aerosol layers were observed.
Runs were performed with heights above mean
sea level, as well as in hPa coordinates. The
forward trajectories were initiated at the time
and position of the most intense radar signal at
930 hPa (just above ground), with the other
starting points stacked at 30 hPa height intervals
up to 450 hPa, in order to account for the plume
rise. There is no deposition during transport.
The visualization of the trajectories was done
with the free R software environment for
statistical computing and graphics [9].
Fig. 2. Domain of the Flextra model in which the trajectories were visualized and analyzed. The inserted rectangular coincides with the radar map shown in Fig 1.
3. Observations
3.1 Synoptic situation
The period 11th‐15th July 2008 was characterized
by a dry air mass associated with the circulation
of a dominant High pressure system, situated
over the Southeast and Central‐east regions of

ÓPTICA PURA Y APLICADA. www.sedoptica.es.
Opt. Pura Apl. 44 (1) 83‐91 (2011) ‐ 86 ‐ © Sociedad Española de Óptica
Brazil, thus preventing the formation of clouds,
as illustrated by the GOES‐10 images in Fig. 3.
3.2 Lidar observations
IPEN’s Lidar in São Paulo was operated
intermittently between 10th and 21st July 2008,
but the most significant observations were
recorded on 14th and 15th July, which were
thought to have been caused by sugar cane fire
plumes from the interior of the State (Fig. 4).
The heavy urban pollution / aerosol load can
be seen in the layers up to 1 – 2 km AGL (above
ground level), but significant layers of aerosols
are also visible between 4,0 – 5,5 km AGL on 14
July and between 2,5 – 3,0 km AGL on 15 July.
Detailed scrutiny of the data reveals more, but
less dense layers above and below as well.
3.3 Radar observations
The above observations prompted an analysis of
the routinely acquired surveillance images (PPI
at 0,3 elevation, 450 km range) of the PPR and BRU radars of IPMet during the preceding 5 – 10
days. Since no rain fell during this period, all
medium to strong radar echoes could be
attributed to emissions from sugar cane fires.
These fires commonly have durations of a bit
more than one hour, and therefore might only
appear on 1 or 2 PPI, because in the absence of
rain echoes the routine scanning cycle of the
radars is one PPI every 30 or 60 min.
Fig. 3. Daily GOES‐10 Satellite Images at about 12 LT (Local Time) from 11th–14th July 2008 (courtesy INPE/CPTEC).
A typical example of a large cane fire ca 60
km south‐east of the Bauru radar, indicating a
reflectivity of 28 dBZ is depicted in Fig. 5. A set
of forward trajectories was initiated from this
point, reaching IPEN after 70 hours, i.e., at 20:00
UT (17:00 LT) on 14 July at a height of 4455 m,
which matches well the Lidar observations (Fig.
4, top).
Fig. 4. Lidar Observations at IPEN in São Paulo, showing the range corrected signal in arbitrary units, on 14 (top) and 15th July 2008 (bottom).
Fig. 5. Composite PPI of IPMet’s Radars (PPR and BRU; elevation 0,3°) on 11th July 2008 at 19:00 LT. The red circle marks the position of one of the fires from which the forward trajectories were initiated.
ÓPTICA PURA Y APLICADA. www.sedoptica.es.
Opt. Pura Apl. 44 (1) 83‐91 (2011) ‐ 87 ‐ © Sociedad Española de Óptica
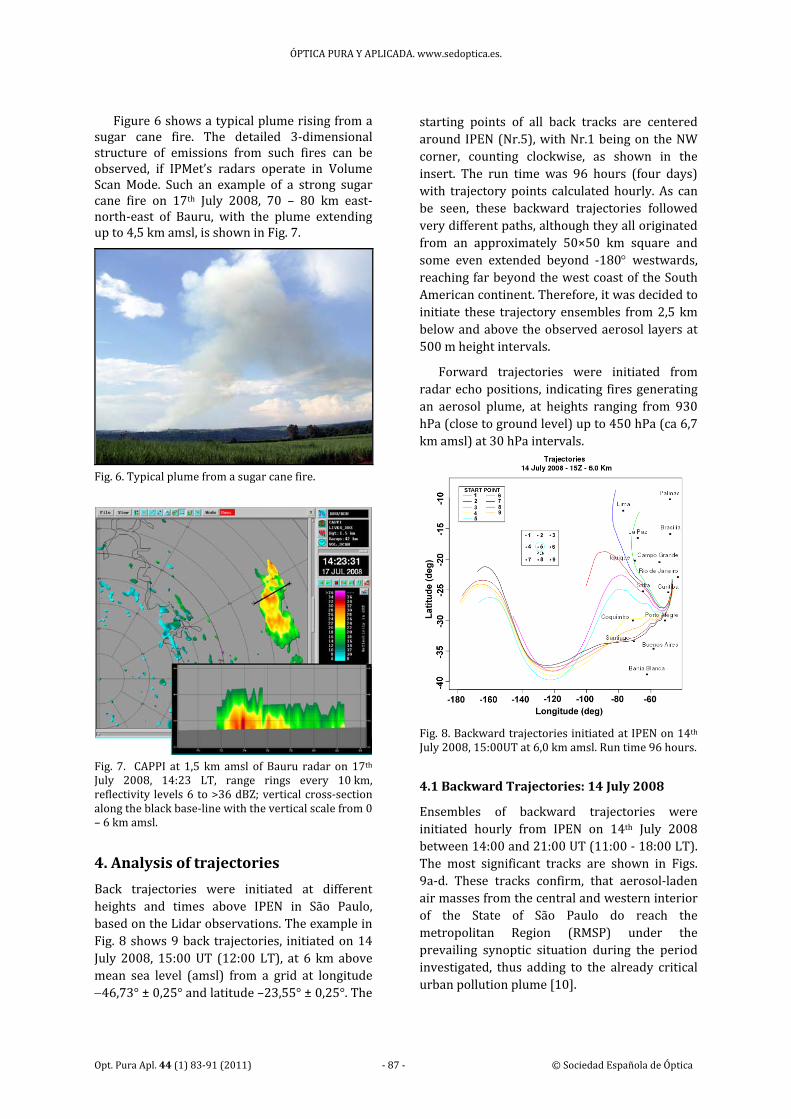
Figure 6 shows a typical plume rising from a sugar cane fire. The detailed 3‐dimensional structure of emissions from such fires can be observed, if IPMet’s radars operate in Volume Scan Mode. Such an example of a strong sugar cane fire on 17th July 2008, 70 – 80 km east‐north‐east of Bauru, with the plume extending up to 4,5 km amsl, is shown in Fig. 7.
Fig. 6. Typical plume from a sugar cane fire.
Fig. 7. CAPPI at 1,5 km amsl of Bauru radar on 17th July 2008, 14:23 LT, range rings every 10 km, reflectivity levels 6 to >36 dBZ; vertical cross‐section along the black base‐line with the vertical scale from 0 – 6 km amsl.
4. Analysis of trajectories
Back trajectories were initiated at different
heights and times above IPEN in São Paulo,
based on the Lidar observations. The example in
Fig. 8 shows 9 back trajectories, initiated on 14
July 2008, 15:00 UT (12:00 LT), at 6 km above
mean sea level (amsl) from a grid at longitude
46,73° ± 0,25° and latitude –23,55° ± 0,25°. The
starting points of all back tracks are centered
around IPEN (Nr.5), with Nr.1 being on the NW
corner, counting clockwise, as shown in the
insert. The run time was 96 hours (four days)
with trajectory points calculated hourly. As can
be seen, these backward trajectories followed
very different paths, although they all originated
from an approximately 50×50 km square and
some even extended beyond ‐180 westwards, reaching far beyond the west coast of the South
American continent. Therefore, it was decided to
initiate these trajectory ensembles from 2,5 km
below and above the observed aerosol layers at
500 m height intervals.
Forward trajectories were initiated from
radar echo positions, indicating fires generating
an aerosol plume, at heights ranging from 930
hPa (close to ground level) up to 450 hPa (ca 6,7
km amsl) at 30 hPa intervals.
Fig. 8. Backward trajectories initiated at IPEN on 14th July 2008, 15:00UT at 6,0 km amsl. Run time 96 hours.
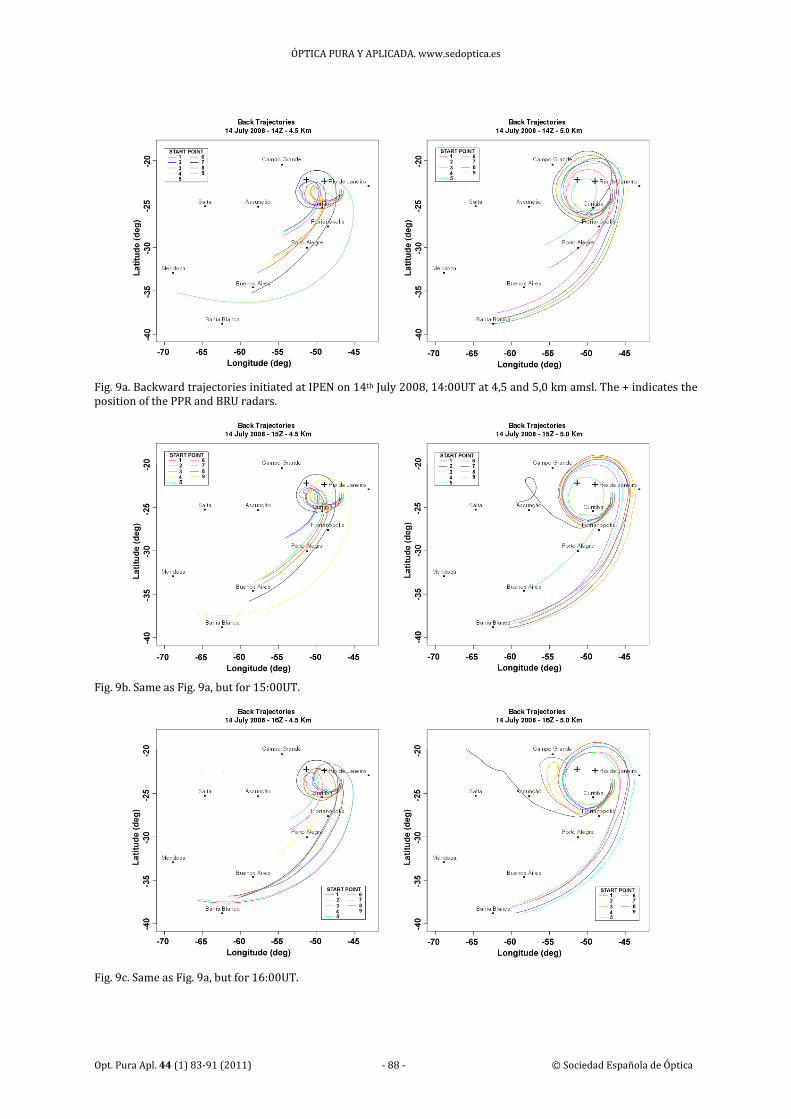
4.1 Backward Trajectories: 14 July 2008
Ensembles of backward trajectories were
initiated hourly from IPEN on 14th July 2008
between 14:00 and 21:00 UT (11:00 ‐ 18:00 LT).
The most significant tracks are shown in Figs.
9a‐d. These tracks confirm, that aerosol‐laden
air masses from the central and western interior
of the State of São Paulo do reach the
metropolitan Region (RMSP) under the
prevailing synoptic situation during the period
investigated, thus adding to the already critical
urban pollution plume [10].
ÓPTICA PURA Y APLICADA. www.sedoptica.es
Opt. Pura Apl. 44 (1) 83‐91 (2011) ‐ 88 ‐ © Sociedad Española de Óptica
Fig. 9a. Backward trajectories initiated at IPEN on 14th July 2008, 14:00UT at 4,5 and 5,0 km amsl. The + indicates the position of the PPR and BRU radars.
Fig. 9b. Same as Fig. 9a, but for 15:00UT.
Fig. 9c. Same as Fig. 9a, but for 16:00UT.

ÓPTICA PURA Y APLICADA. www.sedoptica.es.
Opt. Pura Apl. 44 (1) 83‐91 (2011) ‐ 89 ‐ © Sociedad Española de Óptica
Fig. 9d. Same as Fig. 9a, but for 21:00UT at 4,0 and 4,5 km amsl.
4.2 Forward Trajectories: 11th July 2008
Figure 10 shows forward trajectories initiated
on 11th July 2008 from locations where the
radars detected significant sugar cane fires, at
the following starting heights: 930, 870, 810,
750, 570, 550, 540, 530, 520, 510 hPa (run time
96 h).
Flextra 3.3 calculates the trajectories in three
dimensions, viz., x, y (output in longitude and
latitude) and z, which can be in m or hPa.
Therefore, time‐versus‐height graphs are very
useful for completing the 3‐dimensional time
history of the trajectories. For instance, if a
trajectory at any time during its transport comes
close to ground level, it could collect more
aerosols or other pollutants (e.g., gases, which
might react during the transport and convert to
aerosols). That would have to be considered
when interpreting the Lidar observations. Also,
if a trajectory fluctuates over a large range of
heights, it would be indicative of a significant
dilution of the aerosol and gaseous content of
the air parcel being transported along that
trajectory.
The trajectories shown in Fig. 10d for 22:00
UT are represented as a height x time graph in
Fig. 11. The cross (+) marks the exact height and
time when one of the trajectories, initiated at
about 5,5 km above the source, traversed IPEN.
It arrived there after 70 hours, i.e., at 17:00 LT at
a height of 4,5 km amsl. This coincides exactly
with the Lidar observations (Fig. 4).
Considering the very good results obtained in
this study, it must, however be emphasized, that
they are only based on one case under specific
synoptic conditions. The analysis is ongoing to
include more lidar observations and relate them
to radar‐detected sugar cane fires in the central
and western interior of the State. Furthermore, it
is proposed to improve the trajectory
visualization by adding regular time marks and a
map overlay.
Fig. 10a. Forward trajectories initiated where fires were indicated by IPMet’s radars on 11th July 2008, 10:00UT (07:00 LT). The + indicates the position of the PPR and BRU radars; o indicates IPEN, starting point of the backward trajectories.

ÓPTICA PURA Y APLICADA. www.sedoptica.es.
Opt. Pura Apl. 44 (1) 83‐91 (2011) ‐ 90 ‐ © Sociedad Española de Óptica
Fig. 10b. Same as Fig. 10a, but for 17:00UT (14:00 LT).
Fig. 10c. Same as Fig. 10a, but for 18:00UT (15:00 LT).
Fig. 10d. Same as Fig. 10a, but for 22:00UT (19:00 LT).
Fig. 11. Forward trajectories initiated on 11 July 2008, 22:00UT (19:00 LT), plotted against height and time. The + indicates the position of IPEN, marking height and time of arrival.
5. Conclusions
During July 2008, layers of aerosols had been
observed by IPEN’s Elastic Backscatter Lidar in
São Paulo, while emissions from sugar can fires
in the central and western State of São Paulo
were identified by IPMet’s Doppler Radars
during this rain‐free period.
YES, there is a connection between aerosol
layers observed by IPEN’s Lidar in São Paulo City
and emissions from sugar cane fires in the
central and western interior of the State, as
demonstrated by forward and backward
trajectories.
However, initial tests using HYSPLIT and
BRAMS to generate backward trajectories could
not provide reasonable answers, most likely due
to their windfields and grid resolution being too
coarse and the model domain too small.
Therefore, windfields were downloaded from
the ECMWF data base with a grid spacing of
0,25º x 0,25º (6‐hourly) for a domain ranging
from ‐180° to +180° longitude and ‐05° to ‐40°
latitude and 91 levels.
Matching backward and forward trajectories
could be identified for emissions from sugar
cane fires in the interior of the State on 11th July
2008 and observations of aerosol layers over

ÓPTICA PURA Y APLICADA. www.sedoptica.es.
Opt. Pura Apl. 44 (1) 83‐91 (2011) ‐ 91 ‐ © Sociedad Española de Óptica
metropolitan São Paulo during the afternoon of
14th July 2008.
It is therefore important to have a high‐
resolution three‐dimensional windfield available
as input for generating trajectories in hourly
time steps.
In this particular case study, it took
approximately 3 days for the aerosols to reach
metropolitan São Paulo;
The analysis is ongoing with observations
relating to 15th July 2008, which occurred during
the same synoptic conditions, but further cases
will also be investigated.
Acknowledgements
LPC2E of the Centre National de la Recherche
Scientifique is thanked for hosting the first
author on the Orleans Campus in June 2009 to
initiate this joint study. ECMWF is acknowledged
for permitting access to their Data Bank to
extract the relevant windfields for South
America.
The first author is also grateful for valuable
discussions with Andreas Stohl, currently at
NILU.