Fintel Energija Green Pipeline - Belgrade Stock … solid and high-performance strategic...
18
A solid and high-performance strategic infrastructure Fintel Energija Green Pipeline Belgrade, March 2017
Transcript of Fintel Energija Green Pipeline - Belgrade Stock … solid and high-performance strategic...

A solid and high-performance strategic infrastructure
Fintel Energija Green Pipeline
Belgrade, March 2017

Agenda
� Executive Summary
� Corporate Structure
� Operating Power Plants and Project Pipeline
� Deal Structure
� Projects Evaluation
� Annexes
2
Executive Summary
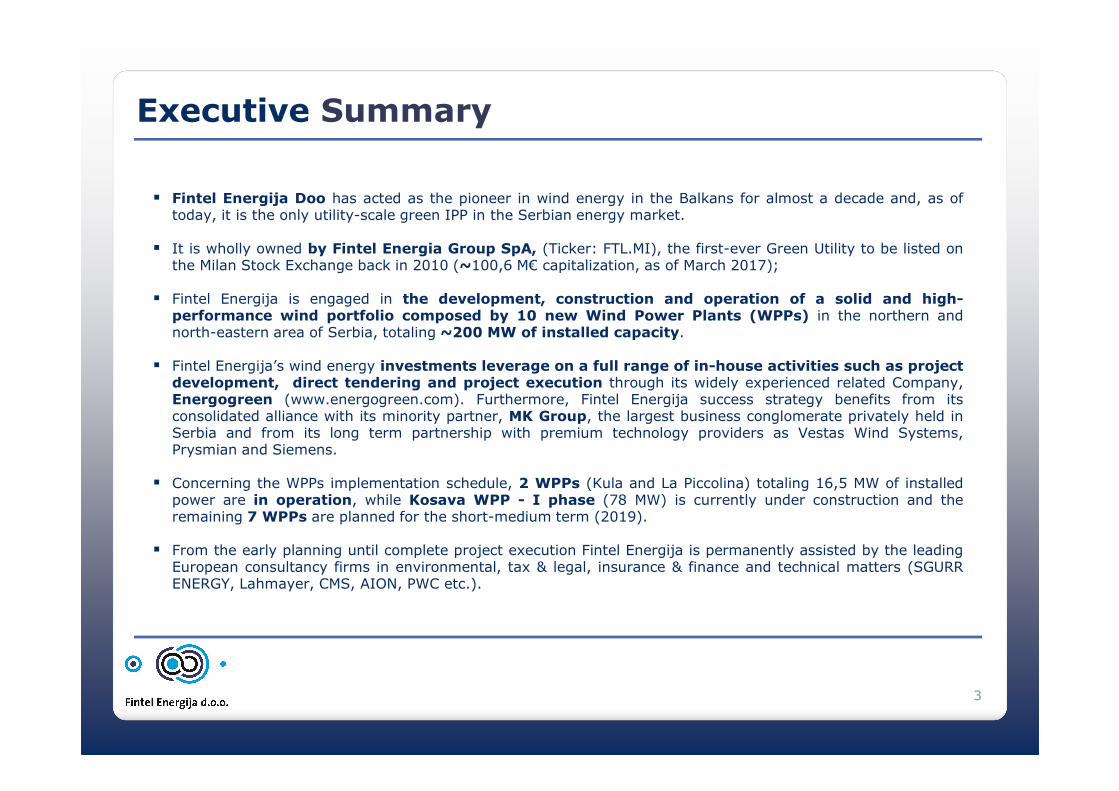
� Fintel Energija Doo has acted as the pioneer in wind energy in the Balkans for almost a decade and, as oftoday, it is the only utility-scale green IPP in the Serbian energy market.
� It is wholly owned by Fintel Energia Group SpA, (Ticker: FTL.MI), the first-ever Green Utility to be listed onthe Milan Stock Exchange back in 2010 (~100,6 M€ capitalization, as of March 2017);
� Fintel Energija is engaged in the development, construction and operation of a solid and high-performance wind portfolio composed by 10 new Wind Power Plants (WPPs) in the northern andnorth-eastern area of Serbia, totaling ~200 MW of installed capacity.
� Fintel Energija’s wind energy investments leverage on a full range of in-house activities such as projectdevelopment, direct tendering and project execution through its widely experienced related Company,Energogreen (www.energogreen.com). Furthermore, Fintel Energija success strategy benefits from itsconsolidated alliance with its minority partner, MK Group, the largest business conglomerate privately held inSerbia and from its long term partnership with premium technology providers as Vestas Wind Systems,Prysmian and Siemens.
� Concerning the WPPs implementation schedule, 2 WPPs (Kula and La Piccolina) totaling 16,5 MW of installedpower are in operation, while Kosava WPP - I phase (78 MW) is currently under construction and theremaining 7 WPPs are planned for the short-medium term (2019).
� From the early planning until complete project execution Fintel Energija is permanently assisted by the leadingEuropean consultancy firms in environmental, tax & legal, insurance & finance and technical matters (SGURRENERGY, Lahmayer, CMS, AION, PWC etc.).
3

Corporate Structure
Fintel Energia
Group SpA
Fintel Energija
Doo
MK Fintel Wind
MK Group
100%100%
100%
54 % 46 %
Kula
(9,9 Mw)
La
Piccolina
(6,6 Mw)
Kosava
I ph.
(78 Mw)
Kosava
II ph.
(39 Mw)
Kula II
(9,9 Mw)
Kosava II
(9,9 Mw)
Ram
(9,9 Mw)
Dunav I
(9,9 Mw)
Dunav III
(9,9 Mw)
Torak
(138 Mw)
4

5
Operating Power Plants and Project Pipeline
321 MW
2
1
3
8
7
6
9
Vrsac area
Veliko Gradiste
area
10
4
Wind Plant Capacity
(MW)
TotalInvestment
(€ million)
Implementation path
Works start Operation
1 - Kula (in operation)
9,9 14,1 January2015
February 2016
2 - La Piccolina (in operation)
6,6 10,1 July2015
July 2016
3 - Kosava I phase(under construction)
78 119,3 October 2016
January 2019
4 - Kosava II phase 39 62,8 March 2018
July 2019
5 - Kula 2 9,9 14,4 March 2018
July 2019
6 - Kosava 2 9,9 13,3 March 2018
July 2019
7 - Ram 9,9 13,9 March 2019
July 2020
8 - Dunav 1 9,9 14,3 March 2019
July 2020
9 - Dunav 3 9,9 14,3 March 2019
July 2020
10 - Torak 138 196,2 March 2019
July 2020
5
€ 473 mln
Block I
Block II
Block III

Deal structure
Fintel Energija’s implementation path has a major constraint in the time of execution. Usually 12 months arewasted for the project financing arrangements. This has a tremendous impact on costs of execution (3 shifts overa single shift, construction windows including winters, etc.) and on the overall value of the wind farm.
6
Shifting to a build&re-finance will maximaze the long-term profitability and reduce significantly totalinvestment and execution risk.
A) MID TERM RATIONALE
‘Finance Build Commission’ Modelfrom to ‘Build Commission Re-finance’ Model
Buyout of the minority shareholders in order to consolidate the existing cash-generating assets boosting thecompany dividends payouts.
B) SHORT TERM RATIONALE
Fintel is scouting several options in order to raise fresh equity (through IPO and/orissuing Wind Bond) and finalize its ambitious business strategy.
Projects Evaluation
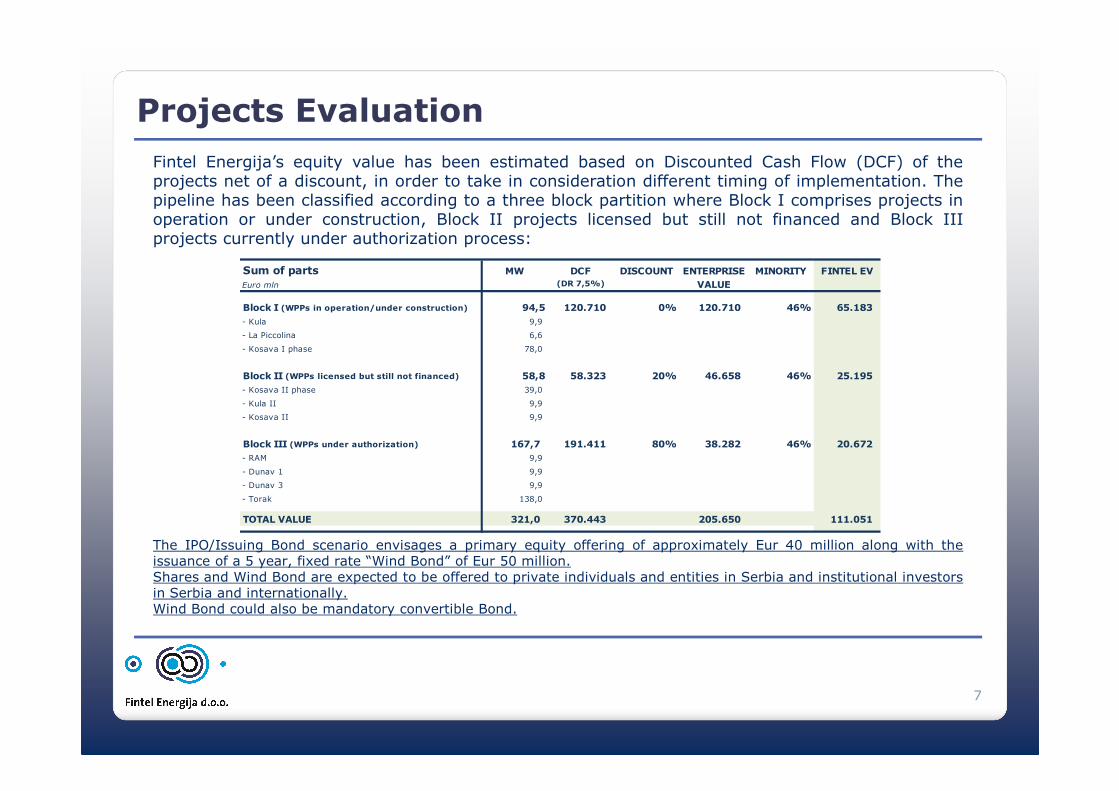
Fintel Energija’s equity value has been estimated based on Discounted Cash Flow (DCF) of theprojects net of a discount, in order to take in consideration different timing of implementation. Thepipeline has been classified according to a three block partition where Block I comprises projects inoperation or under construction, Block II projects licensed but still not financed and Block IIIprojects currently under authorization process:
7
The IPO/Issuing Bond scenario envisages a primary equity offering of approximately Eur 40 million along with theissuance of a 5 year, fixed rate “Wind Bond” of Eur 50 million.Shares and Wind Bond are expected to be offered to private individuals and entities in Serbia and institutional investorsin Serbia and internationally.Wind Bond could also be mandatory convertible Bond.
Sum of parts MW DCF DISCOUNT ENTERPRISE MINORITY FINTEL EV
Euro mln (DR 7,5%) VALUE
Block I (WPPs in operation/under construction) 94,5 120.710 0% 120.710 46% 65.183
- Kula 9,9
- La Piccolina 6,6
- Kosava I phase 78,0
Block II (WPPs licensed but still not financed) 58,8 58.323 20% 46.658 46% 25.195
- Kosava II phase 39,0
- Kula II 9,9
- Kosava II 9,9
Block III (WPPs under authorization) 167,7 191.411 80% 38.282 46% 20.672
- RAM 9,9
- Dunav 1 9,9
- Dunav 3 9,9
- Torak 138,0
TOTAL VALUE 321,0 370.443 205.650 111.051

Annexes
8
� Block I – Profit & Loss from 1st to 10th year� Block I – Balance Sheet from 1st to 10th year� Block I – Cash Flow from 1st to 10th year
� Block II – Profit & Loss from 1st to 10th year� Block II – Balance Sheet from 1st to 10th year� Block II – Cash Flow from 1st to 10th year
� Block III – Profit & Loss from 1st to 10th year� Block III – Balance Sheet from 1st to 10th year� Block III – Cash Flow from 1st to 10th year

Block I – Profit & Loss from 1st to 10th year
9
INCOM E STATEM ENT
Year 2016 Year 2017 Year 2018 Year 2019 Year 2020 Year 2021 Year 2022 Year 2023 Year 2024 Year 2025
Euro '000 1 2 3 4 5 6 7 8 9 10
Net revenues 1.6 9 5 4 .4 8 8 4 .575 2 7.0 3 5 2 7.573 2 8 .12 2 2 8 .6 8 2 2 9 .2 53 2 9 .8 3 5 3 0 .4 2 9 Revenues f rom electric power 1.684 4.354 4.441 26.901 27.439 27.988 28.547 29.118 29.701 30.295 Revenues f rom carbon credit 11 134 134 134 134 134 134 134 134 134
Operat ing & maintenance (69) (344) (351) (1.425) (1.454) (1.483) (1.512) (1.543) (1.574) (1.605) Insurance (12) (51) (52) (290) (296) (301) (307) (314) (320) (326) Structure costs (Personell, M ngmt Energogreen) (68) (372) (380) (1.224) (1.248) (1.273) (1.299) (1.325) (1.351) (1.378) Land lease (2) (3) (3) (14) (14) (14) (14) (14) (14) (14)
EB ITD A 1.54 5 3 .718 3 .79 0 2 4 .0 8 3 2 4 .56 2 2 5.0 51 2 5.54 9 2 6 .0 58 2 6 .577 2 7.10 6 % on Revenues 83% 83% 89% 89% 89% 89% 89% 89% 89%
Depreciat ion & Amort izat ions (277) (1.201) (1.201) (7.164) (7.164) (7.164) (7.164) (7.164) (7.164) (7.164) EB IT 1.2 6 8 2 .517 2 .58 8 16 .9 19 17.3 9 8 17.8 8 7 18 .3 8 5 18 .8 9 4 19 .4 13 19 .9 4 2
% on Revenues 56% 57% 63% 63% 64% 64% 65% 65% 66%Financial Interests- Agency fee, SS Agency fee and account bank fee (51) (52) (53) (54) (55) (56) (57) - Interests expenses (244) (1.056) (1.003) (5.710) (5.277) (4.650) (4.116) (3.649) (3.154) (2.631) Net earning bef o re t axat ion 1.0 2 4 1.4 6 0 1.58 6 11.157 12 .0 6 9 13 .18 3 14 .2 15 15.19 0 16 .2 0 2 17.2 53
% on Revenues 33% 35% 41% 44% 47% 50% 52% 54% 57%Income tax (154) (219) (238) (1.674) (1.810) (1.977) (2.132) (2.279) (2.430) (2.588)
Net Income 8 70 1.2 4 1 1.3 4 8 9 .4 8 4 10 .2 59 11.2 0 6 12 .0 8 3 12 .9 12 13 .772 14 .6 6 5
% on Revenues 51% 28% 29% 35% 37% 40% 42% 44% 46% 48%

Block I – Balance Sheet from 1st to 10th year
10
ASSETSYear 2016 Year 2017 Year 2018 Year 2019 Year 2020 Year 2021 Year 2022 Year 2023 Year 2024 Year 2025
Euro '000 1 2 3 4 5 6 7 8 9 10
Trade receivables 292 430 437 2.309 2.354 2.400 2.446 2.494 2.542 2.592 Trade payables (30) (77) (78) (294) (300) (306) (312) (318) (324) (331) C ommercial working cap i t al 2 6 2 3 53 3 59 2 .0 15 2 .0 54 2 .0 9 4 2 .13 4 2 .176 2 .2 18 2 .2 6 1
Other receivables (inc. VAT credit ) 8 20 20 128 130 133 135 138 141 144 Other payables (inc. VAT debit ) - - - - - - - - - - N et wo rking cap i t al 2 70 3 73 3 79 2 .14 3 2 .18 4 2 .2 2 7 2 .2 70 2 .3 14 2 .3 59 2 .4 0 5
Tangible assets 23.752 128.051 140.603 133.439 126.275 119.111 111.946 104.782 97.618 90.454 Lands - - - - - - - - - - F ixed asset s 2 3 .752 12 8 .0 51 14 0 .6 0 3 13 3 .4 3 9 12 6 .2 75 119 .111 111.9 4 6 10 4 .78 2 9 7.6 18 9 0 .4 54
N ET IN V ESTED C A PIT A L 2 4 .0 2 2 12 8 .4 2 4 14 0 .9 8 2 13 5.58 1 12 8 .4 59 12 1.3 3 7 114 .2 16 10 7.0 9 6 9 9 .9 77 9 2 .8 59
LIABILITIES AND SH. EQUITYYear 2016 Year 2017 Year 2018 Year 2019 Year 2020 Year 2021 Year 2022 Year 2023 Year 2024 Year 2025
Euro '000 0 1 2 3 4 5 6 7 8 9
Cash & cash equivalents (706) (1.536) (1.387) (7.803) (10.180) (6.780) (7.669) (8.483) (9.299) (10.117) DSRA (248) (372) (5.496) (5.496) (5.000) (5.000) (5.000) (5.000) (5.000) (5.000) Subordinated debt vs shareholders 647 604 557 506 452 394 333 268 198 124Financial debt - long term debt 16.736 85.666 103.062 95.548 87.600 75.532 67.411 58.825 49.750 40.157 N et f inancial p osit io n 16 .4 2 9 8 4 .3 6 1 9 6 .73 6 8 2 .755 72 .8 72 6 4 .14 7 55.0 74 4 5.6 10 3 5.6 50 2 5.16 4
Shareholders' capital 6.723 42.158 42.158 42.158 42.158 42.158 42.158 42.158 42.158 42.158 Reserves - 663 740 1.185 3.170 3.827 4.901 6.416 8.397 10.872 Retained income 870 1.241 1.348 9.484 10.259 11.206 12.083 12.912 13.772 14.665 Shareho lders equi t y 7.59 3 4 4 .0 6 3 4 4 .2 4 6 52 .8 2 7 55.58 6 57.19 0 59 .14 2 6 1.4 8 6 6 4 .3 2 7 6 7.6 9 5
TOT AL LIB ILIT IES A N D SHAR EHOLD ERS' EQU IT Y 2 4 .0 2 2 12 8 .4 2 4 14 0 .9 8 2 13 5.58 1 12 8 .4 59 12 1.3 3 7 114 .2 16 10 7.0 9 6 9 9 .9 77 9 2 .8 59

Block I – Cash Flow from 1st to 10th year
11
CASH FLOW STATEM ENTYear 2016 Year 2017 Year 2018 Year 2019 Year 2020 Year 2021 Year 2022 Year 2023 Year 2024 Year 2025
Euro '000 1 2 3 4 5 6 7 8 9 10
EB IT 1.268 2.517 2.588 16.919 17.398 17.887 18.385 18.894 19.413 19.942 (+) Depreciat ion 277 1.201 1.201 7.164 7.164 7.164 7.164 7.164 7.164 7.164 (+/-) Decreses / (increases) net working capital (270) (103) (6) (1.763) (42) (42) (43) (44) (45) (46) Income taxes (154) (219) (238) (1.674) (1.810) (1.977) (2.132) (2.279) (2.430) (2.588) Op erat ing cash f low 1.12 1 3 .3 9 6 3 .54 6 2 0 .6 4 6 2 2 .710 2 3 .0 3 1 2 3 .3 74 2 3 .73 5 2 4 .10 1 2 4 .4 72
Capex 0 (105.501) (13.753) 0 0 0 0 0 0 0
Cash f low avai lab le f o r Pro ject F inance service 1.12 1 ( 10 2 .10 5) 10 .2 0 7- 2 0 .6 4 6 2 2 .710 2 3 .0 3 1 2 3 .3 74 2 3 .73 5 2 4 .10 1 2 4 .4 72
Project Finance repayment (171) (1.136) (1.357) (7.514) (7.948) (12.068) (8.122) (8.585) (9.075) (9.593) Project Finance increase 0 70.065 18.753 0 0 0 0 0 0 0 Subordinated debt vs shareholders 0 (43) (48) (51) (54) (58) (61) (65) (70) (74) Interest expenses (244) (1.056) (1.003) (5.761) (5.329) (4.703) (4.170) (3.704) (3.210) (2.689) DSRA 0 (124) (5.124) 0 496 0 0 0 0 0Free cash f lo w avai lab le f o r shareho lders 70 6 ( 3 4 .3 9 8 ) 1.0 14 7.3 2 0 9 .8 75 6 .2 0 2 11.0 2 1 11.3 8 1 11.74 6 12 .116
Dividends 0 (207) (1.164) (903) (7.499) (9.602) (10.132) (10.568) (10.930) (11.297) Capital increases 0 35.436 0 0 0 0 0 0 0 0Net cash var iat ion 70 6 8 3 1 150- 6 .4 17 2 .3 76 3 .4 0 0- 8 8 9 8 14 8 16 8 18
( st D eb t ) / C ash B o P (0) 706 1.536 1.387 7.803 10.180 6.780 7.669 8.483 9.299( st D eb t ) / C ash Eo P 70 6 1.53 6 1.3 8 7 7.8 0 3 10 .18 0 6 .78 0 7.6 6 9 8 .4 8 3 9 .2 9 9 10 .117

Block II – Profit & Loss from 1st to 10th year
12
INCOM E STATEM ENT
Year 2019 Year 2020 Year 2021 Year 2022 Year 2023 Year 2024 Year 2025 Year 2026 Year 2027 Year 2028
Euro '000 1 2 3 4 5 6 7 8 9 10
Net revenues 8 .575 17.4 9 4 17.8 4 4 18 .2 0 1 18 .56 5 18 .9 3 6 19 .3 15 19 .70 1 2 0 .0 9 5 2 0 .4 9 7 Revenues f rom electric power 8.575 17.494 17.844 18.201 18.565 18.936 19.315 19.701 20.095 20.497 Revenues f rom carbon credit
Operat ing & maintenance (279) (569) (580) (592) (604) (616) (628) (641) (654) (667) Insurance (89) (182) (185) (189) (193) (197) (201) (205) (209) (213) Structure costs (Personell, M ngmt Energogreen) (567) (1.157) (1.180) (1.204) (1.228) (1.252) (1.277) (1.303) (1.329) (1.356) Land lease (9) (9) (9) (9) (9) (9) (9) (9) (9) (9)
EB ITD A 7.6 3 2 15.578 15.8 8 9 16 .2 0 7 16 .53 2 16 .8 6 3 17.2 0 0 17.54 4 17.8 9 5 18 .2 53 % on Revenues 89% 89% 89% 89% 89% 89% 89% 89% 89% 89%
Depreciat ion & Amort izat ions (2.263) (4.525) (4.525) (4.525) (4.525) (4.525) (4.525) (4.525) (4.525) (4.525) EB IT 5.3 6 9 11.0 52 11.3 6 4 11.6 8 2 12 .0 0 6 12 .3 3 7 12 .6 75 13 .0 19 13 .3 70 13 .72 8
% on Revenues 63% 63% 64% 64% 65% 65% 66% 66% 67% 67%Financial Interests- Agency fee, SS Agency fee and account bank fee (51) (52) (53) (54) (55) (56) (57) (59) (60) (61) - Interests expenses (1.842) (3.622) (3.367) (3.097) (2.813) (2.513) (2.196) (1.862) (1.508) (1.135) Net earning bef o re t axat ion 3 .4 76 7.3 79 7.9 4 4 8 .53 1 9 .13 8 9 .76 8 10 .4 2 1 11.0 9 9 11.8 0 2 12 .53 2
% on Revenues 41% 42% 45% 47% 49% 52% 54% 56% 59% 61%Income tax (521) (1.107) (1.192) (1.280) (1.371) (1.465) (1.563) (1.665) (1.770) (1.880)
Net Income 2 .9 55 6 .2 72 6 .753 7.2 51 7.76 7 8 .3 0 3 8 .8 58 9 .4 3 4 10 .0 3 2 10 .6 52
% on Revenues 34% 36% 38% 40% 42% 44% 46% 48% 50% 52%

Block II – Balance Sheet from 1st to 10th year
13
ASSETSYear 2018 Year 2019 Year 2020 Year 2021 Year 2022 Year 2023 Year 2024 Year 2025 Year 2026 Year 2027 Year 2028
Euro '000 0 1 2 3 4 5 6 7 8 9 10
Trade receivables - 1.429 1.458 1.487 1.517 1.547 1.578 1.610 1.642 1.675 1.708 Trade payables - (187) (75) (75) (77) (78) (80) (81) (83) (85) (86) C ommercial wo rking cap it al - 1.2 4 2 1.3 8 3 1.4 12 1.4 4 0 1.4 6 9 1.4 9 8 1.52 8 1.559 1.59 0 1.6 2 2
Other receivables (inc. VAT credit) - 94 95 97 99 101 103 105 107 110 112 Other payables (inc. VAT debit) - - - - - - - - - - - N et wo rking cap it al - 1.3 3 6 1.4 78 1.50 9 1.53 9 1.570 1.6 0 2 1.6 3 4 1.6 6 6 1.70 0 1.73 4
Tangible assets 81.342 88.243 83.717 79.192 74.667 70.142 65.616 61.091 56.566 52.041 47.515 LandsF ixed asset s 8 1.3 4 2 8 8 .2 4 3 8 3 .717 79 .19 2 74 .6 6 7 70 .14 2 6 5.6 16 6 1.0 9 1 56 .56 6 52 .0 4 1 4 7.515
N ET IN V ESTED C A PITA L 8 1.3 4 2 8 9 .578 8 5.19 6 8 0 .70 1 76 .2 0 6 71.712 6 7.2 18 6 2 .72 5 58 .2 3 2 53 .74 0 4 9 .2 4 9
LIABILITIES AND SH. EQUITYYear 2018 Year 2019 Year 2020 Year 2021 Year 2022 Year 2023 Year 2024 Year 2025 Year 2026 Year 2027 Year 2028
Euro '000 0 1 2 3 4 5 6 7 8 9 10
Cash & cash equivalents - (3.882) (9.334) (15.137) (15.981) (16.213) (16.447) (16.685) (16.926) (17.169) (17.416) DSRA - (3.800) (4.428) (5.042) (5.042) (5.042) (5.042) (5.042) (5.042) (5.042) (5.042) Financial debt - long term debt 54.016 66.979 62.404 57.575 52.476 47.092 41.409 35.409 29.074 22.386 15.325 N et f inancial posi t ion 54 .0 16 59 .2 9 7 4 8 .6 4 2 3 7.3 9 6 3 1.4 53 2 5.8 3 8 19 .9 2 0 13 .6 8 2 7.10 7 175 ( 7.13 3 )
Shareholders' capital 27.326 27.326 27.326 27.326 27.326 27.326 27.326 27.326 27.326 27.326 27.326 Reserves - - 2.955 9.227 10.176 10.780 11.669 12.858 14.365 16.207 18.404 Retained income - 2.955 6.272 6.753 7.251 7.767 8.303 8.858 9.434 10.032 10.652 Shareho lders equit y 2 7.3 2 6 3 0 .2 8 1 3 6 .553 4 3 .3 0 6 4 4 .753 4 5.8 74 4 7.2 9 8 4 9 .0 4 3 51.12 6 53 .56 5 56 .3 8 2
TOTA L LIB ILIT IES A N D SHA R EHOLD ER S' EQU ITY 8 1.3 4 2 8 9 .578 8 5.19 6 8 0 .70 1 76 .2 0 6 71.712 6 7.2 18 6 2 .72 5 58 .2 3 2 53 .74 0 4 9 .2 4 9
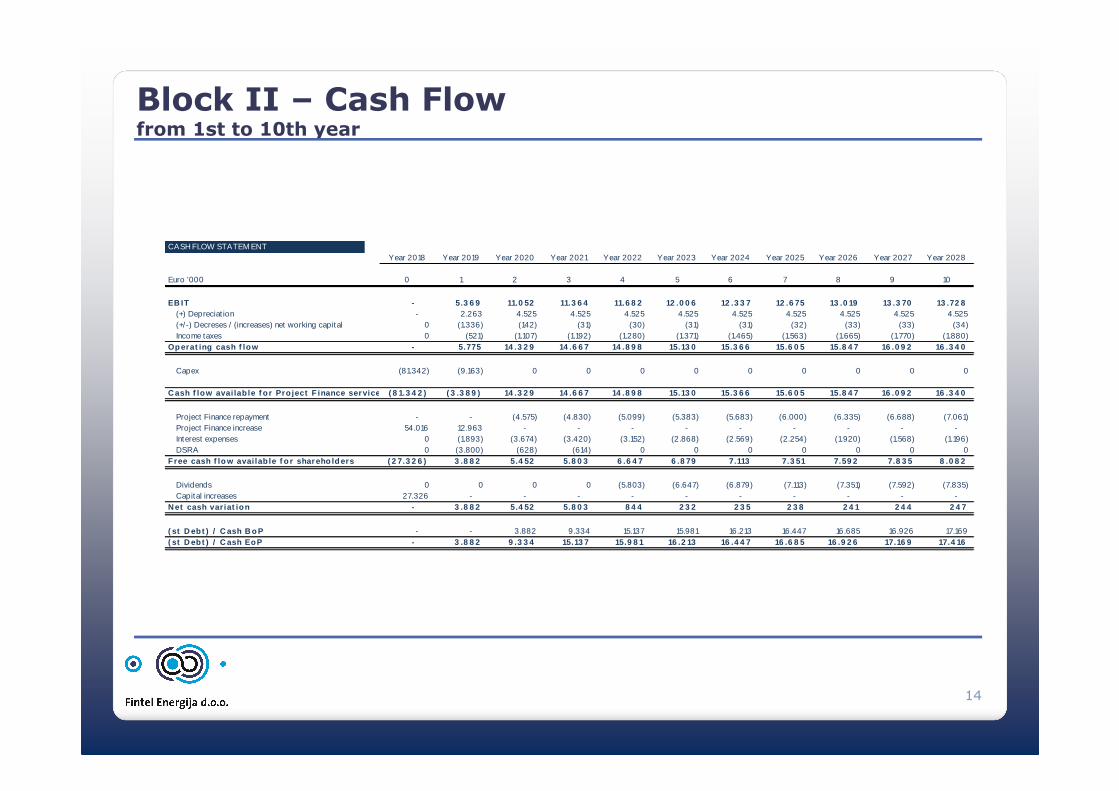
Block II – Cash Flow from 1st to 10th year
14
CASH FLOW STATEM ENTYear 2018 Year 2019 Year 2020 Year 2021 Year 2022 Year 2023 Year 2024 Year 2025 Year 2026 Year 2027 Year 2028
Euro '000 0 1 2 3 4 5 6 7 8 9 10
EB IT - 5.3 6 9 11.0 52 11.3 6 4 11.6 8 2 12 .0 0 6 12 .3 3 7 12 .6 75 13 .0 19 13 .3 70 13 .72 8 (+) Depreciat ion - 2.263 4.525 4.525 4.525 4.525 4.525 4.525 4.525 4.525 4.525 (+/-) Decreses / (increases) net working capital 0 (1.336) (142) (31) (30) (31) (31) (32) (33) (33) (34) Income taxes 0 (521) (1.107) (1.192) (1.280) (1.371) (1.465) (1.563) (1.665) (1.770) (1.880) Op erat ing cash f low - 5.775 14 .3 2 9 14 .6 6 7 14 .8 9 8 15.13 0 15.3 6 6 15.6 0 5 15.8 4 7 16 .0 9 2 16 .3 4 0
Capex (81.342) (9.163) 0 0 0 0 0 0 0 0 0
Cash f low avai lab le f o r Pro ject F inance service ( 8 1.3 4 2 ) ( 3 .3 8 9 ) 14 .3 2 9 14 .6 6 7 14 .8 9 8 15.13 0 15.3 6 6 15.6 0 5 15.8 4 7 16 .0 9 2 16 .3 4 0
Project Finance repayment - - (4.575) (4.830) (5.099) (5.383) (5.683) (6.000) (6.335) (6.688) (7.061) Project Finance increase 54.016 12.963 - - - - - - - - - Interest expenses 0 (1.893) (3.674) (3.420) (3.152) (2.868) (2.569) (2.254) (1.920) (1.568) (1.196) DSRA 0 (3.800) (628) (614) 0 0 0 0 0 0 0Free cash f lo w avai lab le f o r shareho ld ers ( 2 7.3 2 6 ) 3 .8 8 2 5.4 52 5.8 0 3 6 .6 4 7 6 .8 79 7.113 7.3 51 7.59 2 7.8 3 5 8 .0 8 2
Dividends 0 0 0 0 (5.803) (6.647) (6.879) (7.113) (7.351) (7.592) (7.835) Capital increases 27.326 - - - - - - - - - - Net cash var iat ion - 3 .8 8 2 5.4 52 5.8 0 3 8 4 4 2 3 2 2 3 5 2 3 8 2 4 1 2 4 4 2 4 7
( st D eb t ) / C ash B o P - - 3.882 9.334 15.137 15.981 16.213 16.447 16.685 16.926 17.169 ( st D eb t ) / C ash EoP - 3 .8 8 2 9 .3 3 4 15.13 7 15.9 8 1 16 .2 13 16 .4 4 7 16 .6 8 5 16 .9 2 6 17.16 9 17.4 16

Block III – Profit & Loss from 1st to 10th year
15
INCOM E STATEM ENT
Year 2020 Year 2021 Year 2022 Year 2023 Year 2024 Year 2025 Year 2026 Year 2027 Year 2028 Year 2029
Euro '000 1 2 3 4 5 6 7 8 9 10
Net revenues 2 3 .9 16 4 8 .78 9 4 9 .76 5 50 .76 0 51.776 52 .8 11 53 .8 6 7 54 .9 4 5 56 .0 4 4 57.16 4 Revenues f rom electric power 23.916 48.789 49.765 50.760 51.776 52.811 53.867 54.945 56.044 57.164 Revenues f rom carbon credit - - - - - - - - - -
Operat ing & maintenance (828) (1.690) (1.723) (1.758) (1.793) (1.829) (1.866) (1.903) (1.941) (1.980) Insurance (254) (518) (529) (539) (550) (561) (572) (584) (595) (607) Structure costs (Personell, M ngmt Energogreen) (708) (1.444) (1.473) (1.502) (1.532) (1.563) (1.594) (1.626) (1.659) (1.692) Land lease (25) (25) (25) (25) (25) (25) (25) (25) (25) (25)
EB ITD A 2 2 .10 2 4 5.113 4 6 .0 15 4 6 .9 3 6 4 7.8 75 4 8 .8 3 3 4 9 .8 11 50 .8 0 7 51.8 2 4 52 .8 6 1 % on Revenues 92% 92% 92% 92% 92% 92% 92% 92% 92% 92%
Depreciat ion & Amort izat ions (5.967) (11.934) (11.934) (11.934) (11.934) (11.934) (11.934) (11.934) (11.934) (11.934) EB IT 16 .13 5 3 3 .179 3 4 .0 8 1 3 5.0 0 2 3 5.9 4 1 3 6 .8 9 9 3 7.8 76 3 8 .8 73 3 9 .8 9 0 4 0 .9 2 7
% on Revenues 67% 68% 68% 69% 69% 70% 70% 71% 71% 72%Financial Interests- Agency fee, SS Agency fee and account bank fee 0 0 0 0 0 0 0 0 0 0- Interests expenses (4.758) (9.356) (8.697) (8.002) (7.267) (6.492) (5.673) (4.809) (3.897) (2.933) Net earning bef o re t axat ion 11.3 76 2 3 .8 2 2 2 5.3 8 4 2 7.0 0 0 2 8 .6 74 3 0 .4 0 7 3 2 .2 0 3 3 4 .0 6 4 3 5.9 9 3 3 7.9 9 4
% on Revenues 48% 49% 51% 53% 55% 58% 60% 62% 64% 66%Income tax (1.706) (3.573) (3.808) (4.050) (4.301) (4.561) (4.830) (5.110) (5.399) (5.699)
Net Income 9 .6 70 2 0 .2 4 9 2 1.576 2 2 .9 50 2 4 .3 73 2 5.8 4 6 2 7.3 73 2 8 .9 55 3 0 .59 4 3 2 .2 9 5
% on Revenues 40% 42% 43% 45% 47% 49% 51% 53% 55% 56%

Block III – Balance Sheet from 1st to 10th year
16
ASSETSYear 2019 Year 2020 Year 2021 Year 2022 Year 2023 Year 2024 Year 2025 Year 2026 Year 2027 Year 2028 Year 2029
Euro '000 0 1 2 3 4 5 6 7 8 9 10
Trade receivables - 3.986 4.066 4.147 4.230 4.315 4.401 4.489 4.579 4.670 4.764 Trade payables 0 (358) (221) (221) (225) (230) (234) (239) (244) (249) (254) C ommercial wo rking cap it al - 3 .6 2 8 3 .8 4 5 3 .9 2 6 4 .0 0 5 4 .0 8 5 4 .16 7 4 .2 50 4 .3 3 5 4 .4 2 2 4 .510
Other receivables (inc. VAT credit) - 179 183 186 190 194 198 202 206 210 214 Other payables (inc. VAT debit) 0 0 0 0 0 0 0 0 0 0 0N et wo rking cap it al - 3 .8 0 7 4 .0 2 8 4 .113 4 .19 5 4 .2 79 4 .3 6 4 4 .4 52 4 .54 1 4 .6 3 1 4 .72 4
Tangible assets 204.367 232.715 220.781 208.847 196.913 184.979 173.045 161.110 149.176 137.242 125.308 Lands - - - - - - - - - - - F ixed asset s 2 0 4 .3 6 7 2 3 2 .715 2 2 0 .78 1 2 0 8 .8 4 7 19 6 .9 13 18 4 .9 79 173 .0 4 5 16 1.110 14 9 .176 13 7.2 4 2 12 5.3 0 8
N ET IN V ESTED C A PITA L 2 0 4 .3 6 7 2 3 6 .52 2 2 2 4 .8 0 9 2 12 .9 59 2 0 1.10 8 18 9 .2 57 177.4 0 9 16 5.56 2 153 .717 14 1.8 74 13 0 .0 3 2
LIABILITIES AND SH. EQUITYYear 2019 Year 2020 Year 2021 Year 2022 Year 2023 Year 2024 Year 2025 Year 2026 Year 2027 Year 2028 Year 2029
Euro '000 0 1 2 3 4 5 6 7 8 9 10
Cash & cash equivalents 0 (11.830) (26.488) (42.144) (48.118) (48.805) (49.501) (50.207) (50.923) (51.648) (52.383) DSRA 0 (5.100) (10.587) (15.880) (15.880) (15.880) (15.880) (15.880) (15.880) (15.880) (15.880) Financial debt - long term debt 133.612 173.027 161.209 148.733 135.561 121.654 106.972 91.472 75.107 57.829 39.589 N et f inancial posi t ion 13 3 .6 12 156 .0 9 7 12 4 .13 4 9 0 .70 9 71.56 2 56 .9 6 9 4 1.59 1 2 5.3 8 4 8 .3 0 4 9 .6 9 9- 2 8 .6 75-
Shareholders' capital 70.755 70.755 70.755 70.755 70.755 70.755 70.755 70.755 70.755 70.755 70.755 Reserves - - 9.670 29.919 35.840 37.160 39.216 42.050 45.703 50.223 55.657 Retained income - 9.670 20.249 21.576 22.950 24.373 25.846 27.373 28.955 30.594 32.295 Shareho lders equit y 70 .755 8 0 .4 2 5 10 0 .6 74 12 2 .2 51 12 9 .54 5 13 2 .2 8 8 13 5.8 18 14 0 .178 14 5.4 13 151.573 158 .70 7
TOTA L LIB ILIT IES A N D SHA R EHOLD ER S' EQU ITY 2 0 4 .3 6 7 2 3 6 .52 2 2 2 4 .8 0 9 2 12 .9 59 2 0 1.10 8 18 9 .2 57 177.4 0 9 16 5.56 2 153 .717 14 1.8 74 13 0 .0 3 2

Block III – Cash Flow from 1st to 10th year
17
CASH FLOW STATEM ENTYear 2019 Year 2020 Year 2021 Year 2022 Year 2023 Year 2024 Year 2025 Year 2026 Year 2027 Year 2028 Year 2029
Euro '000 0 1 2 3 4 5 6 7 8 9 10
EB IT - 16 .13 5 3 3 .179 3 4 .0 8 1 3 5.0 0 2 3 5.9 4 1 3 6 .8 9 9 3 7.8 76 3 8 .8 73 3 9 .8 9 0 4 0 .9 2 7 (+) Depreciat ion - 5.967 11.934 11.934 11.934 11.934 11.934 11.934 11.934 11.934 11.934 (+/-) Decreses / (increases) net working capital 0 (3.807) (221) (85) (82) (84) (86) (87) (89) (91) (93) Income taxes 0 (1.706) (3.573) (3.808) (4.050) (4.301) (4.561) (4.830) (5.110) (5.399) (5.699) Op erat ing cash f low - 16 .58 8 4 1.3 19 4 2 .12 3 4 2 .8 0 4 4 3 .4 9 0 4 4 .18 7 4 4 .8 9 3 4 5.6 0 9 4 6 .3 3 4 4 7.0 6 9
Capex (204.367) (34.315) 0 0 0 0 0 0 0 0 0
Cash f low avai lab le f o r Pro ject F inance service ( 2 0 4 .3 6 7) ( 17.72 7) 4 1.3 19 4 2 .12 3 4 2 .8 0 4 4 3 .4 9 0 4 4 .18 7 4 4 .8 9 3 4 5.6 0 9 4 6 .3 3 4 4 7.0 6 9
Project Finance repayment - - (11.818) (12.476) (13.172) (13.907) (14.682) (15.501) (16.365) (17.277) (18.241) Project Finance increase 133.612 39.415 - - - - - - - - - Interest expenses 0 (4.758) (9.356) (8.697) (8.002) (7.267) (6.492) (5.673) (4.809) (3.897) (2.933) DSRA 0 (5.100) (5.487) (5.293) 0 0 0 0 0 0 0Free cash f lo w avai lab le f o r shareho lders ( 70 .755) 1 1.8 3 0 14 .6 58 15.6 56 2 1.6 3 0 2 2 .3 17 2 3 .0 13 2 3 .719 2 4 .4 3 5 2 5.16 0 2 5.8 9 5
Dividends - - - - 15.656- 21.630- 22.317- 23.013- 23.719- 24.435- 25.160- Capital increases 70.755 - - - - - - - - - - Net cash var iat ion - 11.8 3 0 14 .6 58 15.6 56 5.9 74 6 8 7 6 9 6 70 6 716 72 5 73 5
( st D eb t ) / C ash B o P - - 11.830 26.488 42.144 48.118 48.805 49.501 50.207 50.923 51.648 ( st D eb t ) / C ash Eo P - 11.8 3 0 2 6 .4 8 8 4 2 .14 4 4 8 .118 4 8 .8 0 5 4 9 .50 1 50 .2 0 7 50 .9 2 3 51.6 4 8 52 .3 8 3

18


![48d0abdbca0cd[1Veterna energija]](https://static.fdocuments.us/doc/165x107/577cdf9e1a28ab9e78b19dcf/48d0abdbca0cd1veterna-energija.jpg)