Aprūpinimo energija efektyvumas - lsta.lt konf/16_Viktoras... · Aprūpinimo energija efektyvumas...
27
Aprūpinimo energija efektyvumas Energy efficiency on supply side Lietuvos energetikos konferencija 2013 « Nepriklausoma energetika – stipri ekonomika » Viktoras Karaliūnas ALSTOM LT Vilnius 20131010 V
Transcript of Aprūpinimo energija efektyvumas - lsta.lt konf/16_Viktoras... · Aprūpinimo energija efektyvumas...

Aprūpinimo energija efektyvumas Energy efficiency on supply side
Lietuvos energetikos konferencija 2013
« Nepriklausoma energetika – stipri ekonomika »
Viktoras Karaliūnas
ALSTOM LT
Vilnius 20131010
V

• Economic crisis
− Reduction of consumption − Need of sustainable energy
• Energy mix evolution
− High development of Renewable energy − Phase out of Nuclear & New Build − Coal vs. Gas for conventional energy
• Integrated market
− Effective 1st January 2014 − Capacity market
Challenges for the European Electricity Sector

• Energy efficiency on both demand & supply side
• Reducing Cost of new Technologies
• Increasing capacity of New Technologies
Solutions exist for Sustainable Energy
• Balanced Energy Mix
• Smart Grid
• Hybrid AC/DC grid
• Storage
• Develop Transmission Network : HVDC
• Innovative & efficient renewable energy (offshore, Ocean, variable PSP, CSP…)
• Demonstrating CCS
• Improving Power plants efficiency
• Improving Air quality
• Maximising Water resources
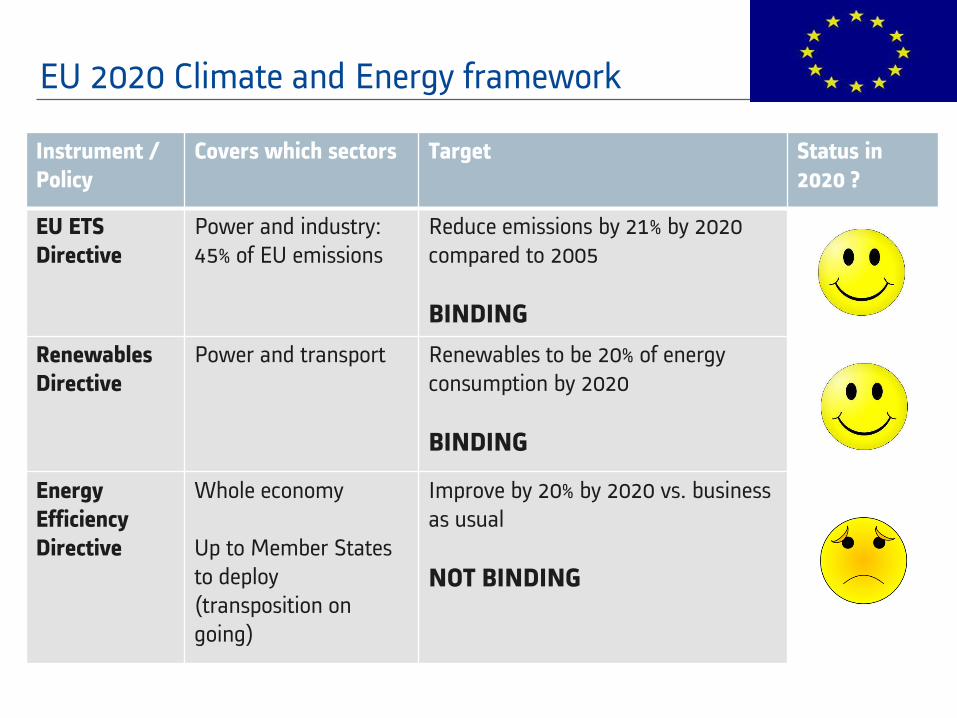
EU 2020 Climate and Energy framework
• EU ETS: 45% of EU emissions: reduce 21% 2005-20 • Renewables:
long list ….
Instrument / Policy
Covers which sectors Target Status in 2020 ?
EU ETS Directive
Power and industry: 45% of EU emissions
Reduce emissions by 21% by 2020 compared to 2005
BINDING
Renewables Directive
Power and transport Renewables to be 20% of energy consumption by 2020
BINDING
Energy Efficiency Directive
Whole economy Up to Member States to deploy (transposition on going)
Improve by 20% by 2020 vs. business as usual
NOT BINDING

• Vehicle CO2 standards will be
met
• New efficiency standards and
labelling for lighting and
appliances
Progress on Energy Efficiency ?
• More finance needed, especially
for the renovation of buildings
• More efforts needed on supply
side efficiency
• More progress needed in overall
transport energy efficiency

EU CO2 price too low
0 5 10 15 20 25 30
RGGI
Australia (with linkage)
EU
Shenzhen
South Africa
California
Quebec
Alberta
EU (Phase 2 prices)
Australia (pre-EU linkage)
British Colombia
$/tonne
0
5
10
15
20
25
30
35
janv.-05 mai-08 sept.-11
ECX EUA DecAhead
• Carbon price is not driving investments
• Low auction revenues
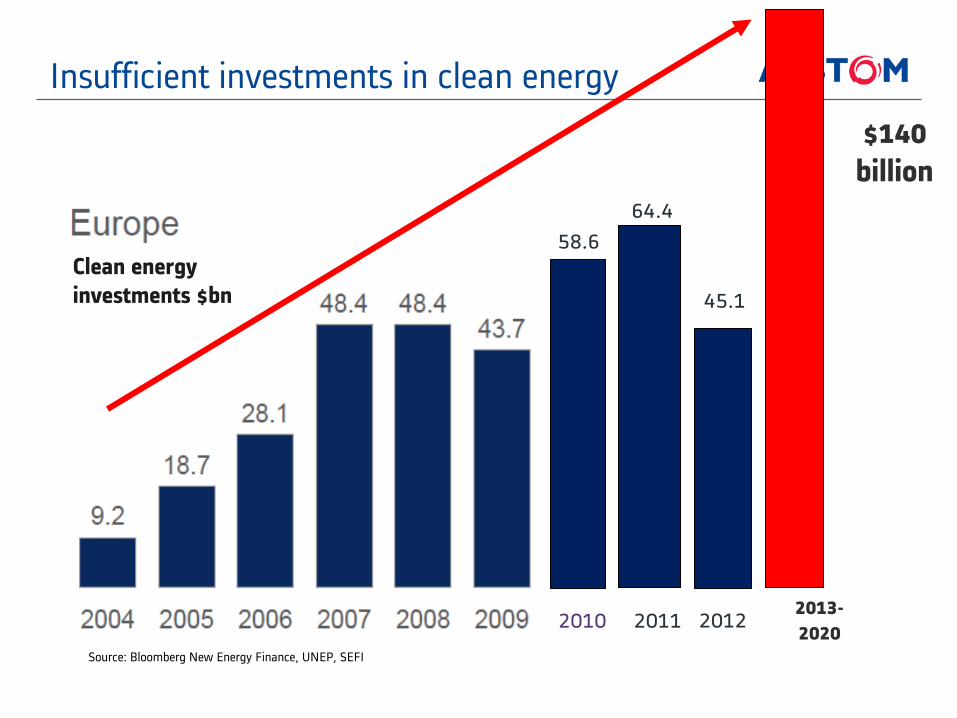
Insufficient investments in clean energy
2013-2020
$140 billion
Clean energy investments $bn
Source: Bloomberg New Energy Finance, UNEP, SEFI
58.6
64.4
45.1
2010 2011 2012
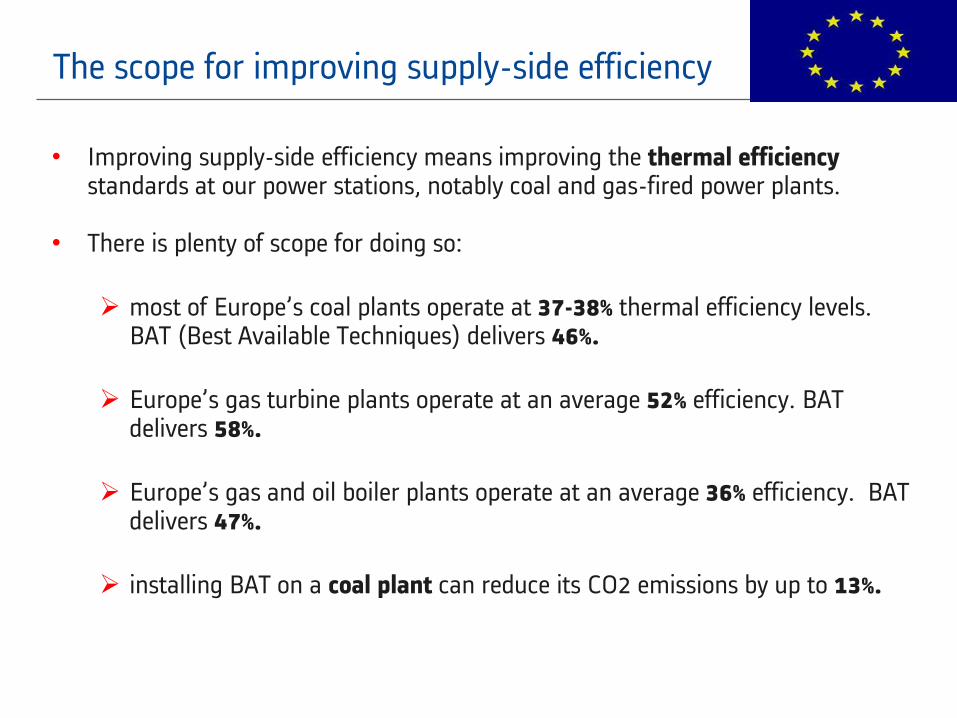
The scope for improving supply-side efficiency
• Improving supply-side efficiency means improving the thermal efficiency standards at our power stations, notably coal and gas-fired power plants.
• There is plenty of scope for doing so:
most of Europe’s coal plants operate at 37-38% thermal efficiency levels. BAT (Best Available Techniques) delivers 46%.
Europe’s gas turbine plants operate at an average 52% efficiency. BAT delivers 58%.
Europe’s gas and oil boiler plants operate at an average 36% efficiency. BAT delivers 47%.
installing BAT on a coal plant can reduce its CO2 emissions by up to 13%.

Alstom Grid Alstom Thermal Power
Three main activities in four sectors 93,000 employees in 100 countries, orders 2012/13 = 23.8 €bn
Alstom Renewable Power Alstom Transport
Leadership in key markets and fast-growing
technologies (disconnectors, GIS, HVDC …)
Alstom makes 1 metro in 4 and 1 tram in 4
Alstom supplies major equipment for 25% of the
worldwide installed power generation capacity and….
….it holds 25% of hydro electricity market
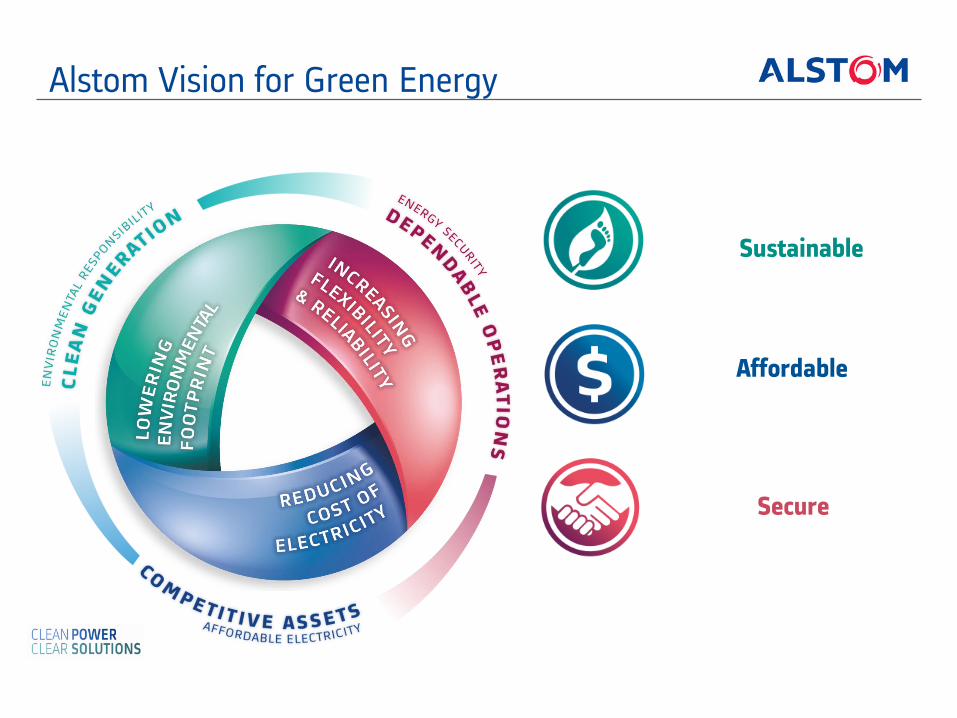
Alstom Vision for Green Energy
Sustainable
Secure
Affordable

Improving efficiency of gas and coal plants
Combined Cycle power plant
Coal-fired power plant
Continuous performance improvement
1960 1980 2010
167/540/540240/540/565
270/580/600
280/600/620
350/700/720
2020
350/730/760
50%
* Based on LHV and open cycle cooling at 13°C
45%
Net Plant Efficiency evolution
45
50
55
60
65
70
1100 1200 1300 1400 1500 1600
Hot Gas Temperature (ºC)
Com
bin
ed C
ycle
Eff
icie
ncy
(%)
1980
1995
2011

Improving air quality = public health benefits
Progress Made in Reducing NOx Emissions

Improving power plant efficiency = less CO2
New Plants
Retrofit
60% of the 2030 installed base still to be built
60% of carbon emitted in 2030 will come from today’s plant
Gas: +20 p.p in efficiency saves
33% CO2 emissions
Coal: +20 p.p in efficiency saves
40% CO2 emissions
Plant Optimisation:
-5% CO2
Turbine retrofit:
-5% CO2
Boiler retrofit:
-3% CO2
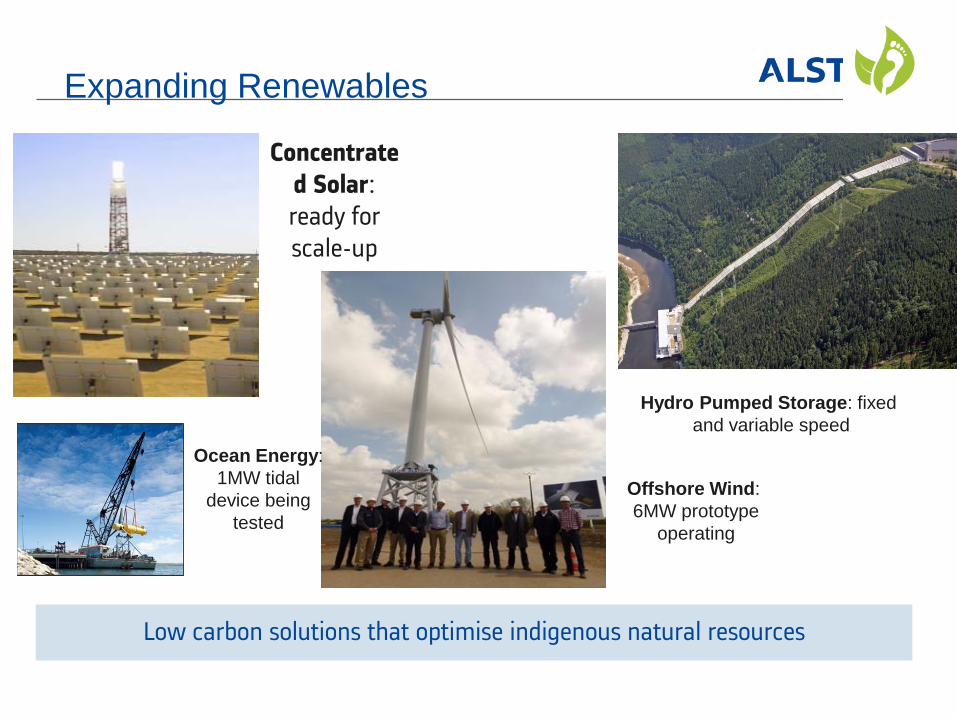
Expanding Renewables
Concentrated Solar: ready for scale-up
Ocean Energy:
1MW tidal
device being
tested
Offshore Wind:
6MW prototype
operating
Hydro Pumped Storage: fixed
and variable speed
Low carbon solutions that optimise indigenous natural resources

Increasing capacity of new technologies: Wind
Each step in evolution improves capacity factor & increases output
Nominal output (MW)
Cap
acit
y fa
ctor
(@
7m
/s)
Wind classes not considered, as most products go through one or more upgrades during lifetime Approx. year of commercialization
2008
2009 2009
2001 2002
2004 2008
2003 2008
2009 2010
2011
2012 2010
2011
2012
2007
2005
1999
2009
2002
2005 2003
2009 2011
Source: Alstom analysis

Balanced energy mix
Gas Coal
Hydro, Tidal, Wave Nuclear Wind: on and offshore offshore
Oil
Solar Geothermal Biomass

© ALSTOM 2011. All rights reserved. Information contained in this document is indicative only. No representation or warranty is given or should be relied on that it is complete or correct or will apply to any particular project. This will depend on the technical and commercial circumstances. It is provided without liability and is subject to change without notice. Reproduction, use or disclosure to third parties, without express written authority, is strictly prohibited.
[stake holder] - Next Generation GT26/KA26 - [presenter's initials] - 17 Aug 2011 - P 17
Efficiency crucial to integrating renewables
• Intermittent resources like wind and solar power require flexible, reliable back-up power to ensure grid stability
Combined cycle flexibility supports the reliable integration of renewables
• Flexibility is a key driver of Alstom’s combined cycle product development
•Large turn-down capability, low load operation capability •Part-load efficiency •Fast start-up & load changes •Grid frequency support

© ALSTOM 2011. All rights reserved. Information contained in this document is indicative only. No representation or warranty is given or should be relied on that it is complete or correct or will apply to any particular project. This will depend on the technical and commercial circumstances. It is provided without liability and is subject to change without notice. Reproduction, use or disclosure to third parties, without express written authority, is strictly prohibited.
Affordable = market-balancing to manage price spikes
-100
-50
0
50
100
150
200
250
300
350
400
Sau Vas Kov Bal Geg Bir Lie Rgp Rgs Spl Lap Grd
Do
lla
rs p
er
MW
h

© ALSTOM 2011. All rights reserved. Information contained in this document is indicative only. No representation or warranty is given or should be relied on that it is complete or correct or will apply to any particular project. This will depend on the technical and commercial circumstances. It is provided without liability and is subject to change without notice. Reproduction, use or disclosure to third parties, without express written authority, is strictly prohibited.
Secure = flexible power plants to integrate renewables Flexible Operating Modes
Highest part load efficiency
Low Load Parking
Fast ramp rates

© ALSTOM 2011. All rights reserved. Information contained in this document is indicative only. No representation or warranty is given or should be relied on that it is complete or correct or will apply to any particular project. This will depend on the technical and commercial circumstances. It is provided without liability and is subject to change without notice. Reproduction, use or disclosure to third parties, without express written authority, is strictly prohibited.
Hybrid AC/DC Grids to integrate renewables

© ALSTOM 2011. All rights reserved. Information contained in this document is indicative only. No representation or warranty is given or should be relied on that it is complete or correct or will apply to any particular project. This will depend on the technical and commercial circumstances. It is provided without liability and is subject to change without notice. Reproduction, use or disclosure to third parties, without express written authority, is strictly prohibited.
Smart grid for flexible and reliable power

© ALSTOM 2011. All rights reserved. Information contained in this document is indicative only. No representation or warranty is given or should be relied on that it is complete or correct or will apply to any particular project. This will depend on the technical and commercial circumstances. It is provided without liability and is subject to change without notice. Reproduction, use or disclosure to third parties, without express written authority, is strictly prohibited.
Transport: a major – and growing - contribution to Energy use & CO2 emissions in Europe
22
Source: IEA 2011
Electricity for rail integrated in rail figures
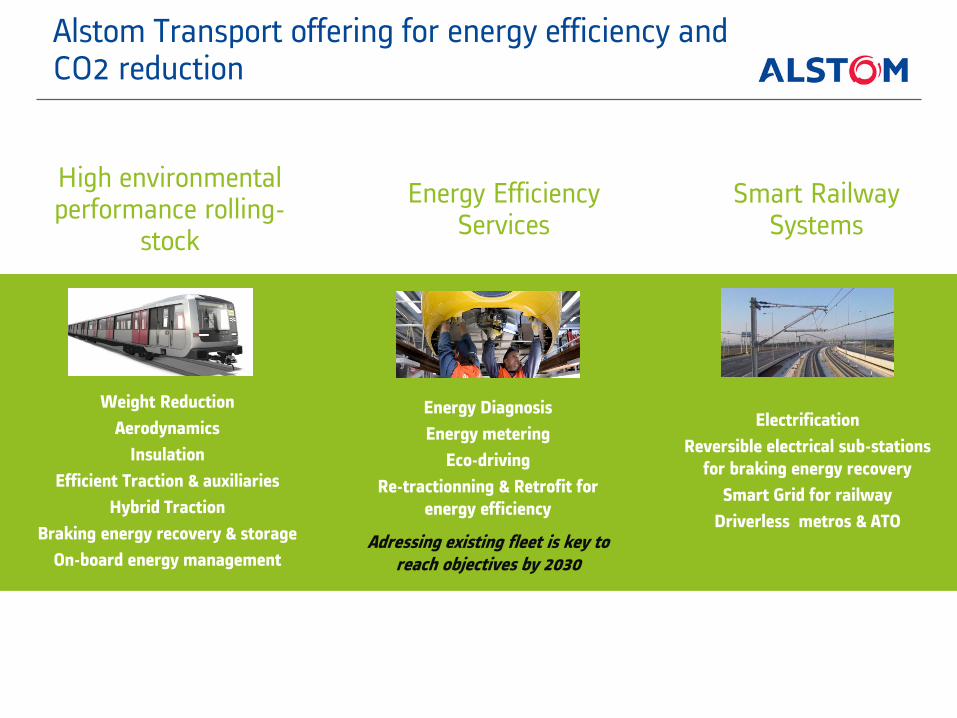
Alstom Transport offering for energy efficiency and CO2 reduction
High environmental performance rolling-
stock
Smart Railway Systems
Energy Efficiency Services
Weight Reduction
Aerodynamics
Insulation
Efficient Traction & auxiliaries
Hybrid Traction
Braking energy recovery & storage
On-board energy management
Energy Diagnosis
Energy metering
Eco-driving
Re-tractionning & Retrofit for energy efficiency
Electrification
Reversible electrical sub-stations for braking energy recovery
Smart Grid for railway
Driverless metros & ATO Adressing existing fleet is key to
reach objectives by 2030
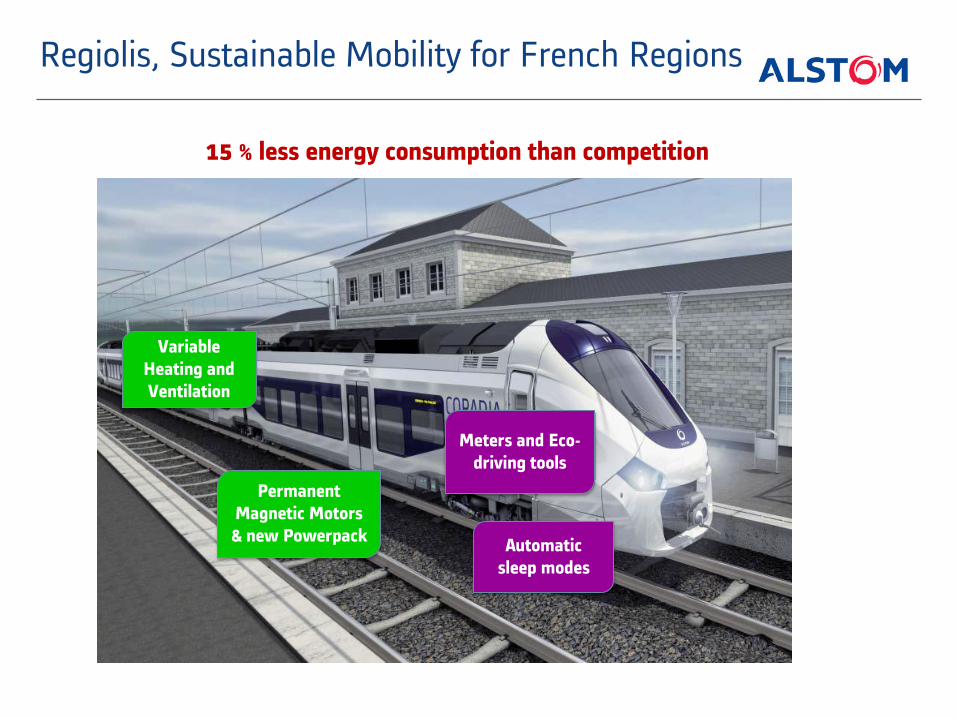
Meters and Eco-driving tools
Permanent Magnetic Motors & new Powerpack
Variable Heating and Ventilation
Regiolis, Sustainable Mobility for French Regions
15 % less energy consumption than competition
Automatic sleep modes

AGV technology: reducing customers’ environmental footprint
P 25
Designed for reduced weight
Distributed traction with articulated
architecture
Permanent Magnet Motors
20 % less energy consumption than previous generation
10 % less than other market solutions
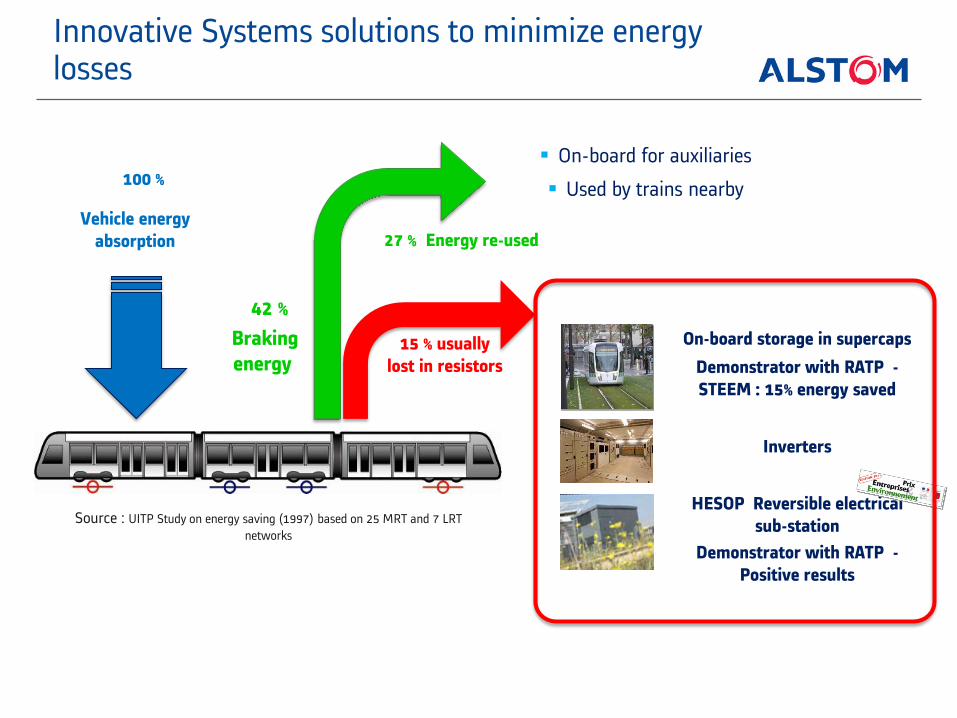
Innovative Systems solutions to minimize energy losses
On-board for auxiliaries
Used by trains nearby
Source : UITP Study on energy saving (1997) based on 25 MRT and 7 LRT
networks
100 %
Braking energy
Vehicle energy absorption 27 % Energy re-used
42 %
15 % usually lost in resistors
On-board storage in supercaps
HESOP Reversible electrical sub-station
Inverters
Demonstrator with RATP - STEEM : 15% energy saved
Demonstrator with RATP - Positive results

www.alstom.com
Ačiū už dėmesį !


![48d0abdbca0cd[1Veterna energija]](https://static.fdocuments.us/doc/165x107/577cdf9e1a28ab9e78b19dcf/48d0abdbca0cd1veterna-energija.jpg)