FINNISH METEOROLOGICAL INSTITUTE CONTRIBUTIONS NO. 62 ...
55
FINNISH METEOROLOGICAL INSTITUTE CONTRIBUTIONS NO. 62 OBSERVATIONS OF PRODUCTION AND TRANSPORT OF NO x FORMED BY ENERGETIC PARTICLE PRECIPITATION IN THE POLAR NIGHT ATMOSPHERE ANNIKA S EPPÄLÄ DEPARTMENT OF P HYSICAL S CIENCES FACULTY OF S CIENCE UNIVERSITY OF HELSINKI HELSINKI ,F INLAND ACADEMIC DISSERTATION in physics To be presented, with the permission of the Faculty of Science of the University of Helsinki, for public critisism in Auditorium D 101 at Physicum in Kumpula Campus (Gustaf Hällströmin katu 2b) on September 28th, 2007, at 12 o’clock noon. Finnish Meteorological Institute Helsinki, 2007
Transcript of FINNISH METEOROLOGICAL INSTITUTE CONTRIBUTIONS NO. 62 ...
FINNISH METEOROLOGICAL INSTITUTECONTRIBUTIONS
NO. 62
OBSERVATIONS OF PRODUCTION AND TRANSPORT OFNOx FORMED BY ENERGETIC PARTICLE PRECIPITATION
IN THE POLAR NIGHT ATMOSPHERE
ANNIKA SEPPÄLÄ
DEPARTMENT OF PHYSICAL SCIENCES
FACULTY OF SCIENCE
UNIVERSITY OF HELSINKI
HELSINKI, FINLAND
ACADEMIC DISSERTATION in physics
To be presented, with the permission of the Faculty of Science of the University ofHelsinki, for public critisism in Auditorium D 101 at Physicum in Kumpula Campus(Gustaf Hällströmin katu 2b) on September 28th, 2007, at 12 o’clock noon.
Finnish Meteorological InstituteHelsinki, 2007

ISBN 978-951-697-627-6 (paperback)ISBN 978-952-10-4181-5 (PDF)
ISSN 0782-6117
YliopistopainoHelsinki, 2007

Series title, number and report code of publicationPublished by Finnish Meteorological Institute Contributions 62, FMI-CONT-62
(Erik Palménin aukio 1) P.O. Box 503FI-00101 Helsinki, Finland Date
September 2007Authors Name of projectAnnika Seppälä
Commissioned by
Title
Observations of production and transport of NOx formed by energetic particle precipitation in the polar night atmos-phere
Abstract
This work is focused on the effects of energetic particle precipitation of solar or magnetospheric origin on the polarmiddle atmosphere. Most of these energetic particles are protons and electrons with MeV and keV energies, respec-tively. The energetic charged particles have access to the atmosphere in the polar areas, where they are guided by theEarth's magnetic field. In the polar areas the energetic particles penetrate down to 20-100 km altitudes (stratosphereand mesosphere) ionising the ambient air. This ionisation leads to production of odd nitrogen (NOx) and odd hydro-gen (HOx) species, which take part in catalytic ozone destruction. NOx has a very long chemical lifetime during polarnight conditions. Therefore NOx produced at high altitudes during polar night can be transported to lower strato-spheric altitudes, where it contributes to the ozone balance.
Particular emphasis in this thesis is in the use of both space and ground based observations: ozone and nitrogen diox-ide (NO2) measurements from the GOMOS instrument on board the European Space Agency's environmental satelliteEnvisat are used together with subionospheric VLF radio wave observations from ground stations. Combining the twoobservation techniques enabled detection of NOx enhancements throughout the middle atmosphere, including track-ing the descent of NOx enhancements of high altitude origin down to the stratosphere.
GOMOS observations were used to examine the effect of the large Solar Proton Events of October-November 2003 onthe Northern Hemisphere polar middle atmosphere. The results showed the progression of the SPE initiated NOx en-hancements through the polar winter. In the upper stratosphere nighttime NO2 increased by an order of magnitude, andthe effect was observed to last for several weeks after the SPEs. Ozone decreases up to 60 % from the pre-SPE valueswere observed in the upper stratosphere nearly a month after the events. Over several weeks the GOMOS observationsshowed the gradual descent of the NOx enhancements to lower altitudes. GOMOS measurements from years 2002-2006were used to study polar winter NOx increases and their connection to energetic particle precipitation. NOx enhance-ments were found to occur in a good correlation with both increased high-energy particle precipitation and increasedgeomagnetic activity. The average wintertime polar NOx was found to have a nearly linear relationship with the averagewintertime geomagnetic activity.
The results from this thesis work show how important energetic particle precipitation from outside the atmosphere i sas a source of odd nitrogen in the middle atmosphere, and thus its importance to the chemical balance of the atmos-phere.
Publishing unitEarth ObservationClassification (UDC) Keywords551.501, 551.590.2 stratosphere, mesosphere, odd nitrogen, ozone,
energetic particle precipitation, solar storms
ISSN and series title0782-6117 Finnish Meteorological Institute ContributionsISBN Language978-951-697-627-6 (paperback), 978-952-10-4181-5 (PDF) EnglishSold by Pages Price Finnish Meteorological Institute / Library 100
P.O. Box 503, FI-00101 Helsinki NoteFinland
Julkaisun sarja, numero ja raporttikoodiJulkaisija Ilmatieteen laitos, (Erik Palménin aukio 1) Contributions 62, FMI-CONT-62
PL 503, 00101 Helsinki JulkaisuaikaSyyskuu 2007
Tekijä(t) Projektin nimiAnnika Seppälä
ToimeksiantajaNimekeHavaintoja korkeaenergisen hiukkaspresipitaation ilmakehässä tuottamista typen oksideista ja niidenkulkeutumisesta polaariyössä
Tiivistelmä
Tässä väitöskirjatyössä on tutkittu maan napa-alueiden ilmakehään auringosta tai maan magnetosfääristä tulevienkorkeaenergisten varattujen hiukkasten vaikutuksia ilmakehän koostumukseen. Nämä korkeaenergiset hiukkaset,joista pääosa on elektroneita ja protoneita, tunkeutuvat maan napa-alueiden ilmakehään ionisoiden sitä noin 20 ja100 kilometrin välisellä korkeusalueella. Tämä korkeusalue kattaa stratosfääri- ja mesosfääri-kerrokset ja sitä kutsu-taan yleisesti keski-ilmakehäksi. Keski-ilmakehässä varattujen hiukkasten aiheuttamasta ionisaatiosta seuraa typen javedyn oksidien tuottoa. Sekä typen että vedyn oksidit aiheuttavat ilmakehässä otsonikatoa katalyyttisten kemiallis-ten reaktioketjujen välityksellä. Typen oksidit (NOx) ovat ilmakehässä napa-alueiden valottomina aikoina hyvin pit-käikäisiä, voiden siten vaikuttaa ilmakehän otsonitasapainoon pitkinä talvisina ajanjaksoina.
Työssä on käytetty erityisesti Euroopan avaruusjärjestön Envisat-ympäristösatelliitissa olevan suomalais-ranskalaisen GOMOS-mittalaitteen havaintoja ilmakehän yöaikaisesta koostumuksesta. Toisin kuin ilmakehän koos-tumusta tutkivat mittalaitteet yleensä, GOMOS kykenee tekemään havaintoja öisestä ilmakehästä käyttämällä mit-tauksissa apuna tähdistä tulevaa säteilyä. GOMOS-mittalaitteen avulla havaittiin ensimmäistä kertaa kuinka Aurin-gossa loka-marraskuussa 2003 tapahtuneiden myrskyjen seuraksena pohjoisen napa-alueen ilmakehän typen oksidienpitoisuus kasvoi ja kuinka kasvaneet pitoisuudet säilyivät ilmakehässä napa-alueen talven aikana saaden aikaan ot-sonikatoa ylästratosfäärissä ja mesosfäärissä.
GOMOS-mittalaitteen havaintojen avulla todettiin myös, että talvisten napa-alueiden ilmakehän keskimääräisen typenoksidien määrän ja ilmakehään pääsevien korkeaenergisten hiukkasten välillä on yhteys myös muulloin kuin akti-ivisina aurinkomyrskyaikoina. Tämä yhteys oli aiemmin havaittu eteläisellä napa-alueella, mutta GOMOSin uudetyöaikaiset havainnot ilmakehästä paljastivat saman ilmiön myös pohjoisella napa-alueella.
Yhdistämällä GOMOS-mittalaitteen havainnot radioaallonpituuksilla tehtävien niin kutsuttujen VLF eli Very LowFrequency mittausten kanssa, saatiin täysin uutta tietoa ilmakehän koostumuksesta. Väitöskirjatyöhön liittyenkehitettiin menetelmä, jolla radioaaltoalueen mittauksilla voidaan välillisesti havaita typpimonoksidin lisääntymistä65-90 kilometrin korkeuksilla. Näin voitiin täydentää noin 50 kilometrin korkeudelle yltäviä typen oksidiensatelliittihavaintoja. Näitä radioaaltomittauksia käyttäen selvitettiin vuoden 2004 keväänä pohjoisen napa-alueenstratosfäärissä satelliittimittauksilla havaittujen ennätyksellisten typenoksidi määrien alkuperäksi mesosfäärinyläpuolinen ilmakehän alue, eli termosfäärin alaosa, jossa merkittävä typen oksidien lähde ovat revontuliakinaikaansaavat varatut hiukkaset.
Väitöstyön tulokset osoittavat kuinka suuri merkitys ilmakehän ulkopuolelta tulevalla hiukkaspakotteella onilmakehän kemiallisen tasapainon kannalta, erityisesti stratosfäärin otsonitasapainon kannalta merkittäville typenoksideille.
JulkaisijayksikköKaukokartoitusyksikköLuokitus (UDK) Asiasanat551.501, 551.590.2 stratosfääri, mesosfääri, typen oksidit, otsoni,
energettiset hiukkaset, hiukkassade, auringonpurkaukset
ISSN ja avainnimike0781-6117 Finnish Meteorological Institute ContributionsISBN Kieli978-951-697-627-6 (nid.), 978-952-10-4181-5 (PDF) EnglantiMyynti Sivumäärä Hinta
Ilmatieteen laitos / Kirjasto 100PL 503, 00101 Helsinki Lisatietoja

PREFACE
Several peoples contribution has been vital to this thesis work, I wish to mention a fewof them.
I express my gratitude to Prof. Hannu Koskinen from Helsinki University for theinspiring tuition I experienced in space physics classes over the years, and for being thefirst person to suggest a research topic related to both space and atmospheric physics,which I have now fund very much my own. Conducting this work would not havebeen possible without continuous support from FMI in various forms: I started my Ph.D. work in the former Geophysical Research unit lead by Prof. Tuija Pulkkinen, andlater continued in the then new Earth Observation unit under the leadership of Prof.Jarkko Koskinen. Over the years I have attained tremendous respect towards both ofyou. You have provided me with good working conditions, encouraged me in manyways, but have also been indispensable in helping me to find my place in the scientificcommunity. I sincerely thank you for that. I am very grateful for Prof. Manuel López-Puertas from the Instituto de Astrofisica de Andalucia and Dr. Esa Turunen from theSodankylä Geophysical Observatory for the careful examination of this thesis.
Many thanks belong my thesis adviser Prof. Erkki Kyrölä. During the course ofthis work, the best thing I have received from you has been the confidence and trust thatI am capable of making the right decisions and that I am doing the right thing.
I wish to thank my co-authors, unofficial advisers, dear colleagues and friendsDr. Mark Clilverd and Dr. Craig Rodger from the British Antarctic Survey and theUniversity of Otago. Your enthusiasm and wide interest in science greatly inspire meto maintain and expand mine, not to mention the excellent company you two make.It is a tremendous pleasure to work with persons who think much the same way asI do – most of the time anyway. Furthermore, I especially thank Craig for helpingme to carry out my lifelong dream to visit New Zealand and Mark for introducingme to Cambridge, now one of my favourite places in the world (with and without theoccasional snow), and to BAS, while in the mean time exposing me to cricket. I want tothank the whole Clilverd family for hosting me during my visits to BAS and for sharingyour experiences while I was planing my first NZ visit.
During my visit to the Laboratory for Space and Atmospheric Physics at Univer-sity of Colorado in 2005 is was fortunate to become acquainted with Prof. Cora E.Randall. I warmly thank you for hosting me during my visit, and for all the interest youhave expressed towards my work.
Dr. Minna Palmroth and Maria Genzer, my friends and co-conspirators since thegood old days at GEO, I hope you know what your friendship means to me, the wordsare not enough to express. I’m also indebted to Minna for helping me to find answers

to a bunch of (sometimes odd) questions concerning space physics and also for en-couraging me further in my studies. The topic of this work is very interdisciplinary, asanything to do with the Sun-Earth connection always is. I have been supported bothfrom above: the space, magnetosphere, and ionosphere, and below from the strato-sphere. I particularly wanted to mention Minna, as well as Dr. Petri Toivanen, whohave helped me on various issues I have had concerning the above, and Leif Backmanand Laura Thölix, who have helped me with the below. I thank Dr. Johanna Tamminenand Dr. Viktoria Sofieva for many discussion concerning the use of GOMOS data andDr. Pekka Verronen for first introducing me to the wonderful world of SPEs. In thevarious computer problems I have faced I have received help from many people. Mostof the time the help has been near and for that I thank Seppo Hassinen. I am equallygrateful for all my old friends and colleagues now at AVA and the new ones I havefound at KAU for the non-work related activities. I also thank the Finnish CHAMOSgroup for all the fun gatherings, visits to Tähtelä, and countless excellent research plansover the recent years.
This work was fundamentally made possible by the funding received from theAcademy of Finland though the Middle Atmosphere Interactions with the Sun andTroposphere project. Most of my visits to other institutes as well as to conferenceshave been enabled by the generous support I have received from the Vilho, Yrjöand Kalle Väisälä foundation/Finnish Academy of Science and Letters, the Jenny andAntti Wihuri foundation as well as the British Antarctic Survey, the Center for SpacePhysics/Boston University, the Sodankylä Geophysical Observatory/Oulu Universityand the University of Otago. I thank Tiina Tamminen and Kirsi Virolainen for patientlyhelping me with the more or less complicated Travel-reports.
Finally, I wish to thank my family: my parents Marja and Eero and my youngersister Anniina for continuous encouragement as well as endurance and consolationwhen needed. Anniina, an enormous thank you for all the craziness you have floodedmy life with over the years and the shared interest in A, B, green wing and my cd col-lection, not to mention you ability to come up with a diversion when one is needed! Inthe end, my most sincere thanks belong to my late grandmother Aino Seppälä. At hertime she was a strong believer in education of young women and an embodiment offemale intelligence, and she always encouraged me on my path to higher education. Iwish she could see me now.
Helsinki, September 2007Annika Seppälä

CONTENTS
LIST OF ORIGINAL PUBLICATIONS 8
1 INTRODUCTION 9
2 CHEMISTRY AND DYNAMICS 122.1 OZONE AND RELATED CHEMISTRY IN THE MIDDLE ATMOSPHERE 12
2.1.1 NOx chemistry . . . . . . . . . . . . . . . . . . . . . . . . . . 132.1.2 HOx chemistry . . . . . . . . . . . . . . . . . . . . . . . . . . 162.1.3 Halogen chemistry . . . . . . . . . . . . . . . . . . . . . . . . 18
2.2 DYNAMICS AND TRANSPORT 192.2.1 Horizontal transport . . . . . . . . . . . . . . . . . . . . . . . 212.2.2 Descent of air in the polar vortex . . . . . . . . . . . . . . . . . 212.2.3 Transport and chemical lifetimes . . . . . . . . . . . . . . . . 22
2.3 VERTICAL DISTRIBUTION OF OZONE 232.4 VERTICAL DISTRIBUTION OF NOx 25
3 MEASUREMENTS 273.1 THE GOMOS INSTRUMENT 273.2 SUBIONOSPHERIC RADIO WAVE PROPAGATION 29
4 ENERGETIC PARTICLE PRECIPITATION AND THE ATMOSPHERE 334.1 SOURCES OF PRECIPITATING ENERGETIC PARTICLES 334.2 CHANGES IN CHEMICAL COMPOSITION 34
4.2.1 Modelling EPP effects on the chemical composition . . . . . . 354.3 OBSERVATIONS OF EPP EFFECTS ON THE ATMOSPHERE 36
4.3.1 NOx enhancement and transport . . . . . . . . . . . . . . . . . 374.3.2 Mesospheric HOx production and ozone loss . . . . . . . . . . 41
5 SUMMARY AND CONCLUDING REMARKS 44
REFERENCES 48
8
LIST OF ORIGINAL PUBLICATIONS
I Seppälä, Annika, Pekka T. Verronen, Erkki Kyrölä, Seppo Hassinen, Leif Back-man, Alain Hauchecorne, Jean Loup Bertaux, and Didier Fussen: Solar ProtonEvents of October-November 2003: Ozone depletion in the Northern hemispherepolar winter as seen by GOMOS/Envisat. Geophysical Research Letters, 31,L19107, doi: 10.1029/2004GL021042, 2004.
II Seppälä, Annika, Pekka T. Verronen, Viktoria F. Sofieva, Johanna Tamminen,Erkki Kyrölä, Craig J. Rodger, and Mark A. Clilverd: Destruction of the TertiaryOzone Maximum During a Solar Proton Event. Geophysical Research Letters,33, L07804, doi: 10.1029/2005GL025571, 2006.
III Clilverd, Mark A., Annika Seppälä, Craig J. Rodger, Pekka T. Verronen,and Neil R. Thomson: Ionospheric evidence of thermosphere-to-stratospheredescent of polar NOx. Geophysical Research Letters, 33, L19811, doi:10.1029/2006GL026727, 2006.
IV Clilverd, Mark A., Annika Seppälä, Craig J. Rodger, Neil R. Thomson, JanosLichtenberger, and Peter Steinbach: Temporal variability of the descent of high-altitude NOx inferred from ionospheric data. Accepted for publication in Journalof Geophysical Research, doi: 10.1029/2006JA012085, 2007.
V Seppälä, Annika, Pekka T. Verronen, Mark A. Clilverd, Cora E. Randall, Jo-hanna Tamminen, Viktoria Sofieva, Leif Backman, and Erkki Kyrölä: Arctic andAntarctic polar winter NOx and energetic particle precipitation in 2002–2006.Geophysical Research Letters, 34, L12810, doi: 10.1029/2007GL029733, 2007.
In PUBL. I, PUBL. II, and PUBL. V A. Seppälä was responsible for the initial idea,the data selection and analysis, model calculations (PUBL. II) and interpretation of theresults, as well as writing of the manuscripts. In PUBL. III and PUBL. IV A. Seppälämade the model calculations and selected and analysed the GOMOS data (PUBL. IV),was involved in the interpretation of the results and contributed to the writing of themanuscripts.
9
1 INTRODUCTION
After the British Antarctic Survey scientists discovered the ozone hole over Antarcticain 1985 [Farman et al., 1985] the study of the variations in ozone content, and thedifferent sources affecting the ozone loss, became a major concern. Ozone loss causedby Solar Proton Events was initially observed by means of rocket measurements in 1969[Weeks et al., 1972]. A few years later the relation between Solar Proton Events andatmospheric production of ozone destroying nitric oxide, NO, was identified [Crutzenet al., 1975; Heath et al., 1977]. Around the same time the first satellite observationsof nitric oxide were made over polar regions [Rusch and Barth, 1975]. Over the yearsseveral studies of Solar Proton Event effects on the atmosphere have been published:The earlier work of Crutzen and Solomon [1980], McPeters et al. [1981], and Solomonet al. [1983] has been followed by several studies by Jackman et al. [Jackman andMcPeters, 1985; Jackman and Meade, 1988; Jackman et al., 1990; Jackman et al., 1993;Jackman et al., 1995, 2000], McPeters et al. [McPeters and Jackman, 1985; McPeters,1986], and others [Reid et al., 1991; Callis et al., 1998].
Following the Solar Proton Events of October–November 2003 the severe impactthat particle forcing could have on the atmosphere became of a wider interest to at-mospheric scientists. Much of this was because these were the first large Solar ProtonEvents that occurred in the present satellite-era. For the first time continuous atmo-spheric observations of the particle forcing effect were available also from the nightsideof the atmosphere. The Solar Proton Events which took place only a few years before,in July 2000, had not attained such a high visibility [Jackman et al., 2001]. With thelaunch of the European Space Agency’s environmental satellite Envisat in 2002, contin-uous observations of the polar atmospheres were at hand at the time of the 2003 events.The October–November 2003 Solar Proton Events have already led to a number ofpublications including PUBL. I, von Clarmann et al. [2005]; Degenstein et al. [2005];Jackman et al. [2005]; Lopéz-Puertas et al. [2005a,b]; Orsolini et al. [2005]; Randallet al. [2005]; Rohen et al. [2005]; Semeniuk et al. [2005]; Verronen et al. [2005] andClilverd et al. [2006b].
In the past years the scientific community has truly awoken to the importanceof all different sources contributing to the ozone balance in the atmosphere and theglobal climate [see e.g. Konopka et al., 2007]. One of these sources is the odd nitrogenproduced by precipitation of energetic particles. The odd nitrogen, or NOx, is producedat high altitudes by solar storms or by the same mechanisms that produce the beautifulhigh latitude aurora, and may in the course of time be transported to the stratosphere,with the aid of dynamics. In the stratosphere the odd nitrogen is able to affect theozone balance through chemistry [Crutzen, 1970], a discovery which in part led toCrutzen’s Nobel prize in Chemistry in 1995. The ozone changes can further lead tochanges in temperature and ultimately in atmospheric dynamics. These in turn arehighly important to the global climate.

10
As a sign of the increased understanding of the impact that high energy parti-cle precipitation has on the composition, dynamics and chemistry of the middle at-mosphere, the altitude region covering the stratosphere, mesosphere and lower thermo-sphere, the following Key Scientific Questions were, among others, posed in a SummaryReport of the NASA Workshop on Sun Climate Connections held at the University ofArizona in March, 2000 [Sprigg, 2000]:
For altitudes from 35 to 120 km, what is the observed character of the odd nitro-gen within and near the polar night, due to EEP (Energetic Electron Precipita-tion), due to auroral effects, and due to solar protons and electrons during SPEs(Solar Proton Events)?
What is the observed flux of odd nitrogen into the stratosphere from the meso-sphere during the course of a solar cycle and what is its primary source?
Can ozone changes due to EEP, SPEs, and auroral effects alter stratospherictemperature, winds, and the phase and amplitude of the long planetary waves?In the stratosphere? In the troposphere?
What is the importance of EEP, SPEs, and auroral effects in influencing decadaland shorter term variations of the Earth’s climate? How does this variationcompare with effects due to solar UV flux changes and with the effects of anthro-pogenic forcing?
In order to answer these important questions, global, and especially polar, obser-vations of ozone and odd nitrogen (NO and NO2 in particular) in the stratosphere–mesosphere–lower thermosphere region are needed. Since the key interests are thesources and the influence of the produced odd nitrogen, maintained in the atmospherein the darkness of the polar night, measurement techniques capable of measuring theatmospheric composition without any sunlight present are needed. The need to see intothe polar night promotes the use of stellar occultation technique, previously not been ex-tensively used in satellite observations, over the widely used solar occultation and limbscattering techniques. In order to study the possible effects on climate, the observationsmust extend over long periods of time, long meaning several years, even decades. Thiswould be required also in the case of resolving the odd nitrogen production throughoutthe solar cycle.
In this work several of the questions raised by the NASA workshop have beenaddressed. The main emphasis is the effect of Solar Proton Events, as well as energeticparticle precipitation in general, on odd nitrogen in the middle atmosphere. This hasmainly been done with the aid of observations performed by the GOMOS instrumentoriginally proposed by Finland, France and Belgium, on board the European SpaceAgency’s Envisat satellite launched in 2002. The full name of the instrument, whichwas first proposed to the European Space Agency in 1988, is Global Ozone Monitoring

11
by Occultation of Stars. Among other species, GOMOS measures O3 and NO2 in thestratosphere and mesosphere with global coverage.
This work is composed of five original publications listed on page 8. The resultsof these publications are summarised on page 44. The chemistry related to the ozonebalance of the middle atmosphere and to this work is presented in Chapter 2. Chap-ter 2 also includes a general description of the dynamics and vertical and horizontaltransport in the polar atmosphere, most relevant regarding the results presented later. InChapter 3 two measurement techniques are introduced: that of the GOMOS instrumentand the subionospheric Very Low Frequency (VLF) radio wave propagation. These arethen utilised in the observation of energetic particle induced effects on the atmosphericcomposition which are presented in Chapter 4. The sources of the precipitating en-ergetic particles and the coupling mechanism of the particles with the atmosphere arealso discussed. Summary of the results as well as concluding remarks and discussionon some future prospects are given in Chapter 5.
12
2 CHEMISTRY AND DYNAMICS
This chapter presents the chemistry related to the ozone balance in the upper-stratosphere and mesosphere. After the introduction of pure oxygen chemistry, the roleof odd nitrogen and odd hydrogen in the ozone balance are discussed. Other gases rel-evant to the general ozone balance in the stratosphere [see e.g. Brasseur and Solomon,2005], such as chlorine and bromine species, which are not known to be significantlyperturbed by energetic particle precipitation, are not considered here in detail. Exten-sive reviews on atmospheric chemistry are provided in, e.g., Seinfeld and Pandis [1998],Finlayson-Pitts and Pitts [1999], and Brasseur and Solomon [2005].
As the distribution of minor constituents in the middle atmosphere (from about20 km to about 100 km) is affected by both chemical and dynamical processes, a generaldescription of the dynamics and transport processes in the polar atmosphere, to whichthis work emphasises on, are given in section 2.2.
2.1 OZONE AND RELATED CHEMISTRY IN THE MIDDLE ATMO-SPHERE
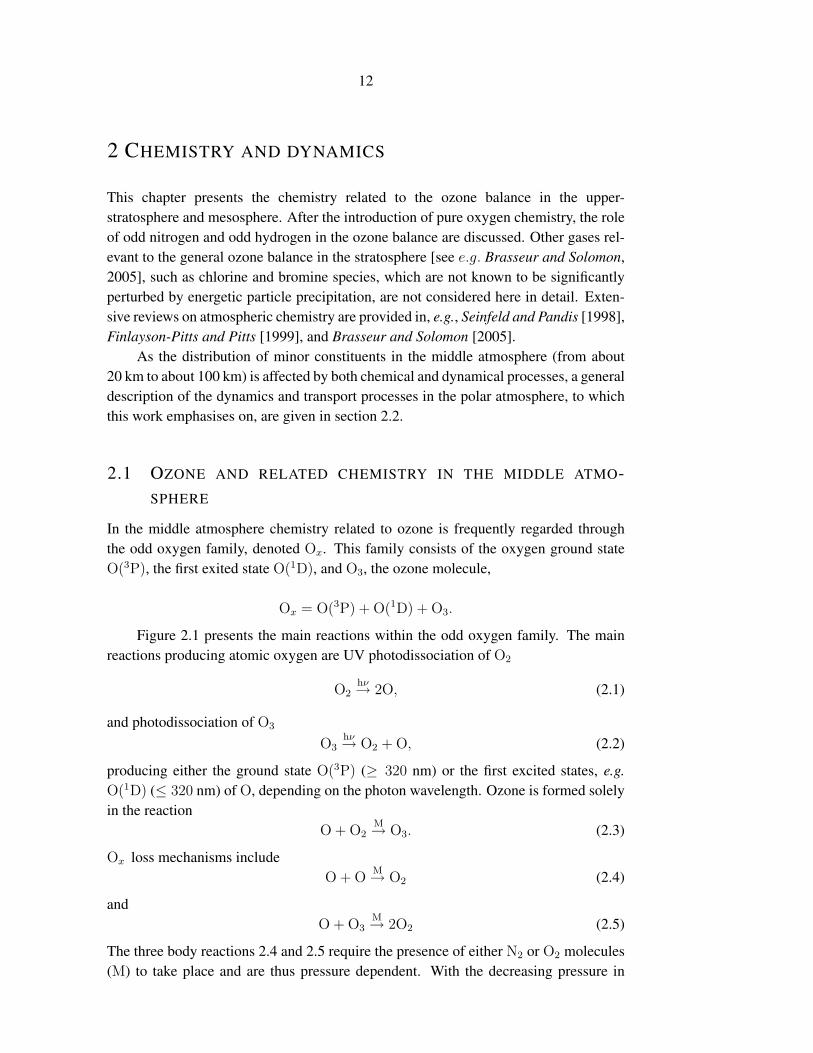
In the middle atmosphere chemistry related to ozone is frequently regarded throughthe odd oxygen family, denoted Ox. This family consists of the oxygen ground stateO(3P), the first exited state O(1D), and O3, the ozone molecule,
Ox = O(3P) + O(1D) + O3.
Figure 2.1 presents the main reactions within the odd oxygen family. The mainreactions producing atomic oxygen are UV photodissociation of O2
O2hν→ 2O, (2.1)
and photodissociation of O3
O3hν→ O2 + O, (2.2)
producing either the ground state O(3P) (≥ 320 nm) or the first excited states, e.g.O(1D) (≤ 320 nm) of O, depending on the photon wavelength. Ozone is formed solelyin the reaction
O + O2M→ O3. (2.3)
Ox loss mechanisms includeO + O
M→ O2 (2.4)
andO + O3
M→ 2O2 (2.5)
The three body reactions 2.4 and 2.5 require the presence of either N2 or O2 molecules(M) to take place and are thus pressure dependent. With the decreasing pressure in

13
O2
O(1D)
O3 O(3P)
hν
hν
hν
hν
O O3
O+M
O2+M
M
FIGURE 2.1. Main chemical reactions of the Ox-compounds (Based on Fig. 5.1 of Shimazaki[1984]). The dashed circle represents Ox source molecule. Note that photodissoci-ation of O3 also produces O2 (2.2).
the upper mesosphere and lower thermosphere these reactions become slow, resultingin larger abundance and longer lifetime of O at high altitudes compared with loweraltitudes. During nighttime there is no production of O (2.1, 2.2), but atomic oxygen isconverted to O3 by the fast reaction (2.3). This results in higher abundance of O3 duringnighttime in the mesosphere and lower thermosphere, whereas in the stratosphere thediurnal variation of O3 is negligible due to the short chemical lifetime of atomic oxygen.
2.1.1 NOx chemistry
The NOx gases N, NO, and NO2 are formed primarily in the stratosphere throughthe the reaction N2O + O(1D)→ 2NO, and in the thermosphere through both pho-todissociation and photoionisation of N2. Precipitating charged particles produce NOx
through ionisation or dissociative ionisation of N2 and O2 molecules, which results inthe formation of N+
2 , O+2 , N+, O+, and NO+. The reactions of these ions lead to forma-
tion of both the excited nitrogen atoms N(2D) and the ground state of nitrogen N(4S)
[Rusch et al., 1981; Solomon et al., 1982]:
N+2 + O→ NO+ + N (2.6)
N+2 + e− → N + N (2.7)
O+ + N2 → NO+ + N (2.8)
N+ + O2 → O+ + NO→ NO+ + O→ O+2 + N (2.9)
NO+ + e− → N + O. (2.10)
Almost all of the excited nitrogen N(2D) further reacts with O2 to form NO in thereaction
N + O2 → NO + O, (2.11)

14
N(2D)
N
N2
N2O
NO
NO2
N2O5
NO3
hν
hν
hνhν
hν
hν
hν
hν
hν
O2
M
NO
N
NO2
O(1D)
O3
O3
O3
ClOHO2
NO
NO2+M
NO3+M
FIGURE 2.2. Main chemical reactions of the NOx-compounds (Based on Fig. 5.4 of Shimazaki[1984]). The dashed circles represent NOx source molecules.
providing a significant pathway to NO production. The produced NO is converted intoNO2 in various reactions (mainly in reaction 2.16) [see e.g. Brasseur and Solomon,2005, pp. 336-341], but the formed NO2 is quickly converted back to NO either inreaction with O
NO2 + O→ NO + O2, (2.12)
or by photolysis
NO2hν→ NO + O(3P). (2.13)
During nighttime, when little O is available, and the above reactions are ineffective, allNO is rapidly converted to NO2 after sunset.
In the upper stratosphere and above, the loss of NO is mainly through photodisso-ciation
NOhν→ N(4S) + O, (2.14)
at wavelengths shorter than 191 nm, followed by
N(4S) + NO→ N2 + O, (2.15)
known as the cannibalistic loss, where two NO molecules are lost per absorbed photon.Some of the main reactions within the NOx family are presented in Figure 2.2.
The nitrogen compounds are an important factor in catalytic ozone loss in thestratosphere. NOx cycles which lead to ozone destruction but leave the NOx com-pounds intact are:
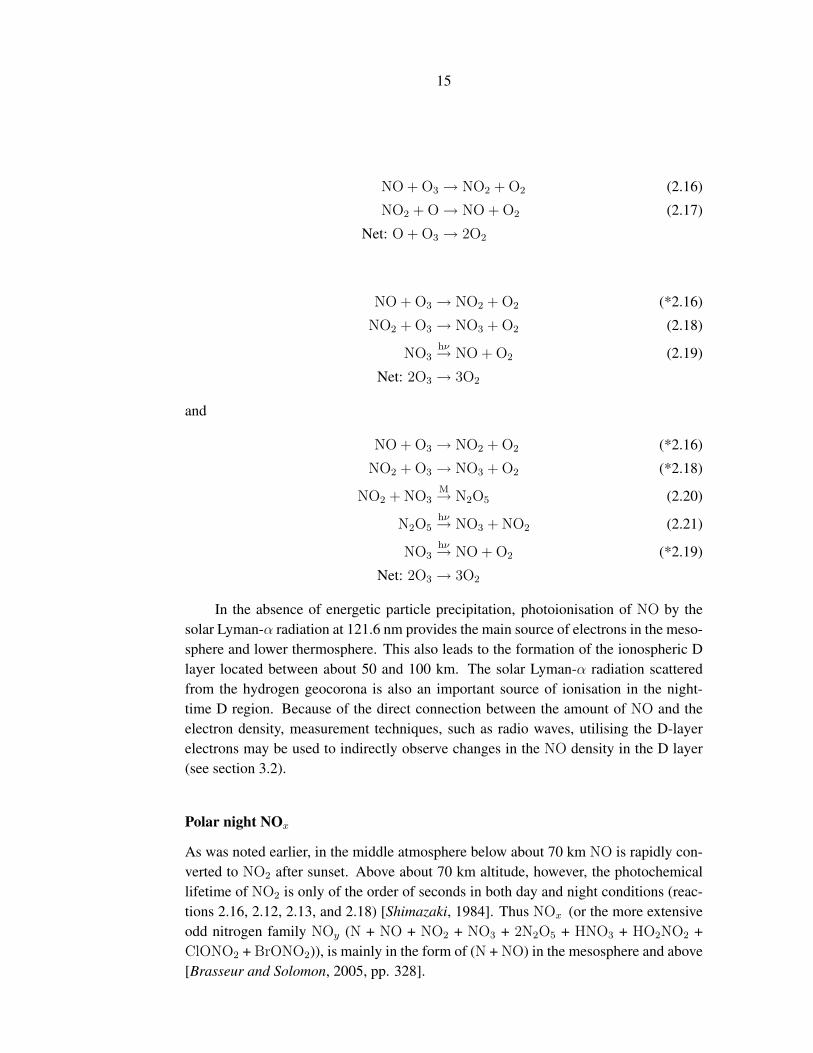
15
NO + O3 → NO2 + O2 (2.16)
NO2 + O→ NO + O2 (2.17)
Net: O + O3 → 2O2
NO + O3 → NO2 + O2 (*2.16)
NO2 + O3 → NO3 + O2 (2.18)
NO3hν→ NO + O2 (2.19)
Net: 2O3 → 3O2
and
NO + O3 → NO2 + O2 (*2.16)
NO2 + O3 → NO3 + O2 (*2.18)
NO2 + NO3M→ N2O5 (2.20)
N2O5hν→ NO3 + NO2 (2.21)
NO3hν→ NO + O2 (*2.19)
Net: 2O3 → 3O2
In the absence of energetic particle precipitation, photoionisation of NO by thesolar Lyman-α radiation at 121.6 nm provides the main source of electrons in the meso-sphere and lower thermosphere. This also leads to the formation of the ionospheric Dlayer located between about 50 and 100 km. The solar Lyman-α radiation scatteredfrom the hydrogen geocorona is also an important source of ionisation in the night-time D region. Because of the direct connection between the amount of NO and theelectron density, measurement techniques, such as radio waves, utilising the D-layerelectrons may be used to indirectly observe changes in the NO density in the D layer(see section 3.2).
Polar night NOx
As was noted earlier, in the middle atmosphere below about 70 km NO is rapidly con-verted to NO2 after sunset. Above about 70 km altitude, however, the photochemicallifetime of NO2 is only of the order of seconds in both day and night conditions (reac-tions 2.16, 2.12, 2.13, and 2.18) [Shimazaki, 1984]. Thus NOx (or the more extensiveodd nitrogen family NOy (N + NO + NO2 + NO3 + 2N2O5 + HNO3 + HO2NO2 +ClONO2 + BrONO2)), is mainly in the form of (N + NO) in the mesosphere and above[Brasseur and Solomon, 2005, pp. 328].

16
2.1.2 HOx chemistry
The hydrogen radicals, H, OH, and HO2, denoted as HOx, are highly reactive gases andimportant to the odd oxygen balance particularly in the mesosphere. The main sourceof HOx in the mesosphere and above is the (UV) photolysis of water vapour. In thestratosphere and lower mesosphere HOx is formed in the reaction of water vapour withthe O(1D) atom. HOx is also produced through precipitation of energetic particles: Theinitial production of ion pairs is followed by formation and reactions of water clusterions which result in the production of HOx. The complex ion chemistry involved inthis process is discussed e.g. by Solomon et al. [1981] and is briefly presented below.
The produced O+2 ions react to form O+
2 · H2O ions through
O+2 + O2
M→ O+4 (2.22)
O+4 + H2O→ O+
2 · H2O + O2. (2.23)
The formed hydrate ions then further react in one of the following cycles to produceHOx:
O+2 · H2O + H2O→ H3O
+ ·OH + O2 (2.24)
H3O+ ·OH + e− → H + OH + H2O (2.25)
Net: H2O→ H + OH,
or
O+2 · H2O + H2O→ H3O
+ ·OH + O2 (2.26)
H3O+ ·OH + H2O→ H3O
+ · H2O + OH (2.27)
H3O+ · H2O + nH2O→ H3O
+(H2O)n+1 (2.28)
H3O+(H2O)n+1 + e− → H + (n+ 2)H2O (2.29)
Net: H2O→ H + OH,
or
O+2 · H2O + H2O→ H+ · H2O + OH + O2 (2.30)
H+ · H2O + nH2O→ H3O+(H2O)n (2.31)
H3O+(H2O)n + e− → H + (n+ 1)H2O (2.32)
Net: H2O→ H + OH.
The HOx radicals are very reactive and thus have a very short chemical lifetime inthe atmosphere; below 80 km the lifetime of the HOx family is of the order of minutesto hours. As a result, the HOx distribution is independent of transport processes. Above80 km the chemical lifetime of HOx increases but because of the low abundance ofwater vapour the concentration of HOx at these altitudes is also small.
17
HO2
OHH
H2O
H2 H2O2
hν
hν
hνO(1D)
hν
H
OHO
O3
O3
O O3OH
OH
O3
OH
HO2
O(1D)
HO2
NOCl
HO2 HO3 HNO3
O2+M
FIGURE 2.3. Main chemical reactions of the HOx-compounds (Based on Fig. 5.3 of Shimazaki[1984]). The dashed circles represent HOx source molecules and the boxes HOx
reservoirs.
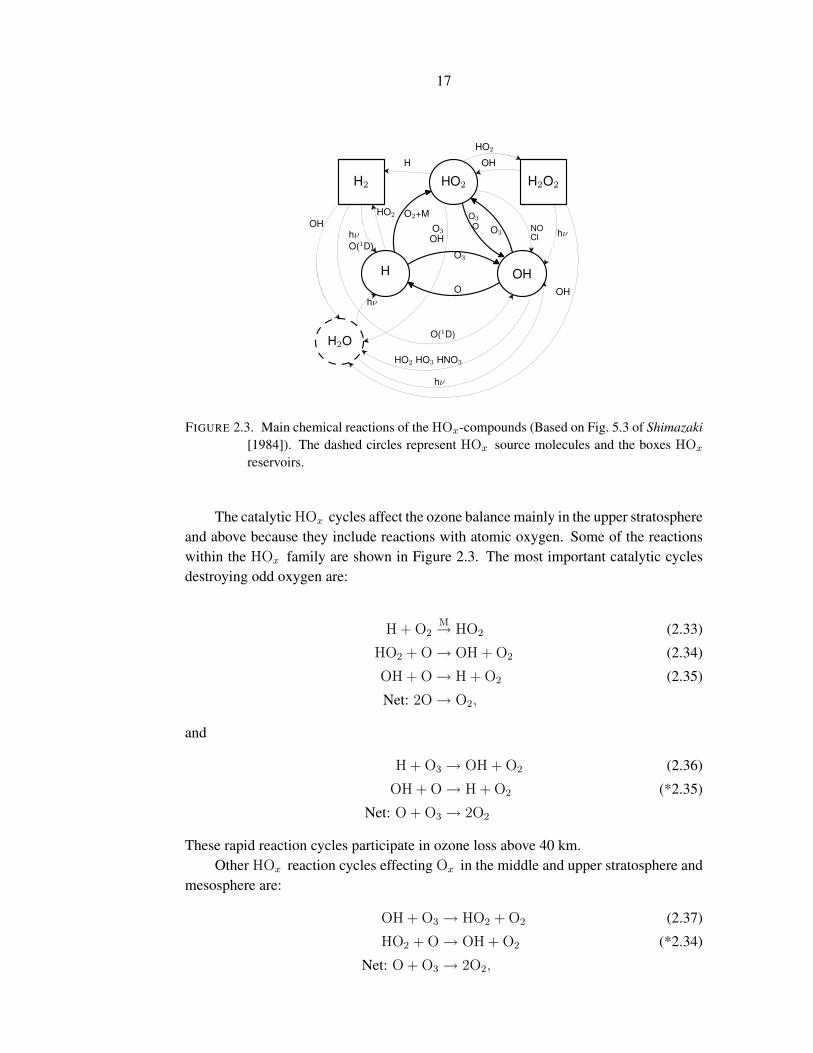
The catalytic HOx cycles affect the ozone balance mainly in the upper stratosphereand above because they include reactions with atomic oxygen. Some of the reactionswithin the HOx family are shown in Figure 2.3. The most important catalytic cyclesdestroying odd oxygen are:
H + O2M→ HO2 (2.33)
HO2 + O→ OH + O2 (2.34)
OH + O→ H + O2 (2.35)
Net: 2O→ O2,
and
H + O3 → OH + O2 (2.36)
OH + O→ H + O2 (*2.35)
Net: O + O3 → 2O2
These rapid reaction cycles participate in ozone loss above 40 km.Other HOx reaction cycles effecting Ox in the middle and upper stratosphere and
mesosphere are:
OH + O3 → HO2 + O2 (2.37)
HO2 + O→ OH + O2 (*2.34)
Net: O + O3 → 2O2,
18
and
OH + O→ H + O2 (*2.35)
H + O2M→ HO2 (*2.33)
HO2 + O3 → OH + 2O2 (2.38)
Net: O + O3 → 2O2
2.1.3 Halogen chemistry
Reactions with halogen compounds, chlorine, fluorine, bromine, and iodine, are impor-tant to stratospheric ozone balance in general. The source of halogens is the release ofhalocarbons from the surface from where they are transported through the troposphereto the stratosphere, where they break up and release the halogens. The released Cl, F,and Br rapidly react with ozone to form ClO, FO and BrO. The ClOx (Cl + ClO) andBrOx (Br + BrO) compounds destroy Ox in catalytic reaction cycles like those of theNOx and HOx species:
X + O3 → XO + O2 (2.39)
XO + O→ X + O2 (2.40)
Net: O + O3 → 2O2
and
X + O3 → XO + O2 (*2.39)
XO + HO2 → HOX + O2 (2.41)
HOXhν→ X + OH (2.42)
OH + O3 → HO2 + O2 (*2.37)
Net: 2O3 → 3O2
where X may be either Cl or Br. For chlorine (X = Cl), the first of these cyclesis important to the ozone balance of the upper stratosphere. The latter cycle is moreimportant near 20 km altitude. Several other reaction cycles affecting ozone in thelower stratosphere, as well as chemistry related to chlorine activation in the presence ofpolar stratospheric clouds, are presented in e.g. Brasseur and Solomon [2005]. Chlorinespecies have been found to be affected during Solar Proton Events when the amountof HOx in the middle atmosphere has increased [Lopéz-Puertas et al., 2005b; vonClarmann et al., 2005]. These effects are discussed later in section 4.2.

19
FIGURE 2.4. Approximate location of the Northern Hemisphere Polar Night Jet, inside whichthe polar vortex is formed, and the wind vector directions (zonal u, meridional v andvertical w).
2.2 DYNAMICS AND TRANSPORT
This section gives a general description of the dynamical and transport processes in themiddle atmosphere. As this work is focused on the polar areas, more attention is paidto the processes characteristic of the polar atmosphere.
In the winter polar middle atmosphere transport is largely determined by the polarvortex. In the winter pole, near the polar night terminator, strong temperature gradientslead to formation of the Polar Night Jet. As shown in Figure 2.4, the Polar NightJet is a strong eastward (westerly) wind in the upper stratosphere-lower mesospherenear 60◦N/S latitude, formed due to the thermal wind balance [Solomon, 1999; Holton,2004]. The winds in the Polar Night Jet, which reach their peak of about 80 m/s near60 km altitude, act as a transport barrier between polar and mid-latitude air, blockingmeridional transport and isolating the air in the polar stratosphere and thus formingthe polar vortex. The edge of the vortex is usually near 60◦N/S and it extends fromapproximately 16 km to the mesosphere. The isolation is greater, and the polar vortexmore stable, in the Antarctic where there is less wave activity affecting the vortex thanin the Arctic. In the Arctic, the atmospheric wave activity disturbs the vortex, leadingto greater mixing and faster downward motion, compared with those in the Antarcticvortex [Solomon, 1999]. The approximate location of the Polar Night Jet is presentedin Figure 2.4 and the approximate location of the edge of the polar vortex in Figure 2.5.
The large-scale meridional circulation in the stratosphere is determined by theBrewer-Dobson circulation. The Brewer-Dobson circulation is formed by rising mo-tion from the troposphere to the stratosphere in the tropics, poleward transport at strato-

20
FIGURE 2.5. Different phenomena in the winter pole middle atmosphere. On the left side arepresented phenomena related to ionisation by precipitating protons, subionosphericradio wave propagation and catalytic reaction cycles of the HOx and NOx gases.Also shown are the altitudes regions where the cycles are effective (as indicated bythe curly brackets). On the right are shown phenomena related to dynamics. Theapproximate location of the polar night jet is presented as red circle and the darkercolour indicates the area where the peak winds are observed. The red curve depictsthe approximate location of the polar vortex. Location of latitudes 45◦ and 60◦ areindicated with the respective numbers.
spheric altitudes and sinking motion at mid- and high latitudes. In the mesosphere, themeridional circulation is formed by a single cell in which rising motion takes place inthe summer pole starting from the stratosphere, pole-to-pole transport in mesosphere-lower-thermosphere, and downward motion in the winter pole mesosphere, down to thestratosphere.
An important factor to be taken into account in the atmospheric dynamics is theeffect of waves. Atmospheric waves are also the main driver of the mean circulation[Salby and Callaghan, 2006]. Planetary (i.e. Rossby) and gravity waves affect bothvertical and horizontal transport and may induce great transient deviations from ob-served mean values. Gravity waves, which are formed from vertical displacement ofair parcels, are highly important for mesospheric dynamics but less important in thestratosphere. The waves break at mesospheric altitudes, where the wave amplitude

21
has grown so large that the vertical temperature perturbation results in the air parcelsbecoming convectively unstable i.e. they break. In the mesosphere gravity waves prop-agate mainly westward in the winter and eastward during summer. Large-scale plane-tary (Rossby) waves are induced by orography and land-sea distribution. These wavespropagate westward (with respect to the mean flow), upwards (on westerly mean zonalwind), and equatorwards and propagate in the stratosphere mainly during wintertime[Holton, 2004; Brasseur and Solomon, 2005]. Breaking Rossby waves causes rapidirreversible mixing of the air parcels. Sudden Stratospheric Warming events, whichare mainly observed in the Northern Hemisphere, arise from enhanced propagation ofplanetary waves from the troposphere to the stratosphere. These events are marked bythe polar vortex becoming highly distorted and finally breaking down with accompany-ing warming of the polar stratosphere leading to formation of easterly circumpolar flow[Holton, 2004]. The sudden warming of the polar stratosphere arises from strong down-ward motion taking place in the polar region and simultaneous upward motion in thetropics. After the warming event the polar vortex is generally restored, and occasion-ally becomes exceptionally strong as in the Northern Hemisphere in February–March2004 [Manney et al., 2005]. Sudden Stratospheric Warmings have also been shown tobe associated with mesospheric cooling events [Siskind et al., 2005].
2.2.1 Horizontal transport
Horizontal transport in the stratosphere and mesosphere is determined by winds in thezonal (longitudinal, u) and meridional (latitudinal, v) directions as presented in Fig-ure 2.4. In the polar winter stratosphere the mean zonal winds are in general directedeastwards (westerlies) along with the polar night jet. At higher altitudes the zonal windsremain westerly up to about 90 km altitude above which the wind direction is reversed[Brasseur and Solomon, 2005]. The mean wintertime zonal wind speeds are tens ofmeters per second throughout the middle atmosphere. The mean meridional circulationin the winter pole is driven by the Brewer-Dobson circulation and with wind speedsof a few m/s is slow compared to the mean zonal wind. However as the wave activ-ity, particularly in the winter hemisphere, may influence the direction of the wind flow,winds in the meridional direction may increase substantially [Holton, 2004; Brasseurand Solomon, 2005].
2.2.2 Descent of air in the polar vortex
Inside the polar vortex the descent varies from year to year but also with respect tothe distance from the vortex edge and altitude [Manney et al., 1994; Rosenfield andSchoeberl, 2001]. The wintertime descent is known to be more rapid in the vortexcore (compared to the vortex edge) at the beginning of the winter in the northern hemi-sphere and generally more rapid at high altitudes than at lower altitudes. Callaghan

22
and Salby [2002] have shown from model simulations that, in general, the maximumdescent rates in the wintertime Northern Hemisphere middle and upper stratosphere arefound near 60◦ latitude (2 mm/s), and not over the pole (1.8 mm/s). At lower altitudesthe descent is slower, with vertical descent rates of 0.4-0.7 mm/s (1.2-1.8 km/month)in the Antarctic middle stratosphere [Kawamoto and Shiotani, 2000]. In the lowerstratosphere mean downwelling rates are of the order of 1 mm/s but increase to severalmm per second in the mesosphere [Callaghan and Salby, 2002]. Model simulations ofRosenfield et al. [1994] have shown that in both hemispheres the descent rates increasemarkedly with height due to increasing cooling rates. At higher altitudes there is alsosignificant variability: In the Arctic, air parcels initialised at 50 km altitude at the be-ginning of November descent 27 km in less than five months (on average 6 km/month),whereas parcels initiated at the same level in January experience the same descent inunder three months (on average 9 km/month). In the Antarctic air parcels initialised at52 km in March descended 26-29 km in under eight months (on average 3.4 km/month).Those initialised in July reach the same final altitudes in only four months (on average6.9 km/month), descending 14 km in the first month alone.
In the NH, where the polar vortex is more disturbed than in the SH, there is moreyear to year variation in the descent, as changes in the wave activity and frequently oc-curring stratospheric warmings affect the vortex conditions [Rosenfield and Schoeberl,2001; Brasseur and Solomon, 2005]. Calculating the fraction of upper stratosphericand mesospheric air in the spring time polar vortex during polar winters of 1992–2000,Rosenfield and Schoeberl [2001] found that up to 90 % of stratospheric air originatedfrom above 45 km, unless unusually late vortex formation (NH and SH) or major strato-spheric warmings (NH) occurred. As a result of late vortex formation or major strato-spheric warming only a small fraction (less than 10 %) of stratospheric air was foundto be of high altitude origin.
2.2.3 Transport and chemical lifetimes
The photochemical lifetime (e-folding lifetime, photochemical time constant) ofspecies X , τchem, is the time required for the concentration of X to decrease to 1/e
of the initial concentration [Brasseur and Solomon, 2005]. The time constant for trans-port (dynamical processes) τdyn (time required for the concentration of X to decreaseto 1/e of the initial concentration as a result of transport by winds) can be similarlyderived. Table 2.1 presents approximate photochemical lifetimes of the Ox, NOx, andHOx families and τdyn for zonal, meridional, and vertical winds at four different al-titudes. Whenever the chemical lifetime exceeds that of transport, the constituent isunder dynamical control. In the opposite situation the constituent is under photochem-ical equilibrium. If the timescales are comparable, both processes must be considered.
23
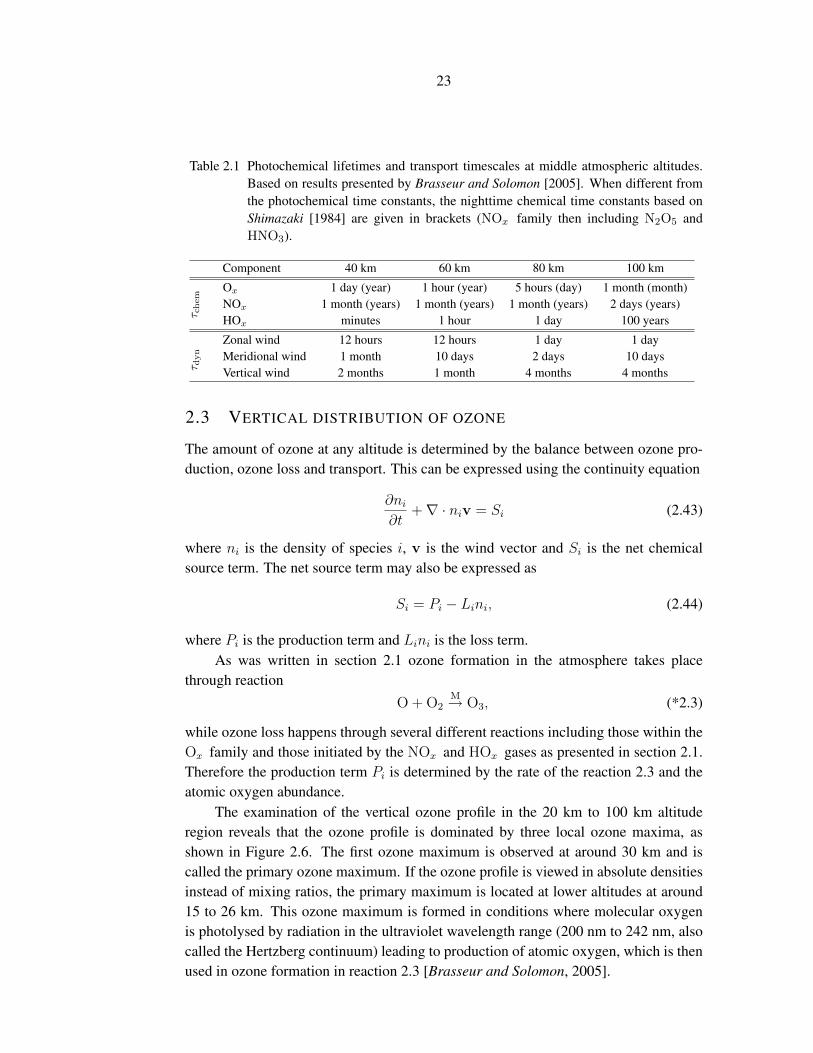
Table 2.1 Photochemical lifetimes and transport timescales at middle atmospheric altitudes.Based on results presented by Brasseur and Solomon [2005]. When different fromthe photochemical time constants, the nighttime chemical time constants based onShimazaki [1984] are given in brackets (NOx family then including N2O5 andHNO3).
Component 40 km 60 km 80 km 100 km
τ chem
Ox 1 day (year) 1 hour (year) 5 hours (day) 1 month (month)NOx 1 month (years) 1 month (years) 1 month (years) 2 days (years)HOx minutes 1 hour 1 day 100 years
τ dyn
Zonal wind 12 hours 12 hours 1 day 1 dayMeridional wind 1 month 10 days 2 days 10 daysVertical wind 2 months 1 month 4 months 4 months
2.3 VERTICAL DISTRIBUTION OF OZONE
The amount of ozone at any altitude is determined by the balance between ozone pro-duction, ozone loss and transport. This can be expressed using the continuity equation
∂ni∂t
+∇ · niv = Si (2.43)
where ni is the density of species i, v is the wind vector and Si is the net chemicalsource term. The net source term may also be expressed as
Si = Pi − Lini, (2.44)
where Pi is the production term and Lini is the loss term.As was written in section 2.1 ozone formation in the atmosphere takes place
through reactionO + O2
M→ O3, (*2.3)
while ozone loss happens through several different reactions including those within theOx family and those initiated by the NOx and HOx gases as presented in section 2.1.Therefore the production term Pi is determined by the rate of the reaction 2.3 and theatomic oxygen abundance.
The examination of the vertical ozone profile in the 20 km to 100 km altituderegion reveals that the ozone profile is dominated by three local ozone maxima, asshown in Figure 2.6. The first ozone maximum is observed at around 30 km and iscalled the primary ozone maximum. If the ozone profile is viewed in absolute densitiesinstead of mixing ratios, the primary maximum is located at lower altitudes at around15 to 26 km. This ozone maximum is formed in conditions where molecular oxygenis photolysed by radiation in the ultraviolet wavelength range (200 nm to 242 nm, alsocalled the Hertzberg continuum) leading to production of atomic oxygen, which is thenused in ozone formation in reaction 2.3 [Brasseur and Solomon, 2005].

24
FIGURE 2.6. Sample nighttime ozone profile showing the three local ozone maxima: The pri-mary ozone maximum around 30 km altitude, secondary maximum around 90 kmand the tertiary ozone maximum around 70 km altitude. The black dashed line isthe average nighttime ozone profile in the Northern Hemisphere polar area (latitudes60◦–90◦) calculated from GOMOS measurements over the year 2003. The light redshaded area represents the standard deviation of the measurements. The amount ofozone is presented in volume mixing ratios (VMR). Volume mixing ratio is a di-mensionless variable that presents the fraction of a given substance in the studied airvolume (density of substance/total density of air). In the atmosphere, ozone mixingratios are frequently presented in terms of parts per million volume, ppmv.
The secondary ozone maximum is observed near the mesopause at altitudesaround 80 km to 90 km in absolute densities, and around 90 km altitude in volumemixing ratios (as presented in Figure 2.6). This maximum arises from atomic oxygenformation from O2 photolysis by the far ultraviolet radiation in the Schuman Rungecontinuum and Schuman Runge bands at wavelengths 130–175 nm and 175–200 nmrespectively [Brasseur and Solomon, 2005], and downward transport of atomic oxygenfrom the thermosphere.
The tertiary ozone maximum observed most pronouncedly in ozone mixing ratioprofile around 70 km altitude does not originate from increase in the production termas the first and the second maximum. The tertiary maximum which is observed closeto the polar night terminator, is rather due to combination of decrease in atomic oxy-gen loss [Marsh et al., 2001] and atmospheric dynamics [Hartogh et al., 2004]. Marshet al. [2001] proposed that the ozone maxima occurs near the polar night terminator

25
around 72 km altitude as a result of less HOx production from reduced water vapourphotolysis, which decreases with increasing solar zenith angles in the polar night ter-minator area. In the conditions when the tertiary ozone maximum occurs, water vapourphotolysis has significantly decreased but shorter wavelength radiation is still able toproduce atomic oxygen thus providing ozone production source. Using a three dimen-sional model of the middle atmosphere Hartogh et al. [2004] found that, although thetwo phenomena are chemically separate, the tertiary maximum is connected by dy-namics to the ozone minimum observed around 80 km altitude. They also found that,as meridional wind transports the air from the polar night terminator area to the polarnight domain, the efficiency of chemical reactions is changed due to the odd oxygendistribution of the tertiary ozone maximum and the ozone minimum.
2.4 VERTICAL DISTRIBUTION OF NOx
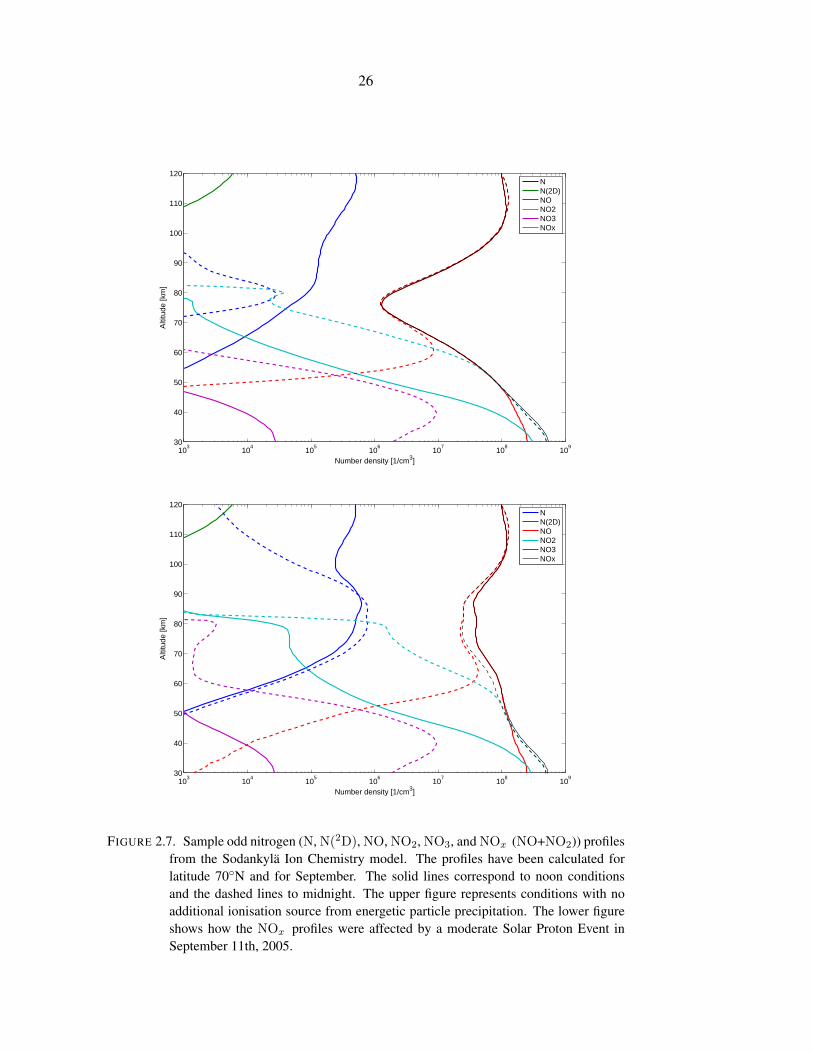
Figure 2.7 shows the vertical distribution of several NOx family species calculated byion and neutral chemistry model. The profiles are shown for both noon and midnight.The upper figure represents situation when no additional ionisation source is present,the lower figure the situation during a moderate Solar Proton Event, with ionisationfrom proton precipitation. The figure shows the strong diurnal variation of the individ-ual NOx gases while the total NOx has only small diurnal variation. During daytime,above about 50 km the main NOx component is NO while during nighttime the amountof NO decreases below about 70 km and NO2 becomes a significant NOx component.
In the lower thermosphere, where a NOx maximum is observed, NOx is formedthrough dissociation and ionisation of N2, either by solar radiation or by energetic par-ticles, which are an important source of NOx in the lower thermosphere. From thelower thermosphere the produced NOx is transported downwards to the mesosphere.Another NOx maximum is located in the stratosphere. There the main source of NOx
is the oxidation of N2O. Between the two maximums a local minimum is located ataround altitude 80 km. This minimum is a result of photolysis of NO (2.14) at wave-lengths <191 nm, and the following recombination of the produced nitrogen atom withNO (2.15) [Siskind, 2000].
The strong diurnal variation of NO and NO2 seen in Figure 2.7 is mainly due tothe rapid conversion of NO to NO2 after sunset as discussed in section 2.1.1. Duringnighttime NO2 also reacts with atomic oxygen produce NO3, which is photolysed backto NO2 during day by radiation at wavelengths <620 nm. During daytime NO2 isphotolysed to NO (<405 nm) or reacts with O to form NO.
26
103
104
105
106
107
108
109
30
40
50
60
70
80
90
100
110
120
Number density [1/cm3]
Alti
tude
[km
]
NN(2D)NONO2NO3NOx
103
104
105
106
107
108
109
30
40
50
60
70
80
90
100
110
120
Number density [1/cm3]
Alti
tude
[km
]
NN(2D)NONO2NO3NOx
FIGURE 2.7. Sample odd nitrogen (N, N(2D), NO, NO2, NO3, and NOx (NO+NO2)) profilesfrom the Sodankylä Ion Chemistry model. The profiles have been calculated forlatitude 70◦N and for September. The solid lines correspond to noon conditionsand the dashed lines to midnight. The upper figure represents conditions with noadditional ionisation source from energetic particle precipitation. The lower figureshows how the NOx profiles were affected by a moderate Solar Proton Event inSeptember 11th, 2005.
27
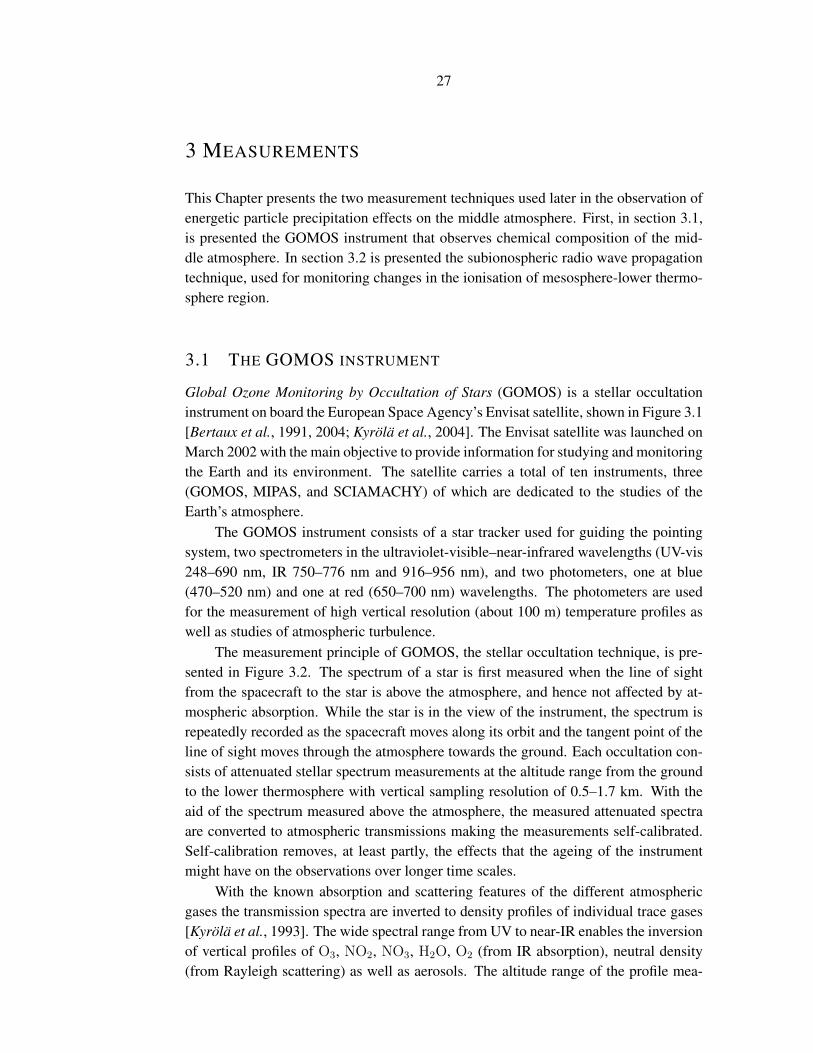
3 MEASUREMENTS
This Chapter presents the two measurement techniques used later in the observation ofenergetic particle precipitation effects on the middle atmosphere. First, in section 3.1,is presented the GOMOS instrument that observes chemical composition of the mid-dle atmosphere. In section 3.2 is presented the subionospheric radio wave propagationtechnique, used for monitoring changes in the ionisation of mesosphere-lower thermo-sphere region.
3.1 THE GOMOS INSTRUMENT
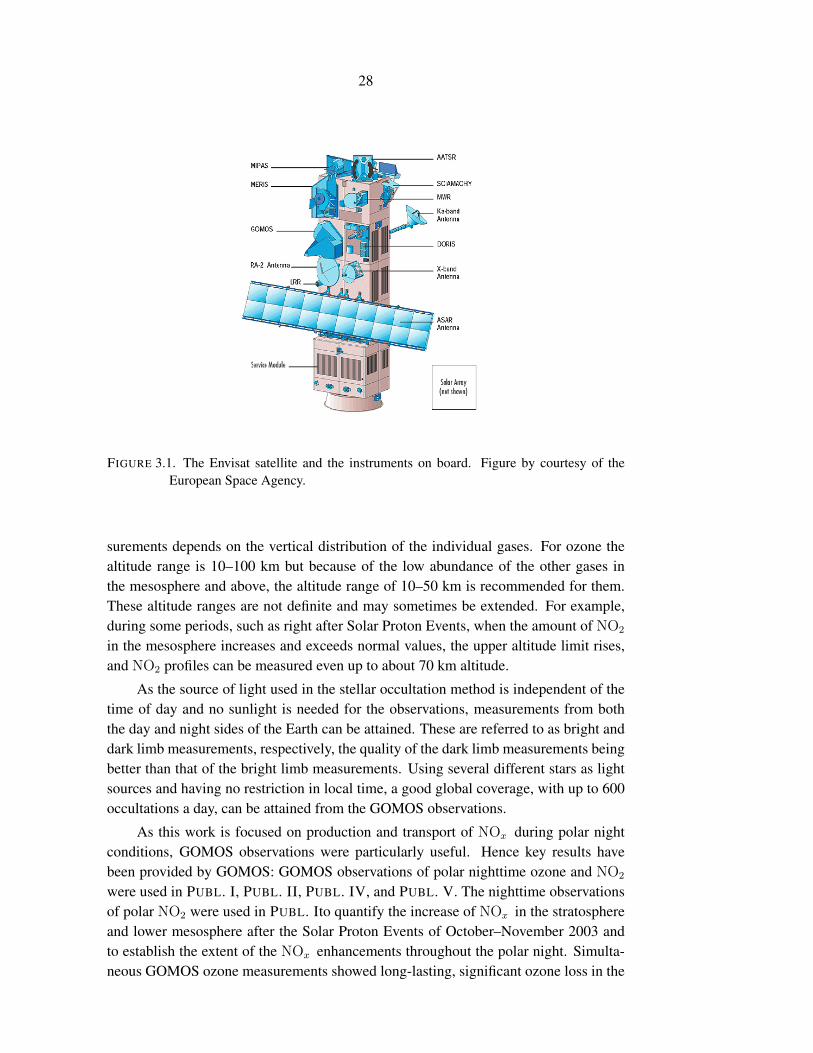
Global Ozone Monitoring by Occultation of Stars (GOMOS) is a stellar occultationinstrument on board the European Space Agency’s Envisat satellite, shown in Figure 3.1[Bertaux et al., 1991, 2004; Kyrölä et al., 2004]. The Envisat satellite was launched onMarch 2002 with the main objective to provide information for studying and monitoringthe Earth and its environment. The satellite carries a total of ten instruments, three(GOMOS, MIPAS, and SCIAMACHY) of which are dedicated to the studies of theEarth’s atmosphere.
The GOMOS instrument consists of a star tracker used for guiding the pointingsystem, two spectrometers in the ultraviolet-visible–near-infrared wavelengths (UV-vis248–690 nm, IR 750–776 nm and 916–956 nm), and two photometers, one at blue(470–520 nm) and one at red (650–700 nm) wavelengths. The photometers are usedfor the measurement of high vertical resolution (about 100 m) temperature profiles aswell as studies of atmospheric turbulence.
The measurement principle of GOMOS, the stellar occultation technique, is pre-sented in Figure 3.2. The spectrum of a star is first measured when the line of sightfrom the spacecraft to the star is above the atmosphere, and hence not affected by at-mospheric absorption. While the star is in the view of the instrument, the spectrum isrepeatedly recorded as the spacecraft moves along its orbit and the tangent point of theline of sight moves through the atmosphere towards the ground. Each occultation con-sists of attenuated stellar spectrum measurements at the altitude range from the groundto the lower thermosphere with vertical sampling resolution of 0.5–1.7 km. With theaid of the spectrum measured above the atmosphere, the measured attenuated spectraare converted to atmospheric transmissions making the measurements self-calibrated.Self-calibration removes, at least partly, the effects that the ageing of the instrumentmight have on the observations over longer time scales.
With the known absorption and scattering features of the different atmosphericgases the transmission spectra are inverted to density profiles of individual trace gases[Kyrölä et al., 1993]. The wide spectral range from UV to near-IR enables the inversionof vertical profiles of O3, NO2, NO3, H2O, O2 (from IR absorption), neutral density(from Rayleigh scattering) as well as aerosols. The altitude range of the profile mea-
28
FIGURE 3.1. The Envisat satellite and the instruments on board. Figure by courtesy of theEuropean Space Agency.
surements depends on the vertical distribution of the individual gases. For ozone thealtitude range is 10–100 km but because of the low abundance of the other gases inthe mesosphere and above, the altitude range of 10–50 km is recommended for them.These altitude ranges are not definite and may sometimes be extended. For example,during some periods, such as right after Solar Proton Events, when the amount of NO2
in the mesosphere increases and exceeds normal values, the upper altitude limit rises,and NO2 profiles can be measured even up to about 70 km altitude.
As the source of light used in the stellar occultation method is independent of thetime of day and no sunlight is needed for the observations, measurements from boththe day and night sides of the Earth can be attained. These are referred to as bright anddark limb measurements, respectively, the quality of the dark limb measurements beingbetter than that of the bright limb measurements. Using several different stars as lightsources and having no restriction in local time, a good global coverage, with up to 600occultations a day, can be attained from the GOMOS observations.
As this work is focused on production and transport of NOx during polar nightconditions, GOMOS observations were particularly useful. Hence key results havebeen provided by GOMOS: GOMOS observations of polar nighttime ozone and NO2
were used in PUBL. I, PUBL. II, PUBL. IV, and PUBL. V. The nighttime observationsof polar NO2 were used in PUBL. Ito quantify the increase of NOx in the stratosphereand lower mesosphere after the Solar Proton Events of October–November 2003 andto establish the extent of the NOx enhancements throughout the polar night. Simulta-neous GOMOS ozone measurements showed long-lasting, significant ozone loss in the

29
FIGURE 3.2. Stellar occultation measurement principle used by the GOMOS instrument. Thedashed line illustrates the satellite orbit and the solid lines represent the lines of sighti) above the atmosphere (upper) for the reference stellar spectrum measurement andii) through the atmosphere (lower) for the attenuated spectrum. The atmosphere ispresented as a thin blue layer. Note that the figure is not to scale.
upper stratosphere. The nighttime, polar GOMOS O3 measurements were further usedto observed the disappearance of the tertiary ozone maximum during the Solar ProtonEvents of January 2005. In PUBL. IV the GOMOS nighttime NO2 observations wereused to establish the origin of the NOx enhancements observed in the Northern Hemi-sphere in spring 2004 [Natarajan et al., 2004; Randall et al., 2005], and to study thelatitudinal extent of the enhancements in January 2004, when they were first observed.PUBL. V utilised the available GOMOS polar nighttime NO2 and O3 observations fromyears 2002–2006.
3.2 SUBIONOSPHERIC RADIO WAVE PROPAGATION
Very Low Frequency (VLF) radio propagation, the 3–30 kHz part of the electromag-netic spectrum, is used in communication systems, for example between ground sta-tions and submarines. The signals used in communication systems are generated byhigh power transmitters around the world, but VLF signals are also generated by natu-ral processes such as lightning. As illustrated in Figure 3.3, VLF signals generated byman-made transmitters propagate in the waveguide formed by the Earth’s surface andthe bottom of the ionosphere (D region) located between 50 and 100 km [Barr et al.,2000], thus subionospherically. Therefore all changes in the D region ionosphere leadto changes in the amplitude and phase of the received VLF signals. As a consequenceof the sensitivity to changes in the D-region electron density, VLF signals may be usedto monitor changes in the sources of ionisation, such as particle precipitation, in themesosphere-lower thermosphere.

30
FIGURE 3.3. Schematic picture of subionospheric radio wave propagation in the waveguideformed by the Earths surface and the bottom of the ionosphere. Image courtesy ofC. J. Rodger/University of Otago.
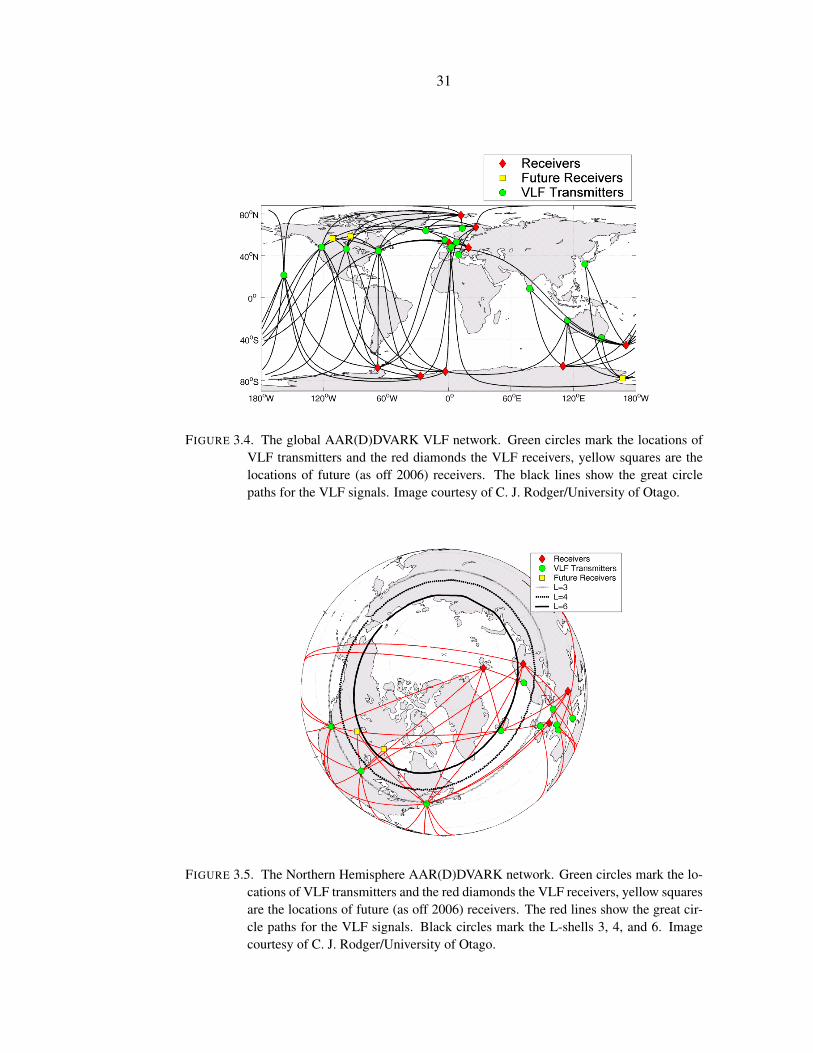
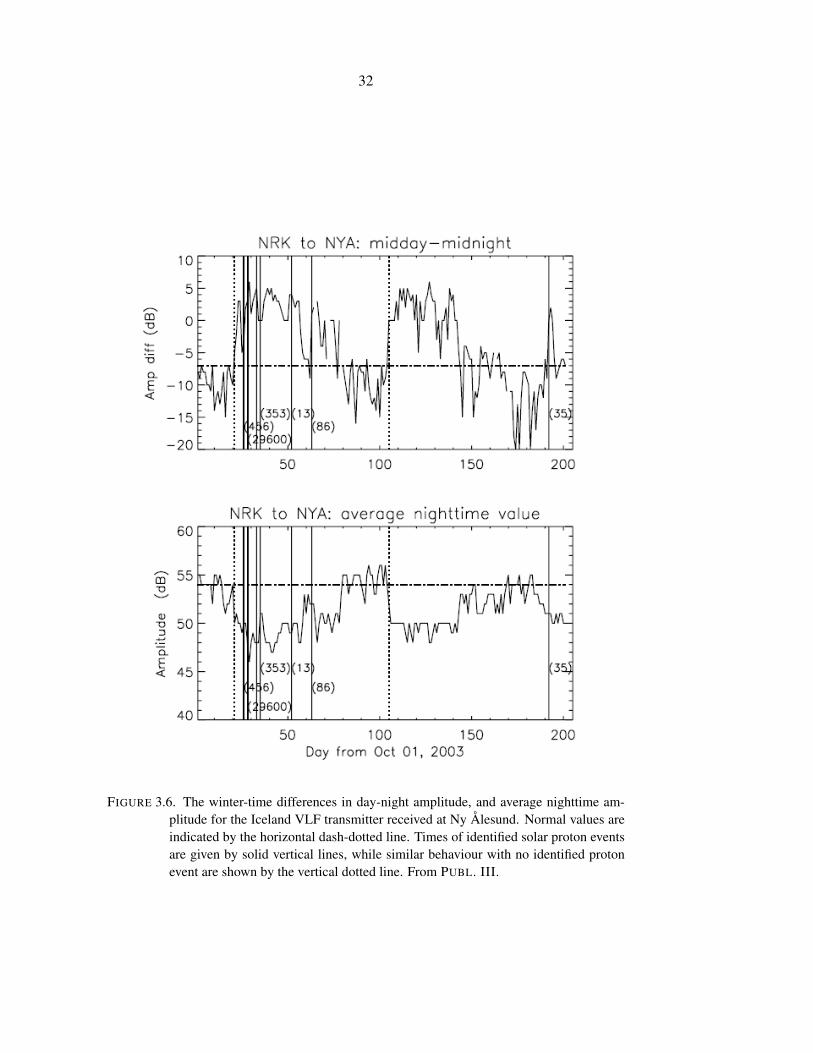
The signals coming from distant locations can be monitored by VLF receiversset up in different locations around the Earth. Figures 3.4 and 3.5 presents the loca-tions of 15 VLF transmitters around the world and 9 VLF receivers participating inthe Antarctic-Arctic Radiation-belt (Dynamic) Deposition-VLF Atmospheric ResearchKonsortia, AAR(D)DVARK network. As seen in Figure 3.5 several great circle pathstravel across the Northern Hemisphere polar cap (L-shells ≥ 3) to receivers in So-dankylä, Finland and Ny Ålesund, Spitsbergen, providing a reasonably good coverageof the polar cap area.
To study signal propagation conditions, long wave propagation models such as theLong Wave Propagation Code (LWPC, Ferguson and Snyder [1990]) can be used. Inorder to calculate the signal amplitude and phase at the reception (receiver) point, infor-mation of the electron density profile parameters that define the ionospheric conditionsmust be provided.
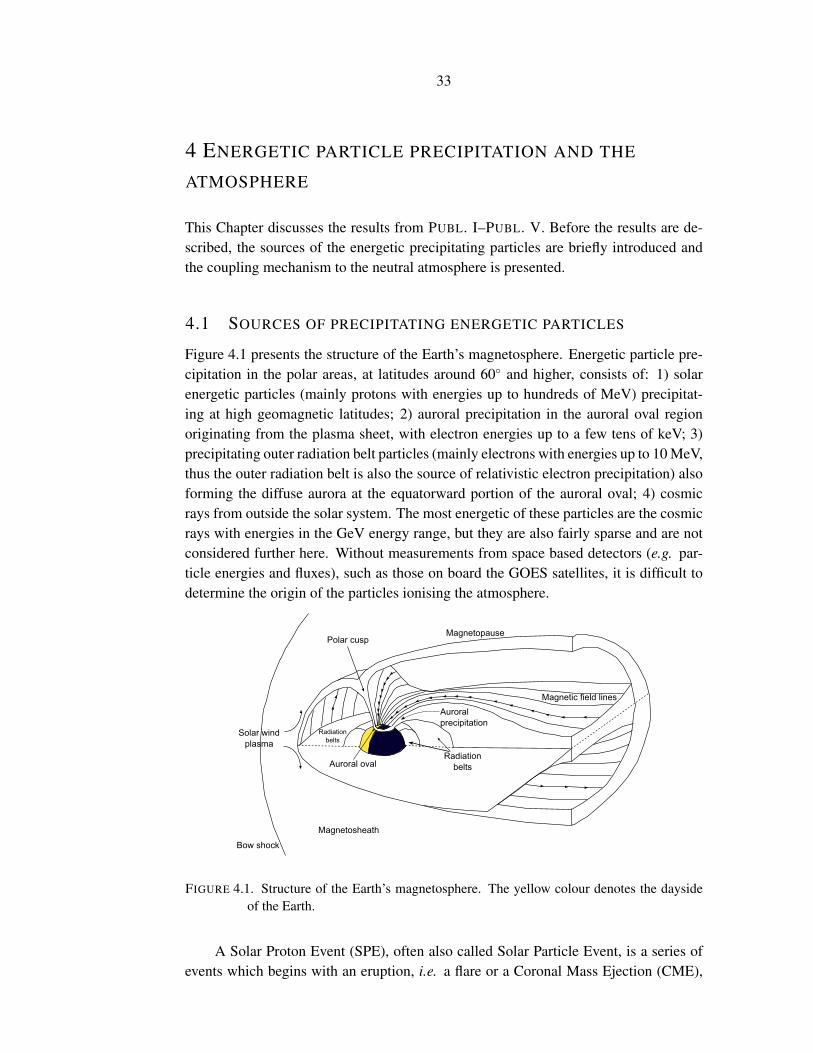
VLF observations and modelling were used in PUBL. III and PUBL. IV. The elec-tron density profile parameters for these studies were calculated using an ion and neutralchemistry model. This model, the Sodankylä Ion Chemistry model, SIC, has been usedin numerous previous studies e.g. Verronen et al. [2002]; Clilverd et al. [2005]; Enellet al. [2005]; Verronen et al. [2005]; Clilverd et al. [2006b]; Rodger et al. [2006]; Ver-ronen et al. [2006b] and is briefly described in section 4.2.1. As the radio wave signalsare sensitive to all changes that affect the D-region ionosphere, they are also sensitive tochanges in the amount of NO in mesosphere-lower thermosphere, which, when ionisedby the solar or geocoronal Lyman-α, is the main source of the D-region electrons. Thiswas utilised in PUBL. III where the radio wave observations were used to observe thedescent of thermospheric NO towards the stratosphere. Figure 3.6 shows how the am-plitude of a signal from Iceland (NRK) to Ny Ålesund (NYA) changes during SolarProton Events, and an NOx descent event (around day 100).
31
FIGURE 3.4. The global AAR(D)DVARK VLF network. Green circles mark the locations ofVLF transmitters and the red diamonds the VLF receivers, yellow squares are thelocations of future (as off 2006) receivers. The black lines show the great circlepaths for the VLF signals. Image courtesy of C. J. Rodger/University of Otago.
FIGURE 3.5. The Northern Hemisphere AAR(D)DVARK network. Green circles mark the lo-cations of VLF transmitters and the red diamonds the VLF receivers, yellow squaresare the locations of future (as off 2006) receivers. The red lines show the great cir-cle paths for the VLF signals. Black circles mark the L-shells 3, 4, and 6. Imagecourtesy of C. J. Rodger/University of Otago.
32
FIGURE 3.6. The winter-time differences in day-night amplitude, and average nighttime am-plitude for the Iceland VLF transmitter received at Ny Ålesund. Normal values areindicated by the horizontal dash-dotted line. Times of identified solar proton eventsare given by solid vertical lines, while similar behaviour with no identified protonevent are shown by the vertical dotted line. From PUBL. III.
33
4 ENERGETIC PARTICLE PRECIPITATION AND THE
ATMOSPHERE
This Chapter discusses the results from PUBL. I–PUBL. V. Before the results are de-scribed, the sources of the energetic precipitating particles are briefly introduced andthe coupling mechanism to the neutral atmosphere is presented.
4.1 SOURCES OF PRECIPITATING ENERGETIC PARTICLES
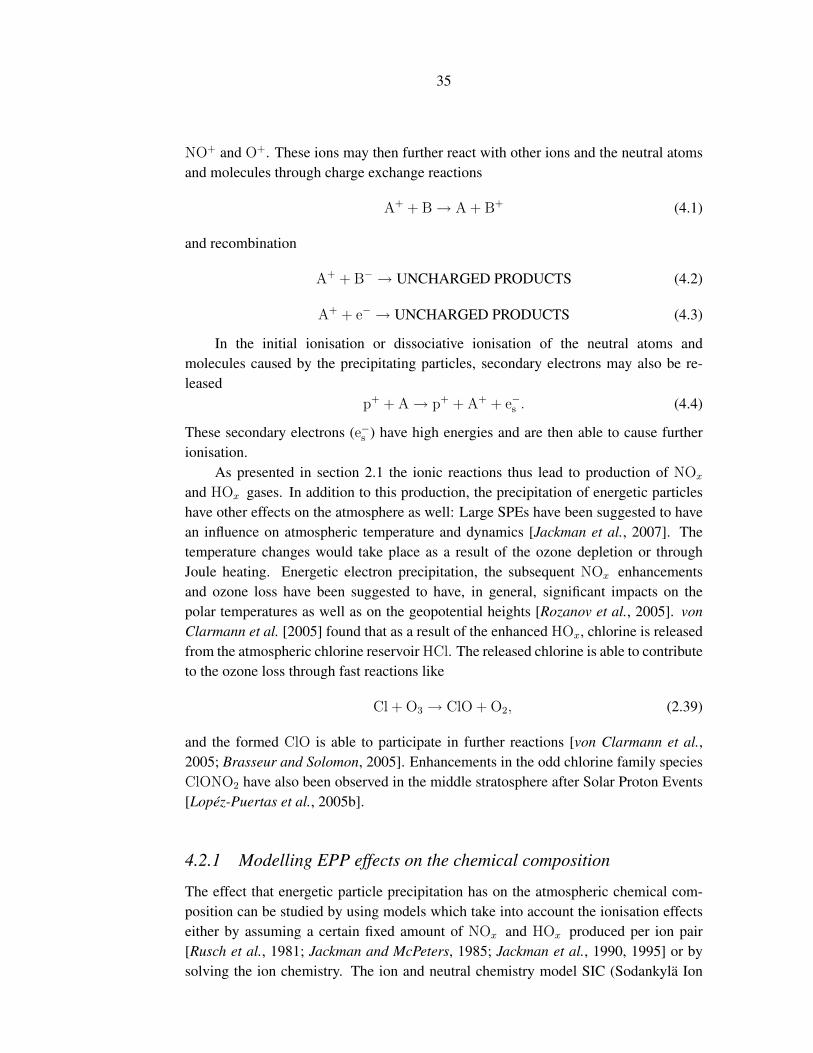
Figure 4.1 presents the structure of the Earth’s magnetosphere. Energetic particle pre-cipitation in the polar areas, at latitudes around 60◦ and higher, consists of: 1) solarenergetic particles (mainly protons with energies up to hundreds of MeV) precipitat-ing at high geomagnetic latitudes; 2) auroral precipitation in the auroral oval regionoriginating from the plasma sheet, with electron energies up to a few tens of keV; 3)precipitating outer radiation belt particles (mainly electrons with energies up to 10 MeV,thus the outer radiation belt is also the source of relativistic electron precipitation) alsoforming the diffuse aurora at the equatorward portion of the auroral oval; 4) cosmicrays from outside the solar system. The most energetic of these particles are the cosmicrays with energies in the GeV energy range, but they are also fairly sparse and are notconsidered further here. Without measurements from space based detectors (e.g. par-ticle energies and fluxes), such as those on board the GOES satellites, it is difficult todetermine the origin of the particles ionising the atmosphere.
FIGURE 4.1. Structure of the Earth’s magnetosphere. The yellow colour denotes the daysideof the Earth.
A Solar Proton Event (SPE), often also called Solar Particle Event, is a series ofevents which begins with an eruption, i.e. a flare or a Coronal Mass Ejection (CME),

34
(a) EIT 195 Å (b) LASCO C2 (c) LASCO C3
FIGURE 4.2. The X17 class flare (a) and the following CME (b,c) on the 28th of October,2003 as seen by SOHO instruments EIT (Extreme ultraviolet Imaging Telescope)and LASCO (Large Angle and Spectrometric Coronagraph). The white circle in(b,c) depicts the Sun shadowed by the coronagraph. Courtesy of SOHO/EIT andSOHO/LASCO consortiums. SOHO is a project of international cooperation be-tween ESA and NASA.
such as those shown in Figure 4.2, in the Sun. In the eruption, charged particles, ofwhich typically around 90 % are protons, are accelerated away from the Sun. In the ac-celeration, the particles may gain very high energies, up to hundreds of MeV’s. When-ever these eruption are directed towards the Earth, the particles, once having reached thenear-Earth space, are guided by the Earth’s magnetic field. Inside the magnetospherethe particles are funnelled to the polar cap areas, near the magnetic poles (Figure 4.1)where they have access to the atmosphere [Kivelson and Russell, 1995]. The energyof a particle determines how deep into the atmosphere the particle can penetrate. Forexample, a proton which possesses 10 MeV of kinetic energy is able to ionise the atmo-sphere down to 65 km [Hargreaves, 1992]. The higher the energy the further down intothe atmosphere the particle has access e.g. 30 MeV protons can reach 50 km altitude,50 MeV protons can reach 40 km, and 100 MeV protons 30 km. The electrons, whichhave lower mass than protons, require less energy to reach the same altitudes (1 keVto reach 150 km, 10 keV to reach 108 km, and 100 keV to reach 84 km) [Hargreaves,1992].
It is important to note that the motion of the precipitating charged particles isdetermined by the Earth’s magnetic field. Since the magnetic poles are not alignedwith the geographic poles, the particles do not precipitate at areas symmetrical to thegeographic poles.
4.2 CHANGES IN CHEMICAL COMPOSITION
Since nitrogen and oxygen are the most predominant constituents in the neutral atmo-sphere, they are most affected by the ionisation. The main ions formed are N+
2 , O+2 ,
35
NO+ and O+. These ions may then further react with other ions and the neutral atomsand molecules through charge exchange reactions
A+ + B→ A + B+ (4.1)
and recombination
A+ + B− → UNCHARGED PRODUCTS (4.2)
A+ + e− → UNCHARGED PRODUCTS (4.3)
In the initial ionisation or dissociative ionisation of the neutral atoms andmolecules caused by the precipitating particles, secondary electrons may also be re-leased
p+ + A→ p+ + A+ + e−s . (4.4)
These secondary electrons (e−s ) have high energies and are then able to cause furtherionisation.
As presented in section 2.1 the ionic reactions thus lead to production of NOx
and HOx gases. In addition to this production, the precipitation of energetic particleshave other effects on the atmosphere as well: Large SPEs have been suggested to havean influence on atmospheric temperature and dynamics [Jackman et al., 2007]. Thetemperature changes would take place as a result of the ozone depletion or throughJoule heating. Energetic electron precipitation, the subsequent NOx enhancementsand ozone loss have been suggested to have, in general, significant impacts on thepolar temperatures as well as on the geopotential heights [Rozanov et al., 2005]. vonClarmann et al. [2005] found that as a result of the enhanced HOx, chlorine is releasedfrom the atmospheric chlorine reservoir HCl. The released chlorine is able to contributeto the ozone loss through fast reactions like
Cl + O3 → ClO + O2, (2.39)
and the formed ClO is able to participate in further reactions [von Clarmann et al.,2005; Brasseur and Solomon, 2005]. Enhancements in the odd chlorine family speciesClONO2 have also been observed in the middle stratosphere after Solar Proton Events[Lopéz-Puertas et al., 2005b].
4.2.1 Modelling EPP effects on the chemical composition
The effect that energetic particle precipitation has on the atmospheric chemical com-position can be studied by using models which take into account the ionisation effectseither by assuming a certain fixed amount of NOx and HOx produced per ion pair[Rusch et al., 1981; Jackman and McPeters, 1985; Jackman et al., 1990, 1995] or bysolving the ion chemistry. The ion and neutral chemistry model SIC (Sodankylä Ion
36
Chemistry model) calculates the ionic and neutral reactions without the need of param-eterization of the NOx and HOx production. The SIC model was developed as a toolto study the ionospheric D region, but since then it has been extended in both altitudeand versatility, e.g. the current version of the model includes vertical transport, andvariation of the solar flux. For each case study the solar flux is calculated using theempirical SOLAR2000 model [Tobiska et al., 2000].
The earlier versions of the model were focused on the D-region ion chemistryas described by Turunen et al. [1996]. Later, Verronen et al. [2002] included neutralchemistry in the model and, afterwards, the vertical transport, including molecular andeddy diffusion [Verronen et al., 2005]. As noted earlier, the production of NOx andHOx is not parameterized but calculated from the initial proton and electron sources.The model also takes into account the production of the ground and the first exited statesof N by secondary electrons. The production is based on studies by Rusch et al. [1981]and depends on the total ionisation rate due to the proton and electron precipitation andgalactic cosmic rays. The ionisation from galactic cosmic radiation is parameterizedfor solar minimum and solar maximum according to Heaps [1978]. The model solvesvertical concentrations of 79 constituents (15 neutrals, 36 positive and 28 negative ions)in the altitude range 20–120 km with 1 km vertical step. The solar spectrum is used forwavelengths 1–423 nm. The background neutral atmosphere for the main constituentsis taken from the MSISE-90 model [Hedin, 1991]. The model is advanced in 5 minor 15 min timesteps which allows for detailed examination of rapid chemical changessuch as those connected to the HOx species. The small timestep is also important whenexamining changes during sunrise and sunset [Verronen et al., 2006b].
In PUBL. II the SIC model was used to examine the effects of the Solar ProtonEvents of January 2005 on the atmosphere. In PUBL. III and PUBL. IV the model wasused to study the cause of the ionisation event observed in the radio wave measure-ment in the Northern Hemisphere in January 2004. It was found that instead of highenergy particle precipitation, the origin of the January 2004 ionisation event was thedescent of high altitude NO from the lower thermosphere to the mesosphere where itwas photoionised by Lyman-α radiation.
4.3 OBSERVATIONS OF EPP EFFECTS ON THE ATMOSPHERE
In PUBL. I, PUBL. II, PUBL. IV and PUBL. V satellite observations of changes in thechemical composition of the middle atmosphere following EPP events were presented.In addition, PUBL. III and PUBL. IV utilised radio wave measurements and radio wavemodelling together with an ion-neutral chemistry model in order to confirm that thelarge amounts of NOx observed in the Northern Hemisphere polar cap in January -February 2004 was produced by an NOx descent from the lower thermosphere downto the stratosphere.

37
4.3.1 NOx enhancement and transport
The Solar Proton Events of October–November 2003
As discussed in section 2.2.3 the photochemical lifetime of NOx is strongly depen-dent upon illumination conditions. During nighttime the chemical lifetime of the NOx
family is of the order of years throughout the middle atmosphere. Thus any increaseof NOxtaking place during the polar night may influence the middle atmosphere forseveral months, before the period of darkness ends.
In the beginning of the Northern Hemisphere polar winter season during 2003–2004 a series of Solar Proton Events took place. Four separate SPEs occurred withinonly ten days. The first of the SPEs began on October 26 from an X1-class solar flarewhich was immediately followed by a halo CME (see Figure 4.2). X1 refers to theintensity of the 0.1-0.8 nm X-ray flux in units of 10−4 Wm−2. Thus an X1 flare has X-ray intensity of 1×10⁻⁴ Wm−2. For this event the peak flux of the protons with energygreater than 10 MeV was only 466 particles s−1 sr−1 cm−2 (466 pfu, particle flux unit,[pfu] = flux of >10 MeV particles s−1 sr−1 cm−2 ), however only two days later onOctober 28th another flare, this time a much more intense X17, was observed. The X17flare was also followed by a halo CME. On October 29th the particle detectors on-boardthe GOES spacecraft at geosynchronous orbit measured a particle flux of 29 500 pfu.These high particle fluxes resulted in high ionisation rates in the polar atmospheres[Jackman et al., 2005; Verronen et al., 2005]. From the proton precipitation, the greatestforcing was placed at altitudes 30–100 km, where the ionisation maximised on October29th. The particle forcing continued with smaller SPEs on November 2nd and 4th.Although the two last SPEs were fairly small, the November 4th event was precededby a record setting solar flare, which was categorised X28 based on the saturation ofthe particle detectors on board the GOES satellites. Later, using the Earth’s ionosphereas a giant X-ray detector, Thomson et al. [2004] suggested that the magnitude of theflare was in fact about X45. These SPE events were later named the Halloween events,as the event series began only a few days before the All Hallows day, and the particleprecipitation initiated by the solar storms led to magnificent aurora observed even atmid-latitudes throughout the Halloween celebrations.
The ionisation from the proton precipitation lead to significant production of NOx
in the stratosphere-mesosphere-lower-thermosphere region. According to model re-sults about 3.4 × 1033 NOy molecules were produced in the aftermath of these SPEs[Jackman et al., 2005], making the event the 4th largest in NOy production since 1972[Jackman et al., 2001]. In the past, several models have predicted the SPE producedNOx and its preservation through the dark polar winter [Jackman et al., 1993; Jackmanet al., 1995; Vitt and Jackman, 1996; Vitt et al., 2000]. However, no continuous mea-surements were available before the Halloween events. One of the instruments observ-ing the polar atmosphere during the course of the October–November 2003 events wasGOMOS. PUBL. I presents the results of the nighttime NO2 enhancements observedat high northern latitudes. Since these are nighttime observations, the NO2 values are
38
a good approximation of the total NOx below about 60 km. The observations showedthat within ten days after the events, the upper stratospheric NOx content had risen by400–1000 %. Two months after the beginning of the events, by the end of December2003, the NOx enhancements were observed to gradually descend to lower altitudes ata rate of a few tenths of km per day. A decrease in ozone was seen at stratospheric andmesospheric altitudes directly after the events. In the weeks following the SPEs, untilthe end of November, ozone depletion increased in the stratosphere. During Decem-ber the stratospheric ozone began a gradual recovery ended by a sudden stratosphericwarming at the end of December. During the stratospheric warming the polar vor-tex was disrupted and displaced from the pole, which advanced the mixing of air andozone recovery. The sudden NOx enhancement following the October–November 2003events is shown in the top panel of Figure 4.3, which presents the polar cap (latitudes60◦N–90◦N) NOx and ozone for polar winters 2002–2003, 2003–2004, 2004–2005,2005–2006. The gradual descent of the NOx and the sudden stratospheric warming inDecember 2003 are clearly present.
NOx produced by Energetic Particle Precipitation and vertical transport
In spring 2004, after the October–November 2003 Solar Proton Events, the highest NOx
amounts ever recorded were observed in the northern polar region [Natarajan et al.,2004; Randall et al., 2005; López-Puertas et al., 2006]. These were first attributed tothe Solar Proton Events in the previous year, but, as was suggested by Randall et al.[2005], it would be highly unlikely that the NOx enhancement from the SPEs wouldhave survived in the atmosphere without being affected by the mixing from the sud-den stratospheric warming in December 2003 [Manney et al., 2005] or descent duringthe winter. Using subionospheric Very Low Frequency radio wave propagation as dis-cussed in section 3.2 the anomalously high NOx was determined most likely to be ofthermospheric origin (PUBL. III). A clear change in the diurnal variation of the radiowave amplitude and phase were observed on January 13, 2004, continuing for a periodof over 30 days. This was consistent with the NOx being produced by lower energyenergetic particle precipitation (auroral energies) in the lower thermosphere and trans-ported to lower altitudes rather than produced in the upper stratosphere by energeticparticle precipitation such as SPEs. The thermospheric origin of the NOx enhance-ments is also supported by Funke et al. [2007].
In PUBL. IV the subionospheric radio wave measurements were used to examinethree polar winters in the northern hemisphere (2003–2004, 2004–2005, 2005–2006)with the aim of determining the periods of persistent increased mesospheric ionisation.These ionisation periods are typically caused by either intense energetic particle pre-cipitation, such as Solar Proton Events, or by descent of thermospheric NOx. For allwinters the same radio wave propagation path was used; the signal from transmitterin Iceland (NRK) was received at Ny Ålesund. This path represents well the northernpolar cap region (Figure 1 of PUBL. IV). Signatures of NOx descent through the up-

39
Alti
tude
[km
]
2002−2003
Oct Nov Dec Jan Feb
30
40
50
60
70
2003−2004
Oct Nov Dec Jan Feb
2004−2005
Oct Nov Dec Jan Feb
2005−2006
Oct Nov Dec Jan Feb
024681012141618202224262830
NO
2 Mix
ing
ratio
[ppb
v]
Alti
tude
[km
]
Oct Nov Dec Jan Feb30
40
50
60
Oct Nov Dec Jan Feb Oct Nov Dec Jan Feb Oct Nov Dec Jan Feb11.522.533.544.555.56
O3 M
ixin
g ra
tio [p
pmv]
Alti
tude
[km
]
2003
May Jun Jul Aug Sep
30
40
50
60
70
2004
May Jun Jul Aug Sep
2005
May Jun Jul Aug Sep
Alti
tude
[km
]
TimeMay Jun Jul Aug Sep
30
40
50
60
TimeMay Jun Jul Aug Sep
TimeMay Jun Jul Aug Sep
2006
May Jun Jul Aug Sep
024681012141618202224262830
NO
2 Mix
ing
ratio
[ppb
v]
TimeMay Jun Jul Aug Sep
0.51 1.52 2.53 3.54 4.55 5.56
O3 M
ixin
g ra
tio [p
pmv]
FIGURE 4.3. GOMOS nighttime NO2 [ppbv] and ozone [ppmv] observations in the polar cap.Upper figure: Northern Hemisphere (poleward of latitude 60◦N), Lower figure:Southern Hemisphere (poleward of latitude 60◦S). NO2 volume mixing ratios [ppbv= parts per billion volume] are presented in the upper rows of the panels and ozonevolume mixing ratios [ppmv = parts per million volume] in the lower rows of thepanels. From PUBL. V.

40
5 10 15 20 25 300.5
1
1.5
2
2.5
3
4−month average Ap index
NO
2 (46
−56
km)
[1014
cm−
2 ]
NHSH
FIGURE 4.4. 4-month averageAp index and polar nighttime NO2 column (46–56 km, polewardof latitudes 60◦N/S) from Table 1 of PUBL. V. Squares: Northern Hemisphere,Stars: Southern Hemisphere. The averaging was done for October–January in theNorthern Hemisphere and May–August in the Southern Hemisphere.
per mesosphere were seen during the first winter period but not during the other two.The first of the winters was marked by two unrelated but equally important factors forsignificant NOx descent: 1) there was significant ionisation from particle precipitation;2) a strong polar vortex provided isolation of the polar air mass and strong downwardtransport during the winter. In the second winter only the former and in the third winteronly the latter, but not both, were present. By applying NO profiles containing an en-hanced NO layer to the ion and neutral chemistry model it was confirmed that the radiowave propagation measurements in January 2004 corresponded to a factor of 100 in-crease in mesospheric NO at altitudes 70–90 km. These results were in good agreementwith observations from satellite instruments [Randall et al., 2005, 2006] made at loweraltitudes. By further applying different "increase" factors (e.g. 10, 100, 1000) and dif-ferent center altitudes to the enhanced NO layer in the model NO profile, it was shownthat the radio wave signal is most sensitive to an enhanced NO layer once it passesthrough the altitude of 80 km (Figure 6 of PUBL. IV). The model results also showedthat any NO enhancement should be at least a factor of 10 larger than the normal uppermesospheric NO density in order to be observable in the radio wave.
GOMOS observations from recent polar winters (Arctic: 2002–2003, 2003–2004,2004–2005, 2005–2006; Antarctic: 2003, 2004, 2005, 2006) show significant NOx in-creases nearly every winter as seen in Figure 4.3. An average wintertime (all availableobservations for October–January in the Northern Hemisphere and May–August in theSouthern Hemisphere) polar NO2, partial column was calculated from these GOMOSobservations around the stratopause region (46–56 km). During the polar winter months
41
the stratopause region works as a transit region for the NOx descending from the lowerthermosphere-mesosphere to the stratosphere (see Figure 4.3). When these values werecompared with the average wintertime geomagnetic activity (geomagnetic activity in-dexAp averaged over the same months as the NO2 column), a nearly linear relationship,shown in Figure 4.4, was observed. Correlation between stratospheric NOx increasesand geomagnetic activity has been observed before in the Southern Hemisphere outsidethe polar night area [e.g. Siskind, 2000; Randall et al., 2007]. The GOMOS nighttimeNO2 observations show a similar correlation also in the Northern Hemisphere dur-ing the polar night period, despite the lack of stable polar vortex conditions, whichare thought to be important for the Southern Hemisphere correlation. In the NorthernHemisphere NO2 the increases in 2004–2005 are as large as expected from Antarcticcorrelations (PUBL. Vand Figure 4.3), although significant particle precipitation wasnot present.
This analysis did not include a factor describing the meteorological conditionsduring each winter and it should be noted that the meteorological conditions in theNorthern Hemisphere are more variable than in the Southern Hemisphere. For ex-ample, exceptional meteorological conditions in the Northern Hemisphere in 2004 and2006 [Randall et al., 2007] lead to effective downward transport of thermospheric NOx,resulting in the highest ever observed NOx in the stratosphere in the spring and earlysummer. In both of these cases the stratospheric altitudes were not affected by the ex-ceptional meteorological conditions until late January–February and thus the GOMOSOctober–January observations used to calculate the NO2 columns were mainly madeduring more typical Northern Hemisphere dynamical conditions. Therefore the pre-sented NO2 columns and the found linearity between the NO2 and average geomag-netic activity index, Ap, were not significantly affected by the exceptional meteorolog-ical conditions in 2004 and 2006, but represent the more typical Northern Hemispherepolar winter. If the Northern Hemisphere averaging period would be extended to thespring with the aid of other experiments (as GOMOS observations end in February),andincluded in the analysis, the linearity would, as a result of the exceptional conditions,be expected to be broken. The importance of the changing meteorological conditionsare highlighted in the results from Arctic winter 2005–2006: the average NO2 columnis similar in size to year 2002–2003 and is higher than would be expected from thegeomagnetic conditions. Later, in February 2006, high NOx values around 100 ppbvwere observed as a result of NOx descent within an exceptionally strong polar vortexat the time [Randall et al., 2006]
4.3.2 Mesospheric HOx production and ozone loss
The series of Solar Protons Events beginning with an X-class solar flare on January 15,2005, has been extensively studied under different interdisciplinary topics [D’Andreaand Poirier, 2005; Clilverd et al., 2006a; Kokorowski et al., 2006; Simnett, 2006; Verro-
42
nen et al., 2006a; Moradi et al., 2007]. These Solar Proton Events were not exceptionalin duration or flux intensity, but the fluxes of high energy particles were extraordinarylarge, i.e. the proton energy spectrum was hard. Following the X7 class solar flare ofJanuary 20 the high energy proton fluxes (> 100 MeV) recorded at geostationary orbitby the GOES-11 satellite were equal in intensity to those recorded during the well doc-umented October 1989 Solar Proton Events, while the lower energy fluxes remained atmoderate levels. Because of this spectral hardness, the greatest impact of the precipi-tation occurred at altitudes lower than normal, reaching the stratosphere (see top panelof Figure 4.5).
The bottom three panels of Figure 4.5 show the results from the Sodankylä Ion andneutral Chemistry model calculations for HOx, NOx and ozone. The model was runfor the time period January 15–24, 2005. The proton flux peaks shown in the top panelas grey dashed lines are marked in the HOx, NOx and ozone panels with red dashedlines. Despite the hardness of the proton spectra, the in situ impact on the stratosphericcomposition appeared to be negligible due to the rapid recovery of high energy protonfluxes to normal levels and the relatively low NOx production at stratospheric alti-tudes. (PUBL. II). However, at higher altitudes in the upper mesosphere significanteffects were predicted. At altitudes of about 65 km to 80 km ozone decreased up to80 % compared with model runs with no proton precipitation. This was caused bythe significant increases of the HOx constituents. Similar ozone decreases were foundfrom the GOMOS observations (Figure 4 of PUBL. II).
As was discussed in section 2.3, the tertiary ozone maximum occurs around 70 kmaltitude. In the polar mesosphere Ox is mainly in the form of ozone during nighttime.At high solar zenith angles, near the polar night terminator, photolysis of water vapourdecreases due to the attenuation of solar radiation at wavelengths <185 nm. This re-duces the amount of HOx in the atmosphere, which in turn decreases the effect of HOx
catalytic cycles on Ox loss (see section 2.1.2), leading to a net ozone production, andthe formation of the tertiary maximum. For the catalytic HOx reactions atomic oxygenis needed. When the SPEs took place, large amount of HOx was produced in the polarcap atmosphere. Therefore following the SPEs, in the area where the tertiary ozonemaximum is observed and where the model calculations were located (70◦N), the fol-lowing two conditions are fulfilled: 1) the location is in the polar cap region wherethe energetic particles precipitate contributing to HOx production; 2) atomic oxygenwill be available for the catalytic HOx reaction cycles through photodissociation of O2
by radiation at wavelengths 185–242 nm in the terminator area [Marsh et al., 2001].Both are important for the efficiency of the Ox loss through HOx catalytic reactions.This was observed as disappearance of the tertiary maximum, which had been presentin both observations and modelling prior to the particle forcing from the SPEs. Oncethe particle forcing subsided and the HOx production diminished, the tertiary ozonemaximum re-appeared as shown in Figure 4 of PUBL. II.

43
15 16 17 18 19 20 21 22 23 24 2520
30
40
50
60
70
80
90
Day of January, 2005
Alti
tude
[km
]
Ionization Rate by Protons [log10
(cm−3s−1)]
3
2
10
2
1
12
3
0
1
−5
−4
−3
−2
−1
0
1
2
3
2.5 21
0
−1−1
01
30
40
50
60
70
80
90
0.5
1
1.5
22.5
3
30
40
50
60
70
80
90
Day of Jan 2005
−80−80−70−60−50−40−20 −30
−10
−60 −50
15 16 17 18 19 20 21 22 23 24 2530
40
50
60
70
80
90
FIGURE 4.5. Top panel: Atmospheric ionisation rates from the proton precipitation, altitudes20–90 km. The bottom 3 panels: Top: model HOx (H + OH + HO2) volume mixingratio [log10(ppbv)], middle: model NOx (N + NO + NO2) volume mixing ratio[log10(ppbv)], bottom: O3 change [%] due to precipitating protons. The contourlines are (0.1, 10−0.5, 1, 100.5, 10, 101.5, 100 ppbv), (10, 30, 50, 100, 150 ppbv),and (-80, -70, -60, -50, -40, -30, -20, -10 %) respectively. All model calculations arefor location 70◦N. The altitude [km] is shown in the y-axis. The dashed lines showthe onsets of the Solar Proton Events. From PUBL. II.

44
5 SUMMARY AND CONCLUDING REMARKS
SUMMARY OF RESULTS
In PUBL. I, GOMOS observations made before, during and after the Solar ProtonEvents of October-November 2003 were used to study the effect of large SPEs to mid-dle atmosphere ozone and NO2. This was the first publication to show observationsof SPE induced changes in the polar winter atmosphere, following the evolution of thechanges with the progressing wintertime. The results revealed an order of magnitudeincreases in the upper stratospheric NO2, lasting for several weeks after the SPEs. Con-sequently, ozone decreases up to 60 % from the pre-SPE values were observed in theupper stratosphere nearly a month after the events.
In PUBL. II, ozone observations from the GOMOS instrument were used with acoupled ion and neutral chemistry model to study the January 2005 Solar Proton Eventseffects on Northern Hemisphere polar middle atmosphere ozone. The results showedthat due to the polar winter conditions, with reduced amount of sunlight, even a mod-erate proton flux precipitating into the atmosphere is able to disturb the odd oxygenbalance through creation of odd hydrogen. This was manifested in the measurementsby the disappearance of the tertiary ozone maximum during the Solar Proton Events andby a 70 % ozone depletion above 60 km. The results showed that large local pertur-bations in ozone may be triggered by even relatively small Solar Proton Events. Thus,it is important to take energetic particle precipitation into account in the modelling ofmiddle atmosphere composition. The disappearance of the tertiary ozone maximuminitially seen in the GOMOS observations was explained as due to the increase in theabundance of HOx compounds at mesospheric altitudes.
A novel method to indirectly observe NOx at upper mesospheric altitudes, 65–90 km, by the means of subionospheric radio wave propagation was developed inPUBL. III. The method is based on mesospheric NO being ionized by solar (or night-time geocoronal) Lyman-α. This ionisation leads to changes in the electron profile,thus affecting the radio wave propagation. Subionospheric radio wave propagationmeasurements and modelling together with ion and neutral chemistry modelling wereused to study the origin of high levels of NOx observed at stratospheric altitudes inthe polar atmosphere during the Northern Hemisphere spring 2004. The results indi-cated that the NOx enhancements observed at stratospheric altitudes originated fromthe thermosphere above 90 km, and were not created in the mesosphere by particleprecipitation. Furthermore, using radio wave observations the enhancements were al-ready observed at high mesospheric altitudes (65–90 km) in January 2004, more thana month before reaching the stratosphere where the NOx enhancements were observedby satellite instruments. By applying a constant, low flux particle precipitation into ionand neutral chemistry model was found that such "background" precipitation would notprovide sufficient amount of NOx to match the high values of NOx observed later inthe spring by satellite instruments. The results indicated that a factor of 100 increase in
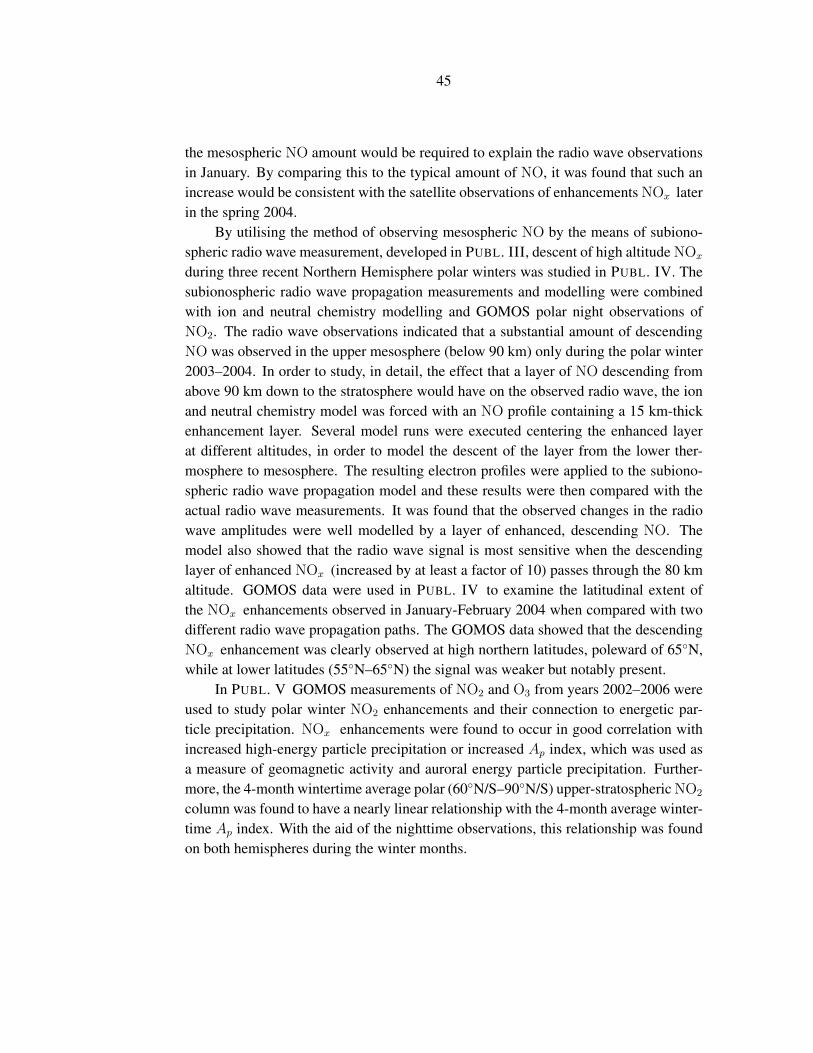
45
the mesospheric NO amount would be required to explain the radio wave observationsin January. By comparing this to the typical amount of NO, it was found that such anincrease would be consistent with the satellite observations of enhancements NOx laterin the spring 2004.
By utilising the method of observing mesospheric NO by the means of subiono-spheric radio wave measurement, developed in PUBL. III, descent of high altitude NOx
during three recent Northern Hemisphere polar winters was studied in PUBL. IV. Thesubionospheric radio wave propagation measurements and modelling were combinedwith ion and neutral chemistry modelling and GOMOS polar night observations ofNO2. The radio wave observations indicated that a substantial amount of descendingNO was observed in the upper mesosphere (below 90 km) only during the polar winter2003–2004. In order to study, in detail, the effect that a layer of NO descending fromabove 90 km down to the stratosphere would have on the observed radio wave, the ionand neutral chemistry model was forced with an NO profile containing a 15 km-thickenhancement layer. Several model runs were executed centering the enhanced layerat different altitudes, in order to model the descent of the layer from the lower ther-mosphere to mesosphere. The resulting electron profiles were applied to the subiono-spheric radio wave propagation model and these results were then compared with theactual radio wave measurements. It was found that the observed changes in the radiowave amplitudes were well modelled by a layer of enhanced, descending NO. Themodel also showed that the radio wave signal is most sensitive when the descendinglayer of enhanced NOx (increased by at least a factor of 10) passes through the 80 kmaltitude. GOMOS data were used in PUBL. IV to examine the latitudinal extent ofthe NOx enhancements observed in January-February 2004 when compared with twodifferent radio wave propagation paths. The GOMOS data showed that the descendingNOx enhancement was clearly observed at high northern latitudes, poleward of 65◦N,while at lower latitudes (55◦N–65◦N) the signal was weaker but notably present.
In PUBL. V GOMOS measurements of NO2 and O3 from years 2002–2006 wereused to study polar winter NO2 enhancements and their connection to energetic par-ticle precipitation. NOx enhancements were found to occur in good correlation withincreased high-energy particle precipitation or increased Ap index, which was used asa measure of geomagnetic activity and auroral energy particle precipitation. Further-more, the 4-month wintertime average polar (60◦N/S–90◦N/S) upper-stratospheric NO2
column was found to have a nearly linear relationship with the 4-month average winter-time Ap index. With the aid of the nighttime observations, this relationship was foundon both hemispheres during the winter months.
46
CONCLUDING REMARKS
The GOMOS instrument has proved the power of the stellar occultation technique inobserving the nighttime atmosphere. GOMOS and the two other atmospheric chemistryinstruments MIPAS and SCIAMACHY on board the Envisat satellite have opened newinsights to the complexity of our planet’s atmosphere. In 2007 the GOMOS instrumenthas already lasted for over five years, and the planned lifetime of the Envisat missionhas been extended to year 2010. In the coming years the scientific community will stillhave a strong need for new instruments capable of performing similar observations.Continuity in observations helps us to understand our planet better.
This work has not only been a success of GOMOS, but it has also shown the powerof combined observations: the space-borne GOMOS observations and the ground-based radio wave observations, to achieve new insights to the Sun-Earth connection.With the improvement in the availability of atmospheric observations which now – andhopefully also in the future – routinely extend to the polar night atmosphere and toaltitudes which formerly were referred to as the ignorosphere, a name formerly usedto describe the D region of the ionosphere, our understanding of the complex systemknown as the Earth’s atmosphere has increased substantially.
Recent studies of Konopka et al. [2007] give indications that nitrogen oxides mighthave an increasingly important role in the ozone balance of the polar atmospheres inthe future. Their argument is based on the known assumption that in the near futurethe stratospheric halogen (chlorine, fluorine and bromine) levels are expected to de-crease. The halogen levels have been decreasing due to the limitations in the use of thehalogens after the discovery that the CFC-compounds (Chlorofluorocarbons) were themain reason of causing the stratospheric ozone hole [Austin et al., 2003]. Accordingto the case study of one recent polar winter, Konopka et al. found that ozone loss dueto NOx might be even twice as large as that due to the halogen compounds. Theseresults were attained assuming that the main source of the polar winter NOx was sub-tropical. Only a negligible NOx production from particle precipitation was present.Chemistry-climate model results of Rozanov et al. [2005] have indicated that constantbackground energetic electron precipitation, which can be a significant NOx source[Callis et al., 1991; Callis and Lambeth, 1998] might be able to produce significantenough ozone loss (30 % in the polar areas) to induce observable changes in the polartemperature fields (∆T of 2 K) and in the geopotential heights. The results of Rozanovet al. indicate that the magnitude of the atmospheric response from the energetic elec-tron precipitation could potentially exceed the effects that arise from variation of solarUV flux. Another chemistry-climate model study [Langematz et al., 2005] found thatthe effect of the NOxproduced by particle precipitation, and transported into the strato-sphere could alter the ozone signal of the 11-year solar cycle.
The above results already show that the effects of energetic particle precipitationon the atmosphere can be of significant importance for the Earth’s atmosphere, perhapseven for the climate. Recent satellite observations have also shown that energetic par-

47
ticle precipitation, combined with atmospheric dynamics, is an important NOx sourcein the polar winter middle atmosphere. Chemistry-climate models have systematicallyunder-predicted NOx in the polar winter stratosphere, probably because they do notinclude the downwards transport from the mesosphere. Using the latest informationprovided for example by the atmospheric chemistry instruments on the Envisat satellitethe results on the energetic particle precipitation impact on the global climate systemcould be further defined. After all, whatever the effect will turn out to be, it is importantfor us to be aware of it even if it is natural, not manmade, variability.

48
REFERENCES
Austin, J., et al. (2003), Uncertainties and assessments of chemistry-climate models ofthe stratosphere, Atmospheric Chemistry and Physics, 3, 1–27.
Barr, R., D. L. Jones, and C. J. Rodger (2000), ELF and VLF radio waves, Journal ofAtmospheric and Terrestrial Physics, 62, 1689–1718.
Bertaux, J. L., G. Megie, T. Widemann, E. Chassefiere, R. Pellinen, E. Kyrölä, S. Kor-pela, and P. Simon (1991), Monitoring of ozone trend by stellar occultations: TheGOMOS instrument, Advances in Space Research, 11(3), 237–242.
Bertaux, J. L., et al. (2004), First results on GOMOS/Envisat, Advances in Space Re-search, 33, 1029–1035.
Brasseur, G. P., and S. Solomon (2005), Aeronomy of the Middle Atmosphere, 3rd re-vised and enlarged ed., Springer, Dordrecht.
Callaghan, P. F., and M. L. Salby (2002), Three-Dimensionality and Forcing of theBrewer-Dobson Circulation, Journal of the Atmospheric Sciences, 59, 976–991.
Callis, L. B., and J. D. Lambeth (1998), NOy formed by precipitating electron events in1991 and 1992: Descent into the stratosphere as observed by ISAMS, GeophysicalResearch Letters, 25, 1875–1878.
Callis, L. B., D. N. Baker, J. B. Blake, J. D. Lambeth, R. E. Boughner, M. Natara-jan, R. W. Klebesadel, and D. J. Gorney (1991), Precipitating Relativistic Electrons:Their Long-Term Effect On Stratospheric Odd Nitrogen Levels, Journal of Geophys-ical Research, 96, 2939–2976.
Callis, L. B., M. Natarajan, D. S. Evans, and J. D. Lambeth (1998), Solar atmosphericcoupling by electrons (SOLACE) 1. Effects of the May 12, 1997 solar event on themiddle atmosphere, Journal of Geophysical Research, 103, 28,405–28,419.
Clilverd, M. A., C. J. Rodger, T. Ulich, A. Seppälä, E. Turunen, A. Botman, and N. R.Thomson (2005), Modelling a large solar proton event in the southern polar cap,Journal of Geophysical Research, 110(A9), A09307, doi:10.1029/2004JA010922.
Clilverd, M. A., C. J. Rodger, and T. Ulich (2006a), The importance of atmosphericprecipitation in storm-time relativistic electron flux drop outs, Geophysical ResearchLetters, 33, L01102, doi:10.1029/2005GL024661.
Clilverd, M. A., A. Seppälä, C. J. Rodger, N. R. Thomson, P. T. Verronen, E. Turunen,T. Ulich, J. Lichtenberger, and P. Steinbach (2006b), Modelling polar ionosphericeffects during the October-November 2003 solar proton events, Radio Science, 41,RS2001, doi:10.1029/2005RS003290.

49
Crutzen, P., and S. Solomon (1980), Response of mesospheric ozone to particle precip-itation, Planetary and Space Science, 28, 1147–1153.
Crutzen, P. J. (1970), The influence of nitrogen oxides on the atmospheric ozone con-tent, Quarterly Journal of the Royal Meteorological Society, 96, 320–325.
Crutzen, P. J., I. S. A. Isaksen, and G. C. Reid (1975), Solar proton events: Stratosphericsources of nitric oxide, Science, 189, 457–458.
D’Andrea, C., and J. Poirier (2005), Ground level muons coincident with the 20January 2005 solar flare, Geophysical Research Letters, 32, L14102, doi:10.1029/2005GL023336.
Degenstein, D. A., N. D. Lloyd, A. E. Bourassa, R. L. Gattinger, and E. J. Llewellyn(2005), Observations of mesospheric ozone depletion during the October 28, 2003solar proton event by OSIRIS, Geophysical Research Letters, 32, L03S11, doi:10.1029/2004GL021521.
Enell, C.-F., A. Kero, E. Turunen, T. Ulich, P. T. Verronen, A. Seppälä, S. Marple,F. Honary, and A. Senior (2005), Effects of D-region RF heating studied with theSodankylä Ion Chemistry model, Annales Geophysicæ, 23, 1575–1583.
Farman, J. C., B. G. Gardiner, and J. D. Shanklin (1985), Large losses of total ozone inAntarctica reveal seasonal ClOx/NOx interaction, Nature, 315, 207–210.
Ferguson, J. A., and F. P. Snyder (1990), Computer programs for assessment oflong wavelength radio communications, Tech. Doc. 1773, Natl. Ocean Syst. Cent.,Alexandria Va.
Ferreira, S. E. S., M. S. Potgieter, R. A. Burger, B. Heber, and H. Fichtner (2001),Modulation of Jovian and galactic electrons in the heliosphere: 1. Latitudinal trans-port of a few MeV electrons, Journal of Geophysical Research, 106, 24,979–24,988,doi:10.1029/2001JA000082.
Finlayson-Pitts, B. J., and J. N. Pitts (1999), Chemistry of the Upper and Lower Atmo-sphere: Theory, Experiments, and Applications, Academic Press.
Funke, B., M. López-Puertas, H. Fischer, G. P. Stiller, T. von Clarmann, G. Wet-zel, B. Carli, and C. Belotti (2007), Comment on “Origin of the January-April2004 increase in stratospheric NO2 observed in northern polar latitudes” by Jean-Baptiste Renard et al., Geophysical Research Letters, 34, L07813, doi:10.1029/2006GL027518.
Hargreaves, J. K. (1992), The solar-terrestrial environment, Cambridge Atmosphericand Space Science Series, Cambridge University Press, Cambridge, UK.

50
Hartogh, P., C. Jarchow, G. R. Sonnemann, and M. Grygalashvyly (2004), On thespatiotemporal behaviour of ozone within the upper mesosphere/mesopause regionunder nearly polar night conditions, Journal of Geophysical Research, 109, D18303,doi:10.1029/2004JD004576.
Heaps, M. G. (1978), Parameterization of the cosmic ray ion-pair production rate above18 km, Planetary and Space Science, 26, 513–517.
Heath, M., A. Krueger, and P. Crutzen (1977), Solar proton event: Influence on strato-spheric ozone, Science, 197, 886–889.
Hedin, A. E. (1991), Extension of the MSIS Thermospheric Model into the Middle andLower Atmosphere, Journal of Geophysical Research, 96, 1159–1172.
Holton, J. R. (2004), An Introduction to Dynamic Meteorology, 4th ed., Elsevier Aca-demic Press, ISBN: 0-12-354016-X.
Jackman, C. H., and R. D. McPeters (1985), The Responce of Ozone to Solar ProtonEvents During Solar Cycle 21: A Theoretical Interpretation, Journal of GeophysicalResearch, 90, 7955–7966.
Jackman, C. H., and P. E. Meade (1988), Effect of Solar Proton Events in 1978 and 1979on the Odd Nitrogen Abundance in the Middle Atmosphere, Journal of GeophysicalResearch, 93, 7084–7090.
Jackman, C. H., A. R. Douglass, R. B. Rood, R. D. McPeters, and P. E. Meade (1990),Effect of solar proton events on the middle atmosphere during the past two solar cy-cles as computed using a two-dimensional model, Journal of Geophysical Research,95, 7417–7428.
Jackman, C. H., J. E. Nielsen, D. J. Allen, M. C. Cerniglia, R. D. McPeters, A. R. Dou-glass, and R. B. Rood (1993), The effects of the October 1989 solar proton eventson the stratosphere as computed using a three-dimensional model, Geophysical Re-search Letters, 20, 459–462.
Jackman, C. H., M. C. Cerniglia, J. E. Nielsen, D. J. Allen, J. M. Zawodny, R. D.McPeters, A. R. Douglass, J. E. Rosenfield, and R. B. Hood (1995), Two-dimensionaland three-dimensional model simulations, measurements, and interpretation of theOctober 1989 solar proton events on the middle atmosphere, Journal of GeophysicalResearch, 100, 11,641–11,660.
Jackman, C. H., E. L. Fleming, and F. M. Vitt (2000), Influence of extremely largesolar proton events in a changing stratosphere, Journal of Geophysical Research,105, 11,659–11,670.
51
Jackman, C. H., R. D. McPeters, G. J. Labow, E. L. Fleming, C. J. Praderas, and J. M.Russel (2001), Northern hemisphere atmospheric effects due to the July 2000 solarproton events, Geophysical Research Letters, 28, 2883–2886.
Jackman, C. H., M. T. DeLand, G. J. Labow, E. L. Fleming, D. K. Weisenstein,M. K. W. Ko, M. Sinnhuber, and J. M. Russell (2005), Neutral atmospheric influ-ences of the solar proton events in October-November 2003, Journal of GeophysicalResearch, 110, A09S27, doi:10.1029/2004JA010888.
Jackman, C. H., R. G. Roble, and E. L. Fleming (2007), Mesospheric dynamicalchanges induced by the solar proton events in October-November 2003, Geophys-ical Research Letters, 34, L04812, doi:10.1029/2006GL028328.
Kawamoto, N., and M. Shiotani (2000), Interannual variability of the vertical descentrate in the Antarctic polar vortex, Journal of Geophysical Research, 105, 11,935–11,946, doi:10.1029/2000JD900076.
Kivelson, M. G., and C. T. Russell (Eds.) (1995), Introduction to Space Physics, Cam-bridge University Press, ISBN 0-521-45714-9.
Kokorowski, M., et al. (2006), Rapid fluctuations of stratospheric electric field fol-lowing a solar energetic particle event, Geophysical Research Letters, 33, L20105,doi:10.1029/2006GL027718.
Konopka, P., et al. (2007), Ozone loss driven by nitrogen oxides and triggered by strato-spheric warmings can outweigh the effect of halogens, Journal of Geophysical Re-search, 112(D11), D05105, doi:10.1029/2006JD007064.
Kyrölä, E., E. Sihvola, Y. Kotivuori, M. Tikka, T. Tuomi, and H. Haario (1993), Inversetheory for occultation measurements, 1, Spectral inversion, Journal of GeophysicalResearch, 98, 7367–7381.
Kyrölä, E., et al. (2004), GOMOS on Envisat: An overview, Advances in Space Re-search, 33, 1020–1028.
Langematz, U., J. L. Grenfell, K. Matthes, P. M. and M. Kunze, B. Steil, and C. Brühl(2005), Chemical effects in 11-year solar cycle simulations with the Freie UniversitätBerlin Climate Middle Atmosphere Model with online chemistry (FUB-CMAM-CHEM), Geophysical Research Letters, 32, L13803, doi:10.1029/2005GL022686.
López-Puertas, M., B. Funke, S. Gil-López, T. von Clarmann, G. P. Stiller, M. Höpfner,S. Kellmann, H. Fischer, and C. H. Jackman (2005a), Observation of NOx en-hancement and ozone depletion in the northern and southern hemispheres after theOctober-November 2003 solar proton events, Journal of Geophysical Research, 110,A09S43, doi:10.1029/2005JA011050.

52
López-Puertas, M., B. Funke, T. von Clarmann, H. Fischer, and G. P. Stiller (2006),The Stratospheric and Mesospheric NOy in the 2002-2004 Polar Winters as mea-sured by MIPAS/ENVISAT, Space Science Review, 125, 403–416, doi:10.1007/S11214-006-9073-2.
Lopéz-Puertas, M., et al. (2005b), HNO3, N2O5 and ClONO2 enhancements after theOctober-November 2003 solar proton events, Journal of Geophysical Research, 110,A09S44, doi:10.1029/2005JA011051.
Manney, G. L., R. W. Zurek, A. O’Neill, and R. Swinbank (1994), On the Motion ofAir through the Stratospheric Polar Vortex., Journal of the Atmospheric Sciences, 51,2973–2994.
Manney, G. L., K. Krüger, J. L. Sabutis, S. A. Sena, and S. Pawson (2005), Theremarkable 2003–2004 winter and other recent warm winters in the Arctic strato-sphere since the late 1990s, Journal of Geophysical Research, 110(D9), D04107,doi:10.1029/2004JD005367.
Marsh, D., A. Smith, G. Brasseur, M. Kaufmann, and K. Grossmann (2001), The ex-istence of a tertiary ozone maximum in the high latitude middle mesosphere, Geo-physical Research Letters, 28(24), 4531–4534.
McPeters, R., C. Jackman, and E. Stassinopoulos (1981), Observation of ozone de-pletion associated with Solar Proton Events, Journal of Geophysical Research, 86,12,071–12,081.
McPeters, R. D. (1986), A nitric oxide increase observed following the July 1982 solarproton event, Geophysical Research Letters, 13, 667–670.
McPeters, R. D., and C. H. Jackman (1985), The response of Ozone to Solar ProtonEvents During Solar Cycle 21: The Observations, Journal of Geophysical Research,90, 7945–7954.
Moradi, H., A.-C. Donea, C. Lindsey, D. Besliu-Ionescu, and P. S. Cally (2007), Helio-seismic analysis of the solar flare-induced sunquake of 2005 January 15, Monthly No-tices of the Royal Astronomical Society, 374, 1155–1163, doi:10.1111/j.1365-2966.2006.11234.x.
Natarajan, M., E. E. Remsberg, L. E. Deaver, and J. M. Russell (2004), Anomalouslyhigh levels of NOx in the polar upper stratosphere during April, 2004: Photochemicalconsistency of HALOE observations, Geophysical Research Letters, 31, L15113,doi:10.1029/2004GL020566.
Orsolini, Y. J., G. L. Manney, M. L. Santee, and C. E. Randall (2005), An upper strato-spheric layer of enhanced HNO3 following exceptional solar storms, GeophysicalResearch Letters, 32, L12S01, doi:10.1029/2004GL021588.

53
Randall, C. E., V. L. Harvey, C. S. Singleton, P. F. Bernath, C. D. Boone, and J. U.Kozyra (2006), Enhanced NOx in 2006 linked to upper stratospheric Arctic vortex,Geophysical Research Letters, 33, L18811, doi:10.1029/2006GL027160.
Randall, C. E., et al. (2005), Stratospheric effects of energetic particle precipi-tation in 2003-2004, Geophysical Research Letters, 32, L05802, doi:10.1029/2004GL022003.
Randall, C. E., et al. (2007), Energetic particle precipitation effects on the South-ern Hemisphere stratosphere in 1992–2005, Journal of Geophysical Research, 112,D08308, doi:10.1029/2006JD007696.
Reid, G. C., S. Solomon, and R. R. Garcia (1991), Response of the middle atmosphereto the solar proton events of August-December, 1989, Geophysical Research Letters,18, 1019–1022.
Rodger, C. J., M. A. Clilverd, P. T. Verronen, T. Ulich, M. J. Jarvis, and E. Turunen(2006), Dynamic geomagnetic rigidity cutoff variations during a solar proton event,Journal of Geophysical Research, 111, A04222, doi:10.1029/2005JA011395.
Rohen, G., et al. (2005), Ozone depletion during the solar proton events of Octo-ber/November 2003 as seen by SCIAMACHY, Journal of Geophysical Research,110, A09S39.
Rosenfield, J. E., and M. R. Schoeberl (2001), On the origin of polar vortex air, Journalof Geophysical Research, 106, 33,485–33,498, doi:10.1029/2001JD000365.
Rosenfield, J. E., P. A. Newman, and M. R. Schoeberl (1994), Computations of dia-batic descent in the stratospheric polar vortex, Journal of Geophysical Research, 99,16,677.
Rozanov, E., L. Callis, M. Schlesinger, F. Yang, N. Andronova, and V. Zubov (2005),Atmospheric response to NOy source due to energetic electron precipitation, Geo-physical Research Letters, 32, L14811, doi:10.1029/2005GL023041.
Rusch, D. W., and C. A. Barth (1975), Satellite measurements of nitric oxide in thepolar region, Journal of Geophysical Research, 80, 3719–3721.
Rusch, D. W., J.-C. Gérard, S. Solomon, P. J. Crutzen, and G. C. Reid (1981), Theeffect of particle precipitation events on the neutral and ion chemistry of the middleatmosphere – I. Odd nitrogen, Planetary and Space Science, 29, 767–774.
Salby, M. L., and P. F. Callaghan (2006), Residual mean transport in the stratosphere:Contributions from wave driving and seasonal transience, Journal of GeophysicalResearch, 111(D10), D22304, doi:10.1029/2005JD006767.

54
Seinfeld, J. H., and S. N. Pandis (1998), Atmospheric chemistry and physics: from airpollution to climate change, A Wiley-Interscience Publication, Wiley, New York,ISBN: 0471178152.
Semeniuk, K., J. C. McConnell, and C. H. Jackman (2005), Simulation of the October-November 2003 solar proton events in the CMAM GCM: Comparison with observa-tions, Geophysical Research Letters, 32, L15S02, doi:10.1029/2005GL022392.
Shimazaki, T. (1984), Minor Constituents in the Middle Atmosphere (Developments inEarth and Planetary Physics, No 6), D. Reidel Publishing Co., Dordrecht, Holland.
Simnett, G. M. (2006), The timing of relativistic proton acceleration in the 20 January2005 flare, Astronomy and Astrophysics, 445, 715–724, doi:10.1051/0004-6361:20053503.
Siskind, D. E. (2000), On the coupling between the middle and upper atmospheric oddnitrogen, in Atmospheric science across the stratopause, Geophysical Monograph,vol. 123, pp. 101–116, American Geophysical Union.
Siskind, D. E., L. Coy, and P. Espy (2005), Observations of stratospheric warmingsand mesospheric coolings by the TIMED SABER instrument, Geophysical ResearchLetters, 32, L09804, doi:10.1029/2005GL022399.
Solomon, S. (1999), Stratospheric ozone depletion: a review of concepts and history,Reviews of Geophysics, 37(3), 275–316.
Solomon, S., D. W. Rusch, J.-C. Gérard, G. C. Reid, and P. J. Crutzen (1981), Theeffect of particle precipitation events on the neutral and ion chemistry of the middleatmosphere: II. Odd hydrogen, Planetary and Space Science, 8, 885–893.
Solomon, S., P. J. Cruzen, and R. G. Roble (1982), Photochemical coupling betweenthe thermosphere and the lower atmosphere 1. Odd nitrogen from 50 to 120 km,Journal of Geophysical Research, 87(C9), 7206–7220.
Solomon, S., G. C. Reid, D. W. Rusch, and R. J. Thomas (1983), Mesospheric ozonedepletion during the solar proton event of July 13, 1982 Part II. Comparisons betweentheory and measurements, Geophysical Research Letters, 10, 257–260.
Sprigg, W. A. (Ed.) (2000), Nasa Workshop in Sun-Climate Connections: SummaryReport, University of Arizona, Tucson, USA.
Thomson, N. R., C. J. Rodger, and R. L. Dowden (2004), Ionosphere gives sizeof greatest solar flare, Geophysical Research Letters, 31, L06803, doi:10.1029/2003GL019345.

55
Tobiska, W. K., T. Woods, F. Eparvier, R. Viereck, L. D. B. Floyd, G. Rottman, andO. R. White (2000), The SOLAR2000 empirical solar irradiance model and forecasttool, Journal of Atmospheric and Terrestrial Physics, 62, 1233–1250.
Turunen, E., H. Matveinen, J. Tolvanen, and H. Ranta (1996), D-region ion chemistrymodel, in STEP Handbook of Ionospheric Models, edited by R. W. Schunk, pp. 1–25,SCOSTEP Secretariat, Boulder, Colorado, USA.
Verronen, P. T., E. Turunen, T. Ulich, and E. Kyrölä (2002), Modelling the effects ofthe October 1989 solar proton event on mesospheric odd nitrogen using a detailedion and neutral chemistry model, Annales Geophysicæ, 20, 1967–1976.
Verronen, P. T., A. Seppälä, M. A. Clilverd, C. J. Rodger, E. Kyrölä, C.-F. Enell,T. Ulich, and E. Turunen (2005), Diurnal variation of ozone depletion during theOctober-November 2003 solar proton events, Journal of Geophysical Research, 110,A09S32, doi:10.1029/2004JA010932.
Verronen, P. T., A. Seppälä, E. Kyrölä, J. Tamminen, H. M. Pickett, and E. Tu-runen (2006a), Production of odd hydrogen in the mesosphere during the Jan-uary 2005 solar proton event, Geophysical Research Letters, 33, L24811, doi:10.1029/2006GL028115.
Verronen, P. T., T. Ulich, E. Turunen, and C. J. Rodger (2006b), Sunset transition ofnegative charge in the D-region ionosphere during high-ionization conditions, An-nales Geophysicæ, 24, 187–202.
Vitt, F. M., and C. H. Jackman (1996), A comparison of sources of odd nitrogen produc-tion from 1974 through 1993 in the Earth’s middle atmosphere as calculated usinga two-dimensional model, Journal of Geophysical Research, 101, 6729–6740, doi:10.1029/95JD03386.
Vitt, F. M., T. P. Armstrong, T. E. Cravens, G. A. M. Dreschhoff, C. H. Jackman, andC. M. Laird (2000), Computed contributions to odd nitrogen concentrations in theEarth’s polar middle atmosphere by energetic charged particles, Journal of Atmo-spheric and Terrestrial Physics, 62, 669–683.
von Clarmann, T., et al. (2005), Experimental evidence of perturbed odd hydrogen andchlorine chemistry after the October 2003 solar proton events, Journal of Geophysi-cal Research, 110, A09S45, doi:10.1029/2005JA011053.
Weeks, L. H., R. S. Cuikay, and J. R. Corbin (1972), Ozone Measurements in theMesosphere During The Solar Proton Event of 2 November 1969, Journal of theAtmospheric Sciences, 29, 1138–1142.