
Finnish exchange students’ culture shock
62
Finnish exchange students’ culture shock Karoliina Pekkala Thesis Degree programme in tourism December 2015
Transcript of Finnish exchange students’ culture shock

Finnish exchange students’ culture shock
Karoliina Pekkala
Thesis
Degree programme in tourism
December 2015

Degree programme in tourism
Abstract 6.12.2015
Author or authors Pekkala, Karoliina Kukka-Maaria
Group or year of entry Tobba11
Title of report Finnish exchange students culture shock
Number of report pages and attachment pages 47 + 9
Teacher(s) or supervisor(s) Evariste Habiyakare
This bachelor’s thesis is written about culture shock experienced by the exchange students from Finland. It is commissioned by an international students exchange organisation located in Finland. The aim of the research was to find out how much the host country affects the culture shock and to identify aspects that affect the adaptation of the students. The goal is to provide the future exchange students with advise on coping with culture shock.
Theoretical framework consists of defining what is culture and culture shock. The theories of culture include Geert Hofstedes cultural dimensions on national culture and the iceberg metaphor.
The questionnaire was done by using webpropol. The local organisation distibuted the questionnaire to their exhchange students via email during April-May 2015. Students had four weeks to answer the questionnaire.
The aim of the research was reached as the author was able to indetify fact that affected the culture shock and the adaptation.
Keywords Culture shock, cultural communication, adaptation, cultural differences

Table of contents
1 Int roduction .......................................................................................................................... 1 1.1 Research problem........................................................................................................ 1 1.2 Aims and objectives .................................................................................................... 1 1.3 Structure of the thesis ................................................................................................. 2 1.4 Year abroad .................................................................................................................. 2
2 Theoretical approach: Cultural adaption........................................................................... 4
2.1 Definition of culture ................................................................................................... 4
2.2 Stereotypes, prejudice and generalization ................................................................ 5
2.3 Hofstede’s cultural dimensions ................................................................................. 6
2.3.1 Power distance ................................................................................................. 7
2.3.2 Individualism vs. collectivism ........................................................................ 7
2.3.3 Masculinity vs. femininity ............................................................................... 8
2.3.4 Uncertainty avoidance..................................................................................... 8
2.3.5 Long term orientation ..................................................................................... 9
2.3.6 Indulgence vs. restrained .............................................................................. 11
2.4 The iceberg metaphor............................................................................................... 11
2.5 Culture shock ............................................................................................................. 12
2.6 Cultural adaptation project....................................................................................... 13
2.7 Reverse culture shock ............................................................................................... 14
2.8 Summarizing discussion ........................................................................................... 14
3 Research approach and methods ..................................................................................... 16
3.1 Research methods ..................................................................................................... 16
3.2 Data collection methods .......................................................................................... 16
3.3 Data analysis methods .............................................................................................. 17
3.4 Reliability and validity ............................................................................................... 18
4 Key results and discussion ................................................................................................ 20 4.1 Respondents............................................................................................................... 20 4.2 Preparedness before exchange ................................................................................ 21 4.3 Expectations and arrival ........................................................................................... 25 4.4 Social connections ..................................................................................................... 31

4.5 Homesickness and early departure ......................................................................... 33
4.6 Reverse culture shock ............................................................................................... 38
4. 7 The experience........................................................................................................... 40
5 Conclusion and recommendation .................................................................................... 45
Bibliography ............................................................................................................................. 48

1
1 Introduction
1.1 Research problem
This research focuses on the effect of culture shock and ways to adapt during exchange
year. Exchange year is an option for young students to gain cultural and international
experiences at young age. The idea is that students move into a new country for an aca-
demic year. During this period they live with a local family and go to a local high
school. Typically the students are from the age of 15 to 18 at the time of the exchange.
The issue discussed in this research is to see how the culture effects exchange students
depending on the destination. Under the scope there will be the effect of communica-
tion to home, language skills and information given on culture shock. An aim is also to
identify what are the facts that help students to adapt to the new host country.
Culture shocks are common among the high school exchange students as they go and
live with a local family and experience the culture closely. The issue is that everyone
faces culture shock but are not always aware what behaviour it may cause even many
months after the arrival. The aim is to find out those behaviours that it may cause and
see in how the culture shock differs in different countries. It is to be also researched
that how the culture differs from Nordic cultures and how this difference affects the
culture shock of the student.
Has the culture shock effected the adaptation of the exchange student? It is to be re-
searched that how the language skills has helped them to adapt. It also is seen if the
students have received information about the country before and upon arrival and how
this has affected the culture shock.
1.2 Aims and objectives
The objective of this thesis is to provide a study that will inform the leaving exchange
students and their families about the effects of culture shock and ways to cope with it.
The main aim of the research is to find how culture shock differs depending on the

2
country. The aim is also for the exchange organisation to see if there is a need for more
information to be provided to the exchange students as they are going abroad. It is to be
seen what factors decrease and increase the culture shock.
The aim of the research of to gain knowledge on how to inform the leaving exchange
students of the facts of culture shock. The facts and behaviour of culture shock is to
be solved in aim to ease the effect of the culture shock.
1.3 Structure of the thesis
The first part of the thesis will focus on the theory of culture and culture shock. First
we will define what culture actually is. Then a few different theories on culture will be
discussed. I have chosen the theories of Geert Hofstede’s cultural dimensions and the
iceberg metaphor. These theories will be used when the collected data is analysed.
The second part of the thesis includes the research. The questionnaire has been dis-
cussed under seven chapters. These include information about the respondents, pre-
paredness before the exchange, expectations, social connections, homesickness, reverse
culture shock and the experience in general. At the end of this thesis these is a conclu-
sion to summarize the subject and to provide the commissioner with recommenda-
tions.
1.4 Year abroad
The exchange year is option given to students in different stages on their education. In
this thesis the focus is on the exchange period that is done on high school or senior
high, between the ages of 15 and 18. Exchange periods popularity among young adults
has increased. European countries are the most popular destinations along with US.
Women are more actively going on exchange than men. (Maailmalle, 2015)
The exchange period is normally half or one academic year. During this period ex-
change student is studying in a local school and living with local host family. Normally
3
the studies done during high school exchange do not entirely replace the studies back
at the home institution. (Maailmalle, 2015)
There are several different exchange programs and organizations available to choose
from. Exchange organizations have different levels of age and language requirements
that are also dependent on the host destination. The costs of the exchange year depend
on the length and destination of the exchange. Some organizations are granting finan-
cial aid to leaving students. Students going on exchange with an exchange organization
are not reliable on paying the tuition fees. (Maailmalle, 2015)
The idea of student exchange started after the Second World War when it was made
possible for German students to spend a school year in USA. This was made possible
by the Church of the Brethren and the Ministry for foreign affairs for USA. The aim of
this was for youth to build better relations after the war. In Finland the student ex-
change started at the 1950’s. After this the industry has grown and becoming more
popular. The field is filled with several different types of organizations. Part of the or-
ganizations are commercial, some are NGO’s and some work on voluntary basis.
(Maailmanvaihto Ry, 2015)

4
2 Theoretical approach: Cultural adaption
2.1 Definition of culture
All of us are part of several different cultures such as age, work and gender cultures. In
this thesis the focus is on national culture. National culture is often identified as being
within borders of a country. Even when we as human beings are unique people within
the same country we do share the same values, beliefs and history. (The Hofstede cen-
tre, 2015)
The word culture has many different meanings. It can mean the finer things in life such
as literature, art, dance, music and theater for example. Word culture is also used when
described a group of people that share the same values, beliefs, behavioral patterns, in-
stitutions and history. National culture is referred when talked about a group of people
living in the same country or geographical area. (Ferraro, 2010, 19-22.)
Culture is not in our DNA but it is learned. Culture is shared among other people. Na-
tional culture is shared with people living in the same geographical area. People with the
same national culture often share similar beliefs, history, religion and values. Same
behavioral patterns and way of life is shared among the same culture. Culture develops
along time. Certain national culture develops as generations change. Globalization and
new developing technology have changed each and every culture. Current political situ-
ations and conflicts will affect the future generations and culture. (Ferraro, 2010, 19-
22.)
Culture has been defined by many. There are several hundred definitions of culture
created by anthropologists. The similarity on all is that they aim to conclude the differ-
ent aspects of culture such as its inheritance, shared history and values. A famous an-
thropologist Geert Hofstede defined culture as “software of the mind”. This definition
defines the facts that culture is a certain mindset that we each one have. It affects our
behavior and thinking processes. (Hofstede centre, 2015)

5
There are several layers of culture in all of us. This is depending on our place and way
of living. Some particular layer being: national culture, regional culture, gender culture,
generation culture, social class and for those that are in working life, corporate culture.
As there are so many different levels of culture there are some conflict in our mental
programming for example our religious views may be in conflict with our values. (Hof-
stede, 2010, 17-26.)
2.2 Stereotypes, prejudice and generalization
Stereotypes are used by all of us. They are often being used without realisation of it.
Stereotype is defined as being an oversimplified image or an idea of a person or a na-
tion. This is image is not based on any facts or personal encounters but the image re-
ceived from media, friends and society. Stereotypes of a certain nation can either be
viewed as negative or positive but they are primarily negative. People tend to produce
negative stereotypes more easily than positive ones. Most often stereotypes are unfair,
problematic and over generalised. Stereotyping other people and nations is seen easy
and often comes automatically.
(Nelson. 2009, 2, 27-29, 86.)
All human beings have a need to belong to a certain group of people. People who
don’t belong to the same group as one are often seen as an undifferentiated. Attitudes
towards other groups are shaped by the stereotypes one has. These stereotypes are of-
ten shared and learned from our own group and culture around us. Stereotyping other
is an automatic process where there is no realisation of stereotyping others. There is a
focus that people today should be seen as individuals rather than a part of a certain
group. Researches claim that stereotyping can be weakened by affecting the automatic
process. People ought to response to negative stereotypes and change their behavior
when stereotypes or prejudice are being used. With enough motivation a person can
change the way they use and feel about stereotypes.
(Psychology Today. 2015)

6
Prejudice is opinion or judgment of a person or a group before knowing any facts. It
can be an unfair feeling or dislike. There are no real reasons why a person feels preju-
dice towards others. Prejudice can be toward to a group or an individual. Prejudice in-
cludes discriminating behavior which will lead to unfair treatment of the person. This
may cause mental and physical damage to the person.
(Merriman-Webster, 2015) (Nelson 2009, 2-7.)
Generalization is an opinion that is formed about the entire group of people based on
one or a few people from that group. Generalization does work the other way around
as well. An entire group can be identified by the look and behavior of one individual
when he meets the characteristics to fit into it. Generalization does not happen if the
group does not seem united together. (Merriman-Webster, 2015)
Having prejudice towards people and stereotyping them may lead to many problems in
the society if not acknowledged by the person using them. When people are stereo-
typed we tend to see the negative aspects first. This may lead to discrimination for ex-
ample in job hiring. There is a tendency to use stereotypes and categorize people when
feeling lazy or unfocused. This is because stereotyping is a norm and often used with-
out realizing it.
(Merriman-Webster, 2015) (Nelson 2009, 7-9, 183-184, 191.)
2.3 Hofstede’s cultural dimensions
Geert Hofstede is a Dutch anthropologist. He has created the cultural dimensions the-
ory that will let us look at cultures through six different dimensions. The study that the
national cultural dimensions are based on was done between the years of 1967-1973.
The data was collected from IBM; employees with over 70 different nationalities.
(The Hofstede centre, 2015)
The first four dimensions are: Power distance, individualism vs. collectivism, masculin-
ity vs. femininity and uncertainty avoidance. The fifth dimension: Long term orienta-
tion was added to the list of dimensions in 1991. The latest dimension indulgence vs.

7
restrained was added in 2010. These dimensions are looking at the different aspects of
a national culture. (The Hofstede centre, 2015)
2.3.1 Power distance
This dimensions focuses on the degree that the people expect and accept how the
power is distributed. It indicated the level that people accept the fact that power is dis-
tributed unequally in institutions. Such institutions include family, workplace, school
and community. (Hofstede, 2010, 53-60.)
In countries that rank low on the power distance scale are not dependant on the leader
and they are preferred to be consulted. In these cultures bosses are easily approached.
People are very friendly among each other and not dependant on the hierarchy for ex-
ample teachers and students are on a first name basis. These countries prefer more au-
tocratic leadership. In low power distance countries the subordinates are given an op-
tion to voice an opinion and that opinion is also valued by the bosses. (Hofstede, 2010,
53-60.)
Countries with high power distance the subordinates are more dependent on the opin-
ion and tasks given to them by their bosses. Subordinates prefer and need to be told
their tasks by their bosses. Emotional distance between the boss and the subordinate is
large. They are very unlikely to be directly involved with one another. People in high
power distance countries either prefer to be dependent on higher opinion or then to-
tally reject the idea. There is a large gap between these two ways of opinion. (Hofstede,
2010, 53-60.)
2.3.2 Individualism vs. collectivism
Societies can be seen either being individualist or collectivist. Collectivist society can be
defined as a society where the interest of the group is greater than the interest of the
individual. In most collectivist countries the immediate family does not only consist of
parents and sibling but also grandparents, uncles, aunts and cousins. Children from
these societies often learn the concept of being part of a group. Groups are dependent

8
on one another and great level of loyalty is shared among themselves. The relationships
are built for life. Majority of the people in the world belong to a collectivistic society.
(Hofstede, 2010, 89-102.)
Minority of the people belong to an individualistic society. In these societies the indi-
vidual’s interests are greater than the society’s. Families normally only consist of par-
ents and their children, these families are referred as nuclear families. Other relatives
are often visited only occasionally and not on a daily basis. Children grow up learning
to think themselves as “I” rather than a part of a “we”. The emphasis of an individual
and individuality is greater in these societies. Children often move away from home in
a very early stage and are not dependent on their families support. Relationships are
seen as short term. (Hofstede, 2010, 89-102.)
2.3.3 Masculinity vs. femininity
The dimension of masculinity and femininity is based on gender roles and aspects that
are related to the other gender. Typically men are seen as assertive; strive for success,
strong and competitive. Women on the other hand are seen as caring, cooperative and
modest. This dimension is the most controversial of them all. It shows that nations do
differ greatly on their values. Wealth plays no role in the dimensions. Countries that
score high or low in masculinity can either be poor or wealthy; it is not determined by
which side they belong to. In other dimensions the more wealthy nations tend to be
more individualistic, have low power distance and weaker uncertainty avoidance level.
(Hofstede, 2010, 135-145.)
2.3.4 Uncertainty avoidance
This dimension calculates in which level the society is comfortable in the unknown fu-
ture and at the same time threatened by the uncertainty. The level of accepted uncer-
tainty defines whether the society feels the need for written rules and restrictions.
The question here is whether the society feels that need to control the future or let eve-
rything happen at its own pace. How the uncertainty of the future is handled is a great

9
part of any society. Societies have developed several ways to minimize the feel of un-
certainty such as religion, laws and technology. Religion helps us to understand the un-
certain facts that cannot be explained for example the life after death. Technology is
the most advanced of them all. Technology helps us to minimize the uncertainty set up
by nature. Laws are made so we are able to protect ourselves from other human be-
ings. (Hofstede 2010, 187-190.)
Modern and traditional societies are very similar on the ways they handle uncertainty.
The focus is on the fact that how people handle and feel about uncertain situations.
People in same society have similar feelings towards uncertainty. This is mainly because
of the shared values and beliefs. As culture the feelings towards change and unknown
are learned. People within the same culture share the same coping mechanism towards
uncertain situations. (Hofstede, 2010, 195-197.)
Countries with high score in the uncertainty avoidance dimension are also proven to
have high anxiety levels. These are normally countries where people talk and express
themselves with their hands and it is seen acceptable to talk loudly, show emotions and
talk over one another. Low uncertainty avoidance countries loud expressions and
show of emotions are disapproved. In these countries stress and anxiety cannot be re-
lieved in activity put is kept inside. It is evident that in these countries the cause of
death often is coronary heart disease. Life in these countries may be seen as dull which
results in people searching stimuli’s such as coffee and tea. Low uncertainty avoidance
countries have high consumption in tea and coffee. Alcohol consumption on the other
hand is lower in these countries.
(Hofstede, 2010, 195-197.)
2.3.5 Long term orientation
This dimension was listed along the original dimensions in the year 1991. The issue with
adding this dimension was that there were fever scored involved that in the origi- nal
four. The list of countries examined was only half of the original. The two ends at this
dimension are long term orientation and short term orientation. Countries that are long
term oriented are more focused on the future rather than the past. They have very

10
little focus on the history and tradition in the country. Countries scoring highest in this
dimension are China, Hong Kong and Taiwan. Short term oriented countries are ex-
actly the opposite. They are focused on the traditions of the country and preserving the
face on their culture. On top of short term oriented countries there are Nigeria, Paki-
stan and Canada. (Hofstede 2010, 238-239.)
Long term orientation can also be seen as how the society considers virtue. It has been
shown that Western cultures see that the truth is greater than virtue as in Eastern cul-
tures the search for the virtue is the reason for everything. The logical thinking origi-
nates form the view of the virtue. As in Western cultures the truth is the ultimate rea-
soning. In Eastern cultures they do not see matters in so black and white. There is no
true and false. The both opposites of a fact might as well be true. They also believe
there is something that is superior to true and false. (Hofstede 2010, 238-239.)
These two different dimensions have very different views on family values and educa-
tion. In short term oriented countries the opinion and acceptance of the family mat-
ters and affects the youth. These societies also have more belief in luck and traditions.
In long term oriented countries the ideas and beliefs differ between family members
and people have the possibility and willingness for independent opinions and behavior.
These societies also rely on education and knowledge rather than witchcraft and wis-
dom as short term oriented countries. (Hofstede 2010, 238-239.)
The future is mainly the issue of long term oriented countries. The fact that these soci-
eties do worry about is their actions consequences to the future generations. There is
also a desire for constant development and growth as human beings and as a society.
These societies have proven to have larger economical growth both in poor and
wealthier countries. Although now the long term oriented societies need to come to a
conclusion on the fact that there is no infinite economical growth. The current growth
has taken its toll on natural resources and the economy. (Hofstede 2010, 238-239.)
11
2.3.6 Indulgence vs. restrained
This dimension is the latest that has been added to the cultural dimensions theory. It
was added in 2010. It includes data from 93 different countries and is based on analysis
by Michael Minkov. Cultures that are more indulgence allows their society and people
to have more fun as to more restrained cultures the fun and gratification are more reg-
ulated. (The Hofstede centre, 2015)
Comparing indulgence vs. restrained to the country’s wealth it can be identified that of-
ten wealthy countries tend to be more indulgence as poor countries are restrained. There
is a difference in birth rates for well-educated people. In indulgent countries the birth
rates tend to be high as in restrained countries the birth rate is low. Societies liv- ing in
high indulgence countries have higher percentage of very happy people and peo- ple
who feel healthy. These societies see that people have control of their personal lives and
they put free time and time with friends into high standard. Time with friends is seen as
entertaining and fun which is why in restrained countries time spent with
friends is not seen important. (Hofstede 2010, 277-298.)
In restrained societies people tend to be cynics and they are not likely to remember
positive emotions. They also have the believe of something higher that controls their
happiness, they are unable to affect their own happiness. Thriftiness is important. The
living conditions in more restrained countries may be the effect as for example inten-
sive agriculture requires more focus and allows less time leisure and entertainment.
(Hofstede 2010, 277-298.)
2.4 The iceberg metaphor
Anthropologist Edward T. Hall created the iceberg metaphor. The metaphor was de-
veloped in 1976. It shows that in every single culture there are some aspects that can
be seen. This is shown in the metaphor as the top of the iceberg. In icebergs the top
part is only a tiny part of the entire iceberg. Most of the actual iceberg in under the
ocean. This explains that in the culture there are only a small amount of things people
from other cultures are able to see and identify for example architecture, art, music,

12
dance, greetings, behaviour and language. Under the ocean there are aspects of the cul-
ture such as beliefs, values, assumptions, prejudices, norms and attitudes. These as-
pects are often the reason that affects the visible part of the iceberg. The part that is
under the ocean cannot be seen. This identifies that in culture there are many things
that are larger part of the culture that we cannot see. Others will make their assump-
tion only by the top of the iceberg which is only a small part of the culture
Understanding a certain culture properly people ought to see and understand what is
underneath the surface. Edward T. Hall suggest that the way is to communicate and
spent time with people that are part of that culture.
(Edward T. Hall, 2015)
2.5 Culture shock
Oxford dictionary defines culture shock as “The feeling of disorientation experienced
by someone when they are suddenly subjected to an unfamiliar culture, way of life, or
set of attitudes” Culture shock is faced by everyone entering a new culture. Depending
on the person, length of the stay and destination country the culture shock is felt inde-
pendently and it varies every time a new country is entered. (Oxford dictionary, 2015)
Culture shock is experienced when a person from a certain culture enters another. Los-
ing all the familiar signs, patters and surroundings effect the reactions of culture shock.
Culture shock is normal and unavoidable process that is gone through in order to
adapt to a new culture. Often culture shock is seen as an unpleasant experience. Cul-
ture shock is affected by the expectations not meeting the reality. (Marx 1999, 5.)
Culture shock is by no means sign of weakness. Everyone goes through the different
stages of culture shock when moving into a new culture. In the end culture shock can
be seen as a positive sign and as gone through it results in better understanding and ad-
aptation to a new culture. Culture shock is often assumed of being a short term experi-
ence. The effects of culture shock may rise several months after arrival to the new
country. (Marx 1999, 5.)

13
2.6 Cultural adaptation project
There are certain identified stages of culture shock that everyone goes through as they
enter a new culture. The time and length of certain stage differentiates depending on
the person.
The first phase of culture shock is called the honeymoon phase. This is the phase were
everything in the new culture is still new, positive and exciting. The culture entered is
seen in positive light. In this stage a person is curious and interested about the new cul-
ture. When coming across some unpleasant and new situations at this stage those feel-
ings are suppressed by the positive aspects of the new culture. (Marx 1999, 7-9.)
The second phase of culture shock is called rejection. This is the stage were a person
clearly notices the different aspects of the culture in negative light. This is the stage
where people start to feel frustrated and annoyed by the new ways of behavior and
manners. Behavior changes dramatically compared to the honeymoon phase. A person
may feel uneasy and new situations are felt as uncomfortable. The reason behind these
feelings is the fact that a person feels unsure in a new environments and is unsure on
how to handle things. The feelings of belonging into a certain culture, familiar social
context and everything familiar is taken away. It is also common to compare the own
culture to the new culture and feel that their own culture is superior to other cultures.
(Marx 1999, 7-9.)
The third phase of culture shock is called recovery. This is a stage a person starts to see
the difference in a more positive light and feels more comfortable with the new cul-
ture. The phase normally starts with accepting the fact that we have hostile feelings to-
wards the new culture. The phase also includes the willingness to work through those
negative feelings. (Marx 1999, 7-9.)
Adjustment is the last phase of culture shock. At this stage person has adjusted to the
new culture. New patterns of behavior do not seem so strange and start to make sense.
At this stage a person accepts the way the new culture works and starts to respect it.
Depending on the length of the time spent in the new culture people may also become

14
fully comfortable in the new culture. This may lead to a person being bicultural if stay-
ing long enough in a new culture. (Marx 1999, 7-9.)
2.7 Reverse culture shock
Reverse culture shock is experienced upon arrival back from the host country to home
country. Reverse culture shock may even be more difficult than the actual culture
shock. The elements that normally are the reason for reverse culture shock are that
home country has been idealized during the exchange period and that changes back at
home were not expected. Coming back home is normally not what is expected. Stu-
dents normally forget that time has not stopped while they have been away. Their
friends and family have lived their daily lives for several months without them. It may
be hard to fall back into the old patterns. Dynamics among friends may have dramati-
cally changed during that period. (Students Abroad, 2015)
The better the cultural adaptation to the host culture is the harder the re-entry back
into the home culture will be. People will often go through the same feelings as in cul-
ture shock. There are the feelings of frustrations, alienation and misunderstandings.
(Students Abroad, 2015)
2.8 Summarizing discussion
It can be concluded that all of us are part of many different cultures. Normally when
talked about culture it is referred to the national culture. We all have stereotypes about
other national cultures. These stereotypes are most often negative. We are able to
come up with positive stereotypes as well. Although most often they are also perceived
as negative as people come up with negative aspects more easily. Stereotyping and dis-
criminating people is included in prejudice behaviour. All of us have prejudice towards
certain groups of people. In order for us to learn not to stereotype others we need to
understand when stereotypes are used and minimize the use of them. Nowadays peo-
ple are more likely to be seen as individual rather than as a part of a group. Groups can
be generalized by an individual. When we come across a person that see belonging into
a certain group we instantly assume the entire group behaves like that one individual.

15
Culture itself has been defined and researched by many. Geert Hofstede defined it as
“Software of the mind”. As we grow up we learn a certain set of rules and ways of be-
have. We are surrounded by people who have similar behavioural patterns and who
share the same values. Culture shock occurs when a person with a certain mind-set en-
ters a different culture. In the new country they have totally different mind-set. Enter-
ing a new culture all that is familiar is lost. Often even the most normal things such as
street sign are different. After the initial culture shock begins the adaptation process.
Culture shock is effected by everyone entering a new culture just the stages differ de-
pending on the individual. Stages must be gone through in order for the adaptation to
the new culture to be possible.
Adapting into a new culture may trick a reverse culture shock when returning home.
All that was familiar may now seem strange. Learning and understanding culture is vi-
tal. Internationalisation has had a large effect on new cultures coming and working to-
gether. Many companies nowadays are working in different cultures. It is important to
take into consideration the different cultures and their habits in the working environ-
ment as they have different values, beliefs and ways of working.

16
3 Research approach and methods
3.1 Research methods
The data gathered can be either qualitative or quantitative depending on the character-
istics. Both types of data have different ways to be collected, analysed and reported.
Quantitative is used when the general opinions, feelings and experiences are re-
searched. It relies to the opinion of the mass. The results of quantitative research will
be more reliable as the amount of data increases. The data is also considered to be
more easily analysed as it is mostly focuses on numbers. Opinions can also be meas-
ured in quantitative research in case of given different variety of options to answer. The
answers and questions in quantitative data are straight forwards and leave less space for
exploitation. (Walliman, 2010, 7-10, 69-75.)
Peoples ideas, believes and values are variables that are not researched by numbers but
rather with words. This is when the qualitative research will be more appropriate way of
approach. (Walliman, 2010, 7-10, 69-75.)
Quantitative method is used in this research. The aim is to collect as many responses as
possible. Experience of culture shock is an individual experience. Receiving more re-
sponses will result in more reliable outcome.
3.2 Data collection methods
Data collection is process in which information is gathered on a certain topic. There are
several ways of collecting data. The survey can be sent out to the target audience,
collected face to face or outsourcing the task. In this case the survey was distributed by
the exchange organization due to privacy laws. The data of the questionnaire will be
collected on a web based research. (Walliman, 2010, 7-10, 69-75.)
Collecting data may be problematic when the researcher is not present at the situation.
For example the situation and time spent on filling the survey may vary dramatically.

17
Often it is best when the researches is able to supervise the filling of the survey. This
will minimize the likeliness of the data being invalid. Often people may misunderstand
the questions at the survey. If there is no one present supervising misunderstandings
are not straightened. (Walliman, 2010, 7-10, 69-75.)
The collected data is one of two forms. It is either primary or secondary. The data that
is directly collected from the source either by observing or with a questionnaire is called
primary data. Secondary data is taken from sources such as book, articles were
the data has been interpreted. Primary data is more reliable than secondary data. (Walli-
man, 2010, 7-10, 69-75.)
3.3 Data analysis methods
The data analysis can be either quantitative or qualitative. Most of the surveys are
quantitative. In these the emphasis is on numbers. This method requires larger number
of data gathered. It works well when the general opinions and reasons for large num-
ber of people want to be researched. (Walliman 2009, 128-129)
In qualitative research the emphasis of the research is on understanding certain phe-
nomenon. The emphasis is not on numbers and there is no need for large number of
data gathered. The aim of this research method is to understand the deeper meaning of
some phenomenon. This method is popular in social sciences. The focus is on feelings,
perspective and experiences that people have.
(Walliman 2009, 128-129)
In this research quantitative method is used. The goal is to find out different aspects of
how the culture shock varies depending on the destination country. The aim was to in-
clude as many as possible answers from exchange students from certain destination
countries. For this research 200 responses were received. This gives a general idea on
the matters that is wished to research. Data gathered was analysed by comparing the
destination countries of the exchange students. The aim was find out how the destina-
tion affect the experience of the students and of there are some matters that affect the

18
culture shock. Reasons for the negative experiences were to be identified and to find
out results on how to minimize them.
3.4 Reliability and validity
There are a few factors that might affect the data’s reliability and validity. These factors
are listed below. The questionnaire is distributer by the national organisation. This
may lead into the directions being misread and different ways of distributing the ques-
tionnaire. This may effect for the gathered data not being reliable.
The questionnaire is distributed to former and current exchange students. Those cur-
rently on exchange have very fresh memories. Still they have not managed to distance
themselves from the experience which may be the reason for unreliable data on their
behalf.
On other half students been on exchange several years ago shall be sent the question-
naire as well. The concern here might be the fact that the time has made them to forget
the negative and unpleasant sides of the experience. Their answers may be affected by
time and only remembering the positive memories. Some of the memories may have
been faded and even changed slightly. On the positive note time may have lead the stu-
dents to look at the whole picture from distance which may have given them a better
understanding of it.
The questionnaire is distributed in English. English language is not the native language
for any of the students going on exchange. In some cases it is not the language in the
host country. This may lead to misunderstanding the questions which will result the
data being invalid. Research is not supervised as it is done which may affect that data is
not answered with the time and focus needed. It can be done in many different type of
circumstances that we are unable to control.
Over half of the respondents were on exchange in USA. It leads to the issue that the
data is not valid in cases when comparing answers as the data will show in every case a

large percentage for USA. There have been only a handful of students in certain desti-
nations. This means that the data does not equal to large enough segmentation in order
to show reliable data.
19

20
4 Key results and discussion
4.1 Respondents
The questionnaire was sent by the exchange organisation via email. Respondents had
approximately one month to answer to the questionnaire. Altogether 200 responses
were gathered in that time period. All the respondents were Finnish exchange students.
Out of all the respondents 89.5% were female. The remaining 10.5% were male. The
most popular destination country among the Finnish respondents was USA where
67% went on exchange; the second most popular destinations were Australia and New
Zealand were approx. 7% of the respondents went. The most popular destinations in
Europe were France and United Kingdom. There were also a few respondents who
had gone to Norway, Ecuador, Ireland, Canada and South Africa. In conclusion Eng-
lish speaking countries are the most common and most popular destinations for ex-
change semester.
Destination country
Other
USA
United Kingdom
Spain
Japan
Italy
Germany
France
Australia
18 = 9%
11 = 5,5% 4 = 2 %
3 = 1,5 % 2 = 1 % 2 = 1 %
11 = 5,5 %
15 = 7,5%
134 = 67%
0 10 20 30 40 50 60 70 80
Figure 1. Destination country (N=200). Other destination countries include New Zealand (4.5%), Ec-
uador (1%), Norway (1%), Canada 1,5%, Ireland (1%)and South Africa (1%). Numbers in the chart are
percentages.

21
The majority of all the respondents (64.5%) were at the age of 17 when leaving for ex-
change. 26% were 16-years of age and 8% were 18-years of age. There were 3 respond-
ents who were 15 when leaving for exchange. No one was older than 18. Almost all of
the respondents had left for exchange in year 2013 and 2014. There were two respond-
ents who had left in 2015. 92% of all respondents stayed 10 months in the host coun-
try. 4% of the respondents did not stay either of the offered time periods. Out of
those 4% two stayed longer than the official program period is and others left before
their original departure date.
100
90
80
70
60
50
40
30
20
10
0
8 = 4 %
Lenght of the exchange
184 = 92 %
8 = 4%
5 months 10 months Other? Please specify
Figure 2. Length of the exchange. N= 200. Other lengths include answers such as 2 months, 6 months,
7 months, 9 months, 11 months and 12 months.
4.2 Preparedness before exchange
In order to find out how prepared the exchange students were before their exchange a
few questions were made. Respondents were asked how many times before exchange
they had travelled in certain countries and what was level of knowledge in certain lan-
guages and especially in the language of the destination country.

22
How many times have you visited the following countries?
Oceania countries (e.g Australia, New
Zealand)
African countries
Asian countries
Latin American countries
North America
East European countries
0
1
2
3
more than 3
West European countries
0 50 100 150 200
Figure 3. How many times have you visited the following countries? (N = 200)
Most exchange students had visited Western countries several times before going on
exchange. Nearly half had also visited Eastern European countries in more than three
occasions. There was one person who had never visited any countries before the ex-
change. The third most visited countries were the Asian countries where nearly half of
the exchange students had visited at least once. The least visited countries were Oce-
ania and Latin American countries. Although a few respondents had visited those des-
tinations as well.
Majority of the exchange students who travelled to USA had not visited North Amer-
ica before but majority had visited European countries more than three times. Those
that decided to go for a non-English speaking country had generally more travel expe-
rience than those going to an English speaking country. They also did assess their lan-
guage skills a bit higher than others. Most of the students going to non English speak-
ing destination indicated of having knowledge of the language at the destination coun-
try.

23
250
Language skills
200
150
100
50
0 English French German Italian Spanish Swedish
1 2 3 4 5
Figure 4. Level of language skills. (N=200). Scale 1-5.Fluent in language is 5 and 1 is very little
knowledge.
All Finnish exchange students identified that they were able to communicate in English
and no one indicated of having poor knowledge. Among all the languages English was
the most well spoken language. Most commonly spoken languages among the ex-
changes students were English and Swedish. French, German, Italian and Spanish
were also spoken by a few. Respondents indicated of having little knowledge on these
languages.
One of the questions was about how well the organizations was able to prepare the ex-
change students for the exchange. Finnish respondents felt their home organization
had better orientation than their destination country. Only 3 respondents in Finland felt
that orientation was not useful at all. In destination country 51 people choose that the
orientation in the destination country was either not useful or had very little use for
them. Majority of those unhappy with the orientation where on exchange in the USA.
There were also several from United Kingdom, France and Australia.

24
16
Preparedness
1 2 3 4 5
79
61 57
72
63 58
45 53
45 50 53
39 31
23 20 20
12 14 3
The orieantation at my
home country was useful
The orientation at my destination country
was useful
I was provided with enough information at the beginning of
my exchange
My organisation was very supportive
Figure 5. Preparedness before the exchange. (N = 200). The scale is 1-5 were 5 is agree strongly and 1 is disagree
strongly.
Majority of the respondents felt they were given enough information regarding their
exchange. The only section where there is little dispersion is when asked if their organi-
zation had been supportive. 19.5% said that the organization was not supportive or
showed very little support. Although 29% felt that the organization was very support-
ive.
Looking into and comparing answers between all the respondents and those who felt
that they not given enough support from the organization a few differences can identi-
fied. 50% of those who did not receive enough support felt that the host country was
not as expected. Negative feelings among them ranked higher comparing to other re-
spondents. The greatest difference was that 54.1% felt angry as the number among all
was 33, 7%. 10% of all the respondents felt that they were not given enough infor-
mation at the beginning and 61% of them felt the destination country was not as they
had expected. This 10% answered of having stronger negative feelings than others.
They generally felt more unhappy, uncertain and insecure in the new host country.

25
4.3 Expectations and arrival
Respondents were asked if the destination country met their expectations. 26.5% of the
respondents answered that the destination country was better than expected. They
were mainly on exchange in USA, Australia and New Zealand. 66.7% of those who
were on exchange in Australia said that the destination country was better than ex-
pected. 80% of them said they were very excited to upon arrival. Exchange students in
Australia were also happier to be in a new environment compared to the average of all
destinations.
We have earlier noted that majority of the exchange students decide to spend their ex-
change period in United States. They scored a little higher than average on the destina-
tion country being either as expected or not being as they expected. They did score
higher than average to having high enthusiasm levels and feeling excited about the new
environment. 2% answered that he destination country was the complete opposite of
what they had expected. They were on exchange in USA and New Zealand. None of
them had visited North America, Oceania, Asian countries, Latin America or East Eu-
ropean countries before. They also showed very little language skills.
Was the destination country what you expected it to be?
4 = 2 %
74 = 37 %
52 = 26 % 70 = 35 %
Even better As expected Not as I expected Completely opposite of what I expected
Figure 6. Was the destination what you expected it to be? (N = 200)

26
37% answered the destination country not being as expected. Out of them 70% were on
exchange in United States. Majority of them had not visited North America before.
They also answered of not have travelled as much as the average. They evaluated their
skills in English language to not be as good as the average did. 54% said of being very
excited about being in a new country. Enthusiasm upon arrival was high among 43.2%.
It could be concluded that those with lesser language skills and those who have trav-
elled less may have higher expectations that do not necessarily meet the reality.
Was the destination country what you espected it to be?
United Kingdom
Spain
Japan
Italy
Germany
France
Australia
USA
Even better As expected Not as I expected Completely opposite of what I expected
0 % 20 % 40 % 60 % 80 % 100 %
Figure 7. Expectations on destination country divided by the destination. (N = 200)
Looking at the answers by the destination the difference can be seen. The destination
that was perceived better than expected was clearly Australia. On average Italy and
Germany were countries that were commonly seen not as expected. Al the respondents
on exchange in Italy answered the destination not being as they has expected. Most of
the destination countries show diversity between the three option; even better, as ex-
pected and not as I expected. In most cases these answers are divided to similar per-
centages in each destination country.

27
Respondents were given statements to agree or disagree with. Majority stated having
high enthusiasm levels, feeling happy and excited about being in a new environment.
The first statement, I felt confused in the beginning, the answers were quite diverse.
The answers that most disagreed with was being angry more often than usual. 64% an-
swered of strongly disagreeing with the statement.
I felt confused in the beginning
I had trouble falling into my daily routines
I got frustrated easily
In the beginning I was angry more often than usual
Upon arrival I felt alienated and alone from everyone
1 I felt insecure in the host country 2
3
I was uncertain 4
5
Upon arrival I was feelings unhappy
I was happy being in a new environment and culture
My level of enthusiasm was very high
Upon arrival in the host country I felt very excited
0 % 10 % 20 % 30 % 40 % 50 % 60 % 70 % 80 % 90 %100 %
Figure 8. Indicate whether you agree or disagree with the following statements. (N = 200). The scale is
1-5 where 1 would be disagreeing strongly and 5 agreeing strongly.

28
Mainly all the negative statements like being uncertain, insecure, feeling alone etc
gained more answers of disagreeing. The more positive statement gained more agree-
ing answers. We can conclude that the exchange students have more positive thoughts
rather than have negative feelings or troubles during their exchange semester. 15.5%
answered that they felt insecure among arrival. Majority of them were staying in USA.
Out of those that felt insecure 58% answered the destination country not being as ex-
pected. There is diversity on the scale when asked if the students felt confused in the
beginning.
I felt insecure in the host country
United Kingdom
Spain
Japan 1
Italy 2
Germany 3 4
France 5
Australia
USA
0 % 20 % 40 % 60 % 80 % 100 %
Figure 9. I felt insecure in the host country. (N = 200). The scale is 1-5 where 1 in disagree strongly
and 5 agree strongly. Numbers are percentages.
There are three countries were respondents have strongly agreed of feeling insecure in
the new host country. These countries are USA, Australia and United Kingdom.
Nearly 20% of students staying in United Kingdom answered of feeling insecure. Gen-
erally respondents disagreed with the statement of feeling insecure. Exchange students
who were on exchange in Spain and Italy were more likely to agree with the statement.

29
I felt confused in the beginning
United Kingdom
Spain
Japan 1
Italy 2
Germany 3 4
France 5
Australia
USA
0 % 20 % 40 % 60 % 80 % 100 %
Figure10. I felt confused in the beginning. (N = 200). The scale is 1-5 where 1 in disagree strongly and
5 agree strongly. Numbers are percentages.
There is a great diversion with the answers when asked if the students felt confused in
the beginning of their exchnage period. Germany was the only destination where no
one strongly agreed of feelings confused. These who strongly agreed of feeling
confused in the beginnig were on exchnage in Italy, Spain, Japan and France. It can be
concluded that in the non-English speaking destination the enxchnage are more likely
to feel confused. This is doubdt linked to the fact there at the beginning the exchnagea
students are not fluent in the destination language. Exchnage students in the USA also
gave a diversity of answers.

30
Negative feelings during exchange
Nervousness 138
Unhappiness 100
Irritation 94
Insomnia 43
Anger 66
Tiredness 163
Insecurity 95
Misunderstood 150
Depression 47
Loneliness 146
Figure 11. Ngative feelings during the exchange. (N = 200).
When asked if they felt any negative feelings during their exchange there were four that
rise above others. Almost every single one identified of feeling tiredness. The other
three that gained many answers were loneliness, misunderstood and nervousness.
When comparing the non-English speaking host countries to English speaking host
countries a few point about negative feelings were noted. 100% of the students who
stayed in non English speaking country felt misunderstood and tiredness. 90.9% of
them felt lonely where in English speaking destinations the percentage was 75,6%. Stu-
dents staying in non English speaking country answered of having more negative feel-
ings in most areas than those staying in English speaking country.
There were two feelings that received more answers from those whose host country was
English speaking, these were: insecurity and depression. In English speaking coun- tries
48.8% felt insecure where as in non English speaking countries the percentage

31
was 40, 9%. Some of the biggest differences between these destination countries were
that in English speaking countries 20, 9% suffered from insomnia compared to non
English speaking countries where the number was 31, 8%. The level of unhappiness
varied between these two. 68, 2% of the students staying in non-English speaking host
country said that they were feelings unhappiness. In English speaking host countries
the percentage was 52, 7%.
4.4 Social connections
86.5% the exchange student had sibling in the host family. Comparing the destination
countries, in Australia exchange students were more likely to have a sibling and in
United Kingdom the numbers were the opposite. The fact that whether they had or
hadn’t siblings didn’t affect the fact whether they managed to make friends easily or if
they had trouble making friends. Those that did not have siblings were slightly easier to
make friends with the locals. Those students that had siblings were more likely to have
spent time with the host family as to those who did not have siblings. They answered
that they would mostly spend time with new friends. It can be concluded that there are
no major differences in the experience whether the exchange student has or hasn’t sib-
lings.
Did you have siblings in your host family?
United Kingdom
Spain
Japan
Italy
Germany
France
Yes
No
Australia
USA
0 % 10 % 20 % 30 % 40 % 50 % 60 % 70 % 80 % 90 % 100 %
Figure 12. Did you have siblings in the host family? (N = 200)

32
In 52.5% the exchange student was the first exchange student that the host family had.
In other cases the host family had had one or more exchange students before. There
were a few issues that could be seen where the fact of whether family had had ex-
change students before affected. In those families where there had been exchange stu-
dents before the exchange students was more likely to make new friends easily rather
than those who were the family’s first exchange student.
How was making friends in the host country?
112 = 56 %
24 = 12 %
18 = 9%
46 = 23 %
I had trouble making friends I did not make any close friends just acquaintances
I mostly only made friends with other exchange students
I made friends easily with the locals
Figure 13. Making friends in the host country. (N = 200).
Majority of 56% said that they made easily friends with locals. These students were
mainly on exchange in USA. Students in Australia, New Zealand and United Kingdom
also made friends easily with the locals. It can be concluded that in English speaking
countries were the level of local language skills is high the exchange students make
friends more easily which eases the adaptation to the new culture. 75% of those that
made friends with locals responded of not thinking of leaving early where the general
percentage was 65%.
12% of the respondents said that they had trouble making friends. These respondents
were mainly from the USA, Japan, Spain, France and Germany. 84% of them also an-
swered of mainly spending time with host family rather than with friends or in hobbies.

33
It should also be noted that out of those 12.5% none left before their actual departure
date. Almost all of them excluding a few would recommend exchange for other people.
How did you spent your free time?
United Kingdom
Spain
Japan
Italy
Germany
France
Australia
With new friends
With host family
With hobbies
Talking to old friends back in home country
Talking to family
USA
0 % 20 % 40 % 60 % 80 % 100 %
Figure 14. How did you spent your free time? (N = 200).
Generally in all of the destination countries students ought to spend their spare time
either with their new friends or with their host family. Talking to their family back at
home received the least amount of answers. When comparing the answers between
spending time with friends or host family it can be seen that in Japan, Italy, France and
Australia students were more likely to spent more time with their host family rather than
their new friends. In Australia and USA the percentage of students talking to their
family or friends back at home was significantly smaller than in other destination coun-
ties.
4.5 Homesickness and early departure
Mainly the respondents did not experience the need to depart early. The reasons be-
hind some felt the need to before actual departure date were diverse. There were a few
main reasons for the early departure. Some wished to come to home early in order to
enjoy the summer season at home or to be able to start working during the summer.

34
Another reason was that there was a feeling that exchange year was not something for
them. Respondents felt that they were not the type of a person to be an exchange stu-
dent in the end and it just was not their thing. Problems with the host family were one
of the main reason people thought to leave early. The reasons why there were prob-
lems with the host family included strict rules, behavior was found strange, communi-
cation was different, unable to talk about their feelings to anyone. Quite a few students
also indicated that they felt lonely and especially during holidays such as Christmas.
The fact that they had trouble making friends affected as well. It was seen that locals
were nice and friendly in the school environment but it was hard making actual friends
to spent time with after school hours.
Did you think about going home early?
4 = 2 % 12 = 6 %
14 = 7 %
132 = 66 %
38 = 19%
All the time
In the beginning
Before the end
Maybe a few times
No
Figure 15. Did you think about going home early? (N = 200).
66% of the respondents did not think about leaving early at all. 19% thought about a
few times. Only 2% thought all the time about leaving early. Those exchange students
that actually came home before their actual departure date answered very diverse an-
swers if they felt about going home early. 23% said they did not think about going
home at all. 23% answered of all the time thinking about going home. Options: maybe
a few times and in the beginning also received 23% each, of the answers among those
that left before their actual departure date.

35
Below is the similar chart as above. Here the difference between countries has been separated. Num-
bers are percentages.
Did you think about going home early
United Kingdom
Spain
Japan
Italy
Germany
France
Australia
USA
All the time
In the beginning
Before the end
Maybe a few times
No
0 % 20 % 40 % 60 % 80 % 100 %
Figure 16. Did you think about going home early? Answers by the destination country. (N=200).
Majority of the exchange student (66%) did not think about coming home early. This
number is the greatest when the destination country has been either Australia or
United states. 19% of the respondents’ answers that they were think about going home
early a few times. This number is largest in Italy and Germany. Only a few answered
that they thought about going home in the beginning of the exchange. These students
were on exchange in Spain, France, Australia and USA. There were a few students who
felt all the time that they wished to go back home. They were at USA United Kingdom
and Spain. It can be clearly seen that the percentage for Spain is greatly larger than for
United Kingdom and USA.
6.5% of the respondents came home before their actual departure date. Their length of
the stay varied between 2-9 months. These exchange students mainly stayed in families
where they had siblings and the family had had more than one exchange student before
them. 69% of them answered that he destination country was not as they had ex-
pected it to be. The reasons behind the early departure included not getting along with
the host family or not adapting to their way of life, lack of activities and the feelings
that they had already gotten everything out of the exchange experience. Some an-
swered that they wished to come home for summer jobs or to have a vacation with
36
their family. The actions that helped to cope with the homesickness mainly included
talking either friends or family back at home, spending time with new friends and start-
ing new hobbies. The feeling of homesickness mainly occurred halfway through the ex-
change period. In cases where they had left early almost all of them would still recom-
mend exchange to other people. Those who came back early had been on exchange in
USA, United Kingdom, Spain, France, Norway and Ecuador. Majority of them had
stayed either in USA or United Kingdom. Those who left early choose more negative
feelings than other. 70% of them choose that they felt loneliness, misunderstood, inse-
curity, tiredness, unhappiness and nervousness.
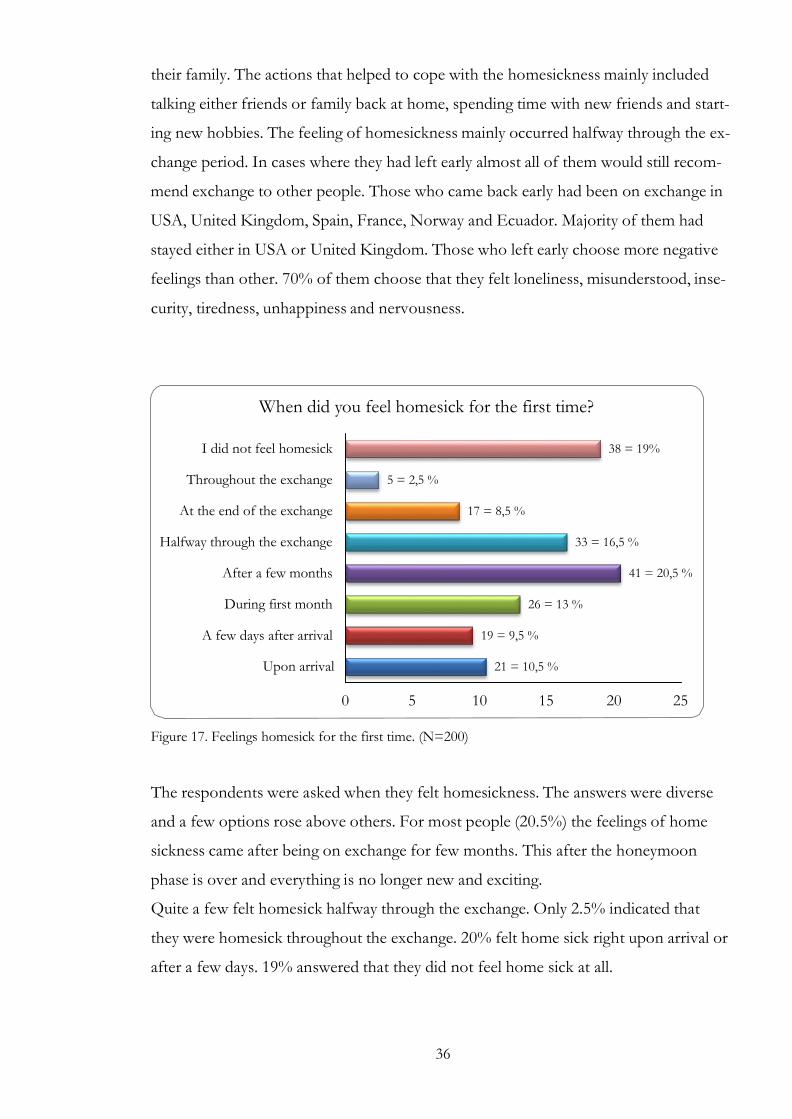
When did you feel homesick for the first time?
I did not feel homesick 38 = 19%
Throughout the exchange 5 = 2,5 %
At the end of the exchange 17 = 8,5 %
Halfway through the exchange 33 = 16,5 %
After a few months 41 = 20,5 %
During first month 26 = 13 %
A few days after arrival 19 = 9,5 %
Upon arrival 21 = 10,5 %
0 5 10 15 20 25
Figure 17. Feelings homesick for the first time. (N=200)
The respondents were asked when they felt homesickness. The answers were diverse
and a few options rose above others. For most people (20.5%) the feelings of home
sickness came after being on exchange for few months. This after the honeymoon
phase is over and everything is no longer new and exciting.
Quite a few felt homesick halfway through the exchange. Only 2.5% indicated that
they were homesick throughout the exchange. 20% felt home sick right upon arrival or
after a few days. 19% answered that they did not feel home sick at all.

37
Indicate the degree to which the following actions helped you to cope with adaptation to the host country
Seeing psychologist for help
Going to see school nurse
Joining different student associations 1
Taking host country language courses 2
3 Spending time with my host family
4
Started new hobbies 5
Spending time with my new friends
Talking with my friends and family back at home
0 % 10 % 20 % 30 % 40 % 50 % 60 % 70 % 80 % 90 % 100 %
Figure 18. The degree to which the listed actions helped to cope with adaptation to the host country.
(N = 200). The scale was 1-5. Where 1 stands for the fact that it was not helpful at all and 5 that it
helped a lot.
There were a few most popular actions that helped the exchange students to cope with
adaptation to the new host country. The action that was seen as most helpful was to
spent time with new friends. Over half of the respondents found it very helpful. Other
helpful actions were: starting new hobbies and spending time with the host family.
There were two options that were not seen helpful. These were seeing a psychologist
for help and going to seeing the school nurse.
The respondents were able to write down their own actions that helped them to cope
with the adaption. The actions they wrote down were for example: writing down feel-
ings, writing a blog and talking to a closest teacher. It is a concern that a few wrote that
eating or eating and throwing up helped them to cope with the adaptation process. We
can conclude that the main actions that help exchange students to adapt to the new host
country are spending time with locals, making friends and having hobbies in their spare
time. Writing down feelings or daily happening and talking to someone helps as

38
well.
4.6 Reverse culture shock
Reverse culture shock is often experienced when returning to your home culture after
being in a new culture. Sometimes the reverse culture shock can be even stronger than
the actual culture shock. Most often their friends from home have gotten used to not
having them around as they have been away for such a long time. It may be hard for
the exchange student to understand and see that life hasn’t stopped while they have
been away.
200
When arriving back home how did you feel?
180
160
140
120
100
80
60
40
20
0
Happy to be home
Left out Not
belonging
Sad Lonely Irritated Longing to
go back to host country
Figure 19. Feelings when arriving back at home. (N = 200).
The respondents were asked about their feelings when they arrived back to their home
country. They were able to choose more than one option. 89% were happy to be back
at home. Yet 60% were still longing to go back to the host country. As we can con-
clude from the data the feelings when arriving home are quite divided. 80% of them
who were still longing to go back to the host country were also happy to be at home.

39
29.5% had the feeling of not belonging when arriving home. 15% felt left out. These
are feelings that might trigger reverse culture shock as exchange students realize that
life back at home has not stopped while they have been on exchange.
Did you have trouble falling back into your own life?
Yes 76 = 38 %
No 124 = 62 %
Figure 20. Did you have trouble falling back into your own life after the exchange? (N = 200).
38% out of all the respondents admitted that they had trouble falling back to their own
life after the exchange. 50% of them had spent their exchange period in USA; other
countries were Australia and New Zealand. In the results it shows that these people
who had trouble falling back to their own life were generally more exited upon arrival,
the destination was better than expected, they were happy in the new environment.
They spent more time with their nee friends and less time speaking to friends and fam-
ily back at home. They also answered that when back at home majority of them felt
like not belonging, sad and longing to go back to the host country. It can be concluded
that those who spent more time with the locals and are enjoying the experience are the
once that are affected by the reverse culture shock the strongest.

40
What were your feelings towards the host country when you went back home?
20 = 10 %
26 = 13 %
44 = 22 % 110 = 55 %
Wished to stay at the host country
I feel like I have another home
Happy to leave Indifferent
Figure 21. Feelings towards the host country after coming back home from the ex- change. (N =
200).
Feelings towards the host country after returning home were asked. Clearly the most
popular answer by 55.5% was that they felt like they now have another home in the
host country. Only 13% were happy to leave. Out of that 13% only 7.6% left before
their departure date.
4.7 The experience
There are a few factors that point out when looking at the difference between those
that had a successful exchange year and to those who feel that it was not what they
wished for. Those that identified that the exchange was not what they wished for had
mainly similar feelings as others. They show that slightly spent more time with other
exchange students rather than locals. They also seemed to have more trouble making
friends with the locals. Majority of these exchange students also had been in a host
family that hadn’t had any or just one exchange student before. When arriving to the
host country those who did not have the experience they wished for scored highly in

41
that upon arrival the destination country was not as they expected. The negative feel-
ings during exchange such as loneliness, misunderstood, tiredness and unhappiness
scored significantly higher among those unhappy with the exchange.
How do you feel about your exchange afterwards?
United Kingdom
Spain
Japan
Italy
Germany
France
Australia
USA
Best experience ever
Better than I expected
Met my expectations
Not the experience I was hoping for
0 % 20 % 40 % 60 % 80 % 100 %
Figure 22. Feelings about the exchange afterwards. Answers divided by the destination country. (N =
200).
Majority of all the respondents said of having an either best experience ever or better
than expected. The statistics show that they made friends more easily. Over half of
them also said to have spent more time with the locals rather than other exchange stu-
dents.
Over 60% of the exchange students who spent their exchange semester in Australia an-
swered of having the best experience ever. This is the highest percentage this option
had. The second highest percentages are France and USA which received a bit over
40% each. There were three destinations that did not receive any answers for the ex-
change being the best experience ever. These countries were: Japan, Italy and Ger-
many. Five destination countries received answers of the experience not being what the
students had hoped for. These countries were USA, France, Italy, Spain and United
Kingdom. Highest percentage in was in Italy, where the percentage was 50%. In
France 36% answered of the exchange being not the experience they were hoping for.

42
Generally 90% of the exchange students would recommend exchange to other people.
5% answered to maybe recommending exchange to others. These students were on ex-
change in USA (50%), United Kingdom (30%), France (10%) and Spain (10%). Look-
ing at all the answers between those who answered of maybe recommending exchange
and others a few points can be made. Looking at the social connections they answered
of having harder time making friends than the general. 20% of them answered of not
making any close friends just acquaintances where as the general percentage was 12,
5%. 70 % of those who would maybe recommend exchange answered of not having
the experience they expected. The remaining 30% answered the exchange of being as
expected.
Would you recommend exchange for others? 6 = 3 % 10 = 5 %
4 = 2 % Yes
No
180 = 90 % Yes, in a different host country
Maybe
Figure 23. Recommending exchange to others. (N = 200).
Looking into the 2% who answered of not recommending exchange for others a few
conclusions can be made. They were on exchange in USA (75%) and United Kingdom
(25%). None of them did leave before their actual departure date. Although a few of
them thought about coming home early, at the beginning and at the end of the ex-
change. These students answered of making friends easily with the locals and none of
them indicated of having any trouble having or making friends. All of them also had
siblings in the host family. All of them answered that the destination was not what they
had expected it to be. Looking into to the preparedness of these students it can be
noted that the issue of why they would not recommend exchange to others might lie
there. As 75% answered of the organization of not being supportive. 50% answered

43
they were not provided with enough information at the beginning. Looking into the
orientations given at home country and destination neither of them received good
scores among them. Orientation at home country was given a bit better marks, where
50% disagreed with the statement that the orientation was useful. The orientation at
the destination was seen as not useful for 75% of them who would not recommend ex-
change for others. We can conclude that the preparing the exchange students properly
plays a huge role on how they perceive the entire experience.
Taking a closer look at the 3% who would recommend exchange in another host coun-
try a few points can be made. These students were on exchange in France (20%), Italy
(20%), United Kingdom (20%) and USA (40%). Looking into the social connections
of those who would recommend exchange in another host country it can be noted that
they had more trouble making friends that the general. 60% answered of spending more
time with other exchange students rather than locals. 20% had trouble making friends.
The remaining 20% made friends easily. Between all respondents 56% an- swered of
making friends easily. 60% of them who would recommend exchange in an- other
destination country answered that the destination was not what they had ex- pected.
60% also answered that the experience was not what they had expected. When asked
about going home early among all 18,5% answered that they had thought about going
home for a few times as where those who would recommend exchange in an- other
country 60% had thought about going home a few times.

44
Would you recommend exchange to other people?
United Kingdom
Spain
Japan
Italy
Germany
France
Yes
No
Yes, in a different host country
Maybe
Australia
USA
0 % 20 % 40 % 60 % 80 % 100 %
Figure 24. Recommending exchange to others by the destination country. (N = 200).
There were three countries where all of the exchange students would recommend ex-
change for other. These countries were Japan, Germany and Australia. 92% of the ex-
change students in USA would recommends exchange for others. As noted earlier
there were two countries where there were students who would not recommend ex-
change for others. These countries were United Kingdom and USA. In USA this is
2,2% of all the exchange students the percentage among the exchange students in
United Kingdom was 9%.
In France, Italy and United Kingdom a few exchange students answered of recom-
mending exchange in another host country. This percentage in Italy was 50% but this
percentage does not give precise picture of the reality as the questionnaire was submit-
ted by two exchange students residing in Italy.

45
5 Conclusion and recommendation
Preparing the students before going on exchange is vital. This is start of their experi-
ence. It is important to provide them with enough vital information. This information
and support given will affect the entire experience. As stated earlier in the thesis those
who were unhappy with the information and support given often felt the destination
was not what they had expected. In order to avoid this students should be given
enough information about the destination country in order to make sure they do not
possess any unreal expectations about the destination. Those that were unhappy from
the beginning were also likely to not recommend exchange for others.
Students with more travel experience had more realistic idea of the destination country.
It can be noted that those with lesser language skills and less travel experience tend to
go on exchange to English speaking country. Students who have chosen non-English
speaking country possess more travel experience. They also grated their language skills
higher. In case the exchange organisations is able to affect the destination country the
student wishes to choose they ought to look at the skills and experience mentioned
above. Students should be provided with a destination suitable for them it order to
make their experience as pleasant and successful as possible.
It is important that the exchange students are comfortable and get along well with their
host family. Students that had host siblings were more likely to spent time with their
host family. It is an advantage for the adaptation of the exchange student if the host
family has had exchange students before. These student showed to have a tendency to
make friends more easily which effected them being more comfortable in the new host
country. Those students that were able make friends easily also did not think about go-
ing home early as much as those who had trouble making friends. Suggestion would be
to provide the first time host families with enough information in order for them to be
able to support and understand the exchange student. Students should be encouraged to
make friends in order for them to adapt.

46
Language skills have link to how well the students manage to make friends. Those stu-
dents that are fluent with the host language also indicate of making friends more easily.
In order for the students to adapt they should be provided with the option of learning
the local language if necessary.
There were several reasons why students wished to depart early. Some of them were
not linked to not adapting or not getting along with the host family. Some wished to
come home for example to start a summer job and enjoy the summer back at home.
Major reason for students to come home early were problems with adapting. Reasons
mentioned were for example different ways of communicating and strict rules. These
are reasons that could be avoided by providing enough information to the students
about the new culture and culture shock. Some students mentioned they felt they were
not able to talk and communicate with the host family. Organizations ought to check in
with the students and the host family in order to make sure things are working well
among both parties. Host families should be encouraged to look into the culture and
ways of the exchange students in order for them to understand their way of communi-
cating.
Feeling home sickness is common among exchange students. In the survey they identi-
fied that spending time with the host family and new friends did help. Writing down
their feelings should be encouraged even throughout the exchange. Keeping in touch
with the exchange students is advised in order to minimize any harmful behaviour.
Concern is that there were a few who indicated of having an eating disorder which
helped them to cope with the culture shock. This sort of behaviour should be looked
into and noticed if seen happen.
Coming back home from the exchange students showed mixed feelings. They were
happy to be at home and yet missing to go back to the host country. Most of them did
not have trouble falling back into their own lives. Often there are not too many people
back at home who have had the same experience as them. In order to minimize the re-
verse culture shock it would help if the students would be able to meet and talk about
their experience with other exchange students. It would be encouraged if the exchange

47
students would be able to continue the international experience back at home for ex-
ample by spending time with the exchange students coming to Finland. This would
even help the adaptation of the students coming to Finland when they have someone
who has gone through the experience.
Mostly the experience of an exchange year is recommended. Only a few would not rec-
ommend it and some would recommend in a different host country. The reasons be-
hind this were often the trouble of having friends or the fact that the host country and
the experience was not what they had expected it to be. This is why it is important to
be able to provide the exchange students with enough information. If possible old ex-
change student from the same destination should be encouraged to talk to the future
exchange students in order for them receive first-hand information.

48
Bibliography
Hofstede, Geert, Hofstede Gert Jan, Minkov, Michael, P. 2010. Cultures and organisa-
tions: software of the mind. 3rd edition. McGraw Hill. United States of America
The Hofstede centre 2015. National culture dimensions
URL: http://geert-hofstede.com/national-culture.html. Accessed April 1st 2015
Maailmalle 2015. Vaihto-opiskelu
URL: http://www.maailmalle.net/opiskelu/vaihto_opiskelu. Accessed April 20th 2015
Maailmanvaihto Ry 2015. Maailman vaihdon ja ICYE:n historia
URL: http://maailmanvaihto.fi/maailmanvaihto/historia. Accessed November 7th
2015
Marx, Elisabeth. P.1999. Breaking through culture shock. Nicholas Brealey publishing.
London
Merriman Webster 2015. Prejudice
URL. http://www.merriam-webster.com/dictionary/prejudice. Accessed November
6th 2015
Merriman Webster 2015. Generalization.
URL http://www.merriam-webster.com/dictionary/generalization. Accessed Novem-
ber 7th 2015
Nelson, Todd. D 2009. Handbook of prejudice, stereotyping and discrimination. Psy-
chology Press. New York.
Psychology Today 2015. Where Bias Begins: The truth about stereotype
URL: https://www.psychologytoday.com/articles/199805/where-bias-begins-the-
truth-about-stereotypes. Accessed April 10th 2015

49
Students abroad 2015. Reverse culture shock
URL: http://www.studentsabroad.com/handbook/reverse-culture-shock.php?coun-
try=general. Accessed April 24th 2015
Walliman, Nicholas. P. 2010. Research methods: The basics. Taylor and Francis Ltd.
M.U.A

Appendix 1. The survey
Nordic exchange students culture shock
Hi,
I am a third year tourism student from HAAGA-HELIA University of applies sciences, Porvoo Campus. For my thesis I am making a research regarding Nordic exchange students culture shock. With this survey we are gathering information in order to improve student exchange services.
Taking part in this questionnaire is voluntary and can be discontinued at any time. We encourage you to use 30-40 minutes to complete this questionnaire. In case you have any questions regarding the questionnaire please feel free to contact me: [email protected]
By filling the questionnaire you can take part to the lottery and win some of our 20 great prizes (5 prizes for each Nordic country). Please leave your name and contact information at the end.
1. Gender *
Female
Male
2. Home country *
Finland
Denmark
Norway
Sweden

Appendix 1. The survey
3. Destination country
Australia
France
Germany
Italy
Japan
Spain
United Kingdom
USA
Other? Please specify
4. Age when leaving for exchange *
15
16
17
18
Older? Please specify
5. The year when leaving for exchange *
2010
2011
2012
2013
2014
2015

9. How well did the organisation prepare you for your exchange? Tick where appropriate *
Appendix 1. The survey
6. Lenght of the exchange *
5 months
10 months
Other? Please specify
7. How many times had you visited foreign countries before going on exchange? Tick where appropriate *
West European countries
East European countries
North America
Latin American countries
Asian countries
African countries
Oceania countries (e.g Australia, New Zealand)
0 1 2 3 more than 3
8. Indicate your level of knowledge of the following languages before going to exchange Scale: 1= basic; 5 Excellent; incase of no knowledge, leave empty
English
French
German
Italian
Spanish
Swedish
Other foreign language, specify (please choose level before typing)
1 2 3 4 5

Appendix 1. The survey
use scale 1-5 where 1= Disagree completely 5= Agree completely
The orieantation at my home country was useful
The orientation at my destination country was useful
I was provided with enough information at the beginning of my exchange
My organisation was very supportive
10. Did you have siblings in your host family? *
Yes
No
11. Had your host family had exchange students before you? *
No
Yes, once
Yes, more than once
12. How was making friends in the host country? *
I had trouble making friends
I did not make any close friends just acquaintances
I mostly only made friends with other exchange students
I made friends easily with the locals
13. Was the destination country what you expected it to be? *
Even better
As expected
Not as I expected
Completely opposite of what I expected
14. Indicate whether you agree or disagree with the following statements:
1 2 3 4 5

16. When did you feel homesick for the first time? *
Appendix 1. The survey
1= disagree completely 5 = agree completely
Upon arrival in the host country I felt very excited *
My level of enthusiasm was very high *
I was happy being in a new environment and culture *
Upon arrival I was feelings unhappy *
I was uncertain *
I felt insecure in the host country *
Upon arrival I felt alienated and alone from everyone *
In the beginning I was angry more often than usual *
I got frustrated easily *
I had trouble falling into my daily routines *
I felt confused in the beginning *
If something else, please specify (choose level of agreement before typing)
1 2 3 4 5
15. Did you experience any of the following feelings during your exchange? You can choose more than one
Loneliness
Depression
Misunderstood
Insecurity
Tiredness
Anger
Insomnia
Irritation
Unhappiness
Nervousness

Appendix 1. The survey
Upon arrival
A few days after arrival
During first month
After a few months
Halfway through the exchange
At the end of the exchange
Throughout the exchange
I did not feel homesick
17. Indicate the degree to which following actions helped you to cope with adaptation to the host country 1 = Disagree completely; 5 = Agree completely
Talking with my friends and family back at home *
Spending time with my new friends *
Started new hobbies *
Spending time with my host family *
Taking host country language courses *
Joining different student associations *
Going to see school nurse *
Seeing psychologist for help *
If something else please speficy (please choose the level before typing)
1 2 3 4 5
18. How did you mostly spent your free time in the host country? You can choose more than one *
With new friends
With host family
With hobbies
Talking to old friends back in home country

500 characters remaining
Appendix 1. The survey
Talking to family
19. Did you spend more time with locals or other exchange students? *
Locals
Other exchange students
Both as much
20. Did you continue your hobbies or did you start new ones during your exchange? *
Continued old ones
Started new ones
Both above
Neither
21. Did you think about going home early *
All the time
In the beginning
Before the end
Maybe a few times
No
22. Did you leave before your actual departure date? *
Yes
No
23. Please discribe why you wished to leave early?

Appendix 1. The survey
24. If you chose any of the above (questions 21-23) when do you feel these feelings were the strongest?
Right after arrival
After the first few weeks
About halfway through the exchange period
Towards the end
Throughout the exchange
25. What were your feelings towards the host country when you went back home? *
Wished to stay at the host country
I feel like I have another home
Happy to leave
Indifferent
26. How do you feel about your exchange afterwards? *
Best experience ever
Better than I expected
Met my expectations
Not the experience I was hoping for
27. When arriving back home how did you feel? You can choose more than one *
Happy to be home
Left out
Not belonging
Sad
Lonely
Irritated
Longing to go back to host country

Appendix 1. The survey
28. Did you have trouble falling back into your old life? *
Yes
No
29. Would you recommend exchange to other people? *
Yes
No
Yes, in a different host country
Maybe
30. By leaving your name, phone number and e-mail address you can take part to the lottery and win some of our 20 great prizes (5 prizes for each Nordic country).
First name
Last name
Phone number
Email address