
finnish Banking In 2015 - Finanssiala · FINNISH BANKING IN 2015 Financial overview of Finnish...
14
8 June 2016 FINNISH BANKING IN 2015 Financial overview of Finnish banks
Transcript of finnish Banking In 2015 - Finanssiala · FINNISH BANKING IN 2015 Financial overview of Finnish...
8 June 2016
FINNISH BANKING IN 2015 Financial overview of Finnish banks
1
Finnish Banking in 2015
Contents
1 Financial environment ....................................................................................................................... 2
2 Banks operating in Finland ............................................................................................................... 3
2.1 Market shares of credit institutions in Finland ............................................................... 4
2.2 Banking group employees and offices .......................................................................... 5
2.3 Fast growth in corporate lending .................................................................................. 6
2.4 Slight increase in housing loan demand ....................................................................... 7
2.5 Proportion of long-term funding grew ............................................................................ 8
2.6 Banking sector’s profitability improved .......................................................................... 9
2.7 Bans strengthened their capital adequacy .................................................................. 11
Appendix: Banking groups’ performance 2014-2015
2
Finnish Banking in 2015
Finnish Banking in 2015
1 Financial environment
Despite the weak economic situation and the challenging market environment, the Finnish banking sector maintained good results and further strengthened its capital adequacy in 2015. Banks adapted to changes by cutting back on personnel, closing offices, making corporate restructurings and renewing their business models. The sector’s operations were influenced by low and even negative market rates, stricter regulation, expanding digitalisation and weak development of the national economy. All the while, the entire financial world is going through massive change with the arrival of financial technology, fintech. This introduces new participants and services and stirs up old operating models and structures. The more traditional banks need to clarify their future outlook, hone their strategy, improve their competence and develop their business models.
The new EU Capital Requirements Regulation (CRR) included the development of the Liquidity Coverage Ratio (LCR), which has been in gradual implementation since October 2015. The LCR applies to all EU banks, and its purpose is to ensure that banks have a sufficient amount of liquid assets to endure net cash outflows caused by a 30-day stress event. Although the current LCR requirement is only 60 percent, nearly all Finnish banks’ ratios already exceed 100 percent, which will be a future requirement. Banks’ general capital adequacy requirements have become stricter in recent years with new banking regulation. As part of the new regulation, the Finnish Financial Supervisory Authority (FIN-FSA) decided to set additional capital requirements (O-SII buffers) to systemically significant credit institutions (Nordea Bank Finland, OP Financial Group, Danske Bank and Municipality Finance). The requirements entered into force at the start of 2016. However, credit institutions’ core capital has already matched the requirements even before this. On a general level, the stricter capital adequacy requirements and increased regulation have reflected in banks’ growing expenses and tighter lending conditions. Banks operating in Finland have good capital adequacy, however, enabling access to inexpensive funding, which supports their competitiveness. The strength of the banking sector has enabled the growth of lending in Finland, thereby supporting the real economy in the still-continuing challenging economic conditions. In 2015, the Nordea group made preparations that would merge the Finnish, Norwegian and Danish subsidiaries into the Swedish parent company and turn them into branches. In March 2016, the Nordea annual general meeting approved of the plan. The implementation of the mergers has been planned for early 2017.
3
Finnish Banking in 2015
2 Banks operating in Finland
At the end of 2015, there were 281 credit institutions operating in Finland1. This is 10 less than at the end of 2014. Credit institutions include deposit banks and other credit institutions that do not take deposits, such as finance houses, credit card companies, mortgage credit banks, and Municipality Finance Plc. Finnish banking groups employed a total of 27,044 people at the end of 2015. This is an increase of about 80 employees compared to the previous year. A banking group’s number of employees also includes persons who work in insurance and asset management, if the parent group has parts that provide these services. The statistics also include the employees in Finnish banking groups’ branches abroad. Foreign deposit-taking banks’ Finnish branches employed a total of 1,241 persons at the end of 2015, which is about 20 persons more than in 2014. At the end of 2015, Finnish banking groups had 1,039 offices in Finland, which is 89 offices less than the year before. In addition, branches of foreign deposit banks had 73 offices in Finland.
1 Source: ECB
4
Finnish Banking in 2015
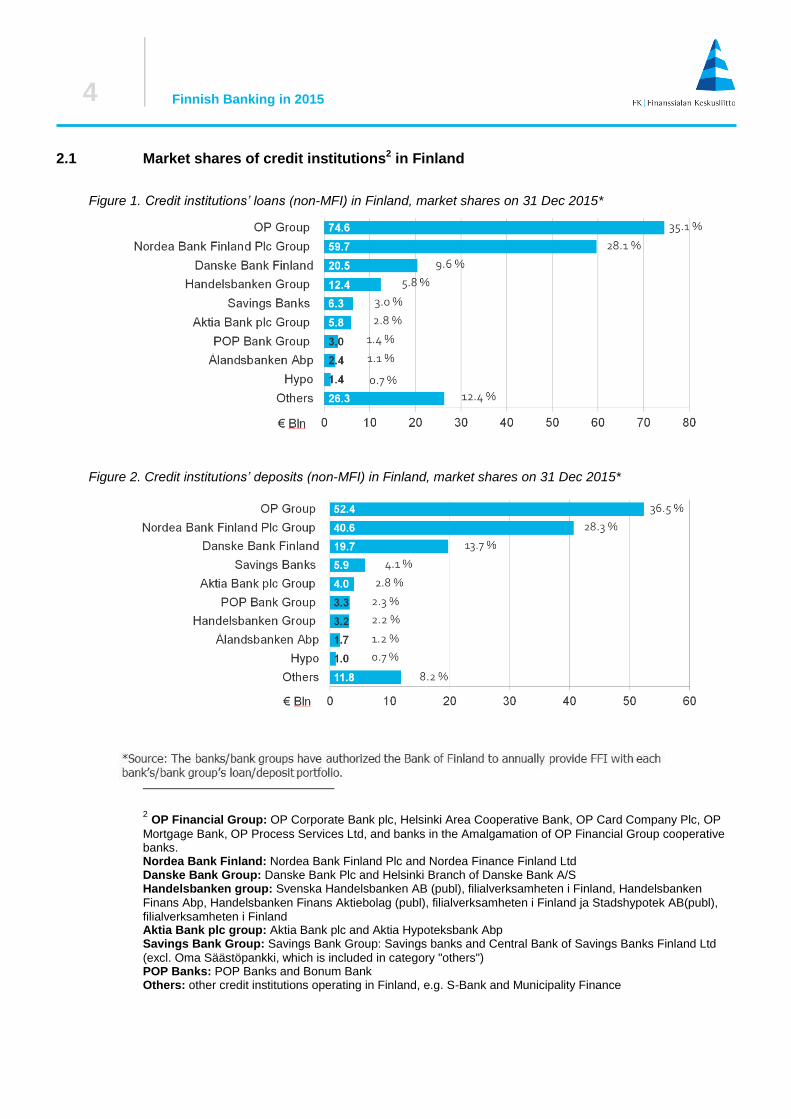
2.1 Market shares of credit institutions2 in Finland
2 OP Financial Group: OP Corporate Bank plc, Helsinki Area Cooperative Bank, OP Card Company Plc, OP
Mortgage Bank, OP Process Services Ltd, and banks in the Amalgamation of OP Financial Group cooperative banks. Nordea Bank Finland: Nordea Bank Finland Plc and Nordea Finance Finland Ltd Danske Bank Group: Danske Bank Plc and Helsinki Branch of Danske Bank A/S Handelsbanken group: Svenska Handelsbanken AB (publ), filialverksamheten i Finland, Handelsbanken
Finans Abp, Handelsbanken Finans Aktiebolag (publ), filialverksamheten i Finland ja Stadshypotek AB(publ), filialverksamheten i Finland Aktia Bank plc group: Aktia Bank plc and Aktia Hypoteksbank Abp Savings Bank Group: Savings Bank Group: Savings banks and Central Bank of Savings Banks Finland Ltd
(excl. Oma Säästöpankki, which is included in category "others") POP Banks: POP Banks and Bonum Bank Others: other credit institutions operating in Finland, e.g. S-Bank and Municipality Finance
Figure 1. Credit institutions’ loans (non-MFI) in Finland, market shares on 31 Dec 2015*
Figure 2. Credit institutions’ deposits (non-MFI) in Finland, market shares on 31 Dec 2015*
5
Finnish Banking in 2015
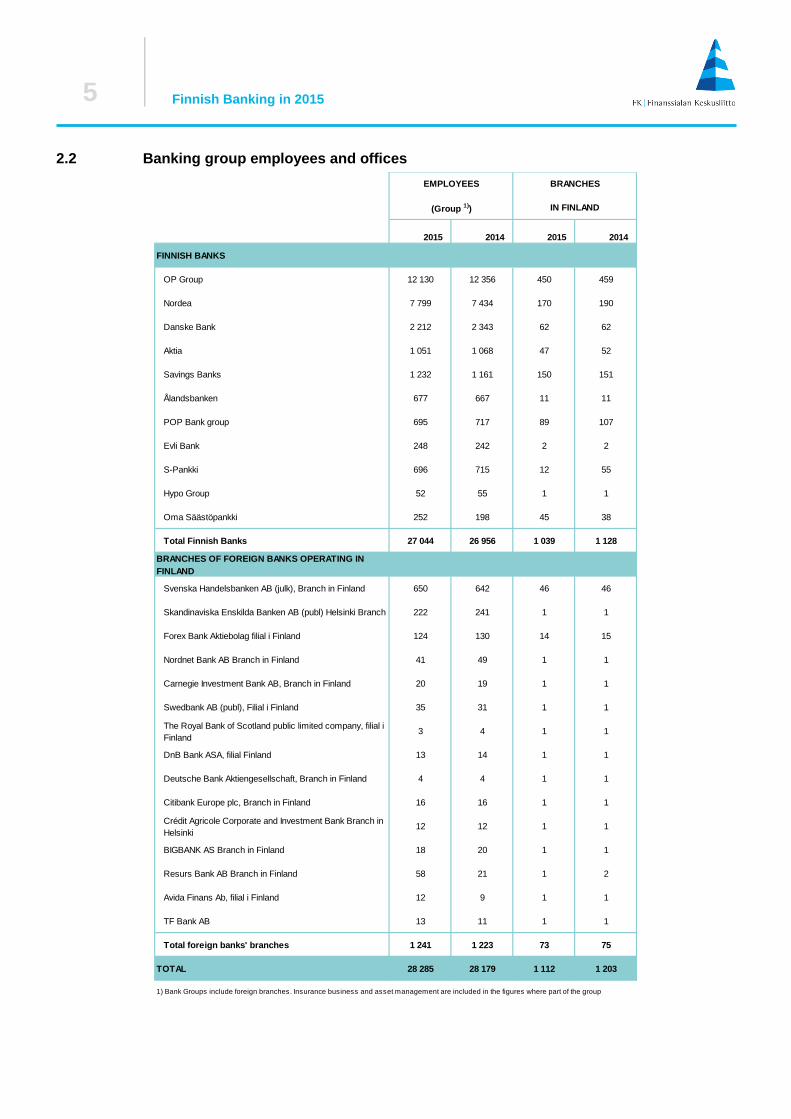
2.2 Banking group employees and offices
2015 2014 2015 2014
FINNISH BANKS
OP Group 12 130 12 356 450 459
Nordea 7 799 7 434 170 190
Danske Bank 2 212 2 343 62 62
Aktia 1 051 1 068 47 52
Savings Banks 1 232 1 161 150 151
Ålandsbanken 677 667 11 11
POP Bank group 695 717 89 107
Evli Bank 248 242 2 2
S-Pankki 696 715 12 55
Hypo Group 52 55 1 1
Oma Säästöpankki 252 198 45 38
Total Finnish Banks 27 044 26 956 1 039 1 128
BRANCHES OF FOREIGN BANKS OPERATING IN
FINLAND
Svenska Handelsbanken AB (julk), Branch in Finland 650 642 46 46
Skandinaviska Enskilda Banken AB (publ) Helsinki Branch 222 241 1 1
Forex Bank Aktiebolag filial i Finland 124 130 14 15
Nordnet Bank AB Branch in Finland 41 49 1 1
Carnegie Investment Bank AB, Branch in Finland 20 19 1 1
Swedbank AB (publ), Filial i Finland 35 31 1 1
The Royal Bank of Scotland public limited company, filial i
Finland3 4 1 1
DnB Bank ASA, filial Finland 13 14 1 1
Deutsche Bank Aktiengesellschaft, Branch in Finland 4 4 1 1
Citibank Europe plc, Branch in Finland 16 16 1 1
Crédit Agricole Corporate and Investment Bank Branch in
Helsinki12 12 1 1
BIGBANK AS Branch in Finland 18 20 1 1
Resurs Bank AB Branch in Finland 58 21 1 2
Avida Finans Ab, filial i Finland 12 9 1 1
TF Bank AB 13 11 1 1
Total foreign banks' branches 1 241 1 223 73 75
TOTAL 28 285 28 179 1 112 1 203
1) Bank Groups include foreign branches. Insurance business and asset management are included in the figures where part of the group
EMPLOYEES BRANCHES
(Group 1)) IN FINLAND
6
Finnish Banking in 2015
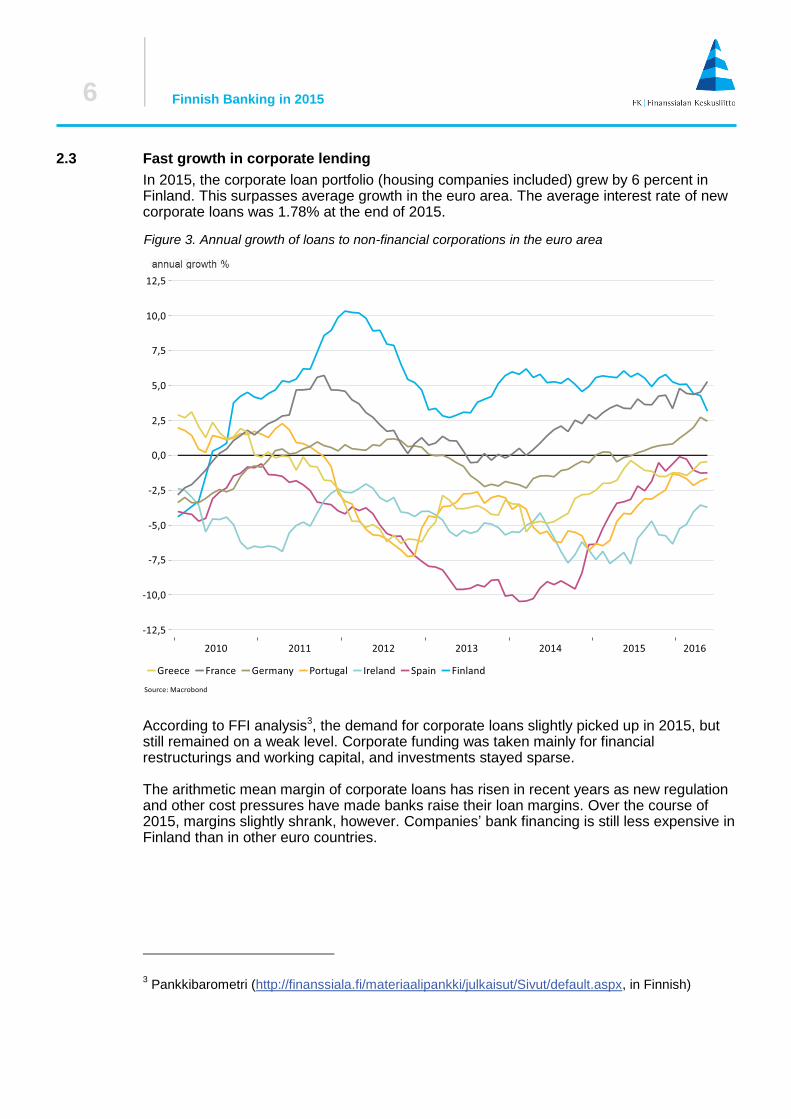
2.3 Fast growth in corporate lending
In 2015, the corporate loan portfolio (housing companies included) grew by 6 percent in Finland. This surpasses average growth in the euro area. The average interest rate of new corporate loans was 1.78% at the end of 2015.
According to FFI analysis3, the demand for corporate loans slightly picked up in 2015, but still remained on a weak level. Corporate funding was taken mainly for financial restructurings and working capital, and investments stayed sparse. The arithmetic mean margin of corporate loans has risen in recent years as new regulation and other cost pressures have made banks raise their loan margins. Over the course of 2015, margins slightly shrank, however. Companies’ bank financing is still less expensive in Finland than in other euro countries.
3 Pankkibarometri (http://finanssiala.fi/materiaalipankki/julkaisut/Sivut/default.aspx, in Finnish)
Figure 3. Annual growth of loans to non-financial corporations in the euro area
7
Finnish Banking in 2015
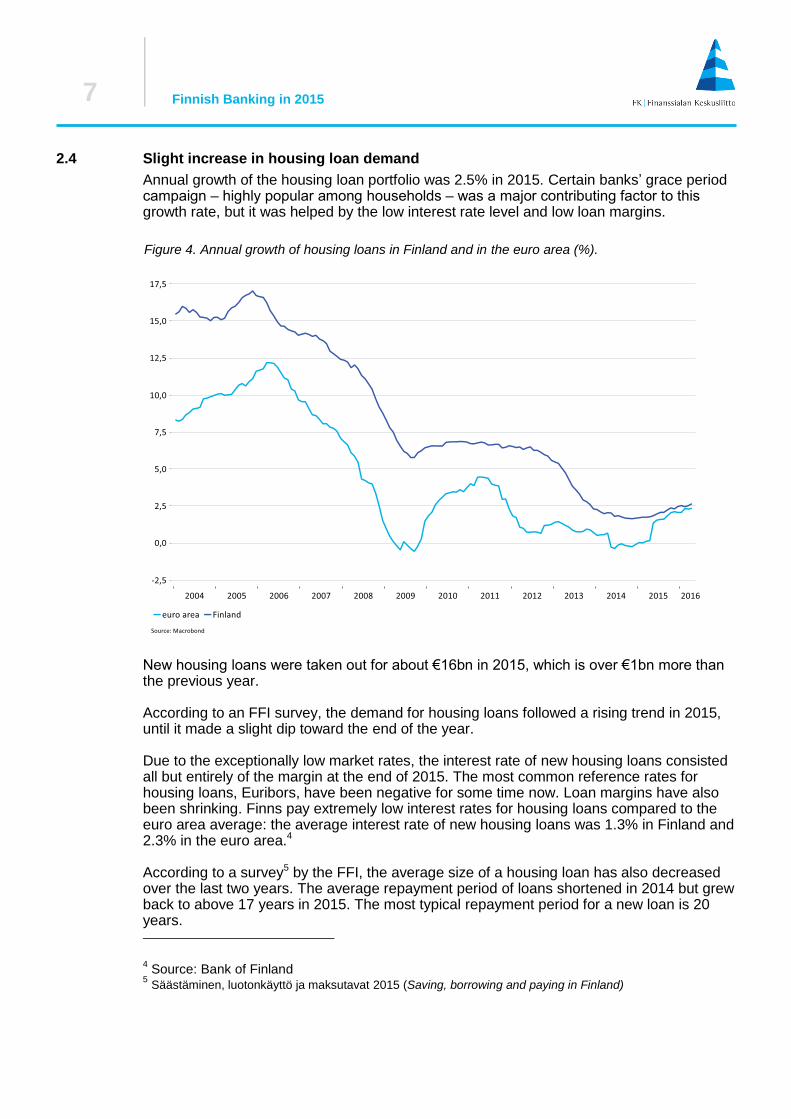
2.4 Slight increase in housing loan demand
Annual growth of the housing loan portfolio was 2.5% in 2015. Certain banks’ grace period campaign ‒ highly popular among households ‒ was a major contributing factor to this growth rate, but it was helped by the low interest rate level and low loan margins.
New housing loans were taken out for about €16bn in 2015, which is over €1bn more than the previous year. According to an FFI survey, the demand for housing loans followed a rising trend in 2015, until it made a slight dip toward the end of the year. Due to the exceptionally low market rates, the interest rate of new housing loans consisted all but entirely of the margin at the end of 2015. The most common reference rates for housing loans, Euribors, have been negative for some time now. Loan margins have also been shrinking. Finns pay extremely low interest rates for housing loans compared to the euro area average: the average interest rate of new housing loans was 1.3% in Finland and 2.3% in the euro area.4 According to a survey5 by the FFI, the average size of a housing loan has also decreased over the last two years. The average repayment period of loans shortened in 2014 but grew back to above 17 years in 2015. The most typical repayment period for a new loan is 20 years. 4 Source: Bank of Finland
5 Säästäminen, luotonkäyttö ja maksutavat 2015 (Saving, borrowing and paying in Finland)
Figure 4. Annual growth of housing loans in Finland and in the euro area (%).
8
Finnish Banking in 2015
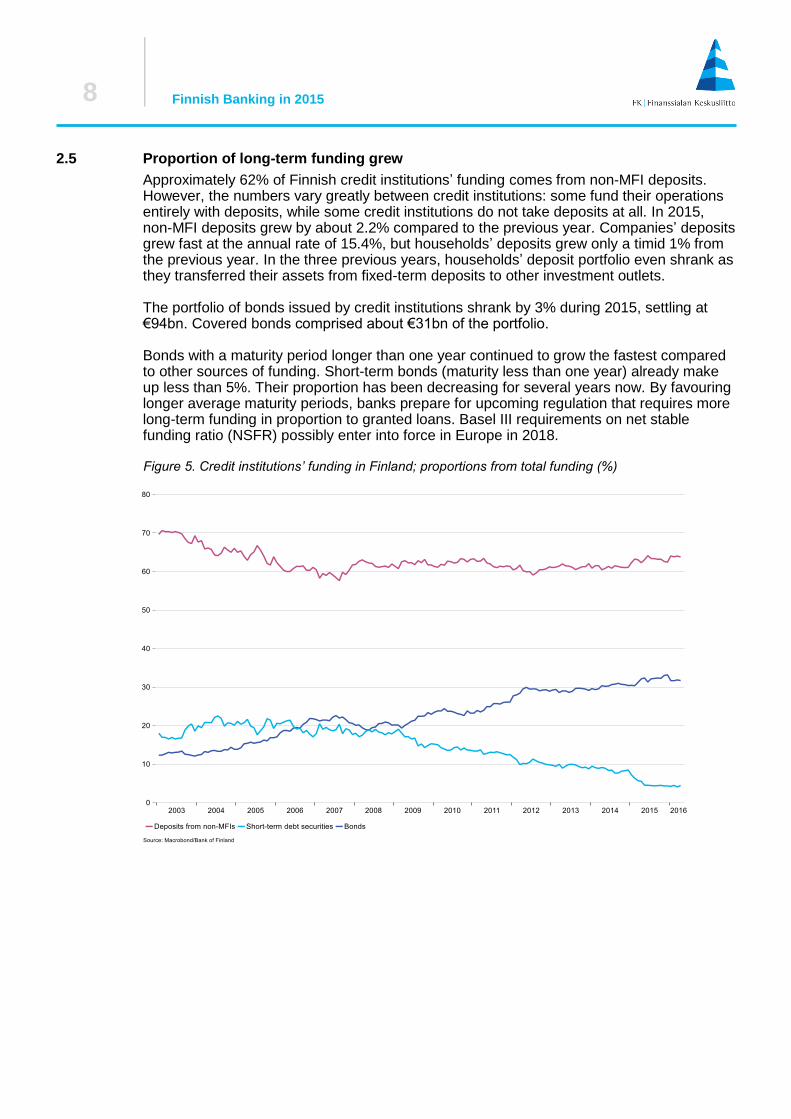
2.5 Proportion of long-term funding grew
Approximately 62% of Finnish credit institutions’ funding comes from non-MFI deposits. However, the numbers vary greatly between credit institutions: some fund their operations entirely with deposits, while some credit institutions do not take deposits at all. In 2015, non-MFI deposits grew by about 2.2% compared to the previous year. Companies’ deposits grew fast at the annual rate of 15.4%, but households’ deposits grew only a timid 1% from the previous year. In the three previous years, households’ deposit portfolio even shrank as they transferred their assets from fixed-term deposits to other investment outlets.
The portfolio of bonds issued by credit institutions shrank by 3% during 2015, settling at €94bn. Covered bonds comprised about €31bn of the portfolio. Bonds with a maturity period longer than one year continued to grow the fastest compared to other sources of funding. Short-term bonds (maturity less than one year) already make up less than 5%. Their proportion has been decreasing for several years now. By favouring longer average maturity periods, banks prepare for upcoming regulation that requires more long-term funding in proportion to granted loans. Basel III requirements on net stable funding ratio (NSFR) possibly enter into force in Europe in 2018.
Figure 5. Credit institutions’ funding in Finland; proportions from total funding (%)
9
Finnish Banking in 2015
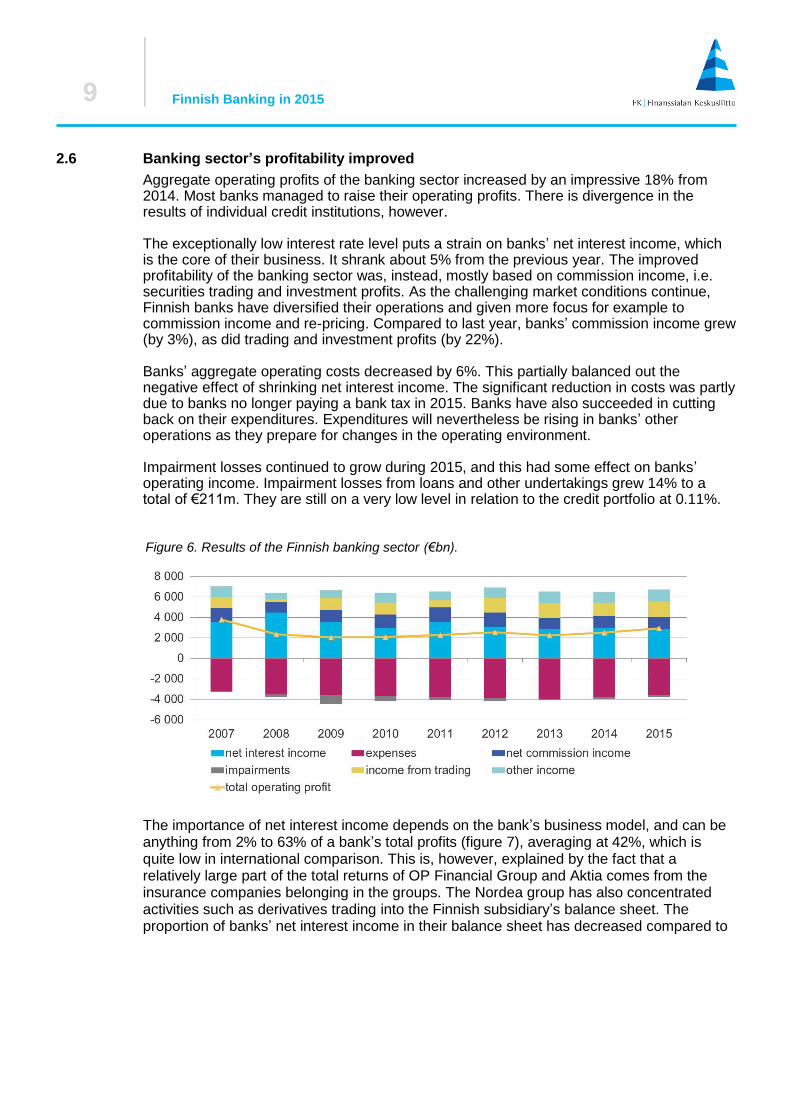
2.6 Banking sector’s profitability improved
Aggregate operating profits of the banking sector increased by an impressive 18% from 2014. Most banks managed to raise their operating profits. There is divergence in the results of individual credit institutions, however. The exceptionally low interest rate level puts a strain on banks’ net interest income, which is the core of their business. It shrank about 5% from the previous year. The improved profitability of the banking sector was, instead, mostly based on commission income, i.e. securities trading and investment profits. As the challenging market conditions continue, Finnish banks have diversified their operations and given more focus for example to commission income and re-pricing. Compared to last year, banks’ commission income grew (by 3%), as did trading and investment profits (by 22%). Banks’ aggregate operating costs decreased by 6%. This partially balanced out the negative effect of shrinking net interest income. The significant reduction in costs was partly due to banks no longer paying a bank tax in 2015. Banks have also succeeded in cutting back on their expenditures. Expenditures will nevertheless be rising in banks’ other operations as they prepare for changes in the operating environment. Impairment losses continued to grow during 2015, and this had some effect on banks’ operating income. Impairment losses from loans and other undertakings grew 14% to a total of €211m. They are still on a very low level in relation to the credit portfolio at 0.11%.
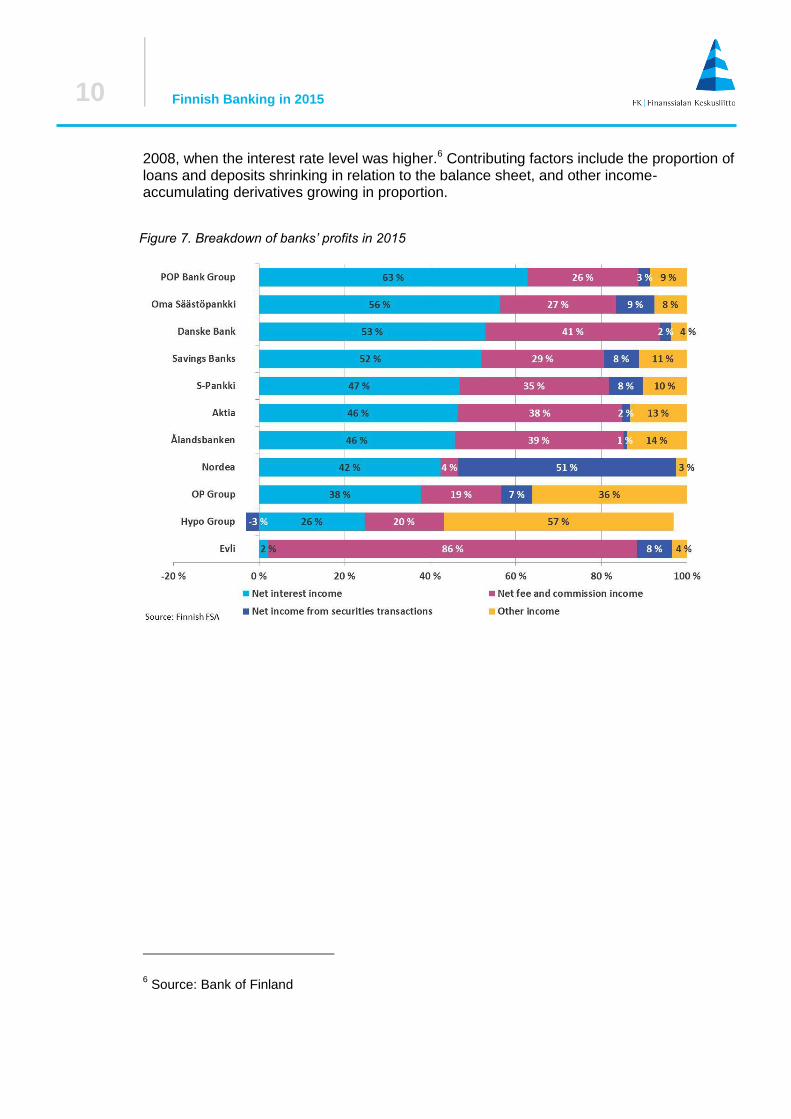
The importance of net interest income depends on the bank’s business model, and can be anything from 2% to 63% of a bank’s total profits (figure 7), averaging at 42%, which is quite low in international comparison. This is, however, explained by the fact that a relatively large part of the total returns of OP Financial Group and Aktia comes from the insurance companies belonging in the groups. The Nordea group has also concentrated activities such as derivatives trading into the Finnish subsidiary’s balance sheet. The proportion of banks’ net interest income in their balance sheet has decreased compared to
Figure 6. Results of the Finnish banking sector (€bn).
10
Finnish Banking in 2015
2008, when the interest rate level was higher.6 Contributing factors include the proportion of loans and deposits shrinking in relation to the balance sheet, and other income-accumulating derivatives growing in proportion.
6 Source: Bank of Finland
Figure 7. Breakdown of banks’ profits in 2015
11
Finnish Banking in 2015
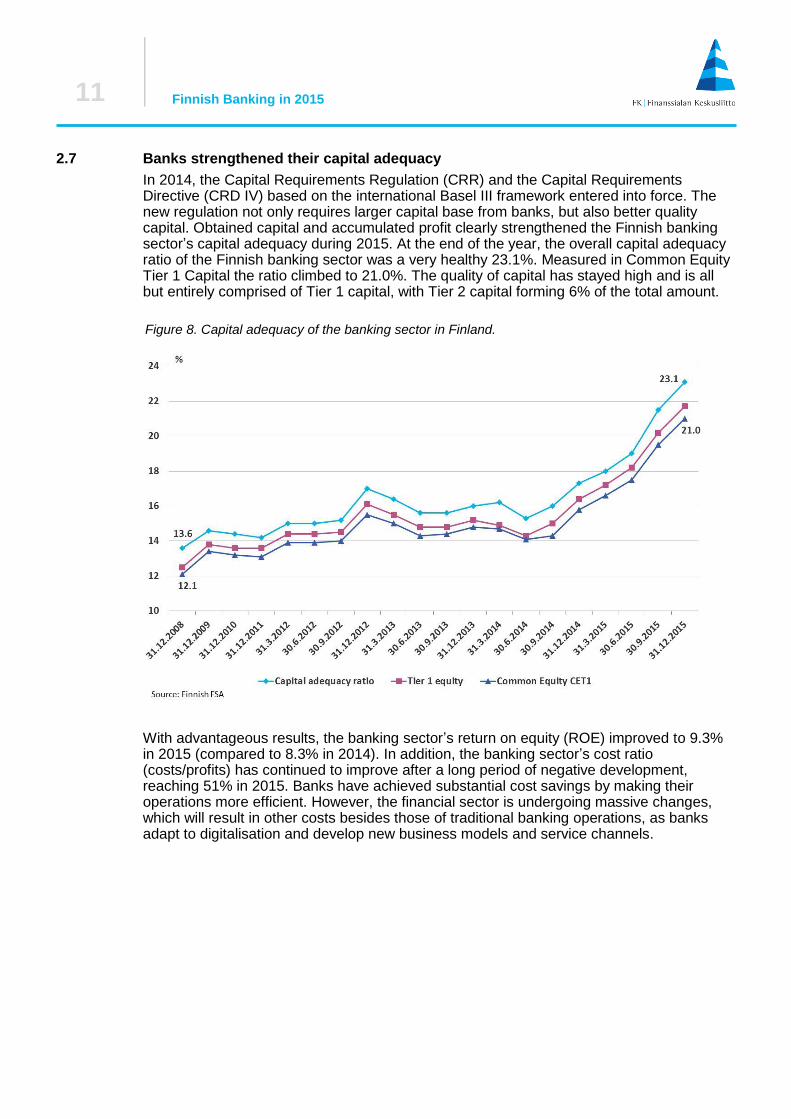
2.7 Banks strengthened their capital adequacy
In 2014, the Capital Requirements Regulation (CRR) and the Capital Requirements Directive (CRD IV) based on the international Basel III framework entered into force. The new regulation not only requires larger capital base from banks, but also better quality capital. Obtained capital and accumulated profit clearly strengthened the Finnish banking sector’s capital adequacy during 2015. At the end of the year, the overall capital adequacy ratio of the Finnish banking sector was a very healthy 23.1%. Measured in Common Equity Tier 1 Capital the ratio climbed to 21.0%. The quality of capital has stayed high and is all but entirely comprised of Tier 1 capital, with Tier 2 capital forming 6% of the total amount.
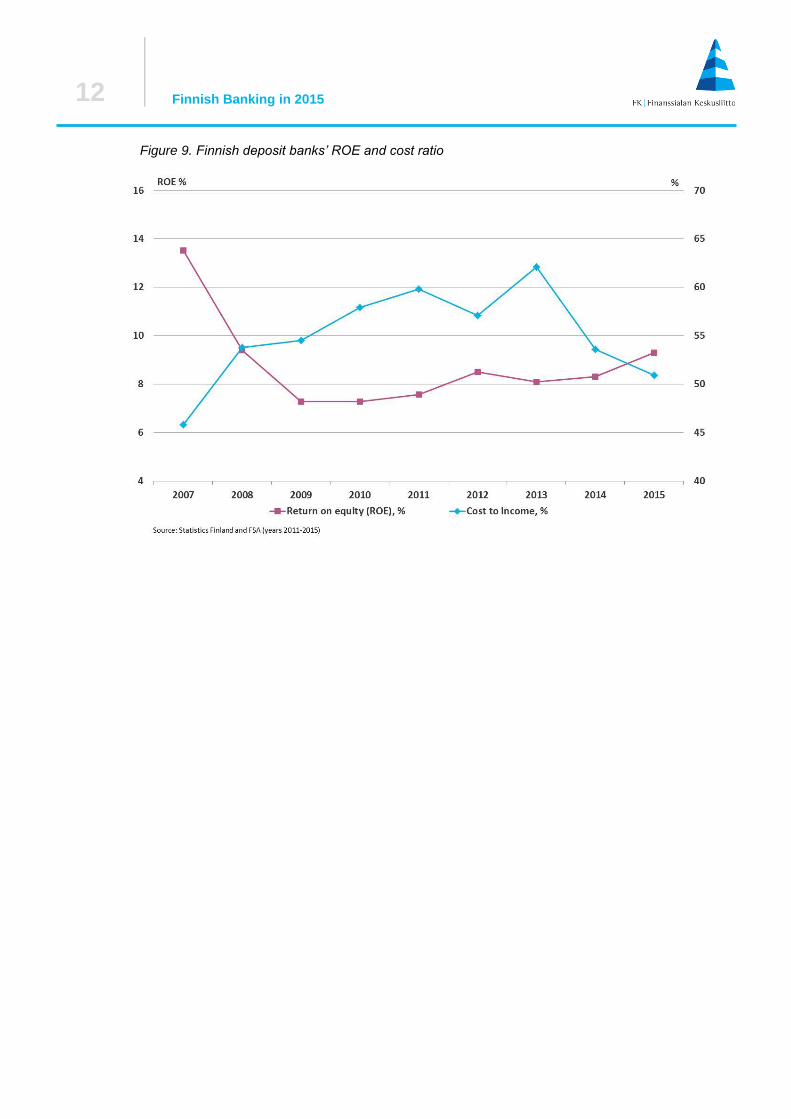
With advantageous results, the banking sector’s return on equity (ROE) improved to 9.3% in 2015 (compared to 8.3% in 2014). In addition, the banking sector’s cost ratio (costs/profits) has continued to improve after a long period of negative development, reaching 51% in 2015. Banks have achieved substantial cost savings by making their operations more efficient. However, the financial sector is undergoing massive changes, which will result in other costs besides those of traditional banking operations, as banks adapt to digitalisation and develop new business models and service channels.
Figure 8. Capital adequacy of the banking sector in Finland.
12
Finnish Banking in 2015
Figure 9. Finnish deposit banks’ ROE and cost ratio
13
Finnish Banking in 2015


![Journal of Internet Banking and · PDF fileJournal of Internet Banking and Commerce An open access Internet journal ... [16] found a typical user of online banking in Finnish market](https://static.fdocuments.us/doc/165x107/5aba68417f8b9a76038b7527/journal-of-internet-banking-and-journal-of-internet-banking-and-commerce-an-open.jpg)