Uh. Now what? A girls journey to finding her passion, through finding herself.

University of Pennsylvania University of Pennsylvania
ScholarlyCommons ScholarlyCommons
Summer Program for Undergraduate Research (SPUR) Wharton Undergraduate Research
2015
Finding Passion and Purpose: A Study of How Wharton Students Finding Passion and Purpose: A Study of How Wharton Students
View Work and Life View Work and Life
Leah Davidson University of Pennsylvania
Follow this and additional works at: https://repository.upenn.edu/spur
Part of the Business Commons
Recommended Citation Recommended Citation Davidson, L. (2015). "Finding Passion and Purpose: A Study of How Wharton Students View Work and Life," Summer Program for Undergraduate Research (SPUR). Available at https://repository.upenn.edu/spur/7
This paper is posted at ScholarlyCommons. https://repository.upenn.edu/spur/7 For more information, please contact [email protected].
Finding Passion and Purpose: A Study of How Wharton Students View Work and Finding Passion and Purpose: A Study of How Wharton Students View Work and Life Life
Abstract Abstract What does it mean to lead a meaningful life and find work that is congruent with your values? In an increasingly global and competitive talent marketplace, how do companies reduce attrition and improve performance by providing experiences that are both attractive to applicants and fulfilling to workers over the course of their careers? My research proposal involves a study of how companies create environments to attract and retain talent, with a focus on the priorities of Wharton students and how they choose internships and careers post-graduation. Inspired by a longitudinal study conducted by the Wharton Work/Life Integration Project, this report uses a literature review, interviews, quantitative data analysis, and a case study to understand how Wharton students’ values change over time periods (between undergrads in 1992 and 2012) and across educational levels (between current undergrads and MBAs).
Keywords Keywords Student values, recruitment, compensation, employee engagement, firm culture
Disciplines Disciplines Business
This working paper is available at ScholarlyCommons: https://repository.upenn.edu/spur/7

1
FINDING PASSION AND PURPOSE:
A STUDY OF HOW WHARTON STUDENTS VIEW
WORK AND LIFE
Leah Davidson, Wharton 2016, [email protected]
Faculty Advisor: Professor Stewart Friedman,
Practice Professor of Management, [email protected]
Research Disciplines: Organizational Behavior, Human Resource
Management

2
Abstract
What does it mean to lead a meaningful life and find work that is congruent with your values? In
an increasingly global and competitive talent marketplace, how do companies reduce attrition and
improve performance by providing experiences that are both attractive to applicants and fulfilling
to workers over the course of their careers? My research proposal involves a study of how
companies create environments to attract and retain talent, with a focus on the priorities of
Wharton students and how they choose internships and careers post-graduation. Inspired by a
longitudinal study conducted by the Wharton Work/Life Integration Project, this report uses a
literature review, interviews, quantitative data analysis, and a case study to understand how
Wharton students’ values change over time periods (between undergrads in 1992 and 2012) and
across educational levels (between current undergrads and MBAs).
Key Words: Student values, recruitment, compensation, employee engagement, firm culture

3
Introduction
The objectives of this study for the Summer Program for Undergraduate Research
(SPUR) were twofold:
To understand how Wharton students’ personal and professional values change
over time (between generations and between undergrads/MBAs)
To understand how companies can create environments to attract, develop, and
retain top talent and educational institutions can promote career exploration.
This project was inspired by Management Professor Stewart Friedman. In 1991, Stew
founded the Wharton Work/Life Integration Project to study how students and alumni think about
and value their cardinal life interests: work, education, family, and the private self: mind, body,
and spirit. His research study, published in Baby Bust: New Choices for Men and Women in Work
and Family (Wharton Digital Press 2013), involved an analysis of data collected by the W/LIP in
a life interests survey of 496 students in the Wharton Undergraduate Class of 1992 in 1992.
Twenty years later in 2012, W/LIP surveyed 307 members of the graduating class and re-
surveyed the Class of 1992 on their career progress and life satisfaction.
To expand my knowledge of organizational behavior, organizational psychology, and
human resources, I conducted an academic literature review to understand the different
components of the job matching process – from both employers’ and candidates’ perspectives. I
also interviewed 20 undergraduate and 10 MBA students on their considerations and selection
criteria during the job search process, their preferred communication and outreach channels with
firms of interest, and their personal and professional goals.

4
Through both empirical data analysis and qualitative interviews, I gained an
understanding of how Wharton students create a definition of career and life success and how this
intersects with companies’ recruiting processes and priorities.
Literature Review
Attraction/Recruitment
The Society of Human Resource Managers (SHRM) outlines a typical recruitment
strategy (Breaugh n.d.):
Establish recruitment objectives (number of open positions, date by which
positions should be filled, number of applications desired, type of applicants sought in
terms of level of education, knowledge, skills, and abilities, interests and values, diversity,
job performance goals for new hires, expected new hire retention rates)
Develop a recruitment strategy
Carry out recruitment activities
Evaluate recruitment results
Recruitment strategy considerations include type of target individuals, location of these
individuals, start of recruitment campaign, desired channels of communication, type of recruiters
to be used, nature of a site visit, and details of job offer (4). The employer brand plays a large role
in recruitment success (3). Employers use recruitment metrics to evaluate firm performance,
including time-to-hire, cost of filling position, new employee retention rate, new employee
performance level, and hiring manager and applicants’ satisfaction with recruitment process (5).
Job applicants hear about opportunities through numerous outlets. Employee referrals are
valuable because current employees value their reputation and are likely to only refer well suited

5
applicants, provide accurate information about job expectations, and help new hires that they
referred with acclimatization (11). Job boards tend to generate large numbers of unqualified
applicants. Setting salary minimums or focusing on certain industries or geographic locations can
improve this. To use on-campus recruitment effectively, it is important for recruiters to develop
strong relationship with college through sponsorship of events, faculty involvement, campus
receptions, scholarships, etc.
When inviting candidates to interview, SHRM emphasizes the importance of
accommodating the applicant’s schedule, sending relevant materials beforehand, recruiting a
prospective co-worker to serve as the host, offering hotel accommodations, a meal stipend, and
travel reimbursements, making sure key individuals are accessible, and paying attention to details
(e.g. greeting candidate upon arrival).
Companies use many types of interviews, aptitude assessments, personality tests, and job
simulations to evaluate candidates. Empirical research has found little correlation between
interview and job performance. After controlling for IQ and conscientiousness, standard
interviews only explained 1.5% of the variance in performance. Results improved when
companies used standardized questions and had clearly defined what constitutes a desirable
response (16.9%) (Cortina et al 2000).
Wharton Professor Adam Grant found that personality tests can be valid because
applicants don’t agree on which traits are desirable, want to set realistic expectations, and are not
very good liars. A study by Hogan, Barrett, et al. in the Journal of Applied Psychology, which
surveyed 5,226 job applicants who were rejected on the basis of a 5-factor model personality test,
found that only 5.2% of job applicants improved their scores on the same test after 6 months and
just as many applicants changed in an undesirable direction (Barrett, Hogan, and Hogan 2007).

6
“The Validity and Utility of Selection Methods in Personnel Psychology,” a meta-analysis of
32,000 employees across 515 jobs by American professors John E. Hunter and Frank L. Schmidt,
found General Mental Ability (GMA) and work sample tests to have the highest validity rating
(0.51 and 0.54 r, respectively), out of 19 assessment methods evaluated (1998).
After an employer extends an offer, the candidate decides whether or not to accept based
on the offer terms and competing offers. Honeycutt and Rosen found that all employees were
attracted to organizations offering flexible career paths (1997 392). They discovered that salary
does not influence organizational attraction above an “adequate pay” threshold (395). Salary
tends to change on-the-job behaviors more than attitudes toward the employer.
“Only a few empirical studies (Bretz & Judge 1994; Honeycutt & Rosen 1997; Rau &
Hyland 2002; Rothausen, Gonzalez, Clarke, and O’Dell 1998) have examined work-life benefits
and an organization’s recruitment strategy” (392). These studies connect work-life benefits
(parental leave, childcare information and referral, flextime, financial assistance with childcare)
to higher satisfaction (Thomas & Ganster 1995), organizational commitment (Kossek & Nichol
1992), desire to stay with the same employer (Grover & Crocker 1995), and productivity
(Galinsky & Stein 1990).
Retention
Employers often struggle to keep top-quality talent. John Sheridan’s study
“Organizational Culture and Employee Retention” for The Academy of Management Journal
investigated retention rates of 904 college graduates in six public accounting firms over a period
of six years and found that organizational culture had a stronger effect on turnover than labor
market and demographic changes (1992 30).

7
Kerr and Slocum proposed that organizational cultures that promote teamwork, job
security, and respect increase loyalty and long-term commitment to the organization. Their first
hypothesis was that “organizational culture values [would] have a significant influence on
retention rates, after the exogenous effects of labor market factors and employee gender and
marital status have been accounted for” (1987). Their second hypothesis was that “an employee’s
job performance [would] significantly interact with organizational culture values in influencing
retention rates. The difference between the retention rates of strong and weak performers will
vary significantly depending on the cultural values of an organization, after the exogenous effects
of labor market factors and gender and marital status have been accounted for.” They found that
after first 12 months of employment, turnover was lower in firms emphasizing interpersonal
relationships (team orientation and respect) than in firms emphasizing work-task values (detail
and stability) (1048). Employees in the first type of firm stayed on average 48 months versus 31
months in the other firm (1050). Many researchers (Chatman 1989, 1991, O’Reilly, Chatman &
Caldwell 1991; Schneider 1987) stressed importance of fit between personal and organizational
values. Schneider pioneered the attraction-selection-attrition (ASA) model, in which candidates
evaluate jobs for fit and employers try to attract candidates that share their values (1051).
O’Reilly and colleagues used an OCP Q-sort method and found that people with lowest
congruence between personal and cultural values started quitting in higher proportions after the
first 20 months.
Replacing employees is expensive. Direct replacement costs are around 50-60% of an
employee’s annual salary, and total costs associated with turnover reach between 90-200% of
annual salary (Allen n.d. 3). Costs include HR staff time, manager’s time, temporary coverage,
lost clients, disruption to team, new hire’s relocation, compensation and perks, orientation
8
program, formal training, mentoring, socialization, and productivity loss until job mastery is
attained (4). According to the theory of organizational equilibrium, an individual will stay with
an organization as long as inducements (pay, developmental opportunities, work environment)
are equal to or greater than perceived contributions (time, effort). Reasons for leaving a company
include dissatisfaction, better alternatives offered elsewhere, and career path plans (8). There are
many ways to foster embeddedness in an organization, including links (connections with people,
groups or organizations), fit (compatibility with job, organization, and community), and sacrifice
(forms of value that the employee would have to give up if he/she left) (10). Table I in the
appendix shows different strategies for increasing embeddedness.
To reduce retention, 61% of employers conduct exit interviews to understand motivation
for leaving. One study revealed that 38% left because of salary and 4% because of supervision.
Interviewing the same people 18 months later showed that 12% left because of salary and 24%
because of supervision (16). This reveals reluctance to be completely honest during these initial
interviews. Figure I in the appendix ranks factors contributing to high turnover.
Best practices for employee retention include:
During recruitment, offer a realistic job preview (RJP)
Use biographical data to evaluate life experiences (those who stay versus those
who leave)
Provide socialization opportunities (informal and formal activities to facilitate
bonding and present role models within the firm, as well as explain how the person’s job
related to overall organizational mission and strategic goals)
Offer training to help employers strengthen skillset (Research reveals modest
negative relationship between training and turnover; those who receive more training are

9
less likely to leave. One technique to avoid people getting recruited by other companies
because of skill gains is to provide job-specific instead of generalized training.)
Since supervision has such a large effect on turnover, evaluate managers on
retention metrics
Table II in the appendix ranks various retention initiatives by popularity and
effectiveness.
Employee Engagement
Closely associated with retention measures is the concept of employee engagement.
Schmidt et al defined employee engagement as involvement with, commitment to, and
satisfaction with work. Employee engagement is defined as taking initiative, reinforcing and
supporting the organization’s cultures and values, taking pride in the company, and going “above
and beyond” the call of duty. Development Dimensions International described employee
engagement as the “extent to which people value, enjoy, and believe in what they do” (Wellins,
Bernthal, and Phelps n.d.). In order to promote employee engagement, a firm must align efforts
with corporate strategy, empower people, promote and encourage teamwork and collaboration,
help people grow and develop, and provide appropriate support and recognition.
Maslach et al outlined six areas of work-life that lead to burnout or engagement:
workload, control, rewards and recognition, community and social support, and perceived
fairness and values (Maslach, Schaufeli, and Leiter 2001). Factors influencing employee
engagement are recruitment, job designing, career development opportunities, leadership,
empowerment (involvement in decision-making), equal opportunities and fair treatment, training
10
and development, performance management, compensation, health and safety, job satisfaction,
communication, and family friendliness.
In “A Study of Engagement at Work: What drives Employee Engagement?”, David Shine
and Sonal Pandey surveyed 107 people on the following dimensions related to employee
engagement: growth opportunities within the organization, work-life balance, supervisor-
subordinate relationship, physical resources availability, rewards and recognition, clear policies
and open communication, fair compensation policies, adequate training for skill-up graduation,
role clarity, and pride in working for the company (2013). They discovered that employee
engagement strategies need to be tailored to the individual firm, taking into account cultural and
generational differences.
According to a 2013 Gallup survey, in the corporate world, there are twice as many
unhappy employees as happy employees (Crabtree 2013). An Accenture report traced
dissatisfaction to a lack of empowerment (31%), lack of recognition (43%), inability to act on
employees’ entrepreneurial desire, and a loss of trust between employees and corporations (Hall
2013). An APA survey discovered that 93% of employees at startups feel valued by their teams
and by the company founders because of the greater feeling of ownership associated with smaller,
more agile companies and the capacity for creativity (“APA Survey Finds Feeling Valued at
Work Linked to Well-Being and Performance” 2012).
Robinson et al pioneered the social exchange theory of employee engagement, defining
engagement as a two-way contract between the employer and employee (Robinson, Perryman,
and Hayday 2004). People who receive economic and social benefits from an organization feel
indebted and desire to repay through contributions beyond their core job responsibilities.

11
Culture
In Organizational Culture and Leadership, E.H. Schein described three components of
organization culture: artifacts and behaviors (visible elements, such as furniture, rituals, dress
code, office layout, etc.), espoused values (priorities and rules of behavior expressed in
philosophies and public statements), and underlying assumptions (“deeply embedded, taken-for-
granted behaviors which are usually unconscious, but constitute the essence of culture”) (1985).
Of these components, values and artifacts are most easily recognized from the outside and
most frequently discussed. Researchers have introduced many different ways of describing
cultural values. McDonald and Gandz identified 24 cultural values that fit into the following
categories: relationship-oriented values, task-oriented values, change-related values, and status
quo values (9-4 and 9-5) (1991)i. R.A. Cooke and D.M. Rousseau’s study “Behavioral norms and
expectations: A quantitative approach to the assessment of organizational culture” identified 12
organizational culture styles: humanistic/helpful culture, affiliative culture, approval culture,
conventional culture, dependent culture, avoidance culture, oppositional culture, power culture,
competitive culture, competence/perfectionistic culture, achievement culture, and self-
actualization culture (1988). R.E. Quinn and G.M. Spreitzer pioneered the competing values
model of culture: group culture, hierarchical culture, developmental culture, and rational culture
(1991).
Barney wrote that culture can be a source of sustained competitive advantage under three
conditions: 1) Culture must be valuable and enable the creation of economic value, 2) culture
must be rare, and 3) culture must be imperfectly imitable (if firms can modify culture to attain a
competitive advantage, it can be assumed that other firms can adopt it as well and that the
advantage is only temporary) (1986).

12
Joan Finegan found that commitment was greatest among employees who thought their
organization valued relationship-oriented (courtesy, consideration, co-operation, fairness,
forgiveness, moral integrity) and change-oriented values (development, initiative, creativity,
openness) (2000). Task-oriented values (logic, economy, experimentation, diligence) were not
seen as important.
As CEO of GE, Jack Welch transformed the company culture by setting a goal that each
business should be number one or two in its industry. GE’s overarching goal changed from
growing faster than the economy to becoming the world’s most valuable company. Welch
replaced bureaucracy with empowerment. Employees’ performance was continuously evaluated
and the bottom 10% employees were asked to leave (Bauer and Erdogan 2012).
In order for a culture to be fully integrated, there must be support from top-level
management. Underlying assumptions should be reflected in the strategic plan and in HRM
policies (reward structure). Most employees experience cultural changes directly through daily
interactions with managers and supervisors.
Compensation
Compensation refers to the extrinsic rewards system – salary, bonus, and fringe benefit
structure – that companies provide in exchange for employee time and effort.
In Solving the Compensation Puzzle: Putting Together a Complete Pay and Performance
System, Sharon Ross identifies three key stakeholders in creating compensation packages:
employees concerned with pay equity, management/owners seeking to maximize quality and cost
efficiency of labor, and the government putting in place laws to ensure fair, non-discriminatory
treatment in the workplace (2008).

13
To meet organizational objectively, compensation packages can lag, meet or lead the
market. According to SHRM, meeting the market is the most common compensation strategy
(then adding and subtracting fringe benefits and/or variable pay). Leading the market assumes
that higher pay will attract more experienced and qualified employees; however, this is not a
proven theory.
Organizational constraints to setting salaries include ability to pay, legal constraints (Fair
Labor Standards Act), unionization, and the internal labor market (28). Human resources must
also consider number of pay grades, separate scales for different jobs, and the size of jump
between grade mid-points. All compensation schemes should offer internal equity, be
competitive with the external market, comply with legislation (e.g. Americans with Disability
Act [ADA] and pay discrimination laws), and recognize individual contributions (36).
Annually, SHRM explores over 300 benefits: health care and welfare benefits,
preventive health and wellness benefits, retirement savings and planning benefits, financial and
compensation benefits, leave benefits, family-friendly benefits, flexible working benefits,
employee programs and services, professional and career development benefits, housing and
relocation benefits, and business travel benefits (SHRM 2014). The trend over the past five years
showed an increase in organizations offering health care and wellness benefits, including mental
health, contraception, vision insurance, and bariatric and laser vision surgery. Industries are
experiencing a shift to defined contribution retirement savings plans and Roth 401(k) savings
plans, and fewer organizations offering “dependent care flexible spending accounts,
undergraduate/graduate educational assistance, incentive bonus plans for executives, and 529
plans.” Between 2010 and 2014, the number of organizations offering paid time off plans

14
increased by 11%. Housing and relocation benefits also decreased, notably within the categories
of temporary relocation and spouse relocation employment benefits.
Rosen expressed that benefits can create value in the employment relationship when the
employer can purchase goods and services at a cheaper price (economies of scale) that the
individual (1974). In his NBER working paper “Salary or Benefits?,” Paul Oyer used data from
the National Longitudinal Survey of Youth, which interviewed 12,686 people born between 1957
and 1964 annually from 1979 to 1994 and bi-annually from 1994 to 2000 about benefits at their
primary job, including subsidized meals, child care, dental insurance, and health insurance. He
found that employees most appreciated child care and meals (2005 24). Oyer created a model in
which employers take care of purchasing when the firm can more cost-efficiently procure items
and when it requires greater effort for employers to obtain such products or services on their own
(24).
In “Matching Compensation and Organizational Strategies,” David Balkin and Luis
Gomez-Mejia related organizational strategies at the corporate and business unit level to
compensation strategies through surveying 192 human resource management professionals in
business units of large manufacturing firms (1990). Variables included pay mix (incentives,
salary, benefits), marketing positioning (pay relative to competitors), and pay policies (risk
sharing, internal consistency, pay secrecy, pay for performance, pay decentralization, egalitarian
pay, pay participation, job-based pay, long-term pay). Balkin and Gomez-Mejia found that
corporate strategy was a predictor of pay package design, pay relative to market, and pay
administration policies, while business unit strategy predicted pay package design and pay
relative to market.

15
Compensation may differ between firms of different sizes, with startups usually offering
different benefits packages than large Fortune 500 companies. Although base salaries may be
lower, startup employees usually have an equity stake in the company. Perks often revolve
around culture, community, and fun. Expensify sends the entire team for a month of working,
bonding, and playing in a foreign country. Buffer gives a generous onboarding package,
including a MacBook Air, Kindle, Jawbone Up, etc. Warby Parker has a Fun Committee.
Standard perks at startups include free snacks and meals, massages, unlimited coffee, happy hour,
discounted gym memberships, casual dress, and recreational activities, such as basketball, ping
pong, pool, and foosball. These are only a few examples of how companies have aligned
organizational design and culture with their compensation strategies to attract and retain talent.
Student Values
During the job selection process, students are influenced by many different factors and
drivers. Researchers (e.g. Bellah et al. 1985, Wrzesniewski 2005) have frequently labeled
people’s perception of work as a career, calling or job. A career implies a desire for power and
advancement, whereas people pursue a calling for the derived intrinsic value and fulfillment and
a job for the financial benefits necessary to sustain a life outside of work.
For their study “Career choice in management: Findings from US MBA students,” Eddy
Ng et al surveyed 109 students in a mid-sized west coast university and found that students
prioritized self-development in job selection and aspired for careers (Ng, Burke, and Fiskenbaum
2008). This study revealed that students who came to business school to gain knowledge and
competence were more likely to view their career as protean, “a lifelong series of experiences,
skills, learnings, transitions, and identity changes,” (349) and long to make a positive impact on

16
society. In this research, families and friends did not bear significant career influence; however,
students were influenced by cultural values and more traditional perceptions of success (e.g.
money and status).
A paper entitled “Work-family values, priority goals and life satisfaction: A seven year
follow-up of MBA students,” published by Aline Masuda and Florencia Sorthiex in The Journal
of Happiness, found that people who value family in career decision-making reported higher life
satisfaction (2012). Another study by Maarten Vanstenkiste concluded that business students
attribute high importance to extrinsic values, which can lead to higher personal distress and
poorer well being (Vansteenkiste et al 2006).
Analysis Results
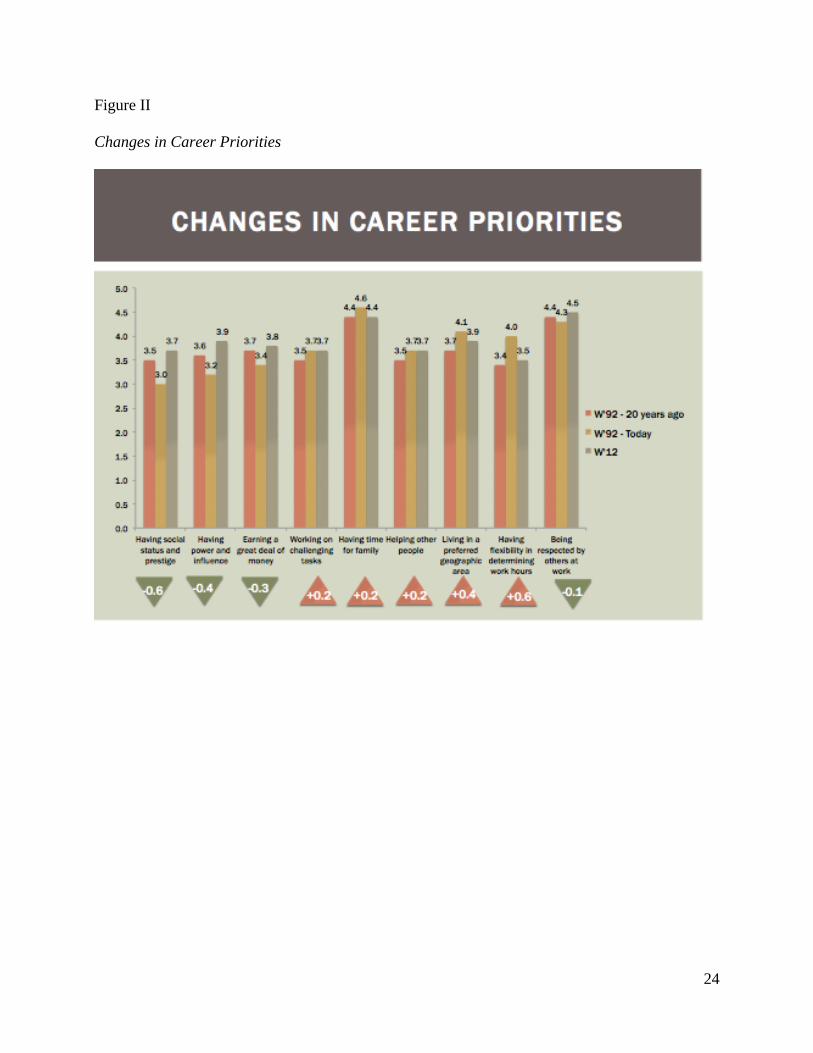
According to an analysis of the Life Interests report, the Class of 1992 reported higher
levels of satisfaction with all aspects of life in 2012 than in 1992 (standard of living, career,
parenting, a long-term relationship, etc.), except friendship (decreased from 4.0 to 3.5 out of 5.0).
Health (4.1) and personal growth and development (declined from 3.7 to 3.6) stayed roughly the
same (see Figure II in the appendix). As for their career, they were most satisfied in 2012 with
living in a preferred geographical area (4.3), flexibility in work hours (4.2), working on
challenging tasks (4.0), and being respected by others at work (4.0) (see Figure III in the
appendix).
Top words that came up in the open-ended question to 1992 grads in 2012 "What has
been the most rewarding aspect of your career so far?" were the ability to use creativity, make an
impact, and provide for family through money and/or time. When asked "What's the thing you
didn't do since graduating from Wharton in 1992 about which you feel the greatest

17
disappointment?," 16% of students said they would change nothing. 29% mentioned they wished
they had traveled more and 18% mentioned they wished they had taken greater career risks
earlier in their careers.
In the comparison between undergraduate and MBA students, top undergrad values were
opportunity for full-time conversion (4.30), type of project work (4.28), mentoring (4.20), and
prestige (4.08). Lowest rated student values were training (2.00), pay (3.29), networking
opportunities (3.33), and social events (3.48) (see Figure IV in the appendix). During an average
internship (10.35 weeks long), most commonly cited goals were to receive a return offer, gain
new industry exposure, and build connections. Internships projects ranged from competitive
research and data analysis for a private equity firm to financial modeling for a financially
distressed education company. The average internship rating was 4.25/5.00, indicating high
satisfaction with their experience. 75% of students cited outside of work bonding and final
presentations to senior management as the most rewarding experiences of their summer. 80% of
students used on-campus recruiting. Coffee chats, professor connections, and club sponsorship
were perceived as the most valuable tools during the internship search process.
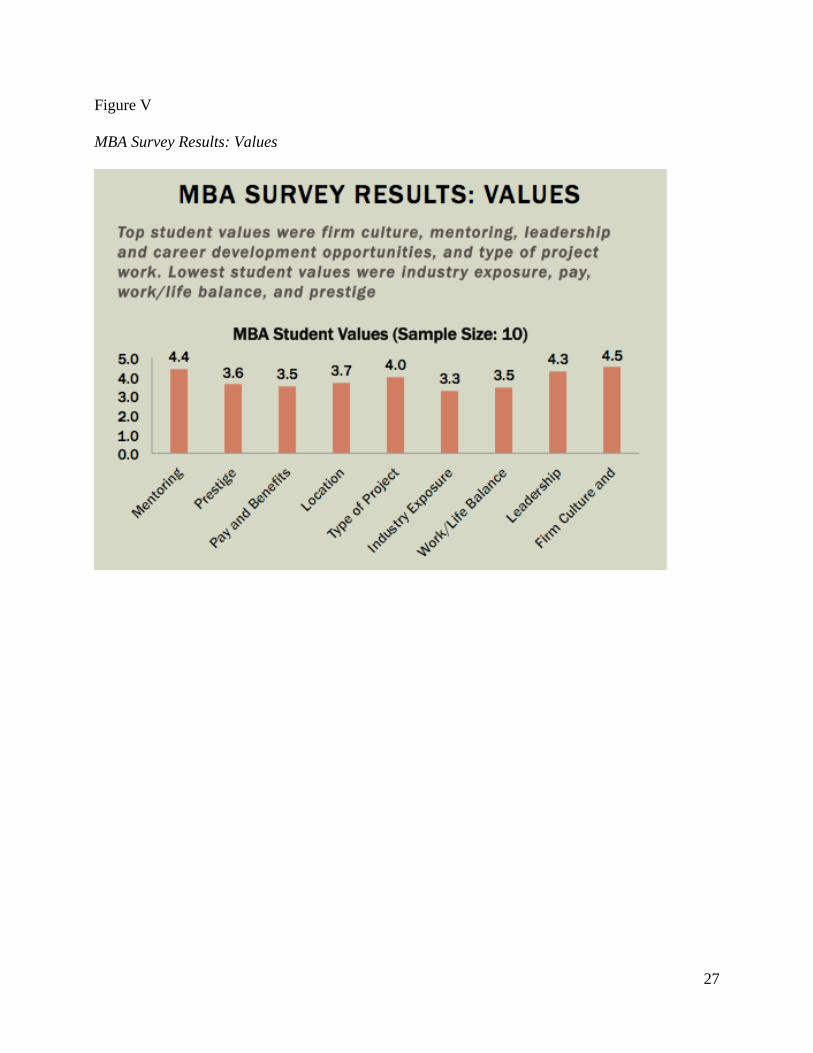
Top MBA values were firm culture (4.5), mentoring (4.4), leadership and career
development opportunities (4.3), and type of project work (4.0). Lowest rated student values were
industry exposure (3.3), pay (3.5), work/life balance (3.5), and prestige (3.6) (see Figure V in the
appendix). 40% of MBA students interviewed were married or engaged. Many of the younger
MBA students were not looking to settle down with a family in the next few years and based their
internship decision on career objectives rather than work/life balance. Given that MBA students
had already worked for one or more organizations before pursuing graduate education, prestige
and industry exposure mattered less. Culture, personal fit, and happiness were bigger

18
considerations. 70% of MBA students came to business school to change industries. Other goals
were to develop soft skills and expand their network. 80% used Career Path (on-campus
recruiting). The students who did not use the network either were returning to their previous
employer or looking for non-traditional careers. Every student expressed an aspiration to lead a
team and be in a director or managerial position within the next 5 to 10 years.
See Table III in the appendix for more information on student backgrounds.
Discussion and Conclusion
Students learn what they truly value over the course of their career and conventional ways
of defining success (money, status, prestige, etc.) become less important, relative to the ability to
make an impact, explore the world, and spend time with friends and family. Wharton MBAs
reported more intentional career decision-making at the MBA level than at the undergraduate
level and typically used business school as a time for self-reflection on their values and
aspirations.
Based on these findings and my own observations of Wharton’s pre-professional culture,
Career Services and the Wharton Undergraduate Program should promote self-discovery early
into one’s academic career, allowing students to explore their passions and industries of interest.
Students enter Wharton with diverse interests, but the socialization process leads to risk aversion
and students trending toward conventional careers and majors. Students are drawn to paths that
successful upperclassmen and alumni have taken, which often involve companies that are good at
marketing themselves to applicants (i.e. have robust on-campus recruiting teams). In 2015, the
top employers of Wharton graduates were Goldman Sachs (23 accepted offers), Morgan Stanley
(22), the Boston Consulting Group (20), Bank of America Merrill Lynch (16), Citi (16), JP

19
Morgan Chase (15), The Blackstone Group (15), Bain & Company (14), and McKinsey &
Company (13) (Penn Career Services 2015). As demonstrated by additional career surveys five
years after graduation, the majority of Wharton students do not end up in consulting or financial
services, but rather leverage the networks and training provided in these professions to later
pursue more diverse career paths. Increasingly, Wharton students are pursuing entrepreneurship,
tech, and social impact.
Given that many Wharton alumni 20 years into their careers regretted not taking greater
risks, I would encourage Wharton faculty and administration to shift the culture earlier and
promote unconventional success stories, so that students are able to identify and develop their
unique holistic potential. They should also help organizations that may lack the financial and
human resources of large multinationals (e.g. fellowship programs, NGOs, social enterprises,
graduate schools, and startups) publicize their post-graduate opportunities on campus. These
recommendations would empower Wharton students to lead careers more reflective of their
authentic selves and probably increase career and life satisfaction in the short and long term.
For SPUR, I chose to focus on the Wharton student body for ease of access to data, given
my current status as a Wharton undergraduate. Although this research project was quite broad in
its scope, it was limited by time constraints and its own narrow focus. The Wharton MBA and
undergraduate programs accept approximately 15% and 5% of applicants, respectively, thus
analyses drawn from observing and interviewing their populations cannot be applied to the
general population or to other institutions. Limitations to the second MBA/undergrad study are
the small sample size and the lack of consideration for alternative career paths (outside of Fortune
500, finance, and consulting). In the future, it would be useful to take into consideration the

20
success and satisfaction of students at other business schools to understand how values differ
among peer groups, aspirational achievement levels, genders, and learning styles.

21
Appendix
Table I
Embedding Your Employees, SHRM

22
Figure I
Turnover Predictor

23
Table II
Retention Initiative Effectiveness, SHRM
24
Figure II
Changes in Career Priorities

25
Figure III
Changes in Definition of Life Success

26
Figure IV
Undergrad Survey Results: Values
27
Figure V
MBA Survey Results: Values

28
Table III
Previous Employers of Students Interviewed

29
Vynamic Case Study
Vynamic is a boutique healthcare industry management consulting firm in Philadelphia
founded in 1992 by former Accenture executive Dan Calista, with aspirations to become the
healthiest company in the world. Vynamic prides itself on its non-hierarchical, close-knit
organization and collaborative approach to client relationships. The majority of consultants come
from Accenture or Deloitte (89% of the organization).
The company’s unique qualities come across during an initial office visit, where every
room is painted a different color to represent diversity and creativity, treadmill, sit-to-stand,
balance ball, and elliptical bike chairs round out the seating options, and a Balance Bar offers an
array of nutritious fruit and snacks. Employees also receive 50% off the cost of a Fitbit and
engage in weekly stepping competitions, with prizes awarded to healthy restaurants. Teams train
together for marathons and triathlons and participate in a variety of councils, including the Health
and Care Council, Office Council, Talent Acquisition Committee, and Thrive Live Council.
When I first met with CEO Dan Calista in April, he described Vynamic’s vision and
belief in a better way to do management consulting. Vynamic has a local staffing model,
requiring no travel during the week, and allowing consultants to select projects of interest. One of
Vynamic’s core values is “powered by a healthy culture” and Vynamic truly promotes physical,
mental, and emotional well-being at every level of the organization. A few of the programs
organized by Vynamic councils:
Choose Your Own Community Adventure: Every summer, Vynamic team members
organize a number of team adventures to benefit the local community, such as helping the
Penn Vet Center with clean up and stuffing envelopes with Food Bucks, which provide
healthy food to low-income families. Vynamic donates $100 to a charity of choice for
30
each team member who volunteers an hour of his or her time, and team members can also
vote for two charities to receive a $5000 donation.
Thrive Live: Every month, Vynamic coordinates social events to promote team
bonding (e.g. baking competitions, arcade nights, bike riding, etc.).
Women at Vynamic Experience (WAVE): To support women’s personal and
professional development, Vynamic offers personal coaching as well as quarterly
professional development breakfasts on themes such as executive presence, networking,
and the art of self-promotion. These offer a forum for women to discuss the unique
challenges they face in the workplace and men to also participate in the discussion.
Be Your Best Self: Vynamic has a dedicated Health and Care Lead. As part of the
programming, team members can set quarterly goals toward healthy living and receive
$100 per quarter (up to $400 per year). This benefit encourages employees to try out new
activities, whether that be learning a new language or trying pilates for the first time.
Zmail: The company does not send emails between 10 pm and 6 am or on weekends
to reduce stress and allow people to enjoy more restful sleep and family time.
Healthy Hour: From financial planning sessions to healthy cooking demos, Vynamic
holds activities on Fridays in the office to promote continuous learning and development.
Vynamic has continuously improved its Happiness rating and now ranks among the top
15% of firms. With the core values of “growing for our people, not at the expense of our people”
and “applying our unique individual strengths,” Vynamic offers an alternative to the typical
corporate hierarchy. New hires are first asked to choose a color that embodies their personality
and these are proudly showcased on business cards, the website, and the office wall.

31
The company uses Yammer as a social network to post updates, praise team members,
share healthcare industry news, and commemorate company events through photos and videos.
They also leverage a document repository, where everyone in the company has access to
everything from materials from every project the firm has ever undertaken to recruiting materials
and scores from past happiness surveys.
As a small firm (80 people, with aspirations to reach 200 by 2020), Vynamic struggles
with the challenges of maintaining its vision of “growing for, not at the expense, of its people.”
The main concerns raised in informal and formal surveys are the lack of senior mentors and lack
of clarity with career paths. The company currently hires almost exclusively through referrals and
referees receive a $10,000 bonus for each successful hire.
From my observations at Vynamic, I can tell that employees face the same challenges as
anyone would expect in a client-facing role and many have multiple children under the age of
five; however, the organizational design doesn’t force people to choose between their personal
and career aspirations – instead, it embraces the full person and fosters four-way wins that
integrate work, home, community, and the private self to lead more effectively.
Allen, David. n.d. Retaining Talent: A Guide to Analyzing and Managing Employee Turnover.
SHRM. http://www.shrm.org/about/foundation/research/documents/retaining%20talent-
%20final.pdf.
APA Survey Finds Feeling Valued at Work Linked to Well-Being and Performance. 2012.
Accessed January 11, 2016. http://www.apa.org/news/press/releases/2012/03/well-
being.aspx.
32
Balkin, D. B. and Gomez-Mejia, L. R. 1990, Matching compensation and organizational
strategies. Strat. Mgmt. J. 11: 153–169.
Barney, J. B.. 1986. Organizational Culture: Can It Be a Source of Sustained Competitive
Advantage?. The Academy of Management Review 11 (3): 656–665.
http://www.jstor.org/stable/258317.
Barrett, Paul, Hogan, Joyce, and Hogan, Robert. 2007. Personality measurement, faking, and
employment selection. Journal of Applied Psychology 92 (5): 1270-1285.
Bauer, T., & Erdogan, B. 2012. An Introduction to Organizational Behavior 1 (1). Creative
Commons.
Breaugh, J., Ph.D. n.d.. Attracting and Retaining Talent. SHRM.
http://www.shrm.org/india/hr-topics-and-strategy/talent-acquisition-and-people-
flows/sourcing-and-recruiting-external-and-internal/Documents/1109 Recruiting EPG-
Final.pdf.
Cooke, R.A., and Rousseau, D.M. 1988. Behavioral norms and expectations: A quantitative
approach to the assessment of organizational culture. Group & Organization Studies 13
(3).
Cortina, J., Goldstein, N., Payne, S., Davison, K., and Gililand, S. 2000. “The Incremental
Validity of Interview Scores Over and Above Cognitive Ability and Conscientiousness
Scores,” Personnel Psychology 53 (2).
Crabtree, S. 2013. Worldwide, 13% of Employees Are Engaged at Work. Accessed January 11,
2016. http://www.gallup.com/poll/165269/worldwide-employees-engaged-work.aspx.
Eddy S.W., Ng, Burke, R., and Fiksenbaum, L. 2008, Career choice in management: findings
from US MBA students. Career Development International 13 (4).
33
2014 Employee Benefits. 2014. Alexandra: Society for Human Resource Management.
Finegan, J.E. 2000. The impact of person and organisational values on commitment. Journal of
Occupational and Organizational Psychology.
Hall, A. 2013. 'I'm Outta Here!' Why 2 Million Americans Quit Every Month (And 5 Steps to
Turn the Epidemic Around). Accessed January 11, 2016.
http://www.forbes.com/sites/alanhall/2013/03/11/im-outta-here-why-2-million-americans-
quit-every-month-and-5-steps-to-turn-the-epidemic-around/.
Honeycutt, T. Ll, and Rosen, B. 1997. Family friendly human resource policies, salary levels, and
salient identity as predictors of organizational attraction. Journal of Vocational Behavior
50: 271-290.
Kerr, J., and Slocum, J. 1987. Managing Corporate Culture Through Reward Systems. Academy
of Management Executive 1 (2).
Koss, S. K. 2008. Solving the Compensation Puzzle: Putting Together a Complete Pay and
Performance System. Chicago: Society for Human Resource Management.
Maslach, C., Schaufeli, W., and Leiter, M. 2001. Job Burnout. Annual Review of Psychology 52.
McDonald, P. and Gandz, J. 1991, Identification of values relevant to business research. Human
Resource Management 30: 217–236.
Musada, A., & Sorthiex, F. 2012. Work-family values, priority goals and life satisfaction: A
seven year follow-up of MBA students. Journal of Happiness Studies 13 (6).
Oyer, Paul. 2005. Salary or Benefits?. NBER Working Paper No. 11817.
Pandey, S., and David, S. 2013. A Study of Engagement at Work: What drives Employee
Engagement? European Journal of Commerce and Management Research (EJCMR) 2
(7).

34
Quinn, R.E. and Spreitzer, G.M. 1991. “The psychometrics of the competing values culture
instrument and an analysis of the impact of organizational culture on quality of life.”
Organizational Change and Development 5.
Robinson, D., Perryman, S., and Hayday, S. 2004. The drivers of employee engagement.
Accessed October 17, 2008. www.employment-studies.co.uk.
Rosen, S. 1974. Hedonic Prices and Implicit Markets: Product Differentiation in Pure
Competition. Journal of Political Economy.
Schein, E. H. 1985. Organizational culture and leadership. San Francisco: Jossey-Bass
Publishers.
Schmidt, F. L. and Hunter, J. E. 1998. The validity and utility of selection methods in personnel
psychology: Practical and theoretical implications of 85 years of research findings.
Psychological Bulletin 124: 262-274.
Sheridan, John E. 1992. Organizational Culture and Employee Retention. Academy of
Management Journal 30.
Vansteenkiste, M., Duriez, B., Simons, J., and Soenens, B. 2006. Materialistic values and
well-being among business students: Further evidence for their detrimental effect. Journal
of Applied Social Psychology 36: 2892-2908.
Wellins, R., Bernthal, P., and Phelps, M. n.d.. Employee Engagement: The Key to Realizing
Competitive Advantage. Development Dimensions International.
Wharton Class of 2015 Career Report. 2015. Penn Career Services.