Financing the future - tralac
80
Report April 2015 Financing the future How international public finance should fund a global social compact to eradicate poverty Romilly Greenhill Paddy Carter Chris Hoy Marcus Manuel
Transcript of Financing the future - tralac

Report April 2015
Financing the futureHow international public finance should fund a global social compact to eradicate poverty
Romilly Greenhill
Paddy Carter
Chris Hoy
Marcus Manuel

Overseas Development Institute203 Blackfriars RoadLondon SE1 8NJ
Tel. +44 (0) 20 7922 0300 Fax. +44 (0) 20 7922 0399 E-mail: [email protected]
www.odi.org facebook.com/odi.developmenttwitter.com/odidev
Readers are encouraged to reproduce material from ODI Reports for their own publications, as long as they are not being sold commercially. As copyright holder, ODI requests due acknowledgement and a copy of the publication. For online use, we ask readers to link to the original resource on the ODI website. The views presented in this paper are those of the author(s) and do not necessarily represent the views of ODI or Sida.
© Overseas Development Institute 2015. This work is licensed under a Creative Commons Attribution-NonCommercial Licence (CC BY-NC 3.0).
ISSN: 2052-7209
This report was generously supported by the The Swedish International Development Cooperation Agency

Acknowledgements We are grateful for helpful comments provided by peer reviewers Alex Evans, Nthuli Ncube, Yaw Ansu, Andrew Shepherd and Charles Kenny, in addition to those provided by Kevin Watkins, Ishbel Matheson, Edward Hedger, Andrew Rogerson, Annalisa Prizzon, Bryn Welham, Simon Gill, Joanna Rea and Gideon Rabinowitz. Gideon Rabinowitz also provided excellent research support.
This report drew heavily on background papers provided by Emma Samman and Chris Hoy (for chapter 2); Francesca Bastagli, Jessica Hagen-Zanker, Pauline Rose and Robert Yates (for chapter 3); Marcus Manuel and
Chris Hoy (for chapter 4); and Fiona Davies, Alastair McKechnie and Andrew Rogerson (for chapter 5). The views and recommendations expressed in the report are those of the report’s authors and may not reflect the positions of background paper contributors.
We are grateful to the Swedish International Development Cooperation Agency, SIDA, and the Bill and Melinda Gates Foundation for their generous financial support to this research. The report’s findings and conclusions do not necessarily reflect the views of the funders.
Financing the future 3

4 ODI Report
Contents
Acknowledgements 3
Executive summary 8
A window of opportunity 9
A global social compact 9
The financing gap 10
A greater focus on poverty 11
A new effectiveness agenda 11
A new multilateralism 12
Chapter 1: Introduction 14
Chapter 2: What is the challenge? 17
2.1: Tackling poverty: the last mile is always the hardest 18
2.2: Using international public finance to accelerate growth is only part of the solution 24
2.3: Summary – what do poverty trends mean for the provision of international public finance for the
achievement of the Sustainable Development Goals? 27
Chapter 3: How can international public finance help to support poverty eradication by 2030? 28
3.1: Funding a basic social compact 29
3.2: Social protection, social transfers and the Sustainable Development Goals 29
3.3: Quality universal primary and secondary education is critical for the eradication of extreme poverty and for
economic growth 35
3.4: Improving health outcomes is critical for the eradication of poverty and for economic growth 36
3.5: Meeting the Sustainable Development Goals for the social sectors will require public financing 37
3.6: Summary – how can international public finance support the achievement of the
Sustainable Development Goals? 38
Chapter 4: How much international public finance is needed, and how should it be allocated? 39
4.1: The volume of international public finance required 40

4.2: Allocating international public finance to end extreme poverty 49
4.3: Summary – recommendations on the volume and allocation of international public finance 54
Chapter 5: Effective delivery of international public finance for the achievement
of the Sustainable Development Goals 55
5.1: Making international public finance more effective 56
5.2: Time to re-shape the aid architecture 62
5.3: Summary and recommendations on IPF delivery and architecture 63
Chapter 6: Conclusions and recommendations 68
6.1: More concessional international public finance is needed particularly for least-developed countries
and fragile states 69
6.2: It is time for a new approach to the delivery of international public finance 70
6.3: It is time for a new multilateral architecture 70
References 72
List of tables, figures and boxes
Tables
Table 1: The potential impacts of social protection on economic growth 32
Table 2: Total costs of meeting the Sustainable Development Goals on poverty, education and health 48
Table 3: Additional public finance required to fund education, health and poverty reduction goals 49
Figures
Figure 1: Regional extreme poverty trends (share of population) 18
Figure 2: Regional extreme poverty trends (absolute numbers) 19
Figure 3: Baseline poverty forecasts from different studies 21
Figure 4: Extreme poverty will be concentrated in fragile states 21
Figure 5: Poverty in Sub-saharan Africa is expected to rise 21
Figure 6: Income distributions in China, India and sub-Saharan Africa 22
Financing the future 5
6 ODI Report
Figure 7: High-growth and low-growth scenarios 23
Figure 8: The impact of inequality trends on extreme poverty 23
Figure 9: Impact of environmental risks on human development 24
Figure 10: The returns to education are highest in the poorest regions 35
Figure 11: Extreme poverty: headcount ratio and gap 43
Figure 12: Indicative cash transfers costs 44
Figure 13: Costs of achieving education for all 45
Figure 14: Costs of achieving universal health coverage (UHC) 45
Figure 15: Indicative basic social compact costs 46
Figure 16: Available public finance and social compact costs 47
Figure 17: Aid per person (median) 51
Figure 18: Aid per person living in extreme poverty 51
Figure 19: Reallocation scenarios under existing ODA budgets 52
Figure 20: Allocations if donors fulfilled their 0.7% promise 53
Boxes
Box 1: International public finance 10
Box 2: Concessional international public finance 15
Box 3: Selected Sustainable Development Goals and targets in the social sectors 16
Box 4: The potential impact of environmental risks on human development 24
Box 5: The Bolsa Familia social protection programme in Brazil 30
Box 6: In fragile states, the focus on poverty needs to be supplemented by action to build states and promote peace 34
Box 7: Least developed countries 41
Box 8: The importance of government ownership for effective social protection programmes 57
Box 9: The Liberia Health Sector Pooled Fund 58
Box 10: Adaptive programming in practice 59
Box 11: Ebola and health systems 65


Executive summary

A window of opportunity This year the world will agree new Sustainable Development Goals (SDGs) to shape global development policy until 2030. Achieving these goals would have transformative effects, eradicating the scourge of global poverty and expanding opportunities for many millions worldwide. Success will require political leadership backed by financial commitments.
This report has a simple message: the proposed SDGs are achievable, but adopting a business-as-usual approach will leave us far short of the target. Projections based on current patterns of development point to a world in 2030 where:
• low-income fragile states have been left even further behind • some 550 million people are still living on less than
$1.25 a day, most of them in sub-Saharan Africa • around four million children will die needlessly
before the age of five • universal health and education are still distant prospects in
many countries, with some in sub-Saharan Africa still 20 years away from achieving universal primary education.
These outcomes are avoidable. When governments come together at the Financing for Development (FFD) conference in Addis Ababa in July 2015, they will have the opportunity to transform international development cooperation and put the world on a path towards the SDGs.
Governments meeting in Addis Ababa must navigate their way between two fallacies. The first is that money doesn’t matter. Good domestic governance and supportive international policy are high on the FFD agenda, and rightly so, but without a renewed effort to mobilise finance the Addis Ababa summit will fail. And while private finance is a big part of the story, eradicating poverty by 2030 will be impossible without adequate public finance. At present, however, the tax capacity of the world’s poorest countries falls far short of the scale of public investments required – in this report we estimate a $84 billion annual financing gap for social services and social protection alone. Contributing governments might not like this message, but if they are serious about the SDGs they must match new development ambitions with new development finance.
The second fallacy is that development outcomes will automatically follow financial inputs. The experience of the Millennium Development Goals (MDGs) era has laid bare the failings of that approach to development. The delivery of international public finance (IPF) must be adaptive and politically smart. In particular, IPF providers must find ways to support the development of state capacity in low-income fragile states.
This report sets out the case for a strengthened commitment for IPF to support a new social compact,
focused on the poorest countries. It makes a range of recommendations, some of which could be adopted in July’s FFD agreement, which would contribute to making development cooperation fit for purpose in the SDG era.
A global social compact The FFD conference should lay the groundwork for the establishment of a minimum standard of living for all, calibrated to national contexts. This basic social compact must include minimum income provisions, alongside universal health care and universal access to good quality education. These are three critical elements in the fight to tackle chronic poverty, stop impoverishment and accelerate the escape from poverty. Poverty eradication means providing everybody with access to essential basic services.
Social sector investments should not be seen as an alternative to a growth agenda, but an integral part of it. Investments in people complement investments in infrastructure. The pendulum of development fashion has swung back towards economic growth – and that is probably a good thing. But the pendulum should not swing too far. Even in growth success stories the benefits often trickle down to the poor far too slowly. Eradicating extreme poverty by 2030 will require mechanisms to reduce inequality and share the fruits of economic growth.
A new global social compact needs to include all the basic elements necessary for a decent standard of living. In this report we focus on just three core foundations: social protection, universal health coverage (UHC) and universal primary and secondary education.
1. Social protectionWell-designed, properly financed and effectively targeted social protection programmes bring the poorest people closer to a decent standard of living and can encourage productive investments that lead people out of poverty. The FFD conference presents an unprecedented opportunity for the international community to support the introduction and extension of nationally owned social protection programmes to include social transfers that are designed to lift people out of extreme poverty. We estimate an indicative budget for such programmes, based on a cash transfer scheme calibrated to the gap between the $1.25 purchasing power parity extreme poverty line and the average income of the poor in each country, making allowances for leakage and administrative costs. This exercise suggests a budget of $42 billion per annum, from all public sources, would be consistent with raising incomes above the extreme poverty line in all low-income countries. Current international aid efforts in this area are under-financed, short term and fragmented. Against this backdrop, it is time to reconsider the case for a multilateral financing mechanism.
Financing the future 9

10 ODI Report
Recommendation: the creation of a new global social protection facility, the ‘Bolsa Familia Global’ There is a need for a multilateral mechanism to provide predictable long-term funding for nationally owned social protection programmes in countries that lack the domestic resources to fund these themselves. This mechanism – in effect, a ‘Bolsa Familia Global’ – would provide transitional matched funding for governments seeking to scale up social protection geared explicitly towards transfers and social guarantees for the poorest. It would mediate between donors operating on a short-term budgetary horizon and governments making long-term social protection commitments, under an inclusive governance structure that operates impartially, with transparent allocation rules (including on graduation from its funding).
2. Universal health coverage Everybody should have the best possible chance of enjoying good health for its own sake, but ill-health is also a major source of poverty and vulnerability. Millions of the world’s poorest households are effectively priced out of health provision, unable to afford the cost of treatment and basic medicines. UHC should be seen as a vital element of any strategy for achieving the SDGs. On the basis of updated costings from the High Level Task Force on Innovative International Financing for Health Financing, it has been calculated that UHC in low-income countries would require around $74 billion per annum for a basic health package, from all public sources. Health systems are the responsibility of domestic governments, but there is a strong case for strengthening the international public finance architecture to better support their endeavours.
Recommendation: The Global Fund to Fight AIDS, Tuberculosis and Malaria should become a Global Fund for Health The Global Fund should become a vehicle for the acceleration of progress towards UHC and the provision of long-term financial support for country-led, problem-driven approaches to systems strengthening and service delivery. One important weakness of existing funds has been a lack of country ownership, coupled with a neglect of local capacity building. That is why an explicit focus is needed on support for countries to expand and improve their own health systems.
3. Universal primary and secondary education As with health, education matters in its own right – and it is a catalyst for progress in other areas. Improved access to good quality education is associated with higher incomes, improved health indicators and strengthened participation in decision-making. There is good evidence that education can contribute to national economic growth. Using the latest country-by-country estimates from the 2015 Education for All report, we estimate that extending
universal primary and lower secondary education to all in low-income countries would cost $32 billion per annum. In producing these estimates, special attention has been directed to countries affected by conflict and humanitarian emergencies. These countries account for around half of the children currently out of school – and receive little support from current aid delivery mechanisms. Improved donor coordination is critical.
Recommendation: the creation of a Humanitarian Fund for Education in Emergencies (HFEE) Modelled on the best practices of the pooled funds in health, the HFEE would bring together all actors to provide early action and lasting support for children caught up in conflict and other emergencies. The facility could operate by tendering for the delivery of cost-effective education provision, drawing where possible on the knowledge, skills and competencies of local organisations, rather than high-cost western NGOs and international agencies.
The financing gap Estimates of the total costs of delivering three key elements of a basic social compact have been prepared for this report. These are not estimates of the quantity of international assistance needed: the best sources of finance are domestic. While there are many innovative private solutions to health and education challenges across the developing world, extending access to the extreme poor will require public finance, and, where domestic resources are insufficient, delivering the social compact will require concessional IPF.
The financing gap has been estimated by comparing the total estimated costs for the three key interventions, of around $148 billion per annum, against potential domestic resources and existing ODA allocations. A model has
Box 1: International public finance
This report uses the term international public finance (IPF) to broaden the focus beyond the official development assistance (ODA) provided by members of the OECD Development Assistance Committee (DAC). It also focuses on the concessional elements of IPF, such as grants, as appropriate for the financing of a basic social compact. In 2013, ODA from all donors that report to the DAC amounted to $150 billion. Emerging donors that do not report to the DAC, such as China and Brazil, are estimated to account for 10-15% of global ODA-like flows, contributing somewhere in the region of $20-25 billion per annum of concessional development finance, and their importance is growing.

been developed for this report based on the assumption that developing countries collect revenues in line with their estimated tax capacity and allocate half of their total resources to the social sectors. This avoids rewarding low tax effort with higher IPF flows. On this basis, the total financing gap is around $84 billion per annum, $73 billion of which is in low-income countries.
The Addis Ababa summit should aim to set out concrete commitments to close this gap. Aid donors should start by fulfilling past promises. If rich countries are serious about the SDGs, they have to get serious about delivering 0.7% of their gross national income (GNI) as ODA. Spending an additional $84 billion annually on the social sectors would be possible if DAC donors delivered on their 0.7% promise and emerging providers scaled-up their development assistance programmes.
Recommendation: IPF providers make long-term commitments that are commensurate with financing the basic social compactIPF providers should commit to supporting governments that are themselves committed to introducing a national basic social compact, by ensuring that they have sufficient funding to do so. This means that donors cannot turn their backs on past commitments. The estimated financing gap in the social sectors alone is $84 billion per annum. Developing countries cannot be expected to embrace ambitious new SDGs without commensurate international support.
Recommendation: non-DAC IPF providers improve the reporting of their activities and consider setting their own financing targets for the SDGs Emerging providers, such as China and Brazil, have rapidly increased their development assistance in recent years. A greater commitment from such providers to focus on SDG priority sectors and to improve the transparency and communication of their IPF would be a welcome step forward. The first stage would be to build on what emerging providers are currently willing to report, and set targets on that basis. Wider reforms to the aid architecture may be needed as a pre-condition of such a move.
A greater focus on poverty Donors must also strengthen the poverty focus of their IPF programmes. Current development assistance flows are heavily skewed against those countries in the greatest need of support. If the group of low-income countries is ranked by income and divided in two, the richer half currently receives twice as much country-programmable ODA per person, on average, than the poorer half. If allocations are evaluated relative to the number of people living in extreme poverty in each country, the picture looks even worse: on that basis, the average low-income country receives about a third as much as lower–middle income countries.
The majority of low-income countries are also afflicted by conflict and classified as fragile states, a group neglected by the current pattern of international assistance.
Recommendation: 50% of concessional international public finance goes to least-developed countries If IPF were to be allocated to support the introduction of a basic social compact in those countries that cannot afford it themselves, it would need to be much more pro-poor. The estimated financing gap implies that more than 80% of existing ODA would need to go to least–developed countries (LDCs) to cover the costs of a basic social compact. In reality, countries also have other development priorities, the costs of which may be distributed in different ways. What is clear is that current aid allocations are far from being pro-poor. This report endorses the target that has been proposed by civil society organisations and the OECD that 50% of all concessional IPF should be spent in LDCs. We recognise that this does not go far enough, and that it is not a substitute for increasing total IPF volumes, but it would be a commitment worth securing nonetheless.
Recommendation: a commitment to leave no fragile state behindMost predictions show that extreme poverty will be increasingly concentrated in fragile states. The international community must be involved, at scale, in every low-income fragile state, and take a long-term perspective. Support to fragile states must also reflect the New Deal’s Peacebuilding and Statebuilding Goals, in addition to investments in social protection and the social sectors. Effective IPF delivery in these contexts is extremely challenging, but if the international community is serious about the SDGs, there is no other option.
A new effectiveness agenda The MDGs spawned a new era of thinking about how aid should be delivered, with the concept of country ownership at its heart. The Paris Declaration on Aid Effectiveness in 2005 was a seminal moment, and has been followed by a range of other international agreements. These agreements, while important, need updating for the SDG era. Three key changes need to be made.
The first is the recognition that poverty is becoming increasingly concentrated in fragile and conflict-affected states, with low levels of state capacity, and that current practice is not well aligned with the long-run challenge of development in these countries. One constraint is the risk-aversion of donors. In the understandable concern to demonstrate value-for-money, many aid agencies have shied away from engagement in difficult environments. This is short-sighted and counter-productive. As in other areas of development, early investment in prevention can offer better value-for-money than delayed investment in a cure.
Financing the future 11

12 ODI Report
The second change is to learn the lessons of recent efforts to improve aid effectiveness. Despite best intentions, the aid effectiveness agenda has not always delivered for poor people. This reflects, in part, a lack of awareness of the political and organisational bottlenecks to progress. The new IPF effectiveness agenda must continue to recognise the importance of country ownership, but it also needs to reflect the reality that aid is more effective when donors are politically smart and take a problem-led, adaptive approach to development. IPF providers need to become more like development entrepreneurs, or venture capitalists, prepared to take risks and adapt to circumstances, and recognising that some failure goes with the territory.
The final change that is needed is the recognition that IPF is no longer the preserve of the DAC donors, and so neither is the aid effectiveness agenda. New providers are rapidly entering the marketplace, leading to a new ‘age of choice’. While these providers account for only 10-15% of concessional IPF at present, their importance is growing fast. The new agreement needs to reflect their experiences and priorities, and the qualities of their support that are particularly valued by countries. Speed is one such key area.
IPF providers must reinvigorate the aid effectiveness agenda and make IPF fit for purpose in the SDG era A new framework should incorporate core elements of the Paris agenda, but add long-term commitment, risk-sharing, adaptive programming and speed. Ownership, alignment and harmonisation remain critical, all the more so in fragile states. But IPF providers also need to become more ‘politically smart’, more adaptive, and make longer–term commitments. Risk-sharing is also particularly important in fragile states. The new framework would need to be designed and agreed in a way that reflects the views and priorities of non-DAC donors, through a multilateral mechanism involving all relevant stakeholders.
A new multilateralism A number of the themes we highlight in this report point in the same direction: towards a greater role for multilateral development agencies in the SDG era. Multilaterals can better absorb and share the risks inherent in working in fragile states, take a longer-term approach to development and, with the right governance structures, have the potential to be more accountable to the countries in which they operate. Multilaterals tend to make greater use of country
systems, and score better on assessments of aid quality. They can provide more predictable finance, giving countries the confidence to make long-term fiscal commitments. They have the scale to take responsibility for whole regions or country categories and find it easier than bilaterals to shift their allocations to make them more pro-poor.
The picture is not wholly positive, however. Multilaterals can be inflexible and, although they are sometimes better able to act than bilateral donors, their procedures are sometimes poorly suited to the realities of fragile states with low levels of government capacity. Long-standing problems with governance and accountability are well known. The need for a new IPF effectiveness agenda applies as much to multilaterals as everyone else.
Some multilaterals, particularly global funds, can make use of innovative sources of finance to overcome the challenge of the short-term time horizons of much development spending. Vertical funds have their drawbacks, but they represent mechanisms for the mobilisation of a more predictable flow of resources, at scale, to tackle critical development challenges in the least- developed countries. Their advantages can include a greater emphasis on results, the inclusion of civil society and the private sector, transparency, innovation and adaptation, and proven effectiveness in helping countries to scale up. At the same time, vertical funds have faced challenges in terms of country ownership and local capacity building. At worst, they risk setting up parallel systems. This is why an explicit focus on strengthening country systems is needed. But a second generation of vertical funds, such as those proposed here, has the potential to deliver a step-change in international support for a basic social compact.
Recommendation: the multilateral architecture for operating in fragile states is strengthenedMultilateralism is particularly important in fragile contexts. Fragile states do not need a new fund, but more effective coordination between the funds that are already engaged. The UN has international legitimacy and a mandate, while the Bretton Woods Institutions have financial resources and technical expertise. Coordination has improved, but more needs to be done. Even within the UN system, there is inadequate coordination between the UN Security Council and the UN Peace-building Commission. This needs to change. At country level, there also needs to be better coordination between actors working on different objectives, including political settlements, personal security, humanitarian action and development.

Financing flagship 13
Financing the future
Free basic universal
healthcare
We need a new global social compact
What will this cost low income countries per year?
$73 billion shortfall
But if governments fulfil their existing aid pledges, we can meet these costs – and still have at least $40 billion to spare.
Sources available at odi.org/financing-future
How international public finance should fund a global social compact to eradicate poverty
Extreme poverty will be even more concentrated in sub-Saharan Africa
Number of people living in extreme poverty (millions):
Sub-Saharan AfricaSouth AsiaEast Asia and PacificRest of the developing world
4mchildren will die needlessly before the age of five
Even if they raise taxes and use existing aid, there will still be a shortfall of $73 billion.
We can’t afford not to. July’s Financing for Development summit should:
Commit rich countries to giving 0.7% of their national income in aid
Bring emerging economies into the system as contributors
Develop smarter, more flexible and long-term ways to provide aid
1 Create or expand global funds for health, education in humanitarian crises, and social protection
Redirect 50% of foreign aid budgets towards the poorest countries where aid is most needed
2
3
5
4
Read the report at odi.org
#FtF2015
Social protection
for the poorest
Free primary and secondary
education for all
If we stick to business as usual, we’ll fall far short of our development goals in 2030
But we can avoid this. Aid won’t solve the whole problem, but if we can mobilise the money and be smart about spending it, we can help to eradicate global poverty over the next 15 years.
500mpeople will still be living on less than $1.25 a day
Low-income fragile states will be left even further behind
$148 billion
2011
2030
0 200 400 600 800 1000

Chapter 1: Introduction

This is a critical moment for international development. In September 2015, the international community will agree on an ambitious new set of Sustainable Development Goals (SDGs) that, as currently proposed, include eradicating poverty by 2030, ensuring people lead healthy lives and providing all children with a good quality primary and secondary education. This report argues that these goals are attainable, but not without a radical change in approaches to development financing. The Financing for Development (FFD) summit scheduled for July 2015 provides a window of opportunity to make that change.
The summit is where the world must decide how to deliver and finance the SDGs. The first draft of the FFD agreement, published in March, contained a commitment to a new basic social compact, to guarantee what is in effect a minimum standard of living for everyone, calibrated to national contexts. This commitment will not be fulfilled without effective international public finance (IPF), and this report examines how that must be done.
One lesson learned from the era of the Millennium Development Goals (MDGs) is that there must be a far stronger focus on people and countries that are being left behind by progress, encapsulated in the proposed SDG 1 of ‘ending poverty in all its forms everywhere’. On current trends, however, there is a real risk that people and countries will – once again – be left behind, particularly in fragile and conflict-afflicted states and in Africa. Public financing is essential to stop history repeating itself, and where domestic public finance is insufficient, IPF has to step in.
This report covers three sectors that are the foundations of a basic social compact: social protection, health and education.1 Its aim is to inform the policy debate by using cost estimates developed for these key sectors, without seeking to dictate national policy priorities or spending levels. Without costings, financing and allocation debates have no basis. But whilst adequate finance is necessary, it is not sufficient. This report focuses on the challenge of delivering effective support to these three sectors, and examines allocation, architecture and delivery.
Extreme poverty will be increasingly concentrated in low-capacity and conflict-afflicted countries, putting a premium on the effective delivery of IPF in such contexts. This will require investments in capacity building and demands a long-term perspective and greater risk tolerance. The principle of country ownership remains important, and IPF providers must learn to be politically smart and take a problem-led, adaptive approach to
development. Multilateral organisations are potentially better suited to some of these challenges.
This is not proposed as an alternative to a pro-growth agenda: it recognises that economic growth is the most important driver of development in the long run. Growth generates better paid jobs, access to a greater variety and higher quality of goods and services, and the domestic resources to fund social services on a sustainable basis.2 Developing countries tend to prioritise growth and jobs more than the international development community has done in the past (Lopes, 2014; Pritchett, 2015). Low-income fragile states, in particular, have called for more action on job creation and growth.3
But ending poverty requires economic growth that is inclusive and sustainable, and that will require mechanisms to share the fruits of economic growth. Seen in this light, social sector investments complement the growth agenda because they can reach the poorest households which might otherwise be left behind by economic progress. Social investments are also inputs to the growth process – a healthy and educated workforce is more productive, and individuals are better able to make productive investments when offered some degree of income security.
1 The draft Financing for Development Outcome document proposes a ‘new basic social compact to guarantee nationally appropriate minimum levels of social protection and essential public services,’ a conception that goes beyond social protection, health and education. The proposal explicitly builds on the International Labour Organization’s (ILO) Recommendation 202, for a global Social Protection Floor, which was endorsed by governments and multilateral organisations in 2012.
2 The enormous challenge that climate change represents for achieving the SDGs is beyond the scope of this report. Economic growth must, of course, be climate compatible. Environmental sustainability has to become part of everything countries and their international partners do in the pursuit of economic growth. See Granoff et al. (2014) and the Global Commission on the Economy and Climate (2014) for more details.
3 As evident in the Peacebuilding and Statebuilding Goals (PSGs), formulated under the New Deal for Engagement in Fragile States (g7+, 2011).
Financing the future 15
Box 2: Concessional international public finance
IPF refers to ‘financial interventions by a nation state, or a multilateral organisation, to secure public policy outcomes outside national boundaries’ (Glennie and Hurley, 2014). It covers the whole range of financial instruments, including grants, concessional loans, loans at market rates and equity investments, from all countries.
The focus in this report is on the SDGs related to poverty and the social sectors, which means that we discuss, for the most part, concessional international public finance. At present, most of this (85-90%) is official development assistance (ODA) from members of the OECD’s Development Assistance Committee (DAC) (Greenhill at al., 2013). However, the growing economic and political muscle of non-DAC donors, and their track record of successful policy experience in developing-country contexts, means that concessional IPF from non-DAC donors is likely to become ever-more important.

16 ODI Report
Concessional IPF for the social sectors is necessary, but ‘business as usual’ approaches to its allocation, delivery and architecture will not propel the world to the automatic achievement of the SDGs. That will require major improvements in both the quantity and quality of IPF. In particular, IPF providers need to ensure that more is allocated to the poorest countries in greatest need, and to find ways to deliver it more effectively in these
countries. That will require a greater appetite for risk and an acceptance of the need to do development differently, particularly by working in more flexible and adaptive ways (Wild et al., 2015). Such a shift in approach needs to be underpinned by a new multilateral architecture that will pool funding and share risks in the social sectors, particularly in fragile states.
Box 3: Selected Sustainable Development Goals and targets in the social sectors
The SDGs proposed by the Open Working Group on the SDGs include commitments to:
Goal 1. End poverty in all its forms everywhere
1.3. Implement nationally appropriate social protection systems and measures for all, including floors, and by 2030 achieve substantial coverage of the poor and the vulnerable.
Goal 3. Ensure healthy lives and promote well-being for all at all ages
3.8. Achieve universal health coverage (UHC), including financial risk protection, access to quality essential health care services, and access to safe, effective, quality, and affordable essential medicines and vaccines for all.
Goal 4. Ensure inclusive and equitable quality education and promote life-long learning opportunities for all
4.1. By 2030, ensure that all girls and boys complete free, equitable and quality primary and secondary education leading to relevant and effective learning outcomes.
Goal 10. Reduce inequality within and among countries
10.4. Adopt policies especially fiscal, wage, and social protection policies and progressively to achieve greater equality.

Chapter 2: What is the challenge?

18 ODI Report
2.1: Tackling poverty: the last mile is always the hardest
Poverty is now concentrated in sub-Saharan Africa and among the most disadvantaged people The Millennium Development Goal (MDG) target of halving extreme income poverty was met five years ahead of schedule, with the extreme poverty rate falling from 43% in 1990 to 17% in 2011 (World Bank, 2014a).4 However, this fall has been unevenly distributed, with a rapid fall (from 55% to less than 10%) in East Asia and the Pacific, but only a small reduction (from 55% to 50%) in sub-Saharan Africa (Figure 1). As a result of population growth, the absolute numbers of poor people in sub-Saharan Africa has actually increased, while their numbers have declined in other regions (Figure 2).
Those living in poverty today are often from the socioeconomic groups and countries that face the most significant obstacles to their escape from poverty (Chandy et al., 2013). Today’s poorest people tend to have one or more of the following characteristics.
• They are rural (78-85%) (Sumner, 2013; Shepherd and Lenhardt, 2013). In income poverty terms, 78% of poor people live in rural areas, and 63% of them work in smallholder farming. While poverty rates in urban areas
4 Measured by the $1.25 a day poverty line.
Key points
• Global extreme poverty has fallen rapidly, and the most optimistic scenarios suggest that the extreme poverty rate could fall to 3-7% of the world’s population by 2030.
• But extreme poverty will be increasingly concentrated in fragile states and/or sub-Saharan Africa, and extreme poverty rates are expected to remain high in these regions in 2030.
• Extreme poverty is now concentrated among the most disadvantaged people: those in rural areas, those at risk of climate change, the young, the old, those from ethnic minorities and those with some form of disability.
• Progress on the MDGs related to the social sectors has been mixed.
• If economic growth disappoints, and if income inequality worsens, extreme poverty rates could remain in double digits.
• Climate change will have substantial impacts on poverty.
• Using international public finance to accelerate economic growth is only part of the solution.
Figure 1: Regional extreme poverty trends (share of population)
0
10
1990 1993 1996 1999 2002 2005 2008 2011
20
30
40
50
60
Sub-Saharan Africa
South Asia
East Asia and the Pacific
Rest of the developing world
Shar
e of
pop
ulat
ion
livin
g in
ext
rem
e po
vert
y (%
)
Year
Source: World Bank (2014a).

have been growing, they tend to remain lower than those in rural areas (Olinto et al., 2013).
• They are at risk from climate change. Many of the world’s poorest people live in regions or economies that are at the greatest risk of natural disasters and the impact of climate change (Shepherd et al., 2013).
• They are young (Olinto et al., 2013) or old (Masset and White, 2004; Kakwani and Subbarao, 2007). Children account for 34% of those who are extremely poor but only 20% of the non-poor. Households with older heads or members also tend to be poorer than other households (Samman and Rodriguez-Takeuchi, 2013).
• They are from ethnic minorities (68-72%) (Sumner, 2013). Ethnic minorities are more likely to be chronically poor than the wider population (Sumner, 2012).
• They have some form of disability. Disabilities are significantly higher among the poorest groups of people (Mitra et al., 2011).
While it would seem logical to suggest that women experience greater levels of poverty, the hard evidence for this is ambiguous. Lampietti and Stalker (2000) conclude that ‘the aggregate evidence is mixed and no systematic pattern of disadvantage emerges’. However, such evidence tends to ignore other aspects of gender disadvantage, not least the ‘dual burden’ faced by many women of caring for families while lacking any power or voice within their households or wider communities (Chant, 2006).
Progress on the social sector Millennium Development Goals has been mixed Developing countries have made great progress in expanding access to schooling, reducing child mortality
and, to a lesser extent, extending social protection (including cash transfers) since 2000. But MDG targets for health and education will be missed in many countries, and projections suggest that progress across developing regions will increasingly diverge and that certain groups within countries are likely to fall behind.
Sub-Saharan Africa is the region where the most significant challenges remain. SSA’s primary enrolment level stood at 78% in 2011, and its lower secondary enrolment level at just 49% (UNESCO, 2014). Almost half of the world’s deaths of children under the age of five occurred in SSA in 2012 (UNICEF, 2014). Cash transfer programmes reached just 5-6 million people in SSA in the late 2000s, if South Africa – with its more extensive social protection provision – is excluded. And most of these programmes were temporary (World Bank, 2012).
Children who are currently out of school are increasingly concentrated in conflict-affected countries, which accounted for 50% of such children in 2011 (up from 42% in 2008), even though only 22% of children lived in these countries (UNESCO, 2014). Only two fragile states are expected to achieve the MDG on child mortality by 2015 (OECD, 2014a).
As well as leaving some countries lagging behind, the progress made in recent decades has also bypassed some groups within countries. Girls made up 54% of the out–of school population and education gaps between the richest urban boys and poorest rural girls grew during the 2000s, while people of working age with disabilities were about one-third less likely to have completed primary school (UNESCO, 2014). In addition, the rate of decline in under-five mortality has been slower for the poorest households (UNICEF, 2014).
Financing the future 19
Figure 2: Regional extreme poverty trends (absolute numbers)
0
1990 1993 1996 1999 2002 2005 2008 2011
500
1000
1500
2000Sub-Saharan Africa
South Asia
East Asia and the Pacific
Rest of the developing world
Num
ber o
f peo
ple
(milli
ons)
Year
Source: World Bank (2014a).

20 ODI Report
Some projections suggest many low-income countries will not achieve universal primary school completion until at least the 2060s, decades after most middle-income countries (MICs) (Lange, 2014). Only six low-income countries are expected to achieve universal lower-secondary completion before 2060 (UNESCO, 2014). Similar trends emerge on under-five mortality, with more than one–third of countries, most of which are in SSA, not expected to achieve the proposed SDG target of 20 under-five deaths for every 1,000 live births by 2030. In 2013, 6.3 million children died before their fifth birthday – if present trends continue, 4.4 million children will still die before the age of five in 2030 (Liu et al., 2014).
Optimistic scenarios suggest that the poverty rate could fall to 3-7% of the world’s population by 2030Projecting future poverty trends is a challenge, but it can help to inform decisions about the role and allocation of IPF. The rate of poverty reduction is a function of the initial depth of poverty, the rate of economic growth and the share of any increment to growth captured by the poor. Most economists project future levels of growth and inequality based on historical changes in GDP per capita and income/consumption distributions. Studies using this method include those by Ravallion (2013), Karver et al. (2012), Chandy et al. (2013), Kharas and Rogerson (2012), Edward and Sumner (2014) and the World Bank (2015). These studies vary according to the data used to project growth into the future. Nevertheless, their projections
of extreme poverty in 2030 based on ‘business as usual’ scenarios vary only slightly, and tend to be in the range of around 3-7% of the world’s population (Figure 3). This means that approximately 200-550 million people would be living in extreme poverty, compared with 1 billion today.
By 2030, poverty will be concentrated in fragile states and/or sub-Saharan Africa Chandy et al. (2013) and Kharas and Rogerson (2012) both use the OECD definition of fragile states to demonstrate that, on current trends, extreme poverty will become a fragile states phenomenon by 2030 (Figure 4).
Kharas and Rogerson (2012) suggest that three-quarters of the world’s extreme poor will be living in fragile states by 2030.
The most recent poverty projections from the World Bank, based on the new poverty data released in October 2014, foresee an increase in the number of Africans living in extreme poverty by 2030 (World Bank, 2015). The baseline projection suggests there will be significant falls in the extreme poverty headcount in East Asia and South Asia but the absolute number of people living in extreme poverty in sub-Saharan Africa is projected to increase by over 50 million people between 2011 and 2030, to 470 million (Figure 5). As a result, sub-Saharan Africa is
Photograph: Ben Grey. A crowded classroom in Ghana, 2012.

Financing the future 21
The absolute number of people living in extreme poverty in sub-Saharan Africa is projected to increase by over 50 million people between 2011 and 2030, to 470 million.
Figure 3: Baseline poverty forecasts from different studies
0
1990 2000 2010 2020 2030
10
20
30
Deve
lopi
ng w
orld
ext
rem
e po
vert
y he
adco
unt r
atio
(%)
Year
40
50 Actual
Ravallion
Karver
Chandy
Edward
World Bank
7.8%
6.5%
5.5%
3.5%
3%
Sources: Ravallion (2013); Karver et al. (2012); Chandy et al. (2013);
Edward and Sumner (2014); World Bank (2015).
Figure 4: Extreme poverty will be concentrated in fragile states
Year
2010 2015 20300
10
20
30
40
50
60
70
80
Shar
e of
glo
bal e
xtre
me
pove
rty
in fr
agile
sta
tes
(%)
90Chandy et al.
Kharas and Rogerson
38%
46% 45%
65%62%
75%
Sources: Chandy et al. (2013); Kharas and Rogerson (2012).
Figure 5: Poverty in sub-Saharan Africa is expected to rise
Year
2011 20300
200
400
600
800
1000
1200
Num
ber l
ivin
g in
ext
rem
e po
vert
y (m
illion
s)
Sub-Saharan Africa
South Asia
East Asia and the Pacific
Rest of the developing world
Source: World Bank (2015).

22 ODI Report
projected to be home to around five–sixths of the world’s poor by 2030. These projections imply a global extreme poverty rate of 6.5–7% of the world’s population in 2030, which is around 550 million people.
These projections are based on extrapolating growth rates from the most recent decade of data, making them more pessimistic than other projections, and are based on changes in income or consumption as recorded in household surveys rather than in national accounts, which provides a more accurate picture of consumption in the poorest households, especially in South Asia.
Extreme poverty rates will remain high in sub-Saharan Africa partly because of the depth of the region’s existing poverty. Figure 6 shows the distributions of income in China, India and sub-Saharan Africa at different points in time, with the volume under the line representing the number of people: the higher the line, the more people living on that level of income. At the start of the MDG era in 2000, the most common level of income in China (the mode) was $0.95 per day, close to the extreme poverty line. By 2010 it was close to $2, which is why the MDG target of halving global extreme poverty by 2015 will be met. In 2010 the situation in India looked better than that in China in 2000, with a mode of $1.18, which is why hopes of eradicating extreme poverty in India by 2030 are realistic. But in 2010, most people in sub-Saharan Africa
were surviving on a lot less than $1.25 a day – the mode was just $0.46. Chandy et al. (2013) expect that 171 million people in sub-Saharan Africa will still be living below the extreme poverty line in 2030.5
If economic growth disappoints, poverty will persist All of the projections outlined above depend on assumptions about future economic growth. They are based on projecting forward growth rates from an exceptionally strong decade for developing countries. However, if global growth slows by just three percentage points, an estimated additional half a billion people will be living in extreme poverty in 2030. In other words, if developing country economies grow at half the rate they did in the 2000s for the next 15 years, their poverty rates could still be above 10% in 2030. This crucial difference between high–growth and low–growth scenarios is shown in Figure 7.
If income inequality worsens, poverty will persistThe poverty projections outlined above assume that income inequality remains constant. However, changes in inequality can matter just as much as changes in economic growth (Chandy et al., 2013). In the past decade, within-country inequalities have, on average, widened. Yoshida et al. (2014) argue that eliminating extreme poverty, if inequality within and across countries continues to widen,
5 This is substantially less than the 470 million projected more recently by the World Bank (2015), illustrating the extent of uncertainty around these forecasts.
Figure 6: Income distributions in China, India and sub-Saharan Africa
00 0.5 1 1.5 2 2.5 3 3.5 4
5
10
15
20
Num
ber o
f peo
ple
(milli
ons)
Income ($ in purchasing power parity terms)
Sub-Saharan Africa 2010
India 2010
China 2000
$1.25
Source: Chandy et al. (2013).

would require the economies of the developing world to grow at an unprecedented and virtually impossible pace.
The World Bank (2014b) has modelled changes in the growth rate of the bottom 40% of the population relative to the average. From this it is possible to estimate how changes in inequality would alter their baseline projections (Figure 8). In 2030, if growth holds constant, a global poverty rate of anywhere between 3% and 9.5% appears
plausible, depending on whether the bottom 40% of the distribution were to grow by one to two percentage points faster or slower than the average growth rate.
Of course, inequality trends could also improve, particularly given the recent policy focus on increasing the incomes of the bottom 40% of people, and if developing countries replicate the polices that saw inequality in Latin America fall between 2000 and 2010.6
Financing the future 23
6 The World Bank has adopted the goal of ‘shared prosperity’, which it defines as growth that benefits the bottom 40% of the population, and the Sustainable Development Goals Open Working Group has proposed an income inequality target to ‘achieve and sustain income growth of the bottom 40% of the population at a rate higher than the national average’ (UNOWG, 2014).
Figure 7: High–growth and low–growth scenarios Figure 8: The impact of inequality trends on extreme poverty
0
1990 2000 2010 2020 2030
10
20
30
Glob
al e
xtre
me
pove
rty
head
coun
t rat
io (%
)
Year
40
50Actual
Karver low growth
Karver high growth
Edward low growth
Edward high growth
Chandy low growth
Chandy high growth
0
1990 2000 2010 2020 2030
5
10
15
20
Perc
enta
ge o
f wor
ld p
opul
atio
n (%
)
Year
25
30
35
Actual
Baseline projection
Bottom 40% grow 1% slower than average
Bottom 40% grow 2% slower than average
Bottom 40% grow 1% faster than average
Bottom 40% grow 2% faster than average
40
9%
6%
5%
4%
3%
10%
10%
9%
4%
3.5%
3%
Source: Lakner et al. (2014).
Note: Poverty projections are based on holding national growth rates
constant, but varying the share of income accruing to the poorest 40%
of the population.
Sources: Chandy et al. (2013); Edward and Sumner (2014);
Karver et al. (2012).
Note: Poverty projections are based on assuming no change in
within-country inequality but considering different national growth
scenarios.

24 ODI Report
Even so, such are the uncertainties around growth and inequality trends, such that combining growth and inequality trends to construct plausible projections puts the poverty rate in 2030 anywhere between 3% and the current rate of 15%.7
Climate change will have substantial impacts on poverty Even if drastic mitigation measures are taken today, climate change is expected to have a major and negative impact on economic growth and development (Box 4) – an impact that has not been taken on board in the projections presented so far. Climate change will make it more difficult for those in extreme poverty to escape it, and will threaten to drag moderately poor people (those on $2 per day) into extreme poverty.
Many vulnerable populations are already suffering the effects of climate change in the form of reduced rainfall or more frequent and severe extreme weather events
(World Bank, 2013a). Climate change is likely to affect poverty in several ways. A changing climate may reduce access to potable water, decrease nutrients in crops and limit the length of growing seasons, thereby leading to changes in the variety of livestock, habitats and crops. The World Bank has estimated that climate change may lead to a decline of up to 90% in crop yields in sub-Saharan Africa (World Bank, 2013a). This is likely to have a direct impact on poor people, who are far more vulnerable to climate shocks as they tend to rely more heavily on the environment around them (Angelsen et al., 2014). Furthermore, those living in poverty are not as able to protect themselves against shocks or to recover from them as other groups (Hallegatte and Dumas, 2008). In sub-Saharan Africa and South Asia, as temperatures rise by 2º Celsius, 250-500 million people could be exposed to multi-year setbacks in their efforts to escape from poverty,
7 The rate of 15% comes from combining the most pessimistic growth and inequality scenarios.
Box 4: The potential impact of environmental risks on human development
The 2011 Human Development Report (UNDP, 2011) aimed to quantify the potential impact of environmental risks alongside changes in inequality upon human development outcomes, using the Human Development Index (HDI) as a proxy. It set out the following three scenarios.
1. ‘Base case’ – ‘limited changes in inequality and the environment. Implied 19% increase in global HDI 2010-2015 (44% increase for sub-Saharan Africa).’
2. ‘Environmental challenge’ – ‘intensified environmental risks at the household (solid fuels), local (water and sanitation), urban (air pollution) and global levels (especially impact on agricultural production). Global HDI is 8% lower than the base case, 12% lower in South Asia and sub-Saharan Africa.’
3. ‘Environmental disaster’ – ‘most early 21st century gains have eroded by 2050 as biophysical and human systems are stressed by … falling water tables, glacial melting, progressive deforestation and land degradation, dramatic declines in biodiversity, greater frequency of extreme weather events, increased civil conflict and other disruptions.’
Source: Human Development Report Database (HDRD) calculations based on data from the HDRD database and Hughes, Irfan
and others (2011), who draws forecasts from International Futures, Version 6.42.
Figure 9: Impact of environmental risks on human development
Base case
Environmental challenge
Environmental disaster
1980 1990 2000 2010 2020 2030 2040 20500.3
0.4
0.5
0.6
0.7
0.8
0.9
1.0Very high HDI countries
Low, medium and high HDI countries
HDI
Year
Note: See text for explanation of scenarios.

8 For example: in 2010, the Netherlands announced a shift from the social sectors towards economic growth (MFA, 2010); in 2011, the EU adopted its Agenda for Change, which prioritises growth (and human rights) (COM, 2011); DFID has introduced a new Economic Development for Shared Prosperity and Poverty Reduction strategy (DFID, 2013); and in 2014, the Australian Government announced a new aid strategy that emphasises growth (DFAT, 2014).
given declines in agricultural productivity (Granoff et al., 2014). The precise impact is complex and hard to predict, but the bottom line from Nelson et al. (2009) is yields down, prices up.
Climate change is likely to increase the frequency and severity of natural disasters. Such disasters, especially those
linked to drought, can be the most important cause of impoverishment, wiping out progress on poverty reduction.
Natural disasters are already estimated to have the greatest impact on those living in the lowest income quintile or quartile, and rural populations are likely to be affected disproportionately (Shepherd et al., 2013).
Climate change will also have indirect effects on poverty. It will make it more difficult for governments to
support people in their escape from poverty because of the additional pressures placed on infrastructure and health systems as a result of natural disasters and the ill-health caused by climate change (Schellnhuber, 2012). Climate change is also likely to entrench existing inequalities and vulnerability (Eriksen, 2014), while environmental stress is likely to heighten the risk of conflict linked to control of natural resources (Harris et al., 2013).
2.2: Using international public finance to accelerate growth is only part of the solution The poverty projections explored in this report demonstrate that poverty reduction will depend on inclusive and sustainable economic growth. One obvious response is to focus IPF on stimulating such growth. The pendulum of development fashion has certainly swung that way, which is probably a good thing.8 But the pendulum must not swing too far. The next chapter presents evidence that social sector investments are themselves vital inputs to the growth process. However, the following sections outline three additional reasons why poverty eradication
Financing the future 25
Up to 325 million extremely poor people will be living in the 49 most hazard-prone countries in 2030, the majority in South Asia and sub-Saharan Africa.
Photograph: United Nations Photo. A Somali refugee stands inside a tent with her baby in Dollo Ado, Ethiopia.

26 ODI Report
9 One obvious role for IPF in stimulating growth is financing infrastructure, but Warner (2013) shows that infrastructure booms are typically not followed by economic growth: ‘If anything the cases of clear-cut booms illustrate the opposite – major drives in the past have been followed by slumps rather than booms.’
10 In fact, the marginal impact of aid upon growth turns negative at higher levels in these estimated models.
11 These calculations, which use country-specific estimates of the change in poverty as a response to national growth rates, are provided by DFID Chief Economist Stefan Dercon and Nick Lea, Senior Economic Advisor.
12 This raises the possibility that South-South cooperation could, perhaps, promote more successful policy prescriptions – perhaps active industrial policy.
cannot rely solely on domestic and international efforts to stimulate growth, without major investments in the social sectors:
1. The impact of growth on poverty is varied and uneven. Social sector investments are needed to raise the living standards of those who are not reached by economic growth.
2. Existing empirical estimates suggest that even if the entire global aid budget was spent on growth, it would have only a minor impact on poverty trajectories.
3. The ability of external actors to influence economic growth is highly uncertain. A complete growth strategy must insure itself against failure.
Growth is gradual and unevenIf there is an example of the most that we can expect from economic growth, it is China. Between 1981 and 2010, China achieved annual growth of at least 10% – a rate that most developing countries can only dream of – and reduced its extreme poverty rate from 84% to 12% (Chandy and Gertz, 2011). This is both a stunning achievement and a reminder of just how hard ‘getting to zero’ will be. Few of today’s extremely poor countries, particularly those in sub-Saharan Africa with very high poverty rates, can be expected to emulate China. Ncube et al. (2014) argue that even under a ‘best case’ scenario of accelerated growth and the redistribution of wealth from rich to poor, the poverty rate in sub-Saharan Africa will still be around 10% by 2030. And even if attempts to stimulate inclusive growth in low-income countries succeed, there will still be a need to raise the standard of living of those who are waiting for the benefits of growth to reach them.
The average impact of international public finance on growth is smallEstimates of the relationship between IPF and growth are contradictory and fragile. Some scholars maintain that there is no relationship at all (Doucouliagos and Paldam, 2013), while others report that IPF has a remarkably large impact on growth (Galiani et al., 2014; Brückner, 2013).9 The most highly regarded estimates of the relationship between aid and growth are probably those of Clemens
et al. (2012), who disaggregate aid to isolate the elements most likely to have a short-run impact on growth and allow for a lag between disbursement and impact. They find that, when starting from a low level, an increase of one percentage point in the ratio of aid to gross domestic product (GDP) tends to be followed by a modest increase in growth of 0.1–0.2 percentage points.
But a key feature of these estimates is the presence of diminishing marginal returns, so that higher levels of aid buy ever smaller increases in growth.10 Aid is, on average, already about 4.5% of recipient GDP. If the total current global aid budget was reallocated across developing countries so that the poorest countries each receive a level of aid equivalent to 20% of recipient GDP (a level beyond which further increases have no impact according to Clemens et al., 2012) that could raise the annual growth rate by about 1 percentage point in each country. This, in turn, would reduce the global incidence of extreme poverty in 2030 by around just 1.6 percentage points.11
Worse, the estimates in Clemens et al. (2012) are averages across all aid recipients, but there is little evidence that foreign aid has had a positive impact on growth where it is most needed: in low-income countries (LICs). Carter (2015) takes the data and methodology used in Clemens et al. (2012) and splits the sample between LICs and MICs. The results – which should be treated with caution, as with all cross-country regressions – show that aid has a positive association with subsequent growth in MICs, but not in LICs.
The relationship between policy reform and growth is highly uncertainThe role of IPF is not confined to financial transfers: it can also help to create domestic policy environments that are conducive to growth. However, the relationship between policy reform and growth is highly uncertain. Perhaps more worryingly, the evidence suggests that some commonly prescribed cures for weak ‘domestic enabling environments’ may be less effective in LICs and in sub-Saharan Africa.12 Christiansen et al. (2013) find that domestic trade and financial reforms are associated primarily with growth in MICs. Billmeier and Nannicini (2013) find that the liberalisation of economies had a positive effect in most regions in the early years but that more recent liberalisations, mainly in Africa, had no significant impact.
13 The authors use non-democratic regime change to measure stability, so stable government may also include one-party states with no genuine democracy.

Salinas et al. (2015) argue that market liberalisation is only associated with growth in those few African countries thathave also achieved political stability.13
These arguments about the uncertain outcomes of policy interventions cut both ways: there is strong evidence around effective social-sector investments, but evidence does not amount to certainty. The implementation of evidence-based policy remains a gamble, even if the odds are known. These observations do not undermine the argument, they reinforce it: the right strategy in the face of uncertainty is diversification, and, among its many merits, investment in the social sectors provides some insurance against disappointments in the quest for economic growth.
2.3: Summary – what do poverty trends mean for the provision of international public finance for the achievement of the Sustainable Development Goals? The last mile on the journey to poverty eradication is likely to be the hardest. While some projections based on optimistic growth and inequality trends make the achievement of poverty eradication look plausible via ‘business as usual’ approaches, more realistic scenarios imply that poverty rates could still be in double digits
in 2030. In addition, these projections do not factor in climate change, which is expected have significant – and negative – impacts on poverty. The SDG of eradicating poverty will be far harder to achieve than the MDG of halving it, because the depth of poverty in regions such as sub-Saharan Africa is so much greater than it was in China before the big MDG-era reductions in poverty headcounts. Those who are living in poverty today now tend to be concentrated in low-capacity and fragile states and/or are from the most marginalised groups across all countries.
Seeking to use IPF to raise growth rates and, in turn, accelerate poverty reduction in the pursuit of the SDGs is only part of the solution. Growth itself is varied in its ability to reduce poverty. The average impact of IPF on growth is small, and the ability of IPF to influence growth is very uneven. Social-sector investments complement more explicit investments in growth, in part because they can alleviate poverty if efforts to stimulate growth falter.
IPF needs to be provided in ways that support countries in their efforts to reach the poorest of the poor, that are adapted for every country context, that support the kind of pro-poor growth that benefits everyone, and that ensures resilience to safeguard families against the risk of falling back into poverty.
The next chapter explores some policies that can help to achieve these goals, outlining the positive impacts of health, education and social protection.
Financing the future 27

Chapter 3: How can international
public finance help to support poverty
eradication by 2030?

Financing the future 29
3.1: Funding a basic social compact
Research by the Chronic Poverty Advisory Network (CPAN, 2014) has shown that getting to zero extreme poverty means pursuing three separate but interdependent objectives: tackling chronic poverty; stopping impoverishment; and sustaining poverty escapes. A number of policies address specific parts of this ‘poverty tripod’. For example, anti-discrimination, affirmative-action measures and access to justice can help to tackle chronic poverty, and land reforms can help to sustain escapes from poverty.
Given the focus of this report on the role of concessional international public finance (IPF) in helping to ‘get to zero’ poverty by 2030, consideration is given to three key policies highlighted by CPAN where concessional IPF has a crucial role to play. These policies should form a key part of the global basic social compact to ensure a minimum standard of living for all:
• Social transfers, which bring the poorest people closer to a decent standard of living, provide a safety net for them in tough times, and encourage them to make the investments and take the risks that could propel them out of poverty and keep them there.
• Investment in education (primary and secondary), which enables people to escape from poverty and sustains their climb away from it, and is a ‘portable asset’ that is resilient to crises.
• Universal health coverage, to prevent the ill health that so often pushes people into poverty and holds them there.
It is not suggested that these policies be imposed on governments from the outside: as discussed in Chapter
5, policies work best when they are led by governments. But with strong domestic political support, these social-sector investments can make a critical contribution to the eradication of poverty by 2030.
3.2: Social protection, social transfers and the Sustainable Development Goals The proposed Sustainable Development Goals (SDGs) and the draft Financing for Development (FFD) agreement both refer to social protection: a set of policy instruments that pursues multiple objectives including poverty reduction, income redistribution, and consumption smoothing over the course of people’s lifetimes.
Social protection programmes have two key components: social assistance, comprising transfers in cash or in kind to households or individuals, and social insurance, consisting of contributory schemes such as unemployment or health insurance and pensions.
The boundaries between these two categories are fluid, and there is often a degree of symbiosis between the two, particularly when contributory schemes are used to part-finance social assistance and/or general taxation is used to subsidise social insurance deficits. The success of social protection programmes is bound up with their domestic financing arrangements and political legitimacy, which can sometimes be strengthened when both social assistance and insurance co-exist.
The SDGs and the FFD process are global in nature; the focus in this report is on eradicating extreme poverty in the poorest countries, those which lack domestic resources to do so themselves. This suggests a natural emphasis on transfers to lift households out of extreme poverty (without implying that narrowly targeted transfers are necessarily the right instrument). In this report the term ‘social transfers’ is used to cover the full range of policy instruments suited to that task, whether these are social assistance or social insurance.
Cash transfers have garnered a lot of policy attention in the run up to the FFD conference, but these are just one form of social transfer.14
Social transfers can reduce poverty and promote economic growth Social transfers come in many shapes and sizes, and their impact on poverty depends on the details of design, implementation and context. However, a large body of evidence suggests that, when combined with policies that promote growth and strengthen basic services, social transfers have the potential to greatly reduce global poverty and vulnerability (Barrientos, 2012). As the Chronic Poverty Report 2014-2015 notes, social transfers are now ‘the leading instrument for tackling
14 See for example Martin Ravallion’s blog ‘Time for the BIG idea in the developing world’.
Key points
• Concessional IPF has a crucial role to play in funding a basic social compact which includes social protection, investment in education and universal health coverage.
• Social transfers can reduce poverty, promote growth and support adaptation to climate change, even in the least-developed countries.
• Quality universal primary and secondary education and better health outcomes are all critical for the eradication of extreme poverty and for economic growth.
• Meeting the Sustainable Development Goals for the social sectors will require public financing.

30 ODI Report
the vulnerability and insecurity of the poorest people, and developing a security net that allows them to make some progress’ (CPAN, 2014:36). Such programmes can tackle chronic poverty, prevent impoverishment and help to accelerate transitions away from poverty, the three legs of the ‘poverty tripod’ outlined above. However, social transfers are more likely to enable graduation from extreme poverty if part of an integrated anti-poverty programme, rather than a stand-alone project. The Chronic Poverty Report also notes that social transfer systems can only be effective if they are permanent: small-scale, time-limited projects will not create an environment that enables poor people to take the decisions they need to take if they are to escape from poverty. There also needs to be demand for such programmes from poor people and/or elites (CPAN, 2014). In many poor countries, a lasting exit from poverty may be more likely when social transfers are complemented by services such as business or agricultural training and assistance with saving and asset accumulation.15
Transfers have already proven themselves in middle-income countriesThe growth of social transfer programmes since the 1990s has been staggering, with between 750 million and 1 billion people in developing countries now receiving transfers (Barrientos, 2013). Pioneering examples include the ‘minimum living standards guarantee’ in China,
Bolsa Familia in Brazil (Box 5), Solidario in Chile, and Opportunidades in Mexico.
Estimating the impact of transfers on poverty is complicated by potential behavioural responses to such transfers that are hard to observe, ranging from increased investments in human capital to reduced labour supply. However, some indication of the impact of a transfer can be gleaned by subtracting its value from observed consumption.
On this basis, transfers have had a large impact on global poverty. The most recent and comprehensive study estimates that social transfers have almost halved the poverty gap in the average lower-income country (LIC) or middle-income country (MIC) (Fiszbein et al., 2013), with the greatest impact felt in MICs, where the scope and scale of social protection is greatest. In sub-Saharan Africa, however, where coverage is low and transfers tend to be small and of short duration, transfers are estimated to have moved only 1% of the population out of extreme poverty. Clearly, this pattern needs to change.
Social transfers can have a positive impact on growth, productivity and resilience In addition to reducing poverty directly, transfers can also promote economic growth. Researchers Ostry et al. (2014) from the International Monetary Fund found statistical evidence that average redistributive fiscal transfers have a robust association with higher and more durable growth. Indeed, transfers can have a positive impact on growth
15 An example is the Graduation Model, based on a programme pioneered by the Bangladeshi NGO BRAC, which consists of a series of interventions designed to build a path out of extreme poverty. See Karlan and Goldberg (2014).
Box 5: The Bolsa Familia social protection programme in Brazil
The Bolsa Familia (BF) – meaning ‘family allowance’ – programme was initiated by the Federal Government of Brazil in 2003 in an effort to unify and expand an existing system of cash-transfer programmes targeted at the poor that had been evolving since the mid-1990s.
BF provides a cash transfer to all households living below predetermined income thresholds (which are revised regularly as the cost of living changes), with separate thresholds for the extreme poor and the moderate poor. Households living under the extreme poverty threshold receive a basic income transfer plus a variable transfer, with households categorised as moderately poor only receiving the latter. The levels of variable transfers households can receive are determined by the number of children (capped at three) and whether the mother is pregnant or breastfeeding. In 2012 the Brasil Carinhoso (Affectionate Brazil) phase of the BF programme was introduced, which provided a basic level of income per capita in a household by topping up family incomes with the transfers (Osorio and Ferreira de Souza, 2013).
A series of conditions are then applied that need to be met if the household is to receive the maximum level of transfer. These conditions relate to school enrolment and attendance for children aged 6-15 and the use of a range of health services, depending on age and circumstances (vaccinations, health checks and pre- and post-natal treatment). The consequences for non-compliance with conditions are gradual, progressing slowly from a warning through a number of stages to the cancellation of benefits (Lindert et al., 2007).
BF was scaled up rapidly after its launch and was reaching 11.1 million families by June 2006 (Lindert et al., 2007). As of October 2014, it was reaching 13.9 million families (MDS, 2014), equivalent to around one-quarter of Brazil’s population. BF has had a significant impact on inequality, accounting for 16-21% of the total fall in inequality across Brazil since 2001. It has also reduced the national poverty rate by 1.6% and has helped to reduce the poverty gap significantly (Osorio and Ferreira de Souza, 2013).

Financing the future 31
Photograph: Ana Nascimento/Ministério do Desenvolvimento Social e Combate à Fome. A beneficiary of Bolsa Família, Maria Luzia and her children.
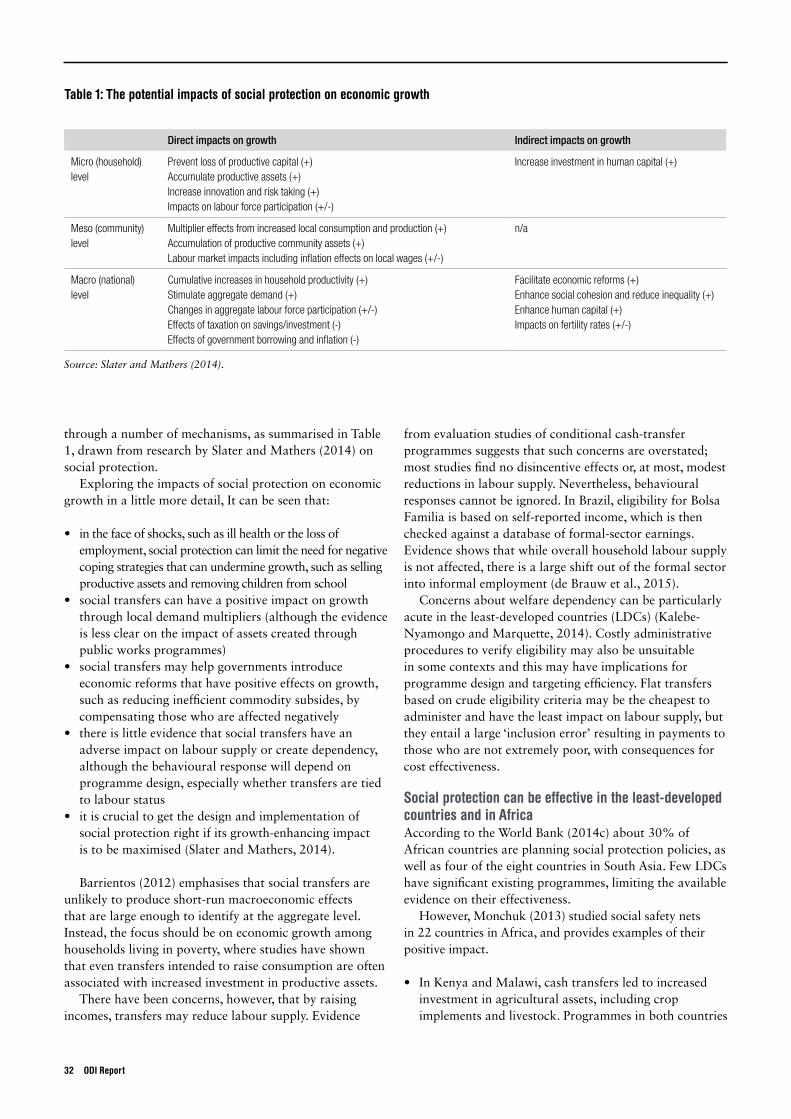
32 ODI Report
through a number of mechanisms, as summarised in Table 1, drawn from research by Slater and Mathers (2014) on social protection.
Exploring the impacts of social protection on economic growth in a little more detail, It can be seen that:
• in the face of shocks, such as ill health or the loss of employment, social protection can limit the need for negative coping strategies that can undermine growth, such as selling productive assets and removing children from school
• social transfers can have a positive impact on growth through local demand multipliers (although the evidence is less clear on the impact of assets created through public works programmes)
• social transfers may help governments introduce economic reforms that have positive effects on growth, such as reducing inefficient commodity subsides, by compensating those who are affected negatively
• there is little evidence that social transfers have an adverse impact on labour supply or create dependency, although the behavioural response will depend on programme design, especially whether transfers are tied to labour status
• it is crucial to get the design and implementation of social protection right if its growth-enhancing impact is to be maximised (Slater and Mathers, 2014).
Barrientos (2012) emphasises that social transfers are unlikely to produce short-run macroeconomic effects that are large enough to identify at the aggregate level. Instead, the focus should be on economic growth among households living in poverty, where studies have shown that even transfers intended to raise consumption are often associated with increased investment in productive assets.
There have been concerns, however, that by raising incomes, transfers may reduce labour supply. Evidence
from evaluation studies of conditional cash-transfer programmes suggests that such concerns are overstated; most studies find no disincentive effects or, at most, modest reductions in labour supply. Nevertheless, behavioural responses cannot be ignored. In Brazil, eligibility for Bolsa Familia is based on self-reported income, which is then checked against a database of formal-sector earnings. Evidence shows that while overall household labour supply is not affected, there is a large shift out of the formal sector into informal employment (de Brauw et al., 2015).
Concerns about welfare dependency can be particularly acute in the least-developed countries (LDCs) (Kalebe-Nyamongo and Marquette, 2014). Costly administrative procedures to verify eligibility may also be unsuitable in some contexts and this may have implications for programme design and targeting efficiency. Flat transfers based on crude eligibility criteria may be the cheapest to administer and have the least impact on labour supply, but they entail a large ‘inclusion error’ resulting in payments to those who are not extremely poor, with consequences for cost effectiveness.
Social protection can be effective in the least-developed countries and in AfricaAccording to the World Bank (2014c) about 30% of African countries are planning social protection policies, as well as four of the eight countries in South Asia. Few LDCs have significant existing programmes, limiting the available evidence on their effectiveness.
However, Monchuk (2013) studied social safety nets in 22 countries in Africa, and provides examples of their positive impact.
• In Kenya and Malawi, cash transfers led to increased investment in agricultural assets, including crop implements and livestock. Programmes in both countries
Table 1: The potential impacts of social protection on economic growth
Direct impacts on growth Indirect impacts on growth
Micro (household) level
Prevent loss of productive capital (+)Accumulate productive assets (+)Increase innovation and risk taking (+)Impacts on labour force participation (+/-)
Increase investment in human capital (+)
Meso (community) level
Multiplier effects from increased local consumption and production (+)Accumulation of productive community assets (+)Labour market impacts including inflation effects on local wages (+/-)
n/a
Macro (national) level
Cumulative increases in household productivity (+)Stimulate aggregate demand (+)Changes in aggregate labour force participation (+/-)Effects of taxation on savings/investment (-)Effects of government borrowing and inflation (-)
Facilitate economic reforms (+)Enhance social cohesion and reduce inequality (+)Enhance human capital (+)Impacts on fertility rates (+/-)
Source: Slater and Mathers (2014).

Financing the future 33
increased food consumption. In Malawi, adults and children moved from agricultural wage labour to work on their own farms. In Kenya, child labour fell and there was increased participation in non-farm enterprises for female-headed households.
• In Ethiopia, households with access to both the Productive Safety Net Programme (PSNP) and the complementary packages of agricultural support were more likely to be food secure, to borrow for productive purposes, to use improved agricultural technologies and to operate their own non-farm business activities.
• In Ghana, Kenya and Zimbabwe, cash transfers led to increased investment in economic activities and increased social capital and risk-sharing arrangements. In addition, the transfers allowed households to reduce their debt levels and increase their creditworthiness.
• The income multipliers of cash transfers on the local economy were estimated at 1.81 and 2.23, respectively, in Kenya and Lesotho. Non-beneficiaries and the local economy also benefited significantly from cash transfer programmes through trade and production links.
The magnitude of these impacts depends not only on the adequacy of transfers, but also on how focused programmes are on the poor and the presence of complementary policies. Monchuk (2013) observes that few African countries have well-planned social safety net systems that are capable of taking a strategic approach to the reduction of poverty and vulnerability. Instead,
a multitude of interventions exist that are fragmented, often donor driven, and that together do not target the poor effectively.
The most ambitious African programme is Ethiopia’s PSNP, which reaches 7.6 million beneficiaries. Although the very poorest households receive cash transfers, the PNSP is primarily a public works programme accompanied by measures to raise agricultural productivity. Berhane et al. (2014) show that these accompanying measures boost the impact of the programme significantly, illustrating the potential importance of complementary policies that aim to raise household incomes.
Some of the most robust evidence from LDCs on the impact of cash transfers (one potential means of implementing social transfers) comes from evaluations by the NGO GiveDirectly in Kenya. Although the size of the transfers exceeds anything governments would be likely to provide, Haushofer and Shapiro (2013) show that transfers:
• allow poor households to build assets and increase revenues from small businesses
• increase consumption, including food, health care, education and family events
• reduce hunger • do not increase spending on alcohol and tobacco • increase the psychological well-being of recipients
and their families
• do not affect all aspects of poverty: they observed no impact on health or education.
There are examples of effective social transfers in fragile and conflict-affected states, but challenges remainSocial transfers can – and do – help to reduce poverty in fragile and conflict-affected states. They can also help to support peace and state-building objectives which, as discussed further below, are critical for progress on poverty reduction, growth and the social sectors in fragile states. Cambodia, Nepal, Rwanda and Sierra Leone have all used social protection programmes successfully to promote peace and reconciliation after a period of protracted conflict and have, in particular, made good use of cash transfers and labour-intensive public works. Cash-transfer programmes can help communities to re-establish their livelihoods and restore lost assets and have taken the form of transitional payments to demobilised ex-combatants in Angola, Mozambique and Rwanda, as well as cash payments to internally displaced people and veterans in Timor-Leste (Andrews et al., 2012).
There are, however, challenges to the delivery of social transfer programmes in such contexts. These include the presence of additional vulnerable groups, such as displaced populations, ex-combatants, people disabled by war, widows and orphans, as well as limited state capacity and an insecure environment, affecting both the supply of and demand for social welfare (Andrews et al., 2012). The key is to combine anti-poverty measures with action to build states and promote peace (Box 6).
There has been mixed progress on targeting the poorest and most vulnerable people Expectations about the impact of social transfers on extreme poverty should be tempered by realism about coverage and targeting. In Botswana, for example, with its relatively strong state capacity, one anti-poverty programme reaches only one-third of the targeted group. In some cases, such as Zimbabwe, eligible claimants may be discouraged by onerous procedures (Munro, 2003). In LDCs it is common for over half of eligible households to be excluded from programmes intended to help them (EPRI, 2011).
Social transfer programmes that are excessively focused on the extreme poor may also be divisive, lack political legitimacy and prove to be unsustainable (Ellis, 2012). Long-run pro-poor outcomes are not necessarily best served by pro-poor programmes in the short run. Political considerations may act as a constraint on the proportion of available funds that can realistically be transferred to the extreme poor.
The impact of social transfers on poverty may also be reduced if local elites capture the benefits of social transfers. Community-based targeting is sometimes used to identify poor households, which runs the risk of such capture. The evidence on this is, however, mixed: Alatas et al. (2013), for example, find evidence of capture at the

34 ODI Report
village level, but also find that its overall impact is very small. There are opportunities for more wholesale looting by, for example, creating fictitious recipients. Such risks must not be downplayed, but equally they should be set against comparable risks in traditional development spending, where rates of elite capture can be extremely high (Reinikka and Svensson, 2004).
However, as Fiszbein et al. (2014) show, the primary constraint in LICs is often inadequate financing. In a country with a high poverty rate, larger programmes are likely to reach far more of the extreme poor. Monchuk (2013) argues that this picture is sustainable and improving – with a number of countries actively increasing the effectiveness and the scale of their existing programmes, including Ghana, Kenya and Tanzania – and that more institutionalised programmes are starting to appear, backed by influential ministries.
The availability of new technologies, such as mobile payments and biometric identification, has the potential to increase both coverage and targeting efficiency and
to prevent fraud, although their costs must be weighed carefully. Muralidharan et al. (2014) show that the introduction of a smartcard system in India sharply reduced leakage. Garcia and Moore (2012) observe that technology used in new transfer programmes in developing countries is sometimes more advanced than that of developed countries, although they warn that policy-makers must not be dazzled by new technologies.
Social protection programmes can also help adaptation to climate changeSocial protection can complement other measures to support climate-change adaptation and disaster-risk reduction. Kuriakose et al. (2013) note that countries with social-protection systems in place before shocks hit are better able to launch a more immediate and effective response when such events occur. By integrating climate and disaster-risk considerations into the planning and design of programmes, social protection can contribute to long-term adaptation to climate change.
Box 6: In fragile states, the focus on poverty needs to be supplemented by action to build states and promote peace
In fragile and conflict-afflicted states, investments in the social sectors must be combined with a focus on building a durable transition to stability, or there is a risk that progress in human development will be undermined – and quickly – by conflict and unrest. For every three years that a country is affected by major violence, poverty reduction lags behind by 2.7 percentage points. Strengthening legitimate institutions and governance to provide citizen security, justice and jobs is critical to breaking these cycles of violence (World Bank, 2011).
Five Peacebuilding and Statebuilding Goals (PSGs) have been identified under the New Deal for Engagement in Fragile States.* These goals, some of which have received little attention in the past, will require significant support and investment, in addition to support for the social sectors in fragile states, if they are to meet the goal of ending extreme poverty.
The Five PSGs are: • Legitimate politics: foster inclusive political settlements and conflict resolution • Security: establish and strengthen people’s security • Justice: address injustices and increase people’s access to justice • Economic foundations: generate employment and improve livelihoods • Revenues and services: manage revenue and build capacity for accountable and fair service delivery.
Evidence on the contribution of IPF to peace-and state-building is mixed. The role of finance is ambiguous: higher government revenues may give insurgents more to fight for, but may also fund security and patronage. Poverty may induce people to take up arms, but research finds that militancy is most often supported by groups that are comparatively well off (Blair et al., 2012).
Hoeffler and Fearon (2014) conclude that post-war development aid helps to stabilise the peace and there is good evidence that UN peace-keeping operations have had some success. Hoeffler (2014) reviews a large sample of studies of various types of intervention to prevent or end civil wars, and concludes that UN Peacekeeping operations (UNPKO) appear to be the most effective.
Regarding official development assistance in particular, there is little evidence that aid itself prevents the onset of civil war, but there is some evidence that it helps to stabilise the situation once a conflict has ended. Aid modalities also seem to matter (Fishstein and Wilder, 2011). However, while it might be hard to find evidence that giving aid prevents conflict, there is evidence that withdrawing aid can provoke it. Severe decreases in aid revenue shift the domestic balance of power and have the potential to spark violence (Nielsen et al., 2011).
* Developed through the forum of the International Dialogue for Peacebuilding and endorsed at the 4th High Level Forum on Aid Effectiveness in 2011.
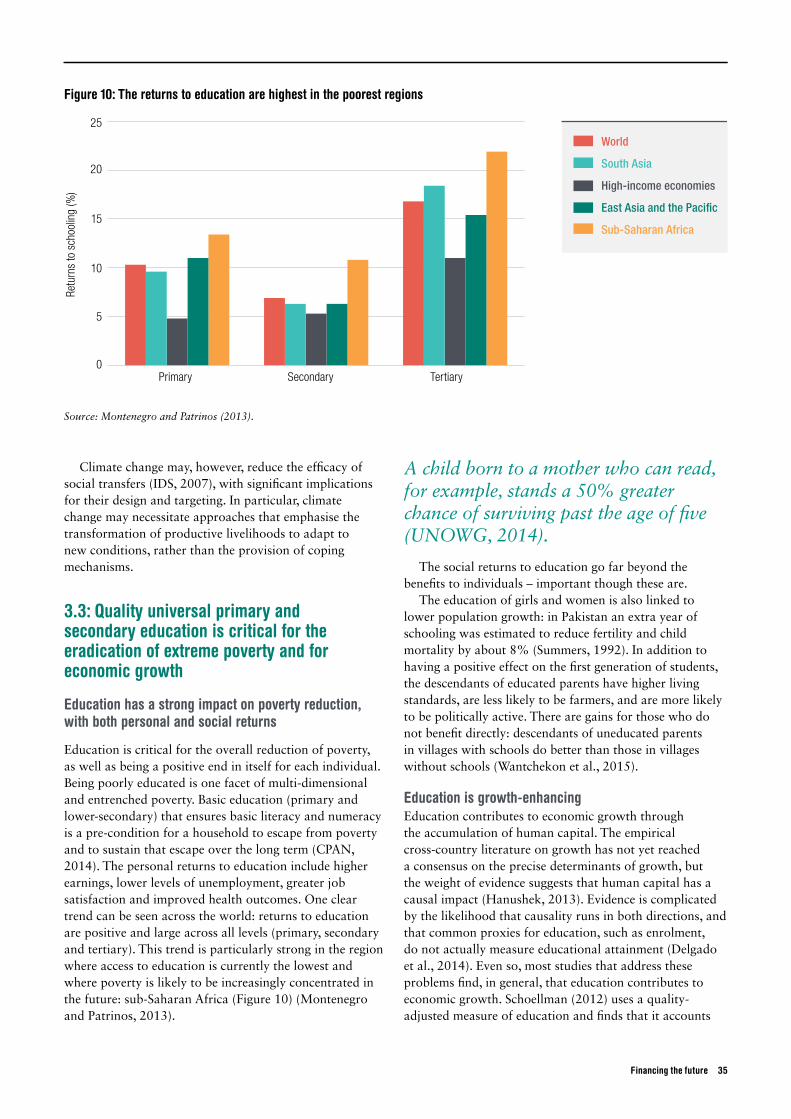
Financing the future 35
Climate change may, however, reduce the efficacy of social transfers (IDS, 2007), with significant implications for their design and targeting. In particular, climate change may necessitate approaches that emphasise the transformation of productive livelihoods to adapt to new conditions, rather than the provision of coping mechanisms.
3.3: Quality universal primary and secondary education is critical for the eradication of extreme poverty and for economic growth
Education has a strong impact on poverty reduction, with both personal and social returns
Education is critical for the overall reduction of poverty, as well as being a positive end in itself for each individual. Being poorly educated is one facet of multi-dimensional and entrenched poverty. Basic education (primary and lower-secondary) that ensures basic literacy and numeracy is a pre-condition for a household to escape from poverty and to sustain that escape over the long term (CPAN, 2014). The personal returns to education include higher earnings, lower levels of unemployment, greater job satisfaction and improved health outcomes. One clear trend can be seen across the world: returns to education are positive and large across all levels (primary, secondary and tertiary). This trend is particularly strong in the region where access to education is currently the lowest and where poverty is likely to be increasingly concentrated in the future: sub-Saharan Africa (Figure 10) (Montenegro and Patrinos, 2013).
The social returns to education go far beyond the benefits to individuals – important though these are.
The education of girls and women is also linked to lower population growth: in Pakistan an extra year of schooling was estimated to reduce fertility and child mortality by about 8% (Summers, 1992). In addition to having a positive effect on the first generation of students, the descendants of educated parents have higher living standards, are less likely to be farmers, and are more likely to be politically active. There are gains for those who do not benefit directly: descendants of uneducated parents in villages with schools do better than those in villages without schools (Wantchekon et al., 2015).
Education is growth-enhancing Education contributes to economic growth through the accumulation of human capital. The empirical cross-country literature on growth has not yet reached a consensus on the precise determinants of growth, but the weight of evidence suggests that human capital has a causal impact (Hanushek, 2013). Evidence is complicated by the likelihood that causality runs in both directions, and that common proxies for education, such as enrolment, do not actually measure educational attainment (Delgado et al., 2014). Even so, most studies that address these problems find, in general, that education contributes to economic growth. Schoellman (2012) uses a quality-adjusted measure of education and finds that it accounts
A child born to a mother who can read, for example, stands a 50% greater chance of surviving past the age of five (UNOWG, 2014).
Figure 10: The returns to education are highest in the poorest regions
0Primary Secondary Tertiary
5
10
15
20
World
South Asia
High-income economies
East Asia and the Pacific
Sub-Saharan Africa
Retu
rns
to s
choo
ling
(%)
25
Source: Montenegro and Patrinos (2013).

36 ODI Report
for 20% of the variation in income levels across countries. Hanushek and Woessmann (2012) develop a measure of educational attainment and use a variety of techniques that separate causation from correlation, finding that cognitive skills have a strong impact on economic growth rates across countries.
Education helps to reduce the risk of conflict, but children in conflict-affected countries are more likely to be out of school Evidence from, for example, Mesoy (2013) and von Hippel (2013) also suggests that the delivery of social services can reduce radicalism and conflict. Education in particular may have a pacifying effect, according to quantitative, empirical evidence from Østby and Urdal (2011). Higher levels of education have also been shown to lead to better governance outcomes in some contexts. Educated people are more likely to vote for politicians because of their policies, rather than their ethnicity (Wantchekon, 2003).
However, over half of the world’s children who are out of primary school are in conflict-affected countries, even though these countries are home to only 22% of children overall (UNESCO, 2014). Millions of adolescents and pre-primary age children are also missing out on eduction in these countries. In Syria, for example, over one million children are refugees: more than half of all school-aged Syrian children in Jordan and Lebanon are not in school (UNHCR, 2013).
Education must be of high quality if it is to have any impact on poverty and growthEducation will not help to tackle poverty reduction or support economic growth if it is not of high quality (and linked to job creation). The trend over the MDG era has been to focus on increasing school enrolment, backed by a political push for universal primary education that has often centred on highly visible actions that offer greater political rewards, such as school construction and enrolment. Issues such as the quality of teaching and learning on offer, which remain far less visible to parents, students and the wider community, have been relatively neglected. The quality of education is of particular importance for poor and marginalised groups (CPAN, 2014).
3.4: Improving health outcomes is critical for the eradication of poverty and for economic growth
The importance of better health
Good health is an end in itself, and while it is necessary for the eradication of poverty in a broader sense than income poverty alone, its impact on income poverty is clear: better health helps poor people to escape poverty and prevents impoverishment (CPAN, 2014). This is seen in the relationship between wages and malnutrition,
malaria and anaemia. Reducing malnutrition can improve individuals’ lifetime earnings significantly, as individuals who experience malnutrition in their first 1,000 days of life can suffer from physical and cognitive impacts, including stunting (Horton and Hoddinott, 2014). One additional centimetre in height (indicating lower levels of stunting) is correlated with additional income of 1-15%(Wantchekon, 2003). The personal returns to health understate the social returns of measures to improve health – the most obvious examples being immunisation and disease control.
The cross-country evidence on the relationship between health and economic growth is contested and, as in the case of education, causality runs in both directions. Weil (2014) provides an overview and concludes that while there is causation in both directions, the magnitude of that causation is small. Other studies find larger effects and, crucially in the context of eradicating extreme poverty, the strength of the relationship with income tends to be strongest for people at the lower end of the income distribution (Lancet, 2013). Mwabu (2007) surveys micro evidence using techniques that achieve causal identification and finds large returns to investments in health in low-income countries.
Universal health coverage is the best way to improve health outcomes According the World Health Organization (WHO), the objective of universal health coverage (UHC) is:
To ensure that all people obtain the health services they need without suffering financial hardship when paying for them.
UHC, therefore, combines two benefits. First, everybody is covered by health services that include preventive, curative, rehabilitative and palliative care. Second, UHC provides financial protection from the costs of health care. This stops people being impoverished by health-care expenditure and reduces their fears of the consequences of becoming sick. The defining characteristic of UHC is that it reaches the poorest members of society, who could not otherwise afford to access health care. This means that UHC cannot be separated from its financing: governments must subsidise costs for the poor. The Chronic Poverty Report 2014-2015 concludes that ‘minimising the risk of impoverishment linked to health shocks requires universal health coverage (UHC), with an emphasis on access, quality, equity and minimising out-of-pocket expenses. This solution to the health-poverty challenge is a health service that is free at the point of delivery, whether funded by tax revenues or part-funded by insurance contributions, and accessible to the poorest children and adults’ (CPAN, 2014:60).
A 2014 study by Nicholls and Pannelay compared health outcomes and costs in 166 countries, and found that all of the countries identified as top performers: ‘have universal healthcare systems that promise (to a greater or lesser extent) to cover most health costs for their citizens’.

Financing the future 37
UHC is not the preserve of stable economies. Many post-conflict states have already used rapid health-sector reforms to deliver popular quick-win social policies to their populations. Examples include Afghanistan, Burundi, Liberia, Nepal and Sierra Leone, whose post-conflict, democratically elected governments have all rapidly extended the coverage of free and publicly financed health services, often prioritising the most vulnerable groups.
3.5: Meeting the Sustainable Development Goals for the social sectors will require public financing
Finance is necessary, but is not enough to guarantee progress Nobody imagines that development outcomes will follow financial inputs automatically. However, adequate and appropriate finance is a prerequisite to providing a basic social compact. Even genuinely ‘developmental’ governments will not get very far without access to sufficient resources. To borrow the language of growth diagnostics (Hausmann et al., 2005), finance might not always be the binding constraint in countries, but it would become so if taken away.
Clearly, the policy and governance environment matters for the effective utilisation of resources. Rajkumar and Swaroop (2008) show that health spending has a larger impact on health outcomes in countries with good governance, as does education spending on education outcomes. The quality of health care and education in low-income countries is often alarmingly low. Filmer et al. (2000) document the ‘weak links in the chain’ between inputs and outcomes in the health sector in poor countries. Das and Hammer (2014) find that constraints such as poor infrastructure or a lack of essential drugs and training, play a relatively small role in explaining the quality of health care (or the lack of it). Murnane and Ganimian (2014) survey rigorous impact evaluations of education reforms and conclude that it has proven much easier to increase school attendance than to increase educational quality.
The role of politics and the incentives of powerful actors in the extent and quality of social service delivery is explored by Wild et al. (2015). They argue that improving the quality of social services for the poor will require governments and their international development partners to take a locally-led, problem-driven and politically-informed approach.
It is important to remember, however, that while finance is not sufficient for progress, on balance the evidence
suggests that it is necessary. Rabinowitz and Prizzon (2015) found that in every country where there has been progress in a particular social sector, this progress has been associated with rising resources.16 In the case of social protection, Bastagli (2013) found that lack of financial resources was one of four main reasons for low coverage and effectiveness, and Carpenter et al. (2012) found that affordability was particularly important in fragile and conflict-affected situations.
In education, there is ample evidence that finance that reduces the costs of attending school has had a large impact on enrolment and completion rates. Colclough and Al-Samarrai (2000) show that the sub-Saharan countries that made most progress on primary school completion tended to have higher levels of public expenditure, both as a share of GDP and in absolute terms. But as countries have made progress on school attendance, attention has started to shift towards learning outcomes. Murnane and Ganimian (2014) argue that resources only improve student achievement if they change the daily experience of being at school. In a review of the evidence, Glewwe et al. (2011) report that having a fully functioning school – one with better quality buildings, properly equipped classrooms and a school library – contributes to student learning. Most recently, Evans and Popova (2015) claim that pedagogical interventions, individualised teacher training and reforms that boost accountability have been most frequently found to raise education quality across a wide set of impact evaluations.
In health, the WHO has identified financing as an absolutely pivotal building block for effective health systems that provide UHC (WHO, 2010). 17 Raising adequate levels of health financing and allocating these resources efficiently and equitably might not be enough to achieve UHC, but it is necessary. Without appropriate funding for required inputs (such as health workers’ salaries, medicines, facilities, equipment and information systems) the other health sub-systems simply can’t function.
Public financing is necessary in the social sectorsThe source of the finance matters, not just the quantity. For the social sectors, evidence suggests that public financing is likely to be most effective in meeting the SDGs, although the exact financing mix will be a matter for domestic policy choices. Social protection is – almost by definition – publicly funded, with the main debate around financing sources hinging on the balance between domestic and international public finance. LICs have, to date, tended to be heavily reliant on IPF to fund social protection, whereas MICs and high-income countries (HICs) have funded programmes primarily from government revenues.
16 The case study selection was biased explicitly towards examples of progress, which may bias the findings, as cases where a similar volume and composition of financing could have been available without commensurate progress were not considered.
17 The six health systems building blocks identified by the WHO (2007) are: leadership/governance, health care financing, health workforce, medical products/technologies, information/research and service delivery.

38 ODI Report
In both education and health, Rabinowitz and Prizzon (2015) found that progress was associated with a shift in the burden of financing away from households and towards governments. This finding chimes with the conclusions from the sectoral literature. In education, the abolition of primary school fees has probably been the single most effective policy in increasing primary enrolment over the 15 years of the MDG era. There has been a growth of low-fee private schools over the past decade, which have been seen as offering a better quality of education than government schools at lower cost, including for the poor (Day Ashley et al., 2014). However, these schools keep their costs down primarily by paying teachers extremely low salaries, and while there is some evidence that these schools do reach poor households, they do not, in general, reach the very poorest. In rural Pakistan, for example, around 40% of the richest children enrolled in school are in private schools, compared with 10% of the poorest. Private schooling can also reinforce other forms of disadvantage, particularly where poor parents are forced to choose between which children to pay for: after controlling for other factors, the poorest girls in rural Pakistan are 31% less likely to attend private schools than the poorest boys (Alcott and Rose, 2015).
Where poor households pay private school fees it is likely to be at the expense of other basic needs such as food and health care. In a slum in Lagos, Nigeria, the costs of sending three children to a private school are equivalent to almost half the minimum wage in the city. In rural Uttar Pradesh in India, the poorest 40% of households would have to pay up to 30% of their total household income to send their children to private schools (Härmä, 2009).
There is debate on the appropriate policy towards private schools. Subsidies or voucher schemes may be used in an attempt to extend coverage to the poor, and voucher schemes have been implemented in Chile, Colombia and Pakistan for example. However, the available evidence is too thin as yet to yield many conclusions (Morgan et al., 2013). But whether it is channelled through direct government provision or a public finance-private delivery model, public finance for education is essential to reach children living in extreme poverty.
In health, compulsory public financing mechanisms that pool resources (in particular general taxation revenues and social health-insurance contributions) have been found to out-perform private voluntary financing mechanisms (user fees and voluntary private insurance) (WHO, 2010). This is particularly true if the objective of health care is to reach the poorest members of society. Wagstaff et al. (2014) show that the pro-poorness of government health expenditure has a significant and negative correlation with the share of government facility revenues coming from user fees.
Dupas (2011a) surveys the arguments around health-care pricing, including the potential for fees to fund higher quality services and the limiting of treatments to those who really need them, but observes that the price sensitivity of demand is extremely high, especially in poor and vulnerable populations. The necessity for public finance to replace private finance in reaching UHC has also been confirmed by the 2013 Lancet Commission (Lancet, 2013), a UN Health Thematic Report (SDSN, 2014) and Rottingen et al. (2014) for Chatham House. While the latter report sets out global targets for public health financing to achieve UHC, it makes no mention of any role in this for private financing.
Lack of UHC means higher levels of out-of-pocket spending on healthcare, which has been found to exacerbate poverty in LICs (Dupas, 2011b). The lack of UHC also increases the probability of experiencing a catastrophic health cost (defined as more than 40% of disposable income). In Thailand, the recent expansion of UHC was found to reduce exposure to medical expenditure risks by three-fifths, on average, generating a social welfare gain equivalent to 80-200% of the approximate net cost to society of financing the reform (Limwattananon et al., 2015). Low-cost services at the community level may be the best way to accelerate progress towards UHC, as demonstrated in Ethiopia (Crowe, 2013) and Rwanda (Nyandekwe et al., 2014).
3.6: Summary – how can international public finance support the achievement of the Sustainable Development Goals?
This chapter has shown that ‘getting to zero’ by 2030 will require policies to tackle chronic poverty, stop impoverishment and sustain escapes from poverty. While a range of policies is needed to achieve these goals, there are three policy areas in particular where IPF has a key role: social protection, education and universal health coverage. Social protection and education are critical for all three elements of the ‘zero poverty tripod’, while universal health coverage is critical to stop impoverishment. These policies can also help to reduce inequality and promote pro-poor growth, which are also likely to be key SDGs.
As poverty will be concentrated increasingly in fragile states until 2030, a fragile-states ‘lens’ is needed. In such contexts, efforts to promote the social sectors need to be supplemented by efforts to promote peace- and state-building. Goals such as legitimate politics, security, justice, economic foundations and revenues and services are also crucial.
Finance is necessary but not sufficient for progress in all three policy areas, and public financing is needed if the poorest and most marginalised are to be included in future progress.

Chapter 4: How much international public
finance is needed, and how should it be
allocated?

40 ODI Report
4.1: The volume of international public finance required To understand how much international public finance (IPF) is needed, it is first necessary to estimate the funding required to provide social transfers to those living below the poverty line and to meet the proposed Sustainable Development Goals (SDGs) on education and universal health coverage (UHC). This exercise is not intended to imply that every country should be spending these sums. Such policies are national level choices, and should be determined domestically. The point is merely to illustrate the scale of IPF that would be required if countries choose to eradicate extreme poverty via social-sector investments. Only a subset of sectors is covered here, so a wider exercise would be needed to identify the financial requirements for all of the other policies necessary for poverty reduction and wider economic development.
There are well-known challenges to estimating funding gaps for SDG areas. Costs are inter-related, with progress
that has been funded in some areas leading to progress in others. All costs will be impacted by economic growth, including the numbers of people living in poverty and those who are using public education and health services. A focus on costs can also give the misleading impression that all that is required to tackle extreme poverty is finance. In reality, as discussed already, finance is only part of the picture. Reforms are needed to make money effective, and the politics and organisational incentive problems that lie behind the persistence of poverty in the developing world must be confronted. Domestic and international policy environments are high on the Financing For Development agenda, and rightly so.
Climate change is another game changer. Fankhauser and Schmidt-Traub (2011) estimate that the external financing needed to achieve the MDGs is about 40% higher once the costs of climate change are factored in. Climate change means additional costs to meet the need for more development support (such as extra bed nets as malaria expands into new areas), provision of the same support but at higher costs (such as the need for more expensive infrastructure needs) and entirely new measures required (such as the building of adaptive capacity). The costings presented here do not factor in the additional costs of climate change, and this limitation should be borne in mind.
Despite these caveats, it is helpful to have ballpark figures for the cost of meeting core SDGs. It helps to identify the biggest challenges in raising sufficient resources and how these vary across countries. It can also help to inform decisions about how to allocate both domestic and international resources. Therefore, with all the caveats involved, this report provides some basic costings, drawing on new analysis and estimates developed by global expert bodies such as UNESCO. Although costs are estimated for low-income countries (LICs) and middle-income countries (MICs), this chapter shows that many MICs could meet these costs from their own domestic resources – the costings in this section are not, therefore, estimates of required IPF flows.
The estimates cover country-by-country costs of social transfers, universal quality primary and lower secondary education, and universal health coverage. Cash transfers are merely one form of social transfer, but are convenient for the purpose of estimating indicative social protection budgets.
One important limitation is that, for the sake of simplicity, a static annual cost estimate of a dynamic process is provided: achieving universal health, education and social protection would require a planned programme of expenditure over time that may include some front-loaded investments, and the scope and ambition of these
18 The average of the 2015 Education for All spending schedule for 2015-2030 was used (full enrolment is envisaged in 2030). The estimates for UHC are based on an annualised average for scaling up spending in low-income countries over a five-year period. Estimates for social transfers are based on the most recent available poverty data.
Key points
• The cost of providing social transfers at a scale consistent with the elimination of extreme poverty in low-income countries is $42 billion per annum.
• Funding universal quality primary and secondary education in low-income countries requires approximately $32 billion per annum.
• Universal health coverage in low-income countries will cost approximately $74 billion per annum.
• Providing social transfers, education and universal health coverage in low-income countries will require around $148 billion of domestic and international public finance per annum.
• The public financing gap across all developing countries is $84 billion per annum, after accounting for tax capacity and existing aid allocations.
• If donors delivered on their promise of committing 0.7% of GNI as official development assistance, there would be enough money to cover 100% of the costs of social transfers, education and health in low-income and lower-middle-income countries, with roughly $40 billion per annum to spare.

Financing the future 41
services will change as countries develop.18 The costs of achieving the proposed SDG of eradicating extreme poverty should fall as national economies grow and poverty falls.
The costings in this chapter cover most LICs and MICs, totalling 89 countries from Brazil to Somalia. Countries with a population of less than a million have been excluded. Unfortunately, this omits small-island states, many of which are extremely vulnerable to climate change and economic shocks. However, the lack of agreed purchasing power parity (PPP) exchange rates and information on tax capacity means that it is not feasible, methodologically, to cover this group, and their small size means that they would not have a substantial impact on the aggregate numbers. Many of these countries face severe development challenges, particularly in relation to climate change, and so their exclusion from the calculations does not imply that IPF providers can neglect them. Countries with very low levels of extreme poverty (less than 1%) have also been excluded.
The cost of providing transfers at a scale consistent with the elimination of extreme poverty in low-income countries is $42 billion per annumThis section presents an indicative budget estimate for a social transfer programme designed to lift the incomes of the poor above the $1.25 extreme poverty line, recognising that outcomes would rely on efficient programme design and implementation. To keep things simple, and also for
greater consistency with what is plausible in practice, the estimate is based on a flat transfer equal to the gap between $1.25 and the average income of the population living in extreme poverty, in each country.19 An allowance is then made for targeting errors and administrative costs. The analysis uses the latest available World Bank PovCal data, and approximate 2013 dollars, using the World Bank price-level ratio convertor for PPP dollars.20 Figure 11 (see page 43) shows the poverty headcount ratio and gap by country, with countries ranked from poor to rich, as measured by average GDP per person.
Administrative costs depend on the degree of targeting and conditionality, but tend to fall dramatically over time. For the sake of simplicity, an administration charge of 15% is assumed, which was the initial level of administration for the Bolsa Familia programme (Lindert, 2007). In practice such costs would be highly variable.
Another source of costs is the leakage rate – some of the money in any scheme will go to the non-poor, a phenomenon referred to as the inclusion error and defined as the number of non-poor that benefit as a proportion of the total number of beneficiaries. Inclusion errors can be very high. The Bolsa Familia rate in Brazil is 49% – in other words, almost half of the money goes to the non-poor. The rate in the PROGRESA programme in Mexico is slightly lower at 39%, but still high as a share of the total (Soares et al., 2010). In this report an inclusion rate of 43% is assumed, which is the average for the Brazilian and Mexican schemes. This suggests that in order to reach 100 poor households, a total of 175 households would need to be targeted, of which 75 – or 43% – would be non-poor.21
There are also errors of exclusion – of failing to reach the extreme poor. By definition, it is not possible to eliminate extreme poverty via transfers if there are exclusion errors, so they have not been incorporated into these estimates. As Chapter 3 showed, exclusion errors in lower-income countries can be very high and often reflect the small scale of existing social transfer programmes in such countries. This track record of high exclusion-error rates should temper expectations about the effectiveness of transfers in LICs.
Taken together – an extra 75% allowance for leakage and then an additional 15% for administration applied to all households – the estimates amount to twice the sum
19 This scheme would give ‘too much’ to those living near the poverty line, while failing to raise the very poorest above $1.25. But the intention is to estimate a reasonable budget, not to design a programme, and precise income targeting is not only infeasible, it could also provide negative incentives for labour effort.
20 Many of the poverty surveys are very out of date and the quality of the data is variable. All surveys rely on an out-of-date international PPP exchange rate to convert national poverty rates into internationally comparable $1.25/day rates. The World Bank has released significant revisions to the PPP exchange rates but has yet to release the revised poverty headcount and poverty gap figures. The latest PovCal data are still based on 2005 PPP, the price-level ratio convertor used is based on 2011 PPPs. Where data are missing, assumptions based on the nearest comparator countries are used.
21 In some countries this allowance for inclusion error is too great, because it would imply reaching more than 100% of the population. In Democratic Republic of Congo, for example, the poverty headcount ratio is 88%. In such countries, the cost of covering 100% of the population plus 15% for administration costs is used.
Box 7: Least developed countries
This report refers to least-developed countries (LDC), a group of countries considered to be highly disadvantaged, and which have particular salience in the context of UN negotiations, and low-income and middle-income countries, classifications that originate from the World Bank based purely on income. Most LDCs are also low-income countries. Income classifications are used in the costing exercises, but the term LDC is used in the context of recommendations for the UN financing for development process.
42 ODI Report
that would be needed if it were possible to costlessly target only (and precisely) those living on less than $1.25 per day.
Figure 12 (see page 44) shows the annual cost of providing cash transfers in each country, divided by the total population. The costs are a combination of the numbers living in extreme poverty and how poor they are, and administrative costs. The costs per person then depend on how the numbers living in extreme poverty compare to the total population. In Democratic Republic of Congo (DRC) the costs are very high – over $140 per person annually – as 88% of the country’s people live in extreme poverty, with average incomes far beneath $1.25. In contrast, the costs in India are just $17 annually per person.
In total, the annual cost of providing cash transfers to those living below the poverty line, taking account of administration costs and inclusion errors, is $42 billion in LICs, and $53 billion in MICs: a total cost of $95 billion (from all funding sources).
The cost of funding universal quality primary and secondary education in low-income countries is approximately $32 billion per annumThis report draws costing information from the recently-published Education for All (EFA) country-by-country estimates (UNESCO, 2015). They cover the costs for primary and lower secondary education in all LICs and lower-middle-income countries (LMICs). These estimates are based on a programme of spending designed to increase completion rates from current levels to 100% by 2030. They budget for an increase in the number of teachers per pupil, an increase in teacher salaries and a premium to attract marginalised children. Because the cost estimates for 2015 are based on current completion rates but the estimates for 2030 reflect population growth, these point estimates are based on the average for 2015-2030.Country-specific estimates cover all LICs and LMICs. A figure of 6% of GDP is used for upper-middle-income countries (UMICs), which is the target proposed by EFA. Figure 13 (see page 45) shows the per capita costs across countries.
The estimated costs of meeting the education SDGs are found to be $32 billion for LICs, $169 billion for in LMICs and $884 billion for UMICs: a total of $1,086 billion.
The cost of universal health coverage in low-income countries is approximately $74 billion per annumThe High Level Task Force on Innovative International Financing for Health has provided a global average estimate for the achievement of universal coverage of a broad package of health services that includes prevention (and some treatment) of non-communicable diseases and incorporates mental health services. This was estimated to require $54 per capita (using 2005 prices) (World Bank, 2009). In 2013, Chatham House updated this figure to today’s prices and revised the UHC financing requirement to $86 per capita for the poorer countries and 5% of GDP for richer countries (Rottingen et al., 2014).
This figure may be an underestimate if it is considered that the figure was calculated on the basis of achieving a universal package of services that would be provided at the primary care level, and that excludes the cost of expensive specialist tertiary-level services that may also require some level of funding. However, it may be an overestimate if the focus is on extending UHC in LDCs where lower-cost delivery mechanisms may be more appropriate. Richer people may also chose to use private services, as seen in Brazil and Thailand (Ranna-Eliya and Sikurajapathy, 2009). As the magnitude of these offsetting effects is not know, it has been assumed that the $86 figure is about right, as it is close to the costs required by countries such as Brazil and Thailand which have had success on UHC.
This estimate is also likely to be fairly robust in countries that need to cover vulnerable groups, such as people who live in remote rural communities, in conflict-affected areas or in areas where services have not reached ethnic minority groups. In these situations, rolling out a standard service model of hospitals and health centres, with fixed staffing norms and based on maximum travel times to health units, would result in higher costs. It may prove more effective, efficient and equitable to invest in different service models, such as community health workers.
The costs of achieving UHC on a country-by-country basis are shown in Figure 14 (see page 45).The overall costs per annum of achieving UHC are found to be $74 billion in LICs, $269 billion in LMICs and $737 billion in UMICs: a total cost of $1080 billion.
SomaliaMalawiBurundi
Central African RepublicCongo DRC
LiberiaNiger
MadagascarGuinea
EthiopiaEritrea
GambiaUganda
Guinea-BissauTogo
North KoreaMozambique
RwandaTanzania
Burkina FasoMali
Sierra LeoneAfghanistan
NepalBeninHaiti
ZimbabweBangladesh
KenyaCambodiaTajikistan
ChadMyanmar
MauritaniaSenegal
South SudanSudan
Kyrgyz RepublicCameroon
Yemen, Rep.Côte d’Ivoire
PakistanLao PDRZambiaLesotho
IndiaViet Nam
SyriaGhana
NicaraguaPapua New Guinea
HondurasBolivia
Congo, Rep.Nigeria
MoroccoSwaziland
EgyptSri Lanka
PhilippinesGuatemala
GeorgiaIndonesia
Timor-LesteEl Salvador
MongoliaArmeniaKosovo
ParaguayTunisiaAngolaAlgeria
EcuadorDominican Republic
IranNamibia
PeruChina
IraqTurkmenistan
South AfricaColombiaBotswana
Costa RicaGabon
PanamaTurkeyBrazil
Venezuela
0.0 0.2 0.4 0.6 0.8 1
%
Poverty headcount
Poverty gap
Figure 11: Extreme poverty: headcount ratio and gap
Source: World Bank (2014a).

43 ODI Report Financing the future 43
SomaliaMalawiBurundi
Central African RepublicCongo DRC
LiberiaNiger
MadagascarGuinea
EthiopiaEritrea
GambiaUganda
Guinea-BissauTogo
North KoreaMozambique
RwandaTanzania
Burkina FasoMali
Sierra LeoneAfghanistan
NepalBeninHaiti
ZimbabweBangladesh
KenyaCambodiaTajikistan
ChadMyanmar
MauritaniaSenegal
South SudanSudan
Kyrgyz RepublicCameroon
Yemen, Rep.Côte d’Ivoire
PakistanLao PDRZambiaLesotho
IndiaViet Nam
SyriaGhana
NicaraguaPapua New Guinea
HondurasBolivia
Congo, Rep.Nigeria
MoroccoSwaziland
EgyptSri Lanka
PhilippinesGuatemala
GeorgiaIndonesia
Timor-LesteEl Salvador
MongoliaArmeniaKosovo
ParaguayTunisiaAngolaAlgeria
EcuadorDominican Republic
IranNamibia
PeruChina
IraqTurkmenistan
South AfricaColombiaBotswana
Costa RicaGabon
PanamaTurkeyBrazil
Venezuela
0.0 0.2 0.4 0.6 0.8 1
%
Poverty headcount
Poverty gap
Figure 11: Extreme poverty: headcount ratio and gap
Source: World Bank (2014a).
43
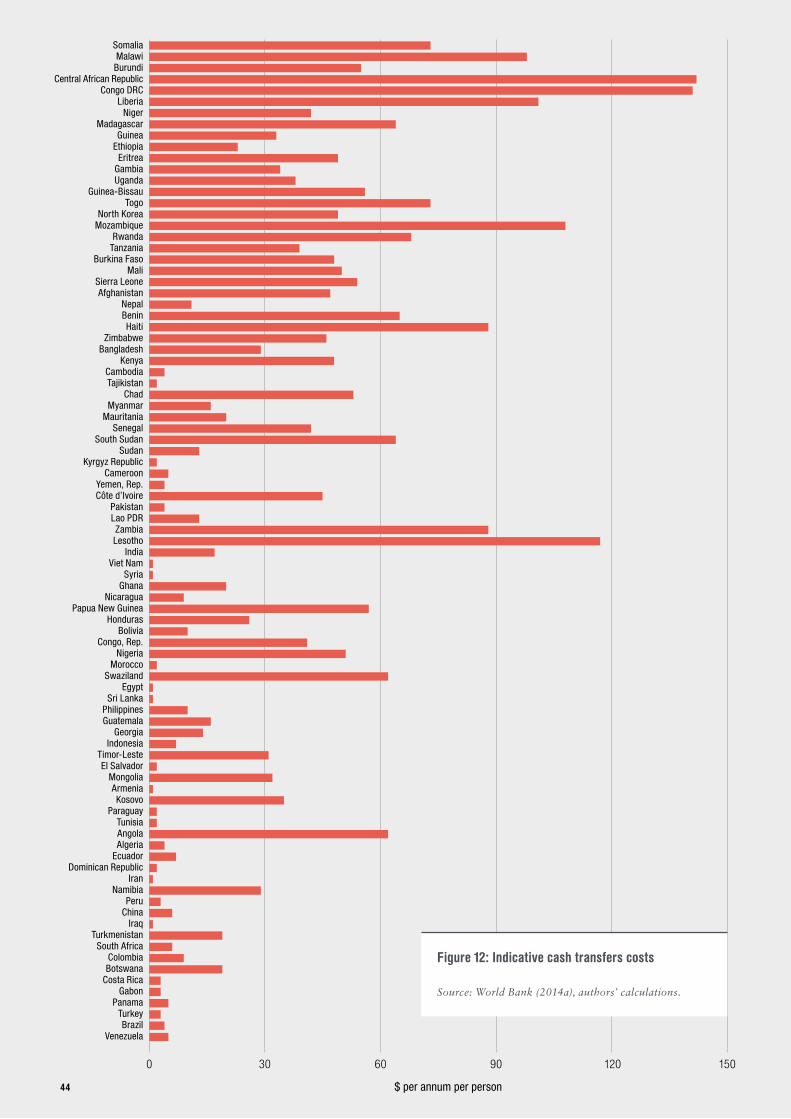
44 ODI Report Financing flagship 44
SomaliaMalawiBurundi
Central African RepublicCongo DRC
LiberiaNiger
MadagascarGuinea
EthiopiaEritrea
GambiaUganda
Guinea-BissauTogo
North KoreaMozambique
RwandaTanzania
Burkina FasoMali
Sierra LeoneAfghanistan
NepalBeninHaiti
ZimbabweBangladesh
KenyaCambodiaTajikistan
ChadMyanmar
MauritaniaSenegal
South SudanSudan
Kyrgyz RepublicCameroon
Yemen, Rep.Côte d’Ivoire
PakistanLao PDRZambiaLesotho
IndiaViet Nam
SyriaGhana
NicaraguaPapua New Guinea
HondurasBolivia
Congo, Rep.Nigeria
MoroccoSwaziland
EgyptSri Lanka
PhilippinesGuatemala
GeorgiaIndonesia
Timor-LesteEl Salvador
MongoliaArmeniaKosovo
ParaguayTunisiaAngolaAlgeria
EcuadorDominican Republic
IranNamibia
PeruChina
IraqTurkmenistan
South AfricaColombiaBotswana
Costa RicaGabon
PanamaTurkeyBrazil
Venezuela
0 30 60 90 120 150
$ per annum per person
Figure 12: Indicative cash transfers costs
Source: World Bank (2014a), authors’ calculations.
SomaliaMalawiBurundi
Central African RepublicCongo DRC
LiberiaNiger
MadagascarGuineaEthiopiaEritreaGambiaUganda
Guinea-BissauTogo
North KoreaMozambique
RwandaTanzania
Burkina FasoMali
Sierra LeoneAfghanistan
NepalBeninHaiti
ZimbabweBangladesh
KenyaCambodiaTajikistan
ChadMyanmar
MauritaniaSenegal
South SudanSudan
Kyrgyz RepublicCameroon
Republic of YemenCôte d’Ivoire
PakistanLao PDRZambiaLesotho
IndiaViet Nam
SyriaGhana
NicaraguaPapua New Guinea
HondurasBolivia
Congo, Rep.Nigeria
MoroccoSwaziland
EgyptSri Lanka
PhilippinesGuatemala
GeorgiaIndonesia
Timor-LesteEl SalvadorMongoliaArmeniaKosovo
ParaguayTunisiaAngolaAlgeriaEcuador
Dominican RepublicIran
NamibiaPeruChinaIraq
TurkmenistanSouth Africa
ColombiaBotswanaCosta Rica
GabonPanamaTurkeyBrazil
Venezuela
0 100 200 300 400 800
$ per annum per person
500 600 700
EFA estimated cost per person
6% of GDP per person
Figure 13: Costs of achieving education for all
800 700 600 500 400 0
$ per annum per person
300 200 100
Health cost per person
5% of GDP per person
Figure 14: Costs of achieving UHC
Source: UNESCO (2015). Source: World Bank (2014e), Rottingen et al (2014).
44

45 ODI Report
SomaliaMalawiBurundi
Central African RepublicCongo DRC
LiberiaNiger
MadagascarGuineaEthiopiaEritreaGambiaUganda
Guinea-BissauTogo
North KoreaMozambique
RwandaTanzania
Burkina FasoMali
Sierra LeoneAfghanistan
NepalBeninHaiti
ZimbabweBangladesh
KenyaCambodiaTajikistan
ChadMyanmar
MauritaniaSenegal
South SudanSudan
Kyrgyz RepublicCameroon
Republic of YemenCôte d’Ivoire
PakistanLao PDRZambiaLesotho
IndiaViet Nam
SyriaGhana
NicaraguaPapua New Guinea
HondurasBolivia
Congo, Rep.Nigeria
MoroccoSwaziland
EgyptSri Lanka
PhilippinesGuatemala
GeorgiaIndonesia
Timor-LesteEl SalvadorMongoliaArmeniaKosovo
ParaguayTunisiaAngolaAlgeriaEcuador
Dominican RepublicIran
NamibiaPeruChinaIraq
TurkmenistanSouth Africa
ColombiaBotswanaCosta Rica
GabonPanamaTurkeyBrazil
Venezuela
0 100 200 300 400 800
$ per annum per person
500 600 700
EFA estimated cost per person
6% of GDP per person
Figure 13: Costs of achieving education for all
800 700 600 500 400 0
$ per annum per person
300 200 100
Health cost per person
5% of GDP per person
Figure 14: Costs of achieving UHC
Source: UNESCO (2015). Source: World Bank (2014e), Rottingen et al (2014).
45

46 ODI Report Financing flagship 46
Somalia
Malawi
Burundi
Central African Republic
Congo DRC
Liberia
Niger
Madagascar
Guinea
Ethiopia
Eritrea
Gambia
Uganda
Guinea-Bissau
Togo
North Korea
Mozambique
Rwanda
Tanzania
Burkina Faso
Mali
Sierra Leone
Afghanistan
Nepal
Benin
Haiti
Zimbabwe
Bangladesh
Kenya
Cambodia
Tajikistan
Chad
Myanmar
Mauritania
Senegal
South Sudan
Sudan
Kyrgyz Republic
Cameroon
Yemen, Rep.
Côte d’Ivoire
Pakistan
Lao PDR
Zambia
Lesotho
India
Viet Nam
Syria
Ghana
Nicaragua
Papua New Guinea
Honduras
Bolivia
Congo, Rep.
Nigeria
Morocco
Swaziland
Egypt
Sri Lanka
Philippines
Guatemala
Georgia
Indonesia
Timor-Leste
El Salvador
Mongolia
Armenia
Kosovo
Paraguay
Tunisia
0 100 200 500
$ per annum per person
300 400
Figure 15: Indicative basic social compact costs
Poverty
Health
Education
Source: Authors calculations based on World Bank (2014a), UNESCO (2015), and Rottingen et al., (2014).
SomaliaMalawiBurundi
Central African RepublicCongo DRC
LiberiaNiger
MadagascarGuinea
EthiopiaEritrea
GambiaUganda
Guinea-BissauTogo
North KoreaMozambique
RwandaTanzania
Burkina FasoMali
Sierra LeoneAfghanistan
NepalBeninHaiti
ZimbabweBangladesh
KenyaCambodiaTajikistan
ChadMyanmar
MauritaniaSenegal
South SudanSudan
Kyrgyz RepublicCameroon
Yemen, Rep.Côte d’Ivoire
PakistanLao PDRZambiaLesotho
IndiaViet Nam
SyriaGhana
NicaraguaPapua New Guinea
HondurasBolivia
Congo, Rep.Nigeria
MoroccoSwaziland
EgyptSri Lanka
PhilippinesGuatemala
GeorgiaIndonesia
Timor-LesteEl Salvador
MongoliaArmeniaKosovo
ParaguayTunisiaAngolaAlgeria
EcuadorDominican Republic
IranNamibia
PeruChina
IraqTurkmenistan
South AfricaColombiaBotswana
Costa RicaGabon
PanamaTurkeyBrazil
Venezuela
0 500 1000 1500 2000 2500
$ per annum per person
LICs
Revenue capacity available (50%)
Aid available (50%)
Social compact cost
Figure 16: Available public finance and social compact costs
Source: Authors calculations based on World Bank (2014a), UNESCO (2015), Rottingen et al., (2014), Minh Le et al. (2012), and Fenochietto and Pessino (2013).
46

47 ODI Report Financing the future 47
SomaliaMalawiBurundi
Central African RepublicCongo DRC
LiberiaNiger
MadagascarGuinea
EthiopiaEritrea
GambiaUganda
Guinea-BissauTogo
North KoreaMozambique
RwandaTanzania
Burkina FasoMali
Sierra LeoneAfghanistan
NepalBeninHaiti
ZimbabweBangladesh
KenyaCambodiaTajikistan
ChadMyanmar
MauritaniaSenegal
South SudanSudan
Kyrgyz RepublicCameroon
Yemen, Rep.Côte d’Ivoire
PakistanLao PDRZambiaLesotho
IndiaViet Nam
SyriaGhana
NicaraguaPapua New Guinea
HondurasBolivia
Congo, Rep.Nigeria
MoroccoSwaziland
EgyptSri Lanka
PhilippinesGuatemala
GeorgiaIndonesia
Timor-LesteEl Salvador
MongoliaArmeniaKosovo
ParaguayTunisiaAngolaAlgeria
EcuadorDominican Republic
IranNamibia
PeruChina
IraqTurkmenistan
South AfricaColombiaBotswana
Costa RicaGabon
PanamaTurkeyBrazil
Venezuela
0 500 1000 1500 2000 2500
$ per annum per person
LICs
Revenue capacity available (50%)
Aid available (50%)
Social compact cost
Figure 16: Available public finance and social compact costs
Source: Authors calculations based on World Bank (2014a), UNESCO (2015), Rottingen et al., (2014), Minh Le et al. (2012), and Fenochietto and Pessino (2013).
47

48 ODI Report
Providing cash transfers, education and universal healthcare in low-income countries will require around $148 billion of domestic and international public finance per annum.
Table 2 shows the total costs of meeting the proposed SDGs on poverty, education and health for LICs and MICs. The total costs for each country are shown in Figure 15 (see page 46).
The public financing gap is $84 billion per annum This section compares the costs of achieving the proposed social-sector SDGs against the domestic resources available, to produce some estimates of how much support would need to come from IPF to eradicate income, education and health poverty. IPF is not, of course, the only way to fill the financing gaps. Governments can raise domestic revenue or change their current budget allocations; the international community could take action to address illicit financial flows; and there may also be more innovative ways to raise international revenue, such as global aviation or financial transaction taxes. If these forms of finance were mobilised it would reduce the requirement for IPF, but they are beyond the scope of this report.
The first step has been to estimate a maximum that governments could contribute from their own resources. This is not to say that targets should be set for government spending on particular sectors (although such targets do exist). Again, this is a question of national political decisions. However, any decision on IPF mobilisation and allocation should reflect a fair ‘burden sharing’ principle between IPF providers and recipients.
This analysis uses a model-based prediction of each country’s tax capacity, rather than their actual tax performance. Basing allocations on estimated capacity leaves countries with every incentive to increase their domestic tax efforts. The estimates of tax capacity combine two studies, Minh Le et al. (2012) from the World Bank and Fenochietto and Pessino (2013) from the IMF, which together provide estimates for 55 of the 89 countries that are covered in this exercise.22 Both studies estimate tax capacity on the basis of country characteristics such as income, the size of the agricultural sector and so forth. The World Bank uses a standard regression analysis that predicts taxation for an ‘average’ country with given characteristics; the IMF takes a ‘stochastic efficiency
frontier’, which amounts to estimating the best a country with given characteristics could achieve, after allowing for some random variation in the data. Here, these two approaches are combined by assuming in the IMF case that a country achieves roughly 80% of full capacity, or in the World Bank case that it does roughly 15% better than average. Where there are both IMF and Bank estimates, the average of the two is then taken.23
Then, the projected levels of IPF are considered. Ideally all forms of IPF would be considered, including ODA and non-ODA sources such as South-South Cooperation, using only the amount that actually reaches countries. In the case of ODA, this is known as country-programmable aid (CPA). Unfortunately, there are no comparable data on non-ODA flows available, although analysis by ODI suggests that in some countries, such flows amount to more than 20% of all development assistance24 (Schmaljohann and Prizzon, 2015). We therefore use CPA projections from the OECD Survey on Donors’ Forward Spending Plans, taking an average over 2013-2015. This is likely to underestimate total concessional flows from all sources.
Not all resources would be used to fund the social sectors. In OECD countries the average share of total government revenue that is spent on education, health and social welfare is just above 60% (OECD, 2013). For the purpose of these calculations, it is assumed that 50%
22 For countries with no available estimate of tax capacity, the sample mean is used. Again, small-island states and countries with extreme poverty rates below 1% are excluded.
23 This number was chosen because, based on the mean tax frontier, as a percentage of GDP (from the IMF study), and the mean predicted tax performance (from the World Bank study), adjusting the IMF down by 80% and the World Bank up by 15% gives the same number.
24 Note that this figure includes climate finance and contributions from Global Funds, even if they are counted as ODA.
Table 2: Total costs of meeting the Sustainable Development Goals on poverty, education and health
Goal Summary of costing estimate
Annual costs ($ billion)
Low-income countries
Middle-income countries (extreme poverty > 1%)
Poverty Average depth of poverty plus leakage and administration
42 53
Education EFA country estimate/6% GDP
32 1053
Health $86 (2012$) per capita/5% of GDP
74 1006
All three goals 148 2112

Financing the future 49
of government resources (tax plus CPA) is spent on these sectors, so the financing gap is the amount of additional funding that is required on top of that. Again, this report is not making any recommendation that this is the level that countries should be spending on these sectors, but basing IPF allocations on actual spending would reward low effort.25
Combining all of this with the costing estimates, it is possible to compare resources against needs in each country and come up with a financing requirement for IPF. Figure 16 (page 47) shows this for all countries, ranked by income per capita. Not surprisingly, most of the richer countries have sufficient resources to fund the achievement of the three SDGs. All the UMICs have sufficient resources, with just two exceptions: Dominican Republic and Turkmenistan. Similarly, most of the richer LMICs have sufficient resources: all those richer than Nicaragua with the exception of just Papua New Guinea and Guatemala. Among the poorer LMICs (with GDP per person of less than $1,500) the picture is more mixed.
By contrast, the shortfalls in the poorest LICs are very large – over $100 per person. The shortfall is most acute in the 15 very-low-income countries (VLICs), all of which are also LDCs, with GDP per person that amounts to less than half the LIC/MIC threshold of $1,046.
Table 3 summarises the calculations by income grouping. For MICs, the median amount of IPF per capita required is zero, because most countries are in surplus. However, some countries still require assistance, as is evident from the totals given in the right column.
4.2: Allocating international public finance to end extreme poverty The principle behind the efficient allocation of IPF for the SDGs is clear: allocations must be based on need, taking a long-run perspective of development impact that allows for capacity building. This is in contrast to basing allocations on the short-run marginal impact of IPF, taking absorptive capacity as fixed.
Adequate resources must be made available for those living in low-capacity and fragile states. Instead of influencing IPF volumes, assessments of a recipient’s performance (its capacity to use IPF effectively) should shape IPF delivery and guide decisions on modalities and investments in capacity building. This may not always be easy, but unless this happens, poverty cannot be eradicated.
Allocations that place a great weight on current performance are not consistent with the goal of eradicating extreme poverty everywhere, because they neglect countries that currently score badly on performance metrics. Eradicating poverty implies a focus on the harder to reach, which may, in turn, require operating in places where the links between finance and outcomes are weaker, and where results may only emerge over the long run.
This section assesses the existing allocation of IPF against need, using income poverty as a proxy for need. It first suggests that the development community changes the way it thinks about aid allocation, then discusses absorption constraints.
How to think about IPF allocation The objective of IPF is to help people, so simply getting into the habit of looking at statistics on IPF per person would be an improvement on the current practice of looking at how much groups of countries receive,
25 So the financing gap is calculated as: estimated costs minus 50% of existing resources. If one assumes that only 50% of total resources will ever be spent on the social sectors, that would amount to assuming that $2 of IPF is needed to close every $1 of the gap that is calculated.
* Assuming 50% of aid and tax capacity required for other government functions
Shortfalls in the poorest LICs are very large – over $100 per person.
Table 3: Additional public finance required to fund education, health and poverty reduction goals*
Income grouping Additional public finance required *
Average (median) amount ($ per person per annum)
Total amount ($ billion per annum)
Very low-income country (less than $525) 119 39
Other low-income country ($525-$1,045) 71 34
Lower-middle-income country ($1,046-4,125) Surplus (most countries have sufficient resources)
10
Upper-middle-income country ($4,126-$12,745) Surplus (most countries have sufficient resources)
1
Total 84
50 ODI Report
categorised by income. Looking at the amount of IPF for every person living in extreme poverty would also be helpful.
Highly concessional finance (in the form of grants) is best suited to the task of eradicating poverty by delivering social protection, health and education. Data on the allocation of grant flows from emerging donors are hard to find, so the analysis here is confined to the allocation of ODA, but the points apply more generally.
The simplest method of comparing ODA with need is to compare aid allocations against a poverty headcount, beneath a given poverty line. The cost of this simplicity is that the picture becomes very sensitive to the choice of poverty line. There is also the problem that a large number of people live close to the existing $1.25 per day line for extreme income poverty, in PPP terms, and the estimated headcounts can swing wildly as new pricing data affect PPP calculations.26
The current tendency to analyse allocations according to the share of ODA received by countries, grouped by income classification, takes no account of the populations of these groupings, which may change dramatically as countries graduate (or slip) through the income rankings.27 As it happens, the most populous developing countries have middle-income status.
Aid per personFigure 17 shows the median level of aid per person within four categories of country: VLCs, other LICs, LMICs and UMICs.28 If LICs were treated as a single group, the pattern would look reasonably pro-poor, but the disaggregation reveals that the very poorest countries receive less assistance, relative to their population size, than countries that are better off. This pattern might be justified on the grounds of efficiency, if the very poorest countries are also the least able to use aid effectively, but is hard to reconcile with the goal of ending extreme poverty for everyone, everywhere.
Aid per person living in extreme povertyThe picture looks even worse when recast in terms of aid per person living in extreme poverty (Figure 18). The headcount of people living on less than $1.25 per day is
used. Donors may validly target those with higher incomes, and if a higher poverty line were to be used the picture would shift back toward the per person distribution in Figure 17. However, extreme poverty is the centrepiece of the SDG agenda, and Figure 18 shows just how badly the existing allocation of aid is aligned with that objective.
Aid allocation for poverty eradication Cost estimates have been presented for the delivery of three policy areas that are critical for the elimination of extreme poverty – social protection (using a cash transfer as proxy), the provision of primary and secondary education and UHC – and compared with potential government tax capacity and existing CPA resources. In this section, indicative scenarios that outline how IPF would need to be allocated to support these areas are provided. This is not to suggest that these sums are spent on the social sectors under current resource constraints: again, spending decisions are political and must reflect a much broader set of development priorities. In some countries, under existing resource constraints, it may make sense to focus on providing the most basic health services in a satisfactory fashion or on improving learning outcomes at the primary level before attempting universal coverage of quality secondary education. In these cases the cost estimates presented here may well represent an excess of ambition. Nevertheless, it is useful to ask how IPF should be (re)allocated if the intention were to finance these three key policy areas.
The current situation and two scenarios are presented in Figure 19, based on reallocating existing IPF resources to those countries that have the largest gap between financing and need, even if they were to collect revenues in line with their own tax capacity. For the sake of simple presentation, countries are divided into four income groupings, but income status plays no role in the underlying allocations. Any surplus CPA – the proxy for concessional IPF – is reallocated away from countries that currently have resources in excess of the level of the simple costing, leaving humanitarian aid unchanged. In those MICs that have a shortfall against financing needs, CPA is left unchanged.
26 At time of writing, prices from the new 2011 ICP survey were still being processed by the World Bank, and their publication in October 2015 is expected to make a big difference to reported poverty numbers. Ideally, weighted aid per capita numbers would be used, where the weight is based on how far an individual is beneath an international poverty line, such as $13 per day. This would account for the full distribution of poverty in a country and be less sensitive to changes around the extreme poverty threshold.
27 For example, the UK’s Statistics in Development reports net ODA with no adjustment for population, and the conclusion of the House of Commons International Development Select Committee that too much EU aid is given to MICs is based on the same approach. Qian (2014) concludes that ‘foreign aid to very poor countries accounts for very little of total global aid’, yet later notes that the poorest quintile of countries receive around four times more aid per person than other countries.
28 All data are averages of projected CPA for the period 2013 to 2015. CPA excludes humanitarian aid, which is added back in merely to demonstrate that this does not change the picture significantly. The VLIC category captures the lower half of LICs by income (roughly those with income per capita below $525).

Financing the future 51
Figure 17: Aid per person (median)
Very-low-income country
Upper-middle- income country
CPA per person
Humanitarian aid per person
Other low-income country
Lower-middle-income country
0 10 20 30 40 50 60 70
$ per annum per person
Sources: Authors’ calculations based on OECD (2014d) and World Bank (2014e).
Figure 18: Aid per person living in extreme poverty
Very-low-income country
Upper-middle-income country
CPA per person living in extreme poverty
Humanitarian aid per person living in extreme poverty
Other low-income country
Lower-middle-income country
0 50 100 150 200 250 300 350
$ per annum per person living in extreme poverty
Sources: Authors’ calculations based on OECD (2014d) and World Bank (2014e).

52 ODI Report
In the first scenario, all CPA that has been withdrawn from MICs is reallocated to the VLICs. This allows 90% of their costs to be covered. In the second scenario, funds are spread across all LICs, enabling 75% of the costs to be met in all of them, on average.29
It is important to emphasise here that these scenarios cover the allocation of grants, and involve reallocation from MICs to LICs.30 Any shift of concessional IPF away from MICs towards LICs should be accompanied by a large increase in the availability of less-concessional IPF for MICs (see Kharas et al., 2014).
As emphasised above, countries have other development priorities than the social sectors, and even if desirable on development grounds these scenarios are not politically plausible. Donors want to retain influence in MICs and many donors (and recipients) think that an exclusive focus on extreme poverty is inappropriate. But it is worth confronting the disparity between the current best offer being proposed (committing 50% of ODA to LDCs) and an allocation that is serious about delivering crucial development goals in the poorest countries.
Both of these scenarios require a major increase in the share of ODA going to LDCs and, within the category of LDC, a major increase in the share going to the VLICs. Existing projections show that, on average, 40% of CPA will be allocated to LDCs over the next three years (OECD, 2014c). Both of these scenarios require that proportion to increase to around 80%.31 Within the LDC category, 28%
currently goes to VLICs – the first scenario would see that rise to 62%; the second to 45%.
If Development Assistance Committee (DAC) donors were to fulfil their promise of giving 0.7% of GNI as ODA, there would be enough money to cover 100% of the costs of cash transfers, education and health in LICs and LMICs, with roughly $40 billion per annum to spare.
If donors delivered on their 0.7% promise
The fact that donors have not met their aid targets only makes the trade-offs involved in allocation decisions harder.
Figure 20 shows what could be achieved if donors made good on their commitments. Existing allocations are left unchanged, and the extra funds implied by hitting the 0.7% target are used to fill financing gaps. The $40 billion remaining after that is distributed evenly across all countries on a per capita basis (shown by the charcoal portion of each bar).
An allocation of IPF that is consistent with the goal of eradicating poverty via investments in the social sectors
29 Here, the percentage of costs the country could afford to cover after reallocation is given, if they spent 100% of the reallocated CPA on the social sectors.
30 Under the new definition of ODA that will record only the grant equivalent of a concessional loan, not its face value, the allocation of grants will amount to the allocation ODA. At present, ODA includes loans at face value.
31 There is a slight disconnect between OECD data and these scenarios because the costings were computed after excluding small-island states and countries with less than 1% extreme poverty. The 80% figure is an estimate of the share to LDCs amongst all countries, adjusting for that.
Figure 19: Reallocation scenarios under existing ODA budgets
0VLICs OLICs LMICs
10
20
30
40
Current aid allocation
From MICs to VLICs
From MICs to LICs
$ bi
llion
per a
nnum
50
UMICs
Source: authors calculations, OECD (2014b), World Bank (2014e).
VLICs: very-low-income countryOLICs: other low-income countryLMICs: lower-middle-income countryUMICs: upper-middle-income country

Financing the future 53
would be far more feasible (and desirable) if donors delivered on their 0.7% promise. However, even this allocation would not provide much more financing for other development priorities in LICs, over and above the 50% of existing resources that was assumed to be allocated outside the social sectors when computing the financing gaps. Therefore, even if the promise of 0.7% from DAC donors was kept, there would still be a case for either more pro-poor allocations or even higher ODA flows. There is also a strong case for more concessional IPF from non-DAC donors.
Absorption constraints Any claim that poor countries receive too little aid is also an implicit claim that absorption constraints are not binding.32 The standard approach by economists to pinpointing aid absorption is based on estimated turning points in the relationship between aid and economic growth, from a statistical analysis (Carter, 2014). These estimates suggest that after a certain level – often around 15-20% of GDP – increases in aid have no impact on growth (and may even start to have a negative impact). On that basis, a reasonably large number of poor countries are already receiving aid at levels close to the point where any further aid would be ineffective, although this concern has waned in recent years as growth has generally caused aid/GDP ratios to fall (Feeney and de Silva, 2012).
This approach is not terribly helpful. A non-linearity in the short-run aid-output relationship does not tell us much about how the effectiveness of aid for other purposes changes as aid volumes rise. The key question is the presence of diminishing returns. Unless aid becomes less effective, or even harmful, at higher volumes, there is no reason not to scale up aid in poor countries. There are arguments that might suggest that diminishing returns are not confined to the aid-growth relationship – for example, quality may suffer as the pace of expansion in health and education systems rises. But there may also be economies of scale. The relationship between aid and growth is likely to be a poor guide to how quickly inefficiencies increase as the scale of the social sectors expands. In the case of social transfers, in particular, there is no obvious reason to suppose that efficiency falls with volume over any relevant range.33
Absorptive capacity is, to some extent, an issue to be managed by donors by making the appropriate investments in human resources. Of course, it is not possible to quadruple aid to a very poor country and deliver good quality universal health and education overnight, but it might be possible to scale up aid over the medium term, sensibly sequenced, without seeing efficiency fall as aid volumes rise. Evidence on the effectiveness of attempts to build capacity in fragile states is patchy, and does not assume that it is always possible. But it would be a greater error to allocate IPF without adding capacity building to
32 Here ‘absorption’ refers to the broad notion of being able to use aid effectively. In the technical literature, aid absorption refers to the process of turning aid flows into an increase in net imports.
33 There are also macroeconomics challenges around price stability, real exchange-rate appreciation and Dutch Disease. These problems are there to be managed to an extent, particularly through ‘aid for trade’ in the case of Dutch Disease (Adam and Bevan, 2006).
Figure 20: Allocations if donors fulfilled their 0.7% promise
0 10 20 30 40 50 60 70
CPA ($ billions)
Current
Gap
Surplus
Very-low- income country
Upper-middle- income country
Other low-income country
Lower-middle-income country
80
Source: authors calculations, OECD (2014b), World Bank (2014e).

54 ODI Report
the equation. To borrow a phrase from Collier (2011), achieving the SDGs will require ‘investment in investing’.
4.3: Summary – recommendations on the volume and allocation of international public finance
Recommendation: an additional $84 billion of international public finance is needed each year to support cash transfers, education and health
IPF providers should support national governments in ensuring that, where countries have an interest in scaling-up social protection (proxied here by cash transfers), universal primary and secondary education and universal health coverage, they have sufficient funding to do so. If all countries chose to implement these policies, the additional IPF requirement would be $84 billion per annum, with $73 billion of this required in LICs. This would be much more feasible if DAC donors were to meet their 0.7% target, otherwise there will need to be a politically unpalatable reallocation.
Recommendation: targets are needed for development finance from emerging donorsThe analysis shows the clear need for higher volumes of IPF. Knowledge transfers emerging from South-South cooperation are also likely to be important. Non-DAC donors will be an increasingly important source of IPF in the future, and the international aid architecture should do everything possible to encourage their contributions. Some (Sachs and Schmidt-Traub, 2014) have suggested that UMICs should prepare to become donors and commit 0.1% of their GNI to development aid.
Such commitments may be politically challenging, given emerging donors’ well-known aversion to an aid paradigm and a preference for mutual cooperation. Reporting on ODA is managed at present by the DAC, a forum that is not well suited to emerging donors. However, if non-DAC donors were to commit more of their existing IPF to the SDG financing agenda it would certainly generate political momentum for the SDGs themselves. This may be best achieved by starting with targets that are similar to current IPF allocations from this group of donors. An organisation with global legitimacy will need to replace the DAC as the locus of reporting and coordination for development finance, and the Finance
for Development negotiations represent a good opportunity to set that process in motion.
Recommendation: 50% of ODA should be allocated to least-developed countries The scenario analysis has suggested that if IPF were to be allocated to fund a basic social compact in countries that lack domestic resources, it would need to be far more pro-poor. In reality, countries have other development priorities, the costs of which may be distributed in different ways. What is clear is that current aid allocations are far from being pro-poor. This report endorses the target that has been proposed by civil society organisations and the OECD that 50% of all concessional IPF should be spent in LDCs but it also recognises that this does not go far enough, and that it is not a substitute for increasing total IPF volumes. It would be a commitment worth securing nonetheless.
Ideally, targets would relate to the gap between recipient needs and existing resources, rather than to shares of donor budgets. But donors can only target the metrics that they control, in the absence of effective coordination.
Recommendation: leave no fragile state behind The Finance for Development agreement should include a commitment to leave no fragile state behind and adopt the New Deal Peacebuilding and Statebuilding Goals. The problem with such a formulation is that nobody is responsible for its delivery. Therefore, this commitment should be adopted by the big multilaterals (European Union, International Monetary Fund, the World Bank) and regional multilateral development banks which are increasingly active in fragile states, on the basis that where the multilaterals lead, bilaterals will follow.
Photograph: Asian Development Bank: Water station in Afghanistan.

Chapter 5: Effective delivery
of international public finance for the achievement
of the Sustainable Development Goals

56 ODI Report
5.1: Making international public finance more effective While some middle-income countries (MICs) could cover the cost of the poverty Sustainable Development Goals (SDGs) themselves, almost all low-income countries (LICs), and some lower-middle-income countries (LMICs), will require international public finance to fill the gaps. This chapter considers how to ensure that international public finance (IPF) is delivered appropriately to make the maximum possible contribution to that goal, and to ensure that the architecture for IPF is fit-for-purpose.
IPF is not just official development assistance (ODA). However, funding for the social sectors in LICs should be highly concessional, and so the principal focus here is ODA and ODA-equivalent flows from non-OECD Development Assistance Committee (DAC) providers. A key role for IPF is simply providing a resource transfer, but it can also play a broader role, including policy advice and technical assistance. This chapter considers both roles for IPF.
Chapter 2 noted that, between now and 2030, poverty will be concentrated increasingly in fragile and conflict-affected states. The vast majority of countries with a large financing gap to meet these SDGs, identified in Chapter 4, are also fragile. Effective IPF for a new era will need to be fit-for-purpose in such contexts, as well as in stable LICs and LMICs. IPF for all purposes must contribute
to, not undermine, progress towards Peacebuilding and Statebuilding goals.
There are many different IPF providers, with different objectives and approaches. Nevertheless, this chapter attempts to draw out some broad messages about effective IPF in the SDG era; the extent to which current practice diverges from that ideal; and what needs to change.
Ownership and alignment remain critical in an SDG era, including in fragile statesIn principle, domestic public financing is the first and best option for the funding of social protection, education and universal health coverage. One well-established argument from political economy suggests that governments are more accountable to their citizens, and will, therefore, deliver a higher quality of services, the more they rely on tax revenues (Brautigam et al., 2008). Evidence from Brazil confirms this hypothesis, where Gadenne (2012) exploits a natural experiment to show that an increase in local government tax revenues leads to a greater increase in health and education spending than transfers from central government. Where governments cannot fully fund these areas domestically, IPF needs to be provided in ways that:
• build government capacity to fund and run services over the longer term
• emulates domestic resources to the maximum extent that is appropriate
• helps to support domestic resource mobilisation, and • ensures that IPF does not substitute for domestic tax efforts.
The centrality of ownership – defined as ‘developing countries setting their own strategies for poverty reduction, improving their institutions, and tackling corruption’ (OECD, 2005) – was recognised a decade ago by the Paris Declaration on Aid Effectiveness, and subsequent declarations in Accra in 2008 and Busan in 2011. The evidence is overwhelming that strong government ownership is a prerequisite for effective IPF. Box 8, for example, shows that social protection schemes that lack government ownership tend to be unsustainable and are often phased out once external assistance ends.
Ownership, however, means more than handing over control to government – if it was only about that, then all aid should be in the form of unconditional budget support. From the IPF provider’s perspective, ownership can mean finding the right partners within governments, helping them overcome barriers to development and identifying opportunities for change, as well as such issues as working through government systems. Faustino and Booth (2014) and Wild et al. (2015) explore these ideas in more detail.
Ownership in fragile states is just as important, as the New Deal for Fragile States has recognised. IPF that fails to respect ownership by avoiding government institutions can actually exacerbate fragility in the long run. This can occur if IPF undermines the development of state institutions
Key points
• Ownership, alignment and harmonisation remain critical in an SDG era, including in fragile states.
• There is, however, a need for more ‘politically smart’ approaches to IPF delivery.
• IPF providers need to work more flexibly (using ‘adaptive programming’ approaches), do better at sharing risk, and act quickly but think long term.
• There needs to be less long-term reliance on short-term humanitarian channels.
• The aid architecture needs to be improved, and there is a strong case for more multilateralism.
• It is time to create a ‘Bolsa Familia Global’ – a multilateral mechanism to support LDCs seeking to establish a ‘social floor’, providing people with security and creating the conditions for more inclusive societies and a fairer pattern of globalisation.
• The mandate of the Global Fund to fight AIDS, Tuberculosis and Malaria needs to be broadened, so that it becomes a Global Fund for Health.
• It is also time to create a Humanitarian Fund for Education in Emergenices.

Financing the future 57
by failing to make the long-term investments that are required for institutional development to take root, and if it shifts government accountability from citizens to donors (OECD, 2014b). As the OECD (2008) notes, ‘the long-term goal of achieving sustainable capacity and accountability, country-wide, means working with a national government. Engagement with the State is not so much a question of either/or but rather degree. Even in deteriorating situations, donors should seek some form of state involvement.’
Alignment, with donor countries aligning behind country objectives and using local systems, also remains critical. As Putzel (2010) shows, off-budget aid can lead to rivalries and impede political processes by shifting decision-making from the state to donor-dominated project implementation units. Focal points for lobbying and potential sources of patronage that are outside the state can have a significant
impact on its legitimacy. Experience in Afghanistan, the fragile state that received the largest single share of ODA in 2011, shows that large amounts of IPF that chased short-term results through parallel systems led to considerable waste and a high proportion of funds going to firms based outside the country (McKechnie and Manuel, forthcoming).
A proliferation of donor projects outside government tends to poach skilled staff from government and divert the time of those who remain. Because project aid is essentially free and local officials may be excluded from the planning and allocation processes, they may see projects as a set of private goods to be allocated (Moss et al., 2006). ‘At times, donors have hindered the creation of effective public sectors because they saw end runs around local institutions as the easiest way to achieve project success’ (Dollar and Pritchett, 1998:84).
Some evidence has suggested that ‘localising aid’ – defined as ‘channelling aid to recipient-country entities’ – has been associated with improvements in state capacity, and is likely to have contributed to the strengthening of systems in most development contexts, although the findings have not been conclusive (Glennie and Rabinowitz, 2013).
Social protection schemes that lack government ownership tend to be unsustainable and are often phased out once external assistance ends.
Box 8: The importance of government ownership for effective social protection programmes
Although social protection programmes tend to be funded from taxation, they are often part-funded by IPF, and that is likely to continue under the proposals made in this report. IPF can be an effective form of financing, and programmes that are launched with strong or complete reliance on IPF can be continued over time, but only if there is strong national ownership of the programme concerned. The evidence on the extent to which this happens at present is mixed. Key determinants of success appear to be:
• whether programmes were established within or outside existing public institutions • the extent to which national governments and public service providers were involved in programme
management and delivery • the perceptions of the public and the governments about programme ownership and legitimacy • the existence of co-financing agreements between governments and IPF providers • long-term financing commitments, as it can take time for such programmes to be effective, and countries need
assurance that funding will be available in the future (Barrientos, 2007).
In Nicaragua, the IPF-funded social-protection system was set up as a parallel programme to existing national programmes and was seen, very largely, as donor driven. Despite impressive results, attempts to integrate this programme into the national system met with resistance (Bastagli, 2010). A similar finding was observed in Malawi, where the cash-transfer pilot remained externally funded with no domestic finance being allocated to the programme, which suggested that the project was not a national priority (McCord, 2010).
There are also positive examples of schemes that have had strong government ownership alongside long-term donor commitments, where programmes funded externally have expanded and become part of integrated social protection systems, at least on paper. The Katete social pensions and Kalomo pilots in Zambia, implemented from 2004 to 2007, were funded by CARE International and the UK Department for International Development (DFID), which made a medium-term financing commitment, with guaranteed funding for ten years. This, in turn, stimulated the Government to contribute domestic funding. The Government set up a medium-term financing plan, with its own contributions increasing incrementally until the programme was, very largely, nationally funded by the end of the financing period (McCord, 2010). The Social Cash Transfer Scheme was scaled up from 19 to 50 districts, and the Government increased its contribution to the scheme by 700% in 2014 (KPMG, 2014). A similar example occurred in Nigeria: the COPE conditional cash transfer programme started as a pilot in 2007, funded through debt relief. In 2010, the state governments took over the programme, which was then co-funded by the federal and state governments (Hagen-Zanker and Holmes, 2012).

58 ODI Report
The track record of budget support – one of the key instruments designed to support alignment – is mixed. It has been associated with increased spending on development and in specific poverty related sectors, including health and education (Pretorius, 2014). It has also supported greater efficiency in the use of public resources by facilitating improvements in the planning and budgeting cycle, financial management and accountability, although progress has been uneven (Williamson and Dom, 2010). Both general and sector budget support have helped to expand access to social services, but the quality and equity of services have not been effectively addressed (Williamson and Dom, 2010). This is the result, in part, of a lack of consideration of political and governance constraints.
The mixed record of specific instruments to support alignment does not mean that the overall approach is not valid, however. Even when IPF providers do not use country systems directly, they still need to align their activities to country needs and priorities. Where country systems are too weak to work through, IPF providers should use capacity substitution, whereby the government procures expertise from international consultants so that development programmes can still be designed and implemented within the government organisation in the short term, while efforts are made to build capacity in the long term. Where NGOs and others outside government are used to deliver services, it is still important to ensure that they cooperate with, and align themselves to, the government’s priorities (Manuel et al., 2012).
Harmonisation and speed are also critical One of the principles of the Paris Declaration is harmonisation, with donors urged to coordinate, to simplify procedures and share information to avoid duplication. This principle remains important, and all the more so in fragile states. With limited state capacity, the coordination of IPF providers is critical to ensure that governments do not spend scarce time and resources in managing donors, rather than running their own projects. In the health sector, for example, IPF remains fragmented, involving multiple flows of funds, often supporting vertical projects to tackle specific diseases. A lack of coordination between partners and governments has resulted in considerable inefficiency and inequity between and within country-level health systems.
There is some evidence that more harmonised approaches to aid have been associated with better outcomes. In Uganda, the Government managed to increase water coverage by 50% between 1990 and 2008,34 a period that saw a shift from 100% project aid to 40% sector budget support or basket funding. The shift meant that donor agencies better aligned their operations with
national government priorities and this was found to be one of the factors leading to a strong increase in the population reached by improved water sources (Rabinowitz and Prizzon, 2015). In Liberia, the Health Sector Pooled Fund has been associated with better outcomes in terms of under-five mortality and malaria (see Box 9).
Speed was not included as a principle in the Paris, Accra or Busan agendas, but is now seen as an important attribute of IPF and one of the key priorities for the ‘terms and conditions’ of development assistance identified by partner countries (Schmaljohann and Prizzon, 2015). Speed is seen as particularly important in fragile states, given the requirement to generate rapid confidence-building (World Bank, 2011).
34 From an estimated 39% in 1990 to 64% in 2008.
Box 9: The Liberia Health Sector Pooled Fund
The Liberia Health Sector Pooled Fund is a $40 million fund supported by the UK Department for International Development, Irish Aid, UNICEF and the UN High Commissioner for Refugees. It relies on national systems and procedures for planning, financial management and procurement. Where specific bottlenecks have arisen, the Fund has been used to increase institutional capacity to enable effective budget execution of its own funds and other sources of funds, including those from the Government.
All proposals for the use of the Fund originate with the Ministry of Health and Social Welfare (MOHSW), and have been used to expand basic health services, as well as infrastructure, human resources and support systems.
Although the Fund represents a comparatively small proportion of total donor support, it has improved the institutional capacity of the MOHSW, especially in the areas of financial management and the coordination of donor funding, and has increased the stewardship of the MOHSW in the delivery of health services.
Use of the Fund has contributed to the expansion of a network of public health facilities by 24% and an increase in the percentage of facilities that provide the MOHSW’s Basic Package of Health Services (BPHS) from 36% in 2008 to 82% by the end of 2010. While causality cannot be established, given data limitations, the increased overall accessibility to the BPHS took place in the context of a major decline in malaria prevalence in children from 66% in 2005 to 32% in 2009 and a 50% decline in under-five mortality from wartime estimates. As the Ebola outbreak demonstrates, however, there is still much to be done to strengthen Liberia’s health system.
Source: Hughes et al., (2012).
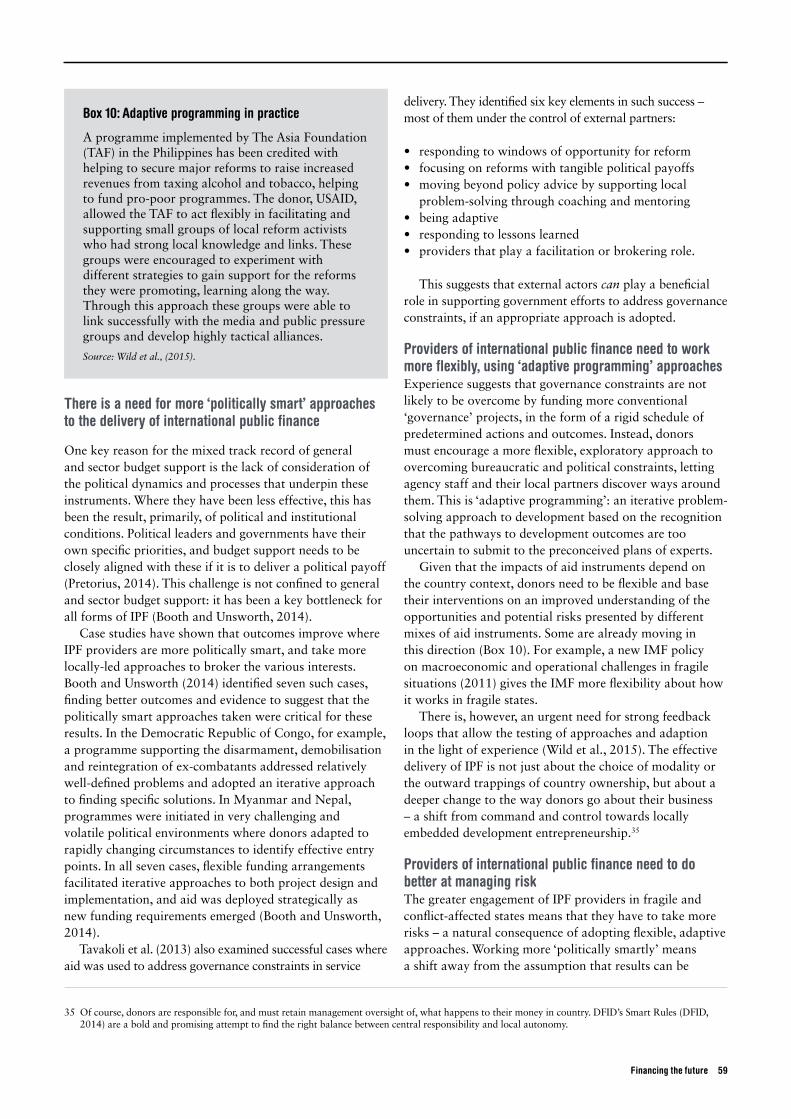
Financing the future 59
There is a need for more ‘politically smart’ approaches to the delivery of international public finance
One key reason for the mixed track record of general and sector budget support is the lack of consideration of the political dynamics and processes that underpin these instruments. Where they have been less effective, this has been the result, primarily, of political and institutional conditions. Political leaders and governments have their own specific priorities, and budget support needs to be closely aligned with these if it is to deliver a political payoff (Pretorius, 2014). This challenge is not confined to general and sector budget support: it has been a key bottleneck for all forms of IPF (Booth and Unsworth, 2014).
Case studies have shown that outcomes improve where IPF providers are more politically smart, and take more locally-led approaches to broker the various interests. Booth and Unsworth (2014) identified seven such cases, finding better outcomes and evidence to suggest that the politically smart approaches taken were critical for these results. In the Democratic Republic of Congo, for example, a programme supporting the disarmament, demobilisation and reintegration of ex-combatants addressed relatively well-defined problems and adopted an iterative approach to finding specific solutions. In Myanmar and Nepal, programmes were initiated in very challenging and volatile political environments where donors adapted to rapidly changing circumstances to identify effective entry points. In all seven cases, flexible funding arrangements facilitated iterative approaches to both project design and implementation, and aid was deployed strategically as new funding requirements emerged (Booth and Unsworth, 2014).
Tavakoli et al. (2013) also examined successful cases where aid was used to address governance constraints in service
delivery. They identified six key elements in such success – most of them under the control of external partners:
• responding to windows of opportunity for reform • focusing on reforms with tangible political payoffs • moving beyond policy advice by supporting local
problem-solving through coaching and mentoring • being adaptive • responding to lessons learned • providers that play a facilitation or brokering role.
This suggests that external actors can play a beneficial role in supporting government efforts to address governance constraints, if an appropriate approach is adopted.
Providers of international public finance need to work more flexibly, using ‘adaptive programming’ approaches Experience suggests that governance constraints are not likely to be overcome by funding more conventional ‘governance’ projects, in the form of a rigid schedule of predetermined actions and outcomes. Instead, donors must encourage a more flexible, exploratory approach to overcoming bureaucratic and political constraints, letting agency staff and their local partners discover ways around them. This is ‘adaptive programming’: an iterative problem-solving approach to development based on the recognition that the pathways to development outcomes are too uncertain to submit to the preconceived plans of experts.
Given that the impacts of aid instruments depend on the country context, donors need to be flexible and base their interventions on an improved understanding of the opportunities and potential risks presented by different mixes of aid instruments. Some are already moving in this direction (Box 10). For example, a new IMF policy on macroeconomic and operational challenges in fragile situations (2011) gives the IMF more flexibility about how it works in fragile states.
There is, however, an urgent need for strong feedback loops that allow the testing of approaches and adaption in the light of experience (Wild et al., 2015). The effective delivery of IPF is not just about the choice of modality or the outward trappings of country ownership, but about a deeper change to the way donors go about their business – a shift from command and control towards locally embedded development entrepreneurship.35
Providers of international public finance need to do better at managing risk The greater engagement of IPF providers in fragile and conflict-affected states means that they have to take more risks – a natural consequence of adopting flexible, adaptive approaches. Working more ‘politically smartly’ means a shift away from the assumption that results can be
35 Of course, donors are responsible for, and must retain management oversight of, what happens to their money in country. DFID’s Smart Rules (DFID, 2014) are a bold and promising attempt to find the right balance between central responsibility and local autonomy.
Box 10: Adaptive programming in practice
A programme implemented by The Asia Foundation (TAF) in the Philippines has been credited with helping to secure major reforms to raise increased revenues from taxing alcohol and tobacco, helping to fund pro-poor programmes. The donor, USAID, allowed the TAF to act flexibly in facilitating and supporting small groups of local reform activists who had strong local knowledge and links. These groups were encouraged to experiment with different strategies to gain support for the reforms they were promoting, learning along the way. Through this approach these groups were able to link successfully with the media and public pressure groups and develop highly tactical alliances.
Source: Wild et al., (2015).

60 ODI Report
Photograph: Oxfam International. South Sudan, Juba, February 2014.

Financing the future 61
predicted in advance, and that progress towards the desired results will be clear, reliable and predictable.
Venture capitalists tolerate high risks for high rewards, and there are some parallels, but also some contrasts, with the way in which donors should approach risk, particularly in fragile states.
In general, like venture capitalists, donors should take a portfolio view and recognise that failure comes with the territory. But venture capitalists can also cut their losses and exit, while IPF providers must stay committed to fragile states for the long term, changing the way they engage in response to disappointing results.
For IPF providers, managing risk is far more complex than choosing an investment portfolio. They need to balance both programmatic risks (project failure, doing harm) and fiduciary risks. Reducing one risk may raise another, with the reduction of fiduciary risk increasing programmatic risk, i.e. the failure to deliver. Similarly, measures taken to limit programmatic risk – for example, by working only with tried and tested partners or serving populations that are easy to reach or in areas where the donor has prior experience – may raise contextual risks and undermine peace-building and state-building (OECD, 2014b).
A venture capitalist tolerates failure, but prefers to avoid it and will work to increase the chances of success. Similarly, there is much that IPF providers can do to reduce risks. If they use country systems, for example, they can also require governments to take actions that minimise the risk of corruption. For example, the Afghanistan Reconstruction Trust Fund and the Somalia Multi Partner Fund have adopted reimbursement-based approaches to fund their disbursement, based on ex-post verification of expenditures by a third-party monitoring agent. If it is found that the governments have not used the funds for the intended purposes, they are not reimbursed.
Investments in understanding country context are also crucial, with familiarity giving donors the confidence to take and manage risks (OECD, 2014b). Where a country context is less well understood, there is a greater chance of IPF programming that is based on risk avoidance. Ideally, some aspects of institutional risks could be eased if developing agencies can ‘educate’ their domestic constituencies about the need to tolerate some failure, and persuade politicians that the optimal quantity of corruption in IPF-funded programmes is not zero. In practice, donors may be better protected from institutional risk by working through multilaterals, a point that will be returned to later.
Providers of international public finance need to think long term An investor will be prepared to take more risks when investing for the long term, rather than the short term.
In fragile states, IPF providers are engaged in a long-term endeavour and must also take risks. They must make long-term commitments and focus on long-term, rather than short-term, results.
This report has highlighted the importance of long-term predictable funding in giving governments the confidence to scale up social protection programmes. Similar commitments are required in health and education, where children entering school do not want to leave before completion because of a lack of funds. Scaling up health systems also requires long-term funding.
A long-term approach is also critical when working in fragile states that need to develop institutional capacity: a very-long-term process, often taking decades.36 Expectations of international partners have, to date, been unrealistic and have failed to recognise the sheer amount of time it takes for their own countries to build institutions (Pritchett and de Weijer, 2010; World Bank, 2011).
Ghani and Lockhart (2008) are particularly critical of ‘quick impact projects’ intended to secure ‘peace dividends’ at the conclusion of a conflict and use the large amounts of funding available during the so-called ‘CNN window’ of attention: ‘this type of aid, instead of being a catalyst for the creation of institutional capacity, can become an instrument for division, resentment, and corruption’.
There needs to be less long-term reliance on short-term humanitarian channelsThe need to act fast to meet urgent needs means that humanitarian aid plays a prominent role in post-conflict situations. But humanitarian aid is often funded on annual cycles that, when combined with its emphasis on meeting immediate needs, makes it more difficult to make the transition to longer-term development planning.
During a civil conflict or when a government lacks broad international legitimacy, international assistance is likely to arrive through humanitarian channels. It is likely to be project-based, focused on immediate needs, funded on annual cycles and implemented with little reference to national priorities, with UN or regional organisations acting as a shadow or de facto administration. Once peace is becoming established, partners may continue to use humanitarian and UN agencies to deliver development services, justifying this on the grounds that government capacity is inadequate. Yet this might retard the development of local organisations, which miss out
36 World Bank (2011): ‘even the fastest-transforming countries have taken between 15 and 30 years to raise their institutional performance’.
Outcomes improve where IPF providers are more politically smart, and take more locally-led approaches to broker the various interests.

62 ODI Report
on opportunities to ‘learn by doing’ and the incentives related to accountability for service delivery. Too often, the transition from humanitarian aid to longer-term development assistance happens too slowly.
Proven options exist to localise and incorporate humanitarian agencies engaged in providing development-type services (e.g. basic health services, primary schooling, road maintenance) into the permanent institutional framework for service delivery in the country. Similarly, UN humanitarian agencies may develop capacity in the country that employs thousands of nationals engaged in such activities as logistics, road construction and maintenance, engineering design and public administration. These are organisations with output value that exceeds the sum of their inputs in countries where the capacity of the public sector and the local private sector is usually low. When UN missions wind down, a stronger focus is needed on the transition of UN units into local organisations – public, private or non-profit – that can enhance the capacity of the country.
5.2: Time to re-shape the aid architecture
There is a strong case for greater multilateralism The preceding analysis suggests that there is a strong case for greater use of multilateral channels in delivering IPF in the new SDG era.
First, in both fragile and non-fragile contexts, IPF providers need to be able to take more risks. They need to take a more ‘portfolio’ approach to the management of their investments, recognising that some may fail while others succeed, particularly when working in the most challenging environments. Multilateral providers, with their larger portfolios and reduced level of domestic public scrutiny, are better placed than bilaterals to take on such risks.
Coordination between IPF providers remains a challenge, and this challenge is likely to intensify as more and more providers enter the field. Multilateral providers can help to pool resources into larger funds, reducing the need for coordination and the number of actors that are, at present, involved in coordination exercises. They can also use innovative sources of finance, enabling contributions from a wider group of providers, including philanthropists, and the aid that they provide also has the advantage of being largely untied (OECD, 2011).
Multilaterals are often more able to take a long-term perspective and seek longer-term results, being less exposed to direct political pressure than bilaterals, and often work directly with governments. Data from the 2011 Paris Declaration monitoring survey found that aid channelled through multilateral organisations made greater use of the public financial management and procurement systems of partner countries than bilateral aid. Aid reported in the survey by multilateral donors tended to make greater use of programme-based approaches than bilaterals (58% compared
to 38%), although it was noted that accurate comparison of performance across donor organisations remains a challenge as their geographical coverage varies (OECD, 2011).
Multilaterals often provide more predictable funding than bilaterals, and innovative financing mechanisms can help them in this. The 2011 Paris Declaration monitoring survey found that many bilaterals were constrained from providing information on medium-term aid flows, while multilaterals were usually able to provide such information, albeit limited to their replenishment cycles (OECD, 2011).
Multilaterals can also help to overcome some of the allocation challenges outlined in the previous chapter. This is, in part, because allocation is likely to be less driven by geopolitical pressures and domestic interests, and multilaterals have the scale to take responsibility for whole regions or country categories. By adapting their allocation criteria to account for bilateral flows, they can help to shift overall allocations in a pro-poor direction, as required to meet the SDGS. In the education sector, multilateral agencies are better able to allocate funding according to need and the ability to spend (Rose et al., 2013).
Overall, the Center for Global Development’s Quality of ODA (QuODA) assessment found that, when measured against four aid-quality criteria, a multilateral agency topped three of the four dimensions; a multilateral agency (the World Bank) topped the index overall, and all the multilateral agencies (apart from the UN agencies) were in the top 50% of donors (Barder, 2012). The Global Fund to Fight AIDS, Tuberculosis and Malaria (GFATM) comes first for efficiency (out of 31 donors), fifth for transparency and learning, and ninth on reducing the burden on partner countries. The only area in which the GFATM scored poorly was fostering institutions, because much of its aid bypasses national public financial management systems, but this is not necessarily the case for all global funds. The GFATM also targets the poorest countries and has low administrative costs, its projects tend to be large, and it provides detailed reporting about most of its projects (CGD, 2014).
Finally, many new multilateral IPF providers are being set up – including the new BRICS Bank and the Asian Infrastructure Investment Bank. Their potential should be harnessed to maximum effect to meet the SDGs.
However, existing multilaterals are not ‘fit for purpose’ There are several gaps in the existing multilateral architecture that suggest it is not yet ‘fit for purpose’ in an SDG era.
First, many of the largest multilaterals lack legitimacy as their existing governance structures do not reflect current geopolitical realities. As well as strengthening accountability to the countries they purport to assist, increasing the legitimacy of multilateral organisations could lead to the deeper engagement of rising powers and emerging economies in the multilateral system. Member states, frustrated with the perceived failings of the UN and seeking political gains from starting a new initiative

Financing the future 63
have preferred to create new organisations. There has also been a proliferation of special funding channels which reflects donor frustration in the ability of multilateral organisations to innovate, adapt and be responsive to donor interests (Dervis et al., 2010).
Multilaterals are also not, by and large, sufficiently nimble and flexible enough to adopt ‘adaptive programming’ type approaches and, like other providers, they are not sufficiently coordinated. The World Bank, for example, tends to be weak in working in partnership with others, engaging with new donors and in making long-term, scaled-up interventions (Bradford and Linn, 2007). Even within the multilateral community, there is insufficient coordination, particularly in fragile states. There are also gaps within the existing architecture, with no multilateral mandated to effectively tackle justice and security.
For some multilaterals, performance-based resource allocation systems need to be adapted to the new realities of the global economy and the SDGs. For example, the World Bank’s concessional financing window, the International Development Association (IDA), has recently reduced the weight its allocation places on performance and has introduced extra support for countries facing ‘turn-around’ situations, but has not gone as far as reorienting its activities around the needs of low-capacity fragile states.
There are also specific gaps when it comes to financing of social protection, education and health. No fund has a specific mandate to support social protection, although the World Bank is engaged in some projects. As noted, the GFATM has many potential advantages as a provider, but has too narrow a focus, prioritising specific diseases rather than the strengthening of health systems as a whole. In contrast, the Global Partnership for Education (GPE) has focused resources on strengthening systems, rather than on vertical projects, and has also increased in importance in terms of the proportion of aid that it channels. However, the GPE has not attracted the same level of resources as global health funds. Between 2001 and 2011, donor contributions to the GFATM were around ten times the amount made to GPE.
There are also specific issues around the coordination of multilaterals in fragile states. At present, the UN has international legitimacy and a mandate, while the Bretton Woods Institutions have financial resources and technical expertise. Coordination between these agencies has improved, but more progress is needed, as a matter of urgency. One solution might be to apply the model of the UN-Bank cooperation that the Afghan government insisted upon in 2003, with UN agencies being awarded contracts, sometimes through competitive processes, that were funded by World Bank money flowing through the government budget. This created incentives for efficient UN performance, enhanced financial integrity and strengthened mutual accountability between the UN agencies and member states.
5.3: Summary and recommendations on IPF delivery and architecture The case has been made for a basic global social compact that includes social protection, universal health coverage and education. This report has outlined why these areas are critical for poverty reduction, and identified that they will need public financing if they are to reach the poorest and most vulnerable groups. Furthermore, LICs, and some LMICs, will need considerable increases in IPF, which needs to be provided in more adaptive, flexible ways, making greater use of multilateral channels. An assessment of the existing multilateral architecture for delivering on the proposed poverty SDGS leads to the following recommendations:
Recommendation: commit to a new IPF effectiveness agreementThe Paris aid effectiveness agenda was designed shortly after the first Financing for Development conference in Monterrey, and reflected the priorities of the stakeholders. A new IPF effectiveness agreement is needed that reflects the universal nature of the SDGs.
It is the quality, as well as the quantity, of IPF that matters. It needs to be provided in ways that bring it as close as possible to domestic public finance to help governments provide social protection and social services. Core elements of the Paris aid effectiveness agenda are still important, including ownership, alignment and harmonisation. But this agenda needs to be updated to reflect the latest evidence on the importance of ‘politically smart’ approaches to IPF delivery; the needs of the predominantly fragile countries that will be the major beneficiaries of IPF in the future; and the views of non-DAC donors, who were not involved in the Paris aid effectiveness agenda. The key elements of such a new agreement should be:
• ownership, alignment and harmonisation • adaptive programming, and the need for greater flexibility • long-term approaches, and long-term predictability • speed • risk-sharing and innovation.
Recommendation: create a new ‘Bolsa Familia Global’ to provide credible long-term financing for social protectionSocial protection programmes can play a critical role in tackling poverty and reducing vulnerability. If well-designed and properly financed, programmes can create the foundations for a ‘social floor’, providing people with security, unlocking the potential for economic growth, and creating the conditions for more inclusive societies and a fairer pattern of globalisation. A growing number of the world’s poorest countries are starting to put in place elements of a more integrated social protection system,
64 ODI Report
but limited domestic revenue constrains the scale and scope of what is possible. Much more could – and should – be done.
A multilateral social protection mechanism should be created to provide predictable and long-term funding for least-developed countries (LDCs) seeking to put in place a social floor – a minimum standard of living, although the limits of such a mechanism have to be recognised. Developed social protection systems provide basic income security in the form of social transfers, together with universal access to a range of basic services, with the finance provided through a range of contributory and non-contributory mechanisms and public finance playing a critical role. As outlined in this report, social protection in LDCs is a long way from providing comprehensive social guarantees. Most countries operate a patchwork of mechanisms, with social safety nets and a variety of assistance programmes trying to reduce vulnerability.
The proposal would build upon and support national efforts through a multilateral global social protection facility: a Bolsa Familia Global (BFG) for LDCs. This would provide transitional matched funding for governments seeking to scale up social protection that is geared explicitly towards cash transfers and social guarantees for the poor. The BFG would include robust pledging mechanisms and innovative funding for governments. It would mediate between donors operating on a short-term budgetary horizon and governments seeking to develop or strengthen national social protection systems.
Governance details would have to be elaborated through dialogue, and attempts to establish a blueprint ahead of such a dialogue would be a prescription for failure. Success will require buy-in from LDC governments and the wide range of donors now engaged in social protection, and the mechanism would have to be flexible and innovative enough to operate in different national environments, including fragile and conflict-affected states. The starting point is a shared understanding that a BFG with an inclusive governance structure, operating impartially, with transparent allocation rules and limited management discretion, could give countries the confidence to commit to large-scale social transfer programmes.
The BFG need not be a new entity: it could be administered by a group of existing agencies. But it must be trusted and seen as a reliable source of finance. The participation of many of the BRICS countries that have pioneered large-scale social transfer programmes would be especially valuable. From a donor perspective, the BFG would have the additional advantage of diversifying risk through pooled funding.
The proposal starts with the LDCs, because they have the greatest needs and the most limited financing capacity. As in any pooled financing mechanism, there would have to be clear rules for funding allocations. One option would be for indicative country allocations to be based on their share of the LDC poverty headcount. The initial amount
of co-financing and the timetable for graduation could reflect the chosen programme design and the country context. Graduation could be conditional on economic conditions, to allow automatic adjustment for shocks. The precise design of the system would be left to each country, as long as it is verified that a minimum share of funds – again reflecting the country context – reaches those living in extreme poverty.
Financial governance systems would also have to be developed, with experience from other pooled funding mechanisms serving as a useful guide. Confidence in the system would require strict financial management standards and the BFG could operate on a reimbursable post-audit basis. Where the audit revealed any misallocation or misappropriation, funding could be scaled back automatically and proportionately until a subsequent audit confirms that these issues have been resolved. The focus would be on results, with regular joint policy monitoring and assessment in partnership with the country.
In addition to ongoing transfers, the BFG could also co-fund initial research and national dialogues about programme design, up-front investments in administration and technology, and special measures to reach marginalised populations. It could act as an insurance facility, enabling assistance to respond to extreme weather events and other shocks.
The bulk of its funding would have to come initially from multi-year replenishments, as in the IDA or GFATM models. The front-loaded nature of disbursements suggests that, using a funding model similar to the International Finance Facility for Immunisation, the BFG could float bonds collateralised on future aid from participating countries. Other sources of funding could include climate finance, if national programmes target climate adaptation, and the match-funding of private, NGO and peer-to-peer giving.
A full-blown commission of country representatives, financing and social protection experts would be needed to work out the details of exactly what the BFG would fund, and how. A new vertical fund does have potential disadvantages, such as the ring-fencing of resources and fragmentation. But with the right design, these should be outweighed by the benefits. The focus from the start would be on supporting country systems: one common criticism of other global funds is their tendency to create parallel structures and undermine government ownership. The BFG could consolidate existing but fragmented donor-backed social protection programmes.
Multilateral action on social protection has been proposed in the past. The report of the ILO/WHO Advisory Group convened by Michelle Bachelet, now President of Chile, recognised that the fragmentation of donor initiatives was a barrier to more effective action. It proposed a range of measures to strengthen coordination across bilateral and multilateral agencies, with the G20 playing a more active role. Another report from two UN Special Rapporteurs recommended the creation of a Global Fund for Social Protection with two pillars, one dealing with endemic

Financing the future 65
poverty and the other providing reinsurance for social insurance programmes that are under stress as a result of external shocks. These and other approaches have provided valuable insights and have generated a wide-ranging debate on strategies for the creation of a global social floor.
The Addis Ababa Financing for Development summit presents the world with an unprecedented opportunity to put social protection – and a multilateral funding mechanism – at the centre of international cooperation during the SDG period. As outlined in this report, citizens in many of the world’s poorest countries will not attain the SDG goals without a dramatic shift in the quantity and quality of international support. There are no silver bullets, but social protection could play a far greater role in changing this picture than is currently the case, if the financing constraints can be reduced.
Finally, while the focus is on the poorest countries, the social protection challenge is global in nature. The proposed mechanism could become part of a wider multilateral initiative to create the social floor that is needed to underpin a more equitable pattern of globalisation.
Recommendation: broaden the mandate of the Global Fund to fight AIDS, Tuberculosis and Malaria, to become a Global Fund for Health The GFATM has been a great success, both in terms of its revenue mobilisation and its impact on the set of infectious diseases that it targets. But the recent Ebola crisis demonstrated the importance of health systems (Box 11), which are woefully inadequate throughout the developing world. It is time to broaden the mandate of the GFATM to strengthen health systems overall. Expansion in this direction could be motivated by a concern for global public goods, of which disease outbreak prevention and control is one.
Aid to support health has grown rapidly over the past 10-15 years, but health initiatives are often focused on specific diseases. At least one-third of aid for health was focused on HIV/AIDS during 2002-2006 (Piva and Dodd, 2009). Disease-focused initiatives may have been successful in their own terms, but sometimes suffer from high transaction costs (Moon and Omole, 2013) and misalignment with national health priorities (England, 2007) that have contributed to greater fragmentation. However, recent years have seen greater attention paid to the importance of health systems (Atun et al., 2008).
Vertical funds have their drawbacks, but they represent a mechanism for the mobilisation of a more predictable flow of resources, at scale, to tackle critical development challenges in developing countries. The advantages include a greater emphasis on results, the inclusion of civil society and the private sector, transparency, innovation and adaptation, and proven effectiveness in assisting countries scale up (Bezanson et al., 2012). Some of the ideas that have motivated the proposal for a BFG apply here: for example, the fact that countries may be reluctant to make the commitment to scale up health systems on the basis
of support from bilateral donors, and the need to support country-led programmes.
At the same time, vertical funds have faced challenges in terms of country ownership and local capacity building. At worst, they risk setting up parallel systems. This is why an explicit focus on strengthening country systems is needed. In addition to its work to combat specific diseases, the GFATM could become a vehicle for channelling long-term support into country-owned, problem-driven approaches to the strengthening of health systems in developing countries along the lines envisaged by Wild et al. (2015). Its primary role would be to support the expansion of high-quality health care to reach extremely poor populations: in other words the delivery of universal health coverage (UHC).
The Global Fund must collaborate with the other sources of health systems expertise, notably the WHO and the World Bank, in pursuit of this goal. Both are recognised sources of policy advice on health systems issues, and may be better placed to address some aspects of health systems strengthening, such as public financial management and creating fiscal space. The Shakow report on the division of labour between the World Bank and GFATM recommend that the World Bank increase its focus on health systems and cede much of its project-level interventions to the GFATM (Shakow, 2006). Similar careful consideration of the comparative advantages of the major organisations,
Box 11: Ebola and health systems
The devastating Ebola outbreak that began in Guinea in December 2013 and that quickly gripped Liberia and Sierra Leone has taken a huge human toll, destroying families and wrecking local economies. Hundreds of thousands of people suffered food shortages, millions of children were kept away from school and the outbreak is likely to have cost at least $3.8 billion (World Bank, 2014d).
Despite some good recent progress on strengthening heath systems in the region from a low base, the outbreak exposed their inadequacies as afflicted countries struggled to respond. In the three most affected countries – Guinea, Liberia and Sierra Leone – health spending per person is just $9, $20 and $16 respectively, in stark contrast to the $86 per person estimated to be required to provide universal access to a basic package of health services. These countries also face significant shortages of doctors, nurses and midwives, with only 6, 3 and 2 per 10,000 people respectively, compared with the WHO’s minimum recommended level of 23. But these statistics are typical of LICs: there are 28 countries with weaker health systems than Liberia (Save the Children, 2015). Filling the financing gap required to achieve UHC in these three countries would cost just a fraction of the financial impact of the outbreak.

66 ODI Report
Photograph: UNMEER. Vaccination campaign in the Pipeline Community Health Center in Monrovia, Liberia.
Financing the future 67
and measures to strengthen coordination and reduce transaction costs would again be required if the remit of the Global Fund is extended beyond specific diseases.
The idea of a Global Health Fund to supply the external financing needed to deliver UHC is not new (Ooms and Hammonds, 2014). Some have called for a new International Health Systems Fund (Gostin, 2014). Sachs and Pronyk (2009) suggest three new funding widows for the Global Fund: health systems, maternal and child survival and neglected tropical diseases. It is agreed that it makes sense to make use of a successful existing organisation, and that integration with the existing GFATM may also help to alleviate concerns in some quarters that a focus on systems will divert attention from priority diseases.
Recommendation: create a Humanitarian Fund for Education in Emergencies (HFEE) Although over half of the world’s children who are out of primary school are in conflict-afflicted countries, (UNESCO, 2014), there is no comprehensive way to address education for children affected by conflict-related humanitarian emergencies. The task for the international community is to respond to the humanitarian challenge in education. Part of that task is to reach children quickly and restore the stability, hope and opportunity that come with education. Unfortunately, aid for education in emergencies tends to be ‘too little, too late.’ The effectiveness of the aid response is hampered by reliance on short-term and unpredictable funding to deal with protracted crises. Four years into the Syria crisis, the donor community has yet to put in place the financing and coordination mechanisms needed to develop an effective response, even though the crisis represents what is probably the single biggest reversal in education of the past 40 years (UNHCR, 2013).
Why is the current aid delivery system so ineffective? Three factors stand out. First, aid arrives in a trickle. Education is not seen by donors (as distinct from the children affected and their parents) as a humanitarian priority: in 2014, education received just 1% of overall humanitarian appeals. Second, aid arrives through multiple channels, ranging from UN agencies to national and international NGOs and bilateral donors. The delivery systems are poorly coordinated, lacking in transparency and cumbersome, involving governments in processes that deliver small amounts of finance with high transaction costs. Third, the humanitarian system often favours western-based NGOs, excluding the regional actors and local organisations best placed to deliver support.
The existing multilateral mechanism in education – the Global Partnership for Education – has an improving record in disbursement, delivery and impact. However, its current rules and operational practices preclude an effective response to humanitarian emergences. Recent reforms allowing the GPE to release 20% of a country allocation to a UN humanitarian appeal is a step in the right direction, but it does not constitute a
systemic response to the problem. There is no systematic multilateral mechanism for reaching refugee populations and displaced people, making it difficult to channel resources to the most vulnerable. Trust funds established by the World Bank have a poor record in disbursing support to education in conflict-related emergencies, in part because many of the governments involved are unable to meet the required governance standards. Past attempts to address this issue through the GPE (then called the Fast Track Initiative) and UNICEF led to several years of dialogue with no tangible results. An independent review highlighted a number of underlying problems, including the inability of conflict-affected states to meet GPE grant conditions.
Against this backdrop there is a strong case to be made for the establishment of a Humanitarian Fund for Education in Emergencies (HFEE). Modelled on the best practices of the pooled funds in health, the HFEE would bring together all actors – including the private sector and regional actors – to provide early action and lasting support for children caught up in conflict and other emergencies. Part of the function of the HFEE would be to reduce the transaction costs for donors seeking to support education in conflict-affected areas by conducting needs assessments and establishing robust auditing and monitoring mechanisms. The HFEE could operate by tendering for the delivery of cost-effective education provision, drawing where possible on the knowledge, skills and competencies of local organisations, rather than high-cost western NGOs and international agencies. Governance arrangements could be modelled on those of the global funds for health.
Children denied a right to education because of conflict cannot afford another protracted bout of international dialogue. Nor should they have to suffer the inertia built into the current system. Rather than create a new institution, the HFEE could be hosted on a tripartite basis by the UN Office for the Coordination of Humanitarian Affairs (OCHA), UNICEF and UNHCR in close collaboration with GPE. It is of critical importance that the HFEE board includes strong representation for regional humanitarian actors, philanthropic groups and NGOs as well as their international counterparts.
Recommendation: strengthen the multilateral architecture for operating in fragile states Multilateralism is particularly important in fragile contexts. Fragile states do not need a new fund, but more effective coordination between the funds that already exist. Even within the UN system, there is inadequate coordination between the UN Security Council and the UN Peacebuilding Commission, and this needs to change. At country level, there also needs to be better coordination between actors working on different objectives, including political settlements, personal security, humanitarian action and development.

Chapter 6: Conclusions and
recommendations

Financing the future 69
The goal of ending extreme poverty by 2030 is within reach, but it will be harder to achieve than the progress made on poverty over the past 15 years. Poor people today are more likely to be living in fragile states, to be in vulnerable groups, and/or to be further below the poverty line than most of those who have been lifted out of extreme poverty since 2000 – and these trends that are likely to be exacerbated over the next 15 years. International public finance (IPF) in a new era will need to tackle this challenge head on.
Social protection, education and universal health coverage are three policy areas that are critical for poverty reduction and in which IPF plays a major role. Getting IPF right in these sectors will create an important foundation for the Sustainable Development Goals (SDGSs).
The international community, meeting in Addis Ababa in July 2015, has an unprecedented opportunity to make international public finance ‘fit for purpose’ in this new era. New challenges, a new global context and a new set of SDGs mean that ‘business as usual’ approaches to IPF delivery are no longer sufficient. This final chapter summarises the main findings of the report and the recommendations for reform.
6.1: More concessional international public finance is needed particularly for least-developed countries and fragile states
Finance may not be a sufficient condition for progress, but it is necessary: without resources, there is little hope of making progress towards the SDGs. Finance needs to be accompanied by policy and governance reforms, without which it will not be effective. In addition, the type of finance matters, and, for the three sectors that are the main focus of this report, it is primarily public financing that is required.
Domestic public finance is, in general, the first and best option. Most developing countries will need to raise more domestic resources and allocate more of them to SDG sectors if the goals are to be met. They will also need to make commitments to spend money more effectively. But analysis in this report shows that even if countries were to raise revenues in line with their estimated tax capacity, and decide to allocate half of these revenues to these social sectors, a large financing gap would still remain, particularly in LICs and LMICs.
Recommendation: IPF providers make long-term commitments that are commensurate with financing the basic social compactIPF providers should commit to supporting governments that are themselves committed to introducing a national basic social compact, by ensuring that they have sufficient
funding to do so. This means that donors cannot turn their backs on past commitments, including the 0.7% of GNI target. The report estimates there will be a financing gap of $84 billion per annum in the social sectors alone, $73 billion of which is in lower-income countries. Developing countries cannot be expected to embrace ambitious new SDGs without commensurate international support.
Recommendation: Non-Development Assistance Committee providers of international public finance should improve the communication and reporting of their activities, and consider financing targets Emerging providers, such as China and Brazil, have increased their development assistance rapidly in recent years. A greater commitment from such providers to focus on SDG priority sectors and to improve the transparency and communication of their IPF would be a welcome step forward. The first stage would be to build on what emerging providers are currently willing to report, and to set targets on that basis. Wider reforms to the aid architecture may be needed as a pre-condition of such a move.
Recommendation: Ensure that 50% of concessional IPF goes to least-developed countries If IPF was allocated to support the introduction of a basic social compact in those countries that cannot afford it themselves, it would need to be much more pro-poor. The financing gap estimates imply around 80% of existing ODA would need to go to least-developed countries (LDCs). In reality, countries have other development priorities, the costs of which may be distributed in different ways. What is clear is that current aid allocations are far from being pro-poor. This report endorses the target that has been proposed by civil society organisations and the OECD, that 50% of all concessional IPF should be spent in LDCs. It is also recognised that this does not go far enough, and that it is not a substitute for increasing total IPF volumes, but it would be a commitment worth securing nonetheless.
Recommendation: Leave no fragile state behind Most predictions show extreme poverty will be increasingly concentrated in fragile states. The international community must be involved, at scale, in every low-income fragile state, and take a long-term perspective. Support to fragile states must also reflect the New Deal’s Peacebuilding and Statebuilding goals, in addition to investments in social protection and the social sectors. Effective IPF delivery in these contexts is extremely challenging, but if the international community is serious about the SDGs, there is no other option.

70 ODI Report
6.2: It is time for a new approach to the delivery of international public finance The quality as well as quantity of IPF matters for development progress. IPF needs to be provided in ways that bring it as close as possible to domestic public finance to help governments provide social protection and social services. Core elements of the Paris aid effectiveness agenda remain important, but this agenda needs to be updated to reflect the latest evidence on the importance of ‘politically smart’ approaches to IPF delivery; the needs of the predominantly fragile countries that need to be the major beneficiaries of IPF; and the views of non-DAC donors, who were not involved in Paris.
Recommendation: IPF providers must reinvigorate the aid effectiveness agenda and make IPF fit for purpose in the SDG era A new framework should incorporate core elements of the Paris agenda, but add long-term commitment, risk-sharing, adaptive programming and speed. Ownership, alignment and harmonisation remain critical, all the more so in fragile states. But IPF providers also need to become more ‘politically smart’, more adaptive and make longer-term commitments. Risk-sharing is also particularly important in fragile states. The new framework would need to be designed and agreed in a way that reflects the views and priorities of non-DAC donors, through a multilateral mechanism involving all relevant stakeholders.
6.3: It is time for a new multilateral architecture There is a strong case for greater multilateralism. Multilaterals are able to better absorb and share risks, can take a longer-term approach and can provide more predictable finance, giving countries the confidence to scale up social protection, education and health spending. Greater use of multilaterals will reduce the need for harmonisation, as fewer actors will be involved. Multilaterals find it easier to shift their allocations to make them more pro-poor, and some, particularly global funds, can make use of innovative sources of finance to overcome the challenge of the short-term horizon of much development funding. Global funds are an important part of the multilateral architecture, although they need to support national development strategies and to avoid setting up parallel systems. Multilaterals are particularly important in fragile states, although they need to improve their coordination and effectiveness.
Recommendation: A new global social protection facility, or ‘Bolsa Familia Global’, is createdThere is need for a multilateral mechanism to provide predictable long-term funding for nationally owned social
protection programmes in countries that lack the domestic resources to fund these themselves. This mechanism – a ‘Bolsa Familia Global’ - would provide transitional matched funding for governments seeking to scale-up social protection geared explicitly towards cash transfers and social guarantees for the poorest. It would mediate between donors operating on a short-term budgetary horizon and governments making long-term social protection commitments, under an inclusive governance structure that operates impartially, with transparent allocation rules (including on graduation from its funding).
Recommendation: The Global Fund to flight AIDS, Tuberculosis and Malaria should be broadened to become a Global Fund for Health The Global Fund should become a vehicle for the acceleration of progress towards universal health coverage and the provision of long-term financial support for country-led, problem-driven approaches to systems strengthening and service delivery. One important weakness of existing funds has been a lack of country ownership, coupled with a neglect of local capacity building. That is why there needs to be an explicit focus on support for countries to expand and improve their own health systems.
Recommendation: Create a Humanitarian Fund for Education in Emergencies (HFEE) Modelled on the best practices of the pooled funds in health, the HFEE would bring together all actors to provide early action and lasting support for children caught up in conflict and other emergencies. The facility could operate by tendering for the delivery of cost-effective education provision, drawing where possible on the knowledge, skills and competencies of local organisations, rather than high-cost western NGOs and international agencies.
Recommendation: Strengthen the multilateral architecture for operating in fragile states Multilateralism is particularly important in fragile contexts. Fragile states do not need a new fund, but more effective coordination between the funds that are already engaged. The UN has international legitimacy and a mandate, while the Bretton Woods Institutions have financial resources and technical expertise. Coordination has improved, but more needs to be done. Even within the UN system, there is inadequate coordination between the UN Security Council and the UN Peacebuilding Commission. This needs to change. At country level, there also needs to be better coordination between actors working on different objectives, including political settlements, personal security, humanitarian action and development.

Financing the future 71
Photograph: Oxfam International. Response to the crisis in South Sudan: Refugees in Jamam camp line up to receive buckets and soap.

References

Background papersThis report has benefited from the following background papers.Bastagli, F. and Hagen-Zanker, J. (2014) ‘Ending extreme
poverty: The role of social protection.’ Unpublished background paper.
Carter, P. (2015) ‘What donors do in MICs’. Mimeo. London: Overseas Development Institute.
Davies, F. (2014) ‘ODI Flagship on Financing the SDGs: Background Paper on Fragile States.’ Unpublished background paper.
Manuel, M. and Hoy, C. (forthcoming) ‘Social sector spending and aid allocation to achieve the SDGs.’ ODI Working Paper. London: Overseas Development Institute
McKechnie, A. (2014) ‘International architecture for fragile states.’ Unpublished background paper.
Rose, P. (2015) ‘Education financing.’ Unpublished background paper.
Samman, E. and Hoy, C. (2014) ‘Ending Extreme Poverty’. Unpublished background paper.
Yates, R. (2014) ‘Financing for Universal Health Coverage.’ Unpublished background paper.
ReferencesAdam, C. S. and Bevan, D. L. (2006) ‘Aid and the supply
side: Public investment, export performance, and Dutch disease in low-income countries’. The World Bank Economic Review, 20(2), 261-290.
Alatas, V., Banerjee, A., Hanna, R., Olken, B. A., Purnamasari, R. and Wai-Poi, M. (2013) ‘Does elite capture matter? Local elites and targeted welfare programs in Indonesia’ (No. w18798). Cambridge MA: National Bureau of Economic Research.
Alcott, B. and Rose, P. (2015) ‘Schools and learning in rural India and Pakistan: Who goes where, and how much are they learning?’ Prospects (in press).
Andrews, C., Das, M., Elder, J., Ovadiya, M. and Zampaglione, G. (2012) ‘Social protection in low income countries and fragile situations: Challenges and future directions’. Background Paper for the World Bank 2012–2022 Social Protection and Labor Strategy. Washington, D.C.: The World Bank.
Angelsen, A., Wunder, S., Babigumira., Belcher, B., Börner, J., Smith-Hall, C. (2014) ‘Environmental Incomes and Rural Livelihoods: A Global-Comparative Assessment’. World Development, 64, Supplement 1, December 2014.
Atun, R.A., Bennett, S. and Duran, A. (2008) ‘When do vertical (stand-alone) programmes have a place in health systems?’. Geneva: World Health Organization, on behalf of the European Observatory on Health Systems and Policies.
Barder, O. (2012) ‘Is multilateral aid better?’. Owen abroad, blog of 29 October, 2012. (http://www.owen.org/blog/6128)
Barrientos, A. (2013) Social assistance in developing countries. Cambridge: Cambridge University Press.
Barrientos, A. (2012) ‘Social Transfers and Growth: What do we know? What do we need to find out?’ World Development, 40(1), 11-20.
Barrientos, A. (2007) ‘Financing social protection’. BWPI Working Paper No. 5. Manchester: Brooks World Poverty Institute at the University of Manchester.
Bastagli, F. (2010) Poverty, inequality and public cash transfers: Lessons from Latin America. Background Paper for the European Report on Development (ERD) 2010 on Social Protection for Inclusive Development, European University Institute, Florence.
Bastagli, F. (2013) ‘Feasibility of social protection schemes in developing countries’. European Parliament Briefing. Brussels: Directorate General for External Policies of the Union.
Berhane, G., Gilligan, D., Hoddinott, J., Kumar, N. and Taffesse, A. S. (2014) ‘Can Social Protection Work in Africa? The Impact of Ethiopia’s Productive Safety Net Programme’. Economic Development and Cultural Change, 63, (1).
Bezanson, K., Isenman, P. and Shakow, A. (2012) Scaling up in agriculture, rural development, and nutrition. Washington, D.C.: International Food Policy Research Institute.
Billmeier, A. and Nannicini, T. (2013) ‘Assessing Economic Liberalization Episodes: A Synthetic Control Approach’. The Review of Economics and Statistics, 95, (3), 983-1001.
Blair, G., Fair, C., Malhotra, N. and Shapiro, J. (2012). “Poverty and Support for Militant Politics: Evidence from Pakistan.” American Journal of Political Science.
Booth, D. and Unsworth, S. (2014) ‘Politically smart, locally led development’. Discussion Paper. September 2014. London: Overseas Development Institute.
Bradford, C. and Linn, J. (2007) ‘Reform of global governance: Priorities for action’. Policy Brief 163. Washington, D.C.: Brookings Institution.
Brautigam, D., Fjeldstad, O.H. and Moore, M. (eds) (2008) Taxation and State-Building in Developing Countries. Cambridge: Cambridge University Press.
Brückner, M. (2013) ‘On the simultaneity problem in the aid and growth debate’. Journal of Applied Econometrics, 28 (1), 126–150, January/February 2013.
Carpenter, S., Slater, R. and Mallett, R. (2012) ‘Social Protection and Basic Services in Fragile and Conflict-Affected Situations’. London: Secure Livelihoods Research Programme, Overseas Development Institute.
Carter, P. (2015) ‘What donors do in MICs’. Mimeo. London: Overseas Development Institute.
Carter, P. (2014) ‘Aid allocation rules’. European Economic Review, 71, 132-151.
CGD (2014) ‘The Quality of Official Development Assistance 2014’. Washington, D.C.: Center for Global Development.
Financing the future 73

74 ODI Report
Chandy, L. and Gertz, G. (2011) ‘Poverty in Numbers: The Changing State of Global Poverty from 2005 to 2015’. Global Views. Policy Paper No. 18 of 51. Washington D.C.: Brookings Institution.
Chandy, L., Ledlie, N. and Penciakova, V. (2013) ‘The Final Countdown: Prospects for Ending Extreme Poverty by 2030’. Global Views. Policy Paper 2013-04. Washington, D.C.: Brookings Institution.
Chant, S. (2006) ‘Revisiting the ‘Feminisation of Poverty’ and the UNDP Gender Indices: What Case for a Gendered Poverty Index?’. Gender Institute Working Paper Series 18, London: London School of Economics.
Christiansen, L., Schindler, M. and Tressel, T. (2013) ‘Growth and structural reforms: A new assessment’. Journal of International Economics, 89(2), 347-356.
(CPAN) Chronic Poverty Advisory Network (2014) ‘The Chronic Poverty Report 2014-2015: The road to zero extreme poverty’. London: Overseas Development Institute.
Clemens, M.A., Radelet, S., Bhavnani, R.R. and Bazzi, S. (2012) ‘Counting Chickens when they Hatch: Timing and the Effects of Aid on Growth’. The Economic Journal, 122, (561), 590–617.
Colclough, C. and Al-Samarrai, S. (2000) ‘Achieving schooling for all: Budgetary expenditures on education in sub-Saharan Africa and South Asia’. World Development, 28(11), 1927-1944.
Collier, P. (2011) ‘Savings and Investment Decisions in Low-Income Resource-Rich Countries’. Oxford UK: Centre for the Study of African Economics, Department of Economics, Oxford University.
COM (2011) ‘Communication from the Commission to the European Parliament, the Council, the European Economic and Social Committee and the Committee of the Regions: Increasing the impact of EU Development Policy: an Agenda for Change’. COM (2011) 637 final. Brussels: European Commission.
Crowe, S. (2013) Progress report on committing to child survival: A promise renewed. New York, NY: UNICEF.
Das, J. and Hammer, J. (2014) ‘Quality of primary care in low-income countries: Facts and economics’. Annual Review of Economics 6(1), 525-553.
Day-Ashley, L., Mcloughlin, C., Aslam, M., Engel, J., Wales, J., Rawal, S., Rawal, S., Batley, R., Kingdon, G., Nicolai, S. and Rose, P. (2014). The role and impact of private schools in developing countries a rigorous review of the evidence. London: Department for International Development.
de Brauw, A., Gilligan, D., Hoddinott, J. and Roy, S. (2015) ‘Bolsa Família and Household Labor Supply’. Economic Development and Cultural Change, 63, (3).
Delgado, M. S., Henderson, D. J. and Parmeter, C. F. (2014) ‘Does education matter for economic growth?’ Oxford Bulletin of Economics and Statistics, 76(3), 334-359.
Dervis, K., Kharas, H. and Unger, N. (2010) Aiding development. Assistance reform for the 21st century.
Brookings Blum Roundtable 2010. Washington, D.C.: Brookings Institution.
DFAT (2014) ‘Australian aid: Promoting prosperity, reducing poverty, enhancing stability’. Canberra: Australian Government Department for Foreign Affairs and Trade.
DFID (2014) ‘Smart Rules: Better Programme Delivery’. London: UK Department for International Development.
DFID (2013) ‘Economic development for shared prosperity and poverty reduction: a strategic framework’. London: UK Department for International Development.
Dollar, D. and Pritchett, L. (1998) ‘Assessing aid – what works, what doesn’t and why’. Washington, D.C.: World Bank, Oxford University Press.
Doucouliagos, H. and Paldam, M. (2013) ‘The Robust Result in Meta-analysis of Aid Effectiveness: A Response to Mekasha and Tarp’. Journal of Development Studies, 49(4), 584-587.
Dupas, P. (2011a) ‘Global Health Systems: Pricing and User Fees’. Elsevier Encyclopedia of Health Economics.
Dupas, P. (2011b) ‘Health Behavior in Developing Countries.’ Annual Review of Economics, 3, 425-449.
Edward, P. and Sumner, A. (2014) ‘Estimating the Scale and Geography of Global Poverty Now and in the Future: How much Difference Do Method and Assumptions Make?’. World Development, 58, 67-82.
Ellis, F. (2012). ‘We Are All Poor Here’: Economic difference, social divisiveness and targeting cash transfers in sub-saharan Africa. Journal of Development Studies, 48(2), 201-214.
England, R. (2007) ‘Are We Spending Too Much on HIV?’. British Medical Journal, 334, 344.
EPRI (2011) Designing and Implementing Social Transfer Programmes: A policy manual. Cape Town: Economic Policy Research Institute.
Evans, D. and Popova, A. (2015) ‘What Really Works to Improve Learning in Developing Countries? An Analysis of Divergent Findings in Systematic Reviews’. World Bank Policy Research Working Paper (7203). Washington, D.C.: World Bank.
Fankhauser, S. and Schmidt-Traub, G. (2011) ‘From adaptation to climate-resilient development: The costs of climate-proofing the Millennium Development Goals in Africa’. Climate and Development, 3(2).
Faustino, J. and Booth, D. (2014) ‘Development entrepreneurship: How donors and leaders can foster institutional change’. Working politically in practice series – case study No. 2. San Francisco, CA and London: Asia Foundation and Overseas Development Institute.
Feeny, S. and de Silva, A. (2012). Measuring absorptive capacity constraints to foreign aid. Economic Modelling, 29(3), 725-733.
Fenochietto, R. and Pessino, C. (2013) ‘Understanding Countries’ Tax Effort’. IMF Working Paper 13/244 November 2013. Washington, D.C.: International Monetary Fund.

Filmer, D., Hammer, J. S. and Pritchett, L. H. (2000) ‘Weak links in the chain: A diagnosis of health policy in poor countries’. The World Bank Research Observer, 15(2), 199-224.
Fishstein, P. and Wilder, A. (2011) Winning hearts and minds? Examining the relationship between aid and security in Afghanistan. Medford, MA: Feinstein International Center, Tufts University.
Fiszbein, A., Kanbur, R. and Yemtsov, R. (2014) ‘Social Protection and Poverty Reduction: Global Patterns and Some Targets’. World Development, 61, 167-177.
Fiszbein, A., Kanbur, R. and Yemtsov, R. (2013) ‘Social protection, poverty and the post-2015 agenda’. Policy Research Working Paper N. 6469. Washington, D.C.: World Bank.
g7+ (2011) ‘A New Deal for engagement in fragile states’. Dili: g7+ Secretariat.
Gadenne, L. (2012) ‘Tax me, but spend wisely: Public finance and government accountability’. London: University College London and Institute for Fiscal Studies.
Galiani, S., Knack, S., Xu, L.C. and Zou, B. (2014) ‘The Effect of Aid on Growth: Evidence from a Quasi-Experiment’. 9 June 2014. Available at SSRN (http://ssrn.com/abstract=2400752)
Garcia, M. and Moore, C. (2012) ‘The cash dividend: The rise of cash transfer programmes in Sub-Saharan Africa’. Washington, D.C.: The World Bank.
Ghani, A. and Lockhart, C. (2008) Fixing Failed States: A Framework for Rebuilding a Fractured World. Oxford: Oxford University Press.
Glennie, J. and Hurley, G. (2014) ‘Where Next for Aid? The post-2015 opportunity.’ London: Overseas Development Institute
Glennie, J. and Rabinowitz, G. (2013) ‘Localising aid: a whole of society approach’. London: Overseas Development Institute.
Glewwe, P. W., Hanushek, E. A., Humpage, S. D. and Ravina, R. (2011) School resources and educational outcomes in developing countries: A review of the literature from 1990 to 2010 (NBER working paper No. w17554). Cambridge MA: National Bureau of Economic Research.
Global Commission on the Economy and Climate (2014) Better Growth, Better Climate: The New Climate Economy Report. London: The Global Commission on the Economy and Climate.
Gostin, L. O. (2014) ‘Ebola: Towards an international health systems fund’. The Lancet, 384(9951), e49 - e51.
Granoff, I., Eis, J., Hoy, C., Watson, C., Khan, A. and Grist, N. (2014) ‘Targeting Zero Zero: Achieving zero extreme poverty on the path to zero net emissions.’ Discussion paper. London: Overseas Development Institute.
Greenhill, R., Prizzon, A. and Rogerson, A. (2013) ‘The age of choice: How are developing countries managing the new aid landscape?’. London: Overseas Development Institute.
Hagen-Zanker, J. and Holmes, R. (2012) Social protection in Nigeria. Synthesis report. London: Overseas Development Institute.
Hagen-Zanker, J. and McCord, A. (2010) Financing social protection in the light of international spending targets: A public sector spending review. London: Overseas Development Institute.
Hallegatte, S. and Dumas, P. (2008) ‘Can Natural Disasters Have Positive Consequences? Investigating the Role of Embodied Technical Change’. Ecological Economics, 68 (3), 777-786.
Hanushek, E. A. (2013) ‘Economic growth in developing countries: The role of human capital’. Economics of Education Review, 37, 204-212.
Hanushek, E. A. and Woessmann, L. (2012) ‘Do better schools lead to more growth? Cognitive skills, economic outcomes, and causation’. Journal of Economic Growth, 17(4), 267-321.
Härmä, J. 2009. Can choice promote Education for All? Evidence from growth in private primary schooling in India. Compare, 39(2), 151–65.
Harris, K., Keen, D. and Mitchell, T. (2013) ‘When disasters and conflicts collide. Improving links between disaster resilience and conflict prevention’. London: Overseas Development Institute.
Haushofer, J. and Shapiro, J. (2013) ‘Policy Brief: Impacts of Unconditional Cash Transfers.’ Cambridge, MA: Massachusetts Institute of Technology. (Accessed April, 30, 2014).
Hausmann, R., Rodrik, D. and Velasco, A. (2005) ‘Growth Diagnostics’, in Serra, N. and Stiglitz, J. E. (eds) The Washington Consensus Reconsidered: Towards a New Global Governance. Oxford: Oxford University Press.
Hoeffler, A. (2014). ‘Can international interventions secure the peace?’. International Area Studies Review, 17(1), 75-94.
Hoeffler, A. and Fearon, J. (2014) ‘Conflict and Violence Assessment Paper: Benefits and Costs of the Conflict and Violence Targets for the Post-2015 Development Agenda’. Lowell, MA: Copenhagen Consensus Center.
Horton, S. and Hoddinott, J. (2014) ‘Food Security and Nutrition: Perspective Paper – Benefits and Costs of the Food Security and Nutrition Targets for the Post-2015 Development Agenda’. Lowell MA, Copenhagen Consensus Center.
Hughes, J. Glassman, A. and Gwenigale, W. (2012) ‘Innovative Financing in Early Recovery: The Liberia Health Sector Pool Fund’. Working Paper 288 February 2012. Washington, D.C.: Center for Global Development.
IDS (2007) ‘Connecting Social Protection and Climate Change Adaptation.’ IDS In Focus 02. Brighton: Institute of Development Studies.
International Monetary Fund (IMF) (2011) ‘Macroeconomic and Operational Challenges in Countries in Fragile Situations.’ Washington, DC: International Monetary Fund.
Financing the future 75

Kakwani, N. and Subbarao, K. (2007) ‘Poverty among the elderly in sub-Saharan Africa and the role of social pensions’. Journal of Development Studies, 43 (6), 987-1008.
Kalebe-Nyamongo, C. and Marquette, H. (2014) ‘Elite Attitudes Towards Cash Transfers and the Poor in Malawi’. DLP research paper 30. Birmingham: Developmental Leadership Program, University of Birmingham.
Karlan, D. and Goldberg, N. (2014) Impact of the Graduation Model. Presentation available on the CGAP website. New Haven ,CT: Innovations for Poverty Action.
Karver, J., Kenny, C. and Sumner, A. (2012) ‘MDGs 2.0: What goals, targets, and timeframe?’ Working paper 297. Washington, D.C.: Center for Global Development.
Kharas, H. and Rogerson, A. (2012) Horizon 2025: creative destruction in the aid industry. London: Overseas Development Institute.
Kharas, H., Prizzon, A. and Rogerson, A. (2014) ‘Financing the Sustainable Development Goals: A rough roadmap.’ London: Overseas Development Institute.
KPMG (2014) ‘2014 Zambia National Budget Highlights’. Lusaka: KPMG.
Kuriakose, A., Heltberg, R., Wiseman, W., Costella, C., Cipryk, R. and Cornelius, S. (2013) ‘Climate-Responsive Social Protection’. Development Policy Review, 31.
Lakner, C., Negre, M. and Prydz, E. B. (2014) ‘Twinning the goals: How can promoting shared prosperity help to reduce global poverty?’. Policy Research Working Paper 7106. Washington, D.C.: World Bank.
Lampietti, J.A. and Stalker, L. (2000) ‘Consumption Expenditure and Female Poverty: A Review of the Evidence’. Policy Research Report on Gender and Development, Working Paper Series No.11. Washington, D.C.: World Bank.
Lange, E. (2014) ‘Projections to zero - Background paper prepared for the Education for all global monitoring report 2013/4’. Paris: United Nations Educational, Scientific and Cultural Organisation (UNESCO).
The Lancet (2013) ‘Global health 2035: A world converging within a generation’. 3 December, 2013. London: The Lancet Commission on Investing in Health.
Limwattananon, S., Neelsen, S., O’Donnell, O., Prakongsai, P., Tangcharoensathien, V., van Doorslaer, E. and Vongmongkol, V. (2015) ‘Universal coverage with supply-side reform: The impact on medical expenditure risk and utilization in Thailand’. Journal of Public Economics, 121, 79-94.
Lindert, K., Linder, A., Hobbs, J. and De la Brière, B. (2007). The nuts and bolts of Brazil’s Bolsa Família Program: Implementing conditional cash transfers in a decentralized context.
Liu, L., Oza, S., Hogan, D., Perin, J., Rudan, I., Lawn, J., Cousens, S., Mathers, C. and Black, R. (2014) ‘Global, regional, and national causes of child mortality in 2000–13, with projections to inform post-2015
priorities: An updated systematic analysis’. The Lancet, 385, (9966).
Lopes, C. (2014) ‘African Common Position on the post 2015 development agenda: Key messages arising from Africa-wide consultations’. Presentation at July 2014 meetings of the United Nations Economic Commission for Africa.
Manuel, M., McKechnie, A., King, M., Coppin, E. and Denney L. (2012) ‘Innovative aid instruments and flexible financing: providing better support to fragile states’. ODI working paper. London: Overseas Development Institute.
Masset, E., and White, H. (2004) ‘Are Chronically Poor People Being Left Out of Progress towards Millennium Development Goals? A Quantitative Analysis of Older People, Disabled People and Orphans’. Journal of Human Development 5 (2).
McCord, A. (2010) ‘Differing government and donor perspectives on Cash Transfer based social protection in sub-Saharan Africa: The implications for EU Social Protection Programming’. Background Paper for the European Development Report.
McKechnie, A. and Manuel, M. (2015) ‘Peace Building and State Building in Fragile States: External Support That Works’ in L.Chandy, H.Kharas and H.Kato (eds) The Last Mile in Ending Extreme Poverty. Washington, DC: Brookings Press
McKechnie, A. and Manuel, M. (forthcoming) ‘Post 2015 - Stability, Development and Resilience in Fragile States: External support that works well’. Washington, D.C.: Brookings Institute.
MDS (2014) ‘Programa Bolsa Família completa 11 anos’. Brasília: Ministra do Desenvolvimento Social e Combate à Fome.
Mesoy, A. (2013) ‘Poverty and radicalisation into violent extremism: A causal link?’. Oslo: Norwegian Peacebuilding Research Centre (NOREF).
MFA (2010) Letter to the House of Representatives presenting the spearheads of development. The Hague: Netherlands Ministry of Foreign Affairs.
Minh Le, T., Moreno-Dodson, B. and Bayraktar, N. (2012) ‘Tax Capacity and Tax Effort: Extended Cross-Country Analysis from 1994 to 2009’. Policy Research Working Paper 6252. Washington, D.C.: World Bank.
Mitra, S., Posarac, A. and Vick, B.C. (2011) ‘Disability and Poverty in Developing Countries: A Snapshot from the World Health Survey’. World Bank Social Protection Working Paper No. 1109, April 2011. Washington, D.C.: World Bank.
Monchuk, V. (2013) Reducing Poverty and Investing in People: The New Role of Safety Nets in Africa. World Bank Publications. Washington, D.C.: World Bank.
Montenegro, C.E. and Patrinos, H.A. (2013) ‘Returns to Schooling Around the World’. Background Paper for the World Development Report 2013. Washington, D.C.: World Bank.
76 ODI Report
Moon, S. and Omole, O. (2013) ‘Development Assistance for Health: Critiques and Proposals for Change’. Centre on Global Health Security, Working Group Paper 1, Chatham House, April 2013. London: Chatham House.
Munro. (2003) A social safety net for the chronically poor? Zimbabwe’s public assistance in the 1990s [Draft], presented at Staying Poor: Chronic Poverty and Development Policy, Institute for Development Policy and Management, University of Manchester, 7-9 April 2003. Chronic Poverty Research Centre (CPRC), Manchester, UK, 25 pp.
Morgan, C., Petrosino, A. and Fronius, T. (2013) A Systematic Review of the Evidence of the Impact of School Voucher Programmes in Developing Countries. London: EPPI-Centre, Social Science Research Unit, Institute of Education, University of London.
Moss, T., Pettersson, G. and van de Walle, N. (2006) ‘An aid institutions paradox? A review essay on aid dependency and state building in Sub-Saharan Africa’. Working Paper No. 74. Washington, D.C.: Center for Global Development.
Muralidharan, K., Niehaus, P. and Sukhtankar, S. (2014) ‘Building State Capacity: Evidence from Biometric Smartcards in India’. NBER Working Paper No. 19999. Cambridge MA: National Bureau of Economic Research.
Murnane, R. J. and Ganimian, A. J. (2014) ‘Improving Educational Outcomes in Developing Countries: Lessons from Rigorous Evaluations’. (NBER Working Paper No. 20284). Cambridge, MA: National Bureau of Economic Research.
Mwabu, G. (2007) ‘Health economics for low-income countries’. Handbook of development economics, 4, 3305-3374.
Ncube, M., Brixiova, Z. and Bicaba, Z. (2014) ‘Can Dreams Come True? Eliminating Extreme Poverty in Africa by 2030’. IZA Discussion Paper No. 8120. Bonn: Institute for the Study of Labor.
Nelson, G. C., Rosegrant, M. W., Koo, J., Robertson, R., Sulser, T., Zhu, T., et al. (2009) ‘Climate Change: Impact on Agriculture and Costs of Adaptation’. Washington D.C.: International Food Policy Research Institute.
Nicholls, A. and Pannelay, A. (2014) ‘Health Outcomes and Cost – A 166-country comparison’. London: The Economist Intelligence Unit.
Nielsen, R. A., Findley, M. G., Davis, Z. S., Candland, T. and Nielson, D. L. (2011) ‘Foreign aid shocks as a cause of violent armed conflict’. American Journal of Political Science, 55(2), 219-232.
Nyandekwe, M., Nzayirambaho, M. and Kakoma, J.B. (2014) ‘Universal health coverage in Rwanda: Dream or reality’. The Pan African Medical Journal, 2014, 17(232).
OECD (2005) ‘The Paris Declaration on Aid Effectiveness’. Paris: OECD
OECD (2008) ‘Service Delivery in Fragile Situations. Key Concepts, Findings and Lessons’. Journal of Development, 9(3).
OECD (2011) ‘Survey on Monitoring the Paris Declaration’. Paris: OECD
OECD (2013) ‘Government at a Glance 2013. Structure of general government expenditures’. Paris: OECD
OECD (2014a) ‘Fragile States 2014 - Domestic Revenue Mobilisation in Fragile States’. Organisation for Economic Cooperation and Development (OECD), Paris.
OECD (2014b) Development Assistance and Approaches to Risk in Fragile and Conflict Affected States. Paris: Development Assistance Committee of the Organisation for Economic Co-operation and Development.
OECD (2014c) 2014 Global Outlook on Aid: Results of the 2014 DAC Survey on Donors’ Forward Spending Plans and Prospects for Improving Aid Predictability. Paris: OECD
OECD (2014d) OECD StatExtracts Database. Accessed online, available at http://stats.oecd.org/
Olinto, P., Beegle, K., Sobrado, C. and Uematsu, H. (2013) ‘The State of the Poor: Where Are The Poor, Where is Extreme Poverty Harder to End, and What Is the Current Profile of the World’s Poor?’. Economic Premise Number 125. Washington D.C.: Poverty Reduction and Economic Management Network (Prem), World Bank.
Ooms, G. and Hammonds, R. (2014) ‘Financing Global Health: Through a Global Fund for Health’. Centre for Global Health Security Working Papers, Chatham House. London: Chatham House.
Osorio, R.G. and Ferreira de Souza, P. H.G. (2013) ‘Bolsa Família after Brasil Carinhoso: An Analysis of the Potential for Reducing Extreme Poverty’, Centre for Inclusive Growth, Research Brief No 41, March 2013.
Østby, G. and Urdal, H. (2011) ‘Education and Civil Conflict: A Review of the Quantitative, Empirical Literature’. Background paper prepared for the Education for All Global Monitoring Report. Paris: UNESCO.
Ostry, M. J. D., Berg, M. A. and Tsangarides, M. C. G. (2014) ‘Redistribution, inequality, and growth’. IMF Staff Discussion Note (SDN/1402). Washington, D.C.: International Monetary Fund.
Piva, P. and Dodd, R. (2009) ‘Where did all the aid go? An in-depth analysis of increased health aid flows over the past 10 years’. Bulletin of the World Health Organization 2009(87). 930-939.
Pretorius, C (2014) ‘Budget support design: a synthesis. Final report.’ Unpublished memo for DFID Tanzania.
Pritchett, L. (2015) ‘Can Rich Countries Be Reliable Partners for National Development?’ Essay, 2 March, 2015. Washington D.C.: Center for Global Development.
Pritchett, L. and de Weijer, F. (2010) ‘Fragile states: Stuck in a capability trap?’. Background Paper prepared for the World Development Report 2011. Washington, D.C.: World Bank.
Putzel, J. (2010) Do No Harm: International Support for Statebuilding. Paris: Development Assistance Committee of the OECD.
Financing the future 77

Qian, N. (2014) ‘Making Progress on Foreign Aid’. Annual Review of Economics, 3: Submitted. Doi:10.1146/annurev-economics-080614-115553.
Rabinwitz, G., and Prizzon, A., (2015) ‘Financing for development: Lessons from Development Progress case studies.’ London: Overseas Development Institute (ODI)
Ranna-Eliya R. and Sikurajapathy, L. (2009) Sri Lanka: Good practice in expanding health care coverage. Institute for Health Policy Research studies, Series 3. Washington, D.C.: The World Bank.
Rajkumar, A. S. and Swaroop, V. (2008) ‘Public spending and outcomes: Does governance matter?’. Journal of Development Economics, 86(1), 96-111.
Ravallion, M. (2013) ‘How long will it take to lift one billion people out of poverty?’. World Bank policy research working paper 6325. Washington, D.C.: World Bank.
Reinikka, R. and Svensson, J. (2004) ‘Local capture: evidence from a central government transfer program in Uganda’. The Quarterly Journal of Economics, 679-705.
Rose, P., Steer, L., Smith, K. and Zubairi, A., (2013) ‘Financing for Global Education: Opportunities for Multilateral Action.’ Washington, D.C.: The Brookings Institution
Rottingen, J.A., Ottersen, T., Albo, A., Arhin-Tenkorang, D., Benn, C., Elovainio, R. et al. (2014) Shared Responsibilities for Health: A Coherent Global Framework for Health Financing. Final report of the Centre on Global Health Security Working Group on Health Financing. London: Chatham House.
Sachs, J. and Pronyk, P. (2009) ‘Towards a global fund for the health MDGs?’. The Lancet, 373(9681) 2110–2111.
Sachs, J.D. and Schmidt-Traub, G. (2014) ‘Financing for Sustainable Development: Implementing the SDGs through Effective Investment Strategies and Partnerships’. New York, NY.: Sustainable Development Solutions Network (SDSN).
Salinas, G., Gueye, C. and Korbut, O. (2015) ‘Impressive Growth in Africa Under Peace and Market Reforms’. Journal of African Economies, 24(1), 101-127.
Save the Children ((2015) ‘A Wake-up Call: Lessons from Ebola for the world’s health systems’. London: Save the Children UK.
Samman, E. and Rodriguez-Takeuchi, L.K. (2013) ‘Old age, disability and mental health: Data issues for a post-2015 framework’. ODI Background Note. London: Overseas Development Institute.
Schellnhuber, H. J., Hare, W., Serdeczny, O., Adams, S., Coumou, D., Frieler, K. and Warszawski, L. (2012) Turn down the heat: Why a 4 °C warmer world must be avoided. Washington, D.C.: World Bank.
Schmaljohann, M. and Prizzon, A. (2015) ‘Age of Choice: How developing countries are managing the new aid landscape. A summary’ London: Overseas Development Institute.
Schoellman, T. (2012) ‘Education quality and development accounting’. The Review of Economic Studies, 79(1), 388-417.
SDSN (2014) Health in the framework of sustainable development. Technical Report for the Post-2015 Development Agenda. New York: Thematic Group on Health for All of the Sustainable Development Solutions Network.
Shakow, A. (2006). Global Fund–World Bank HIV/AIDS programs: comparative advantage study. New York: The Global Fund to Fight AIDS, Tuberculosis and Malaria and The World Bank, 47-59.
Shepherd, A. and Lenhardt, A. (2013) ‘What has happened to the poorest 50%’. London: Overseas Development Institute.
Shepherd, A., Mitchell, T., Lewis, K., Lenhardt, A., Jones, L., Scott, L. and Muir-Wood, R. (2013) The geography of poverty, disasters and climate extremes in 2030. London: Overseas Development Institute.
Slater, R. and Mathers, N. (2014) ‘Social protection and growth: Research Synthesis’. Review paper. Canberra: Australian Government Department of Foreign Affairs and Trade.
Soares, S., Ribas, R. P. and Soares, F. V. (2010) ‘Targeting and Coverage of the Bolsa Família Programme: Why Knowing What You Measure Is Important In Choosing the Numbers’. IPC Working Paper Series, No. 71. Brasília: International Policy Centre.
Summers, L.H. (1992) ‘Investing in All the People’. The Pakistan Development Review Vol. 31, No. 4. 1992 (pp. 367-404).
Sumner, A. (2012), The New Face of Poverty: How has the Composition of Poverty in Low Income and Lower Middle Income Countries (excluding China) Changed since the 1990s? IDS Working Paper no. 408, Brighton: IDS.
Sumner, A. (2013), Who are the poor? New regional estimates of the composition of education and health ‘poverty’ by spatial and social inequalities. Overseas London: Development Institute:
Tavakoli, H., Simson, R. and Tilley, H. with Booth, D. (2013) ‘Unblocking results: Using aid to address governance constraints in public service delivery’. London: Overseas Development Institute.
UNDP (2011) Human Development Report 2011: Sustainability and Equity: A Better Future for All. New York: United Nations Development Programme.
UNESCO (2014) ‘EFA Global Monitoring Report 2013/14 - Teaching and learning: Achieving quality for all’. Paris:
United Nations Educational, Scientific and Cultural Organisation.
UNESCO (2015) ‘Pricing the right to education: The cost of reaching new targets by 2030’. Policy Paper 18, Education for All Global Monitoring Report. Paris: United Nations Educational, Scientific, and Cultural Organisation.
UNHCR (2013) The Future of Syria: Refugee Children in Crisis. Geneva: Office of the United Nations High Commissioner for Refugees.
UNICEF (2014) ‘The state of the world’s children 2014 in numbers: Every child counts’. New York, NY: United Nations International Children’s Emergency Fund (UNICEF).

Financing the future 79
UNOWG (2014) Open Working Group Proposal for Sustainable Development Goals. Full report of the Open Working Group of the General Assembly on Sustainable Development Goals. New York: United Nations Open Working Group.
von Hippel, K. (2013) ‘Does poverty serve as a root cause of terrorism?’. In: Gottleib, S., Debating terrorism and counterterrorism. Conflicting Perspectives on Causes, Contexts, and Responses, 2nd edition. Washington, D.C.: CQ Press.
Wagstaff, A., Bilger, M., Buisman, L. R. and Bredenkamp, C. (2014) ‘Who benefits from government health spending and why? a global assessment’. Policy Research Working Paper, (7044). Washington, D.C.: World Bank.
Wantchekon, L. (2003) ‘Clientelism and Voting Behavior: Evidence from a Field Experiment in Benin’. World Politics, 55(3).
Wantchekon, L., Klašnja, M. and Novta, N. (2015) ‘Education and Human Capital Externalities: Evidence from Colonial Benin’. Quarterly Journal of Economics.
Warner, M. (2013). A framework for efficient government investment. International Monetary Fund (No. 13-58).
Weil, D. (2014) ‘Health and Economic Growth’. In: Aghion, P. and Durlauf, S. N. (eds), Handbook of Economic Growth, volume 2. Elsevier, 623-682.
WHO (2007) ‘Everybody’s business: Strengthening health systems to improve health outcomes. WHO’s framework for action’. Geneva: World Health Organization.
WHO (2010) Health systems financing: The path to universal coverage (World Health Report 2010). Geneva: World Health Organization.
Wild, L., Booth, D., Cummings, C., Foresti, M. and Wales, J. (2015) Adapting Development: Improving Services for the poor. London: Overseas Development Institute.
Williamson, T. and Dom, C. (2010) Sector Budget Support in Practice: Synthesis Report. London: Overseas Development Institute and Mokoro.
Winthrop, R. and Graff, C. (2010) ‘Beyond Madrasas: Assessing the links between education and militancy in
Pakistan’. Working Paper. Washington, D.C.: Center for Universal Education at Brookings.
World Bank (2009) More money for health and more health for the money. Washington, D.C.: World Bank Taskforce on Innovative International Financing for Health Systems.
World Bank (2011) World Development Report 2011: Conflict, Security, and Development. Washington, D.C.: World Bank.
World Bank (2012) ‘Resilience, Equity and Opportunity: The World Bank’s Social Protection and Labor Strategy 2012-2022’. Washington, D.C.: World Bank.
World Bank (2013a) Turn down the heat: climate extremes, regional impacts, and the case for resilience. A report for the World Bank by the Potsdam Institute for Climate Impact Research and Climate Analytics. Washington, D.C.: World Bank.
World Bank (2013b) ‘World Bank Group assistance to low-income fragile and conflict-affected states’. Washington, D.C.: Independent Evaluation Group, World Bank.
World Bank (2014a) ‘PovcalNet: an online analysis tool for global poverty monitoring.’ Accessed online November 2014 at http://iresearch.worldbank.org/PovcalNet/
World Bank (2014b) ‘Measuring Poverty and Sharing Prosperity.’ Washington, DC: World Bank.
World Bank (2014c) The State of Social Safety Nets 2014. Washington, D.C.: World Bank.
World Bank (2014d) The Economic Impact of the 2014 Ebola Epidemic: Short and Medium Term Estimates for West Africa. Washington, D.C.: World Bank.
World Bank (2014e) World Development Indicators. Accessed online at http://data.worldbank.org/data-catalog/world-development-indicators
World Bank (2015) ‘A Measured Approach to Ending Poverty and Boosting Shared Prosperity: Concepts, Data, and the Twin Goals.’ Policy Research Report. Washington, D.C.: World Bank.
Yoshida, N., Uematsu, H. and Sobrado, C. E. (2014) ‘Is extreme poverty going to end? An analytical framework to evaluate progress in ending extreme poverty’. World Bank Policy Research Working Paper 6740. Washington, D.C.: World Bank.

Led by researchers from the Centre for Aid and Public Expenditure at ODI, this report is part of a broader programme of research and events being supported by the Development Progress project, with funding from the Bill and Melinda Gates Foundation, Irish Aid, and the Swedish International Development Cooperation Agency.The findings and conclusions contained within are those of the authors and do not necessarily reflect positions or policies of the Bill & Melinda Gates Foundation or SIDA.
ODI is the UK’s leading independent think tank oninternational development and humanitarian issues.Further ODI materials are available at odi.org.uk
Overseas Development Institute203 Blackfriars RoadLondon SE1 8NJTel: +44 (0)20 7922 0300
Cover, figures and infographic designed by Lucy Peers.
Email: [email protected]/developmentprogressprojecttwitter.com/dev_ progress developmentprogress.org
facebook.com/odi.developmenttwitter.com/odidev odi.org/programmes/aid-public-expenditure