Africa s food trade: overview - tralac
7
1 Introduction Due to population growth, rapid urbanization and changes in dietary patterns, there is fast-growing demand for agricultural products in global markets and in developing countries. Even though the African continent has vast agricultural potential, we have witnessed over the past three decades a rise in food imports. This has raised the concern over Africa’s ability to afford its food bill and ensure food security in the continent, while at the same time aiming to eradicate poverty. Poverty reduction strategies that have been reviewed before show that agriculture does deliver more poverty reduction than other sectors, especially in the lower- income countries (Africa included), because it has strong links with other sectors and because poor people participate more in growth from agriculture than in growth from other sector. 1 Thus, the role of agriculture in poverty reduction in Africa cannot be over-emphasised as demonstrated by African government’s willingness to promote the sector through their commitments to the Comprehensive Africa Agriculture Development Programme (CAADP) which aims to boost investment to stimulate growth in the agricultural sector 2 . Using data mainly for the period 2012-2016, this report seeks to provide an overview of Africa’s food-trade. This is achieved by using trade data from the United Nations (UN) International Trade Centre (ITC) TradeMap database. Food products in this report include edible products including fisheries classified under agricultural products in the harmonised system (HS) classification of commodities (HS01-HS22) with exception of HS06 (Live trees, plants, bulbs, roots, cut flowers etc). We note that access to quality and reliable trade data remains a challenge in Africa and therefore at best this analysis is only indicative of the prevailing trends rather than actual situation on ground and as such should treated with caution. Africa’s food trade: overview Taku Fundira TRADE DATA ANALYSIS SEP 2017
Transcript of Africa s food trade: overview - tralac
1
Introduction
Due to population growth, rapid urbanization and changes in dietary patterns, there is fast-growing demand for
agricultural products in global markets and in developing countries. Even though the African continent has vast
agricultural potential, we have witnessed over the past three decades a rise in food imports.
This has raised the concern over Africa’s ability to afford its food bill and ensure food security in the continent,
while at the same time aiming to eradicate poverty. Poverty reduction strategies that have been reviewed
before show that agriculture does deliver more poverty reduction than other sectors, especially in the lower-
income countries (Africa included), because it has strong links with other sectors and because poor people
participate more in growth from agriculture than in growth from other sector.1
Thus, the role of agriculture in poverty reduction in Africa cannot be over-emphasised as demonstrated by
African government’s willingness to promote the sector through their commitments to the Comprehensive
Africa Agriculture Development Programme (CAADP) which aims to boost investment to stimulate growth in
the agricultural sector2.
Using data mainly for the period 2012-2016, this report seeks to provide an overview of Africa’s food-trade.
This is achieved by using trade data from the United Nations (UN) International Trade Centre (ITC) TradeMap
database.
Food products in this report include edible products including fisheries classified under agricultural products in
the harmonised system (HS) classification of commodities (HS01-HS22) with exception of HS06 (Live trees,
plants, bulbs, roots, cut flowers etc).
We note that access to quality and reliable trade data remains a challenge in Africa and therefore at best this
analysis is only indicative of the prevailing trends rather than actual situation on ground and as such should
treated with caution.
Africa’s food trade: overview
Taku Fundira
TRADE DATA ANALYSIS
SEP 2017
2
The Big Picture
As noted, Africa has the potential to feed itself as well as export surplus food to the rest of world, however, this
has not been happening. Part of the problem is attributed to technical, infrastructural and institutional
constraints that bog the Continent. Furthermore, trade distortions arising from (both internal and external)
economic and agricultural policies (especially the protection and subsidies from developed countries and
taxation on food production within Africa) have affected food productivity, production and trade in Africa3.
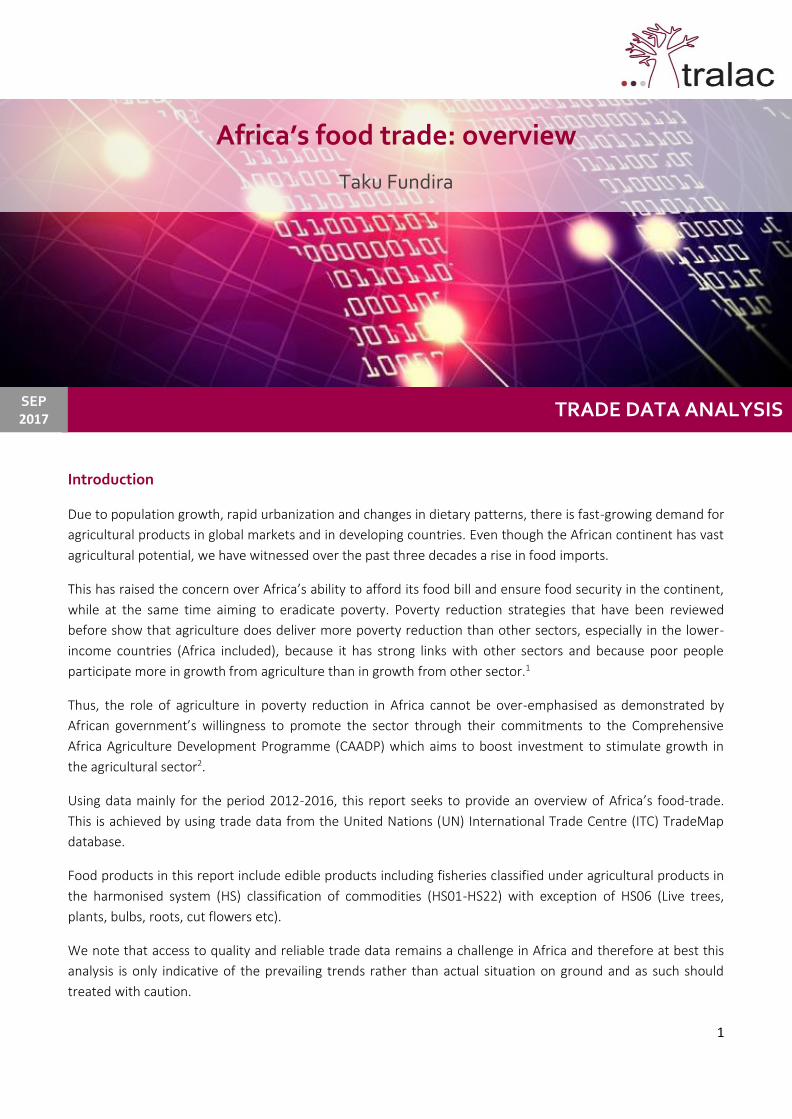
Trade data over the review period 2012 – 2016 reveal that on average Africa’s food trade deficit was around
US$30 billion annually. However, we note that while exports have remained largely unchanged over the review
period, imports have been on the decline, from a high of US$ 83 billion in 2012 down to US$ 65 billion in 2016
representing a 6% decline using compound annual growth rate (CAGR). If current predictions according to
analysts hold, the import bill is expected to rise to US$ 110 billion annually by 20254.
Looking at the global food trade, Africa’s imports and exports are only a small fraction of the world total food
trade. Over the review period 2012 – 2016, African food imports and exports each represented on average
about 6% and 4% of the world’s food imports and exports respectively.
Africa’s food trade overview (2012-2016)
Source: UN ITC TradeMap database
A look at the main African importers and sources of imports reveals the following:
• The top 5 African importers account for 50% of Africa’s total food imports. These include Egypt (15%);
Algeria (12%); South Africa (9%); Morocco (7%) and Nigeria (7%);
• Main sources of imports include the emerging markets of Brazil and India at the top, with several EU
countries also featuring in the top 20 suppliers. Here we note that the EU as a group is the top supplier
of food products due to its long standing traditional trading ties with Africa. South Africa, the only
African supplier in the top 20 is ranked 4th with a 5% share of supply to the African market (from a
global perspective).
0
10,000
20,000
30,000
40,000
50,000
60,000
70,000
80,000
90,000
2012 2013 2014 2015 2016
US$
mill
ion
s
Intra-Africa trade
Africa Exports
Africa Imports
3
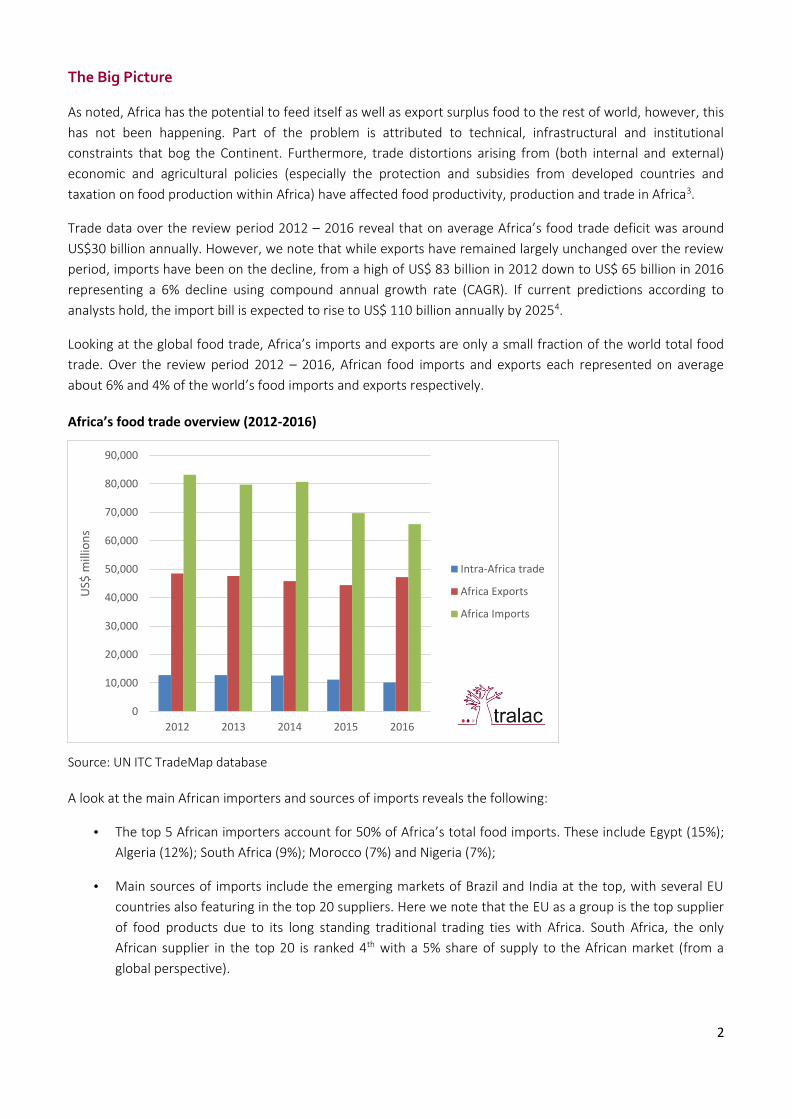
• In general, most countries have experienced declines in imports. This has affected the suppliers as well;
however, countries such as Ivory Coast; Somalia and Benin have either maintained or increased their
imports over the review period 2012 – 2016.
Top 20 African importers and respective suppliers (2012 – 2016) US$ (000)
Importers 2012 2016 % share % CAGR
(2012-16) Suppliers 2012 2016 % share % CAGR
(2012-16)
Africa 83 194 095 65 845 510
-6% Africa 83 194 095 65 845 510
-6%
Egypt 14 482 516 10 131 095 15% -9% Brazil 9 214 142 5 625 841 9% -12%
Algeria 9 183 789 8 117 869 12% -3% France 5 597 608 4 628 468 7% -5%
South Africa 6 791 081 5 747 490 9% -4% India 4 511 229 3 671 829 6% -5%
Morocco 5 047 999 4 619 314 7% -2% South Africa 3 849 890 3 472 565 5% -3%
Nigeria 8 137 915 4 533 107 7% -14% USA 5 470 385 3 238 194 5% -12%
Libya 3 850 723 2 281 049 3% -12% Argentina 4 603 146 2 794 894 4% -12%
Ethiopia 1 274 437 2 198 276 3% 15% Thailand 2 425 182 2 406 437 4% 0%
Angola 5 768 615 2 048 687 3% -23% Russia 2 937 712 2 341 260 4% -6%
Côte d’Ivoire 1 830 023 1 809 392 3% 0% Netherlands 2 304 209 2 106 248 3% -2%
Kenya 1 920 478 1 741 355 3% -2% Spain 1 869 496 1 953 574 3% 1%
Ghana 1 893 455 1 651 752 3% -3% China 2 395 749 1 943 650 3% -5%
Tunisia 2 387 433 1 475 670 2% -11% Malaysia 1 663 962 1 939 583 3% 4%
Benin 881 785 1 290 045 2% 10% Indonesia 2 756 317 1 815 267 3% -10%
Senegal 1 498 956 1 229 527 2% -5% Ukraine 3 801 729 1 801 954 3% -17%
Somalia 1 088 401 1 090 567 2% 0% Germany 1 533 817 1 479 776 2% -1%
Cameroon 1 237 113 1 060 584 2% -4% Canada 1 561 118 1 447 648 2% -2%
Mauritius 1 155 810 1 053 305 2% -2% Italy 1 386 633 1 274 254 2% -2%
Zimbabwe 1 191 526 966 517 1% -5% UK 1 159 528 1 224 059 2% 1%
Djibouti 896 731 878 259 1% -1% New Zealand 1 302 643 1 172 136 2% -3%
Tanzania 1 206 210 849 589 1% -8% Turkey 1 006 593 1 050 711 2% 1%
Rest of Africa 11 469 099 11 072 061 17% -1% Rest of World 21 843 007 18 457 162 28% -4%
Source: UN ITC TradeMap database and author’s calculations
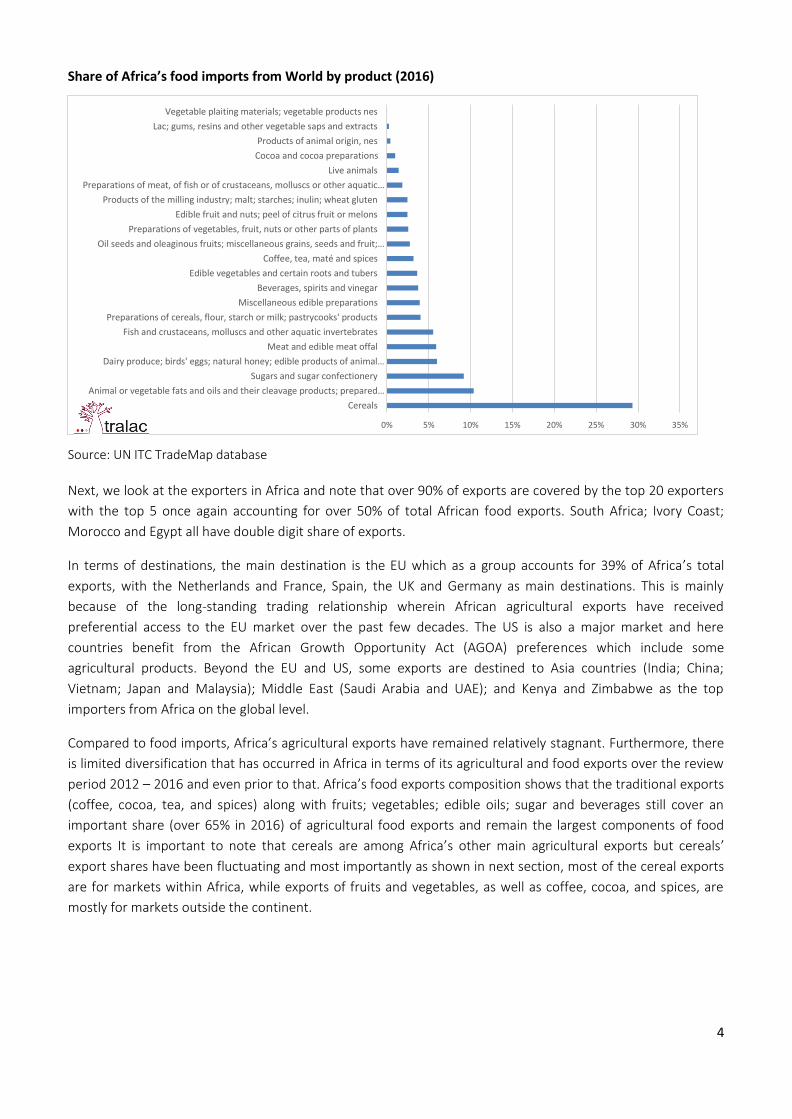
Over the review period, what is striking is the dominance of basic foodstuffs such as dairy products, edible oils
and fats, meat and meat products, sugar and especially cereals, implying that food imports have been
instrumental in ensuring food security in Africa. This is confirmed by trade data which shows that cereals alone
are the largest commodity imports. Although the composition of food imports varied slightly over the review
period, cereals (including rice, maize, and wheat), edible oils; sugar and sugar confectionary; and livestock
products (dairy and meat) at any given period, represented over 60% of Africa total food imports.
4
Share of Africa’s food imports from World by product (2016)
Source: UN ITC TradeMap database
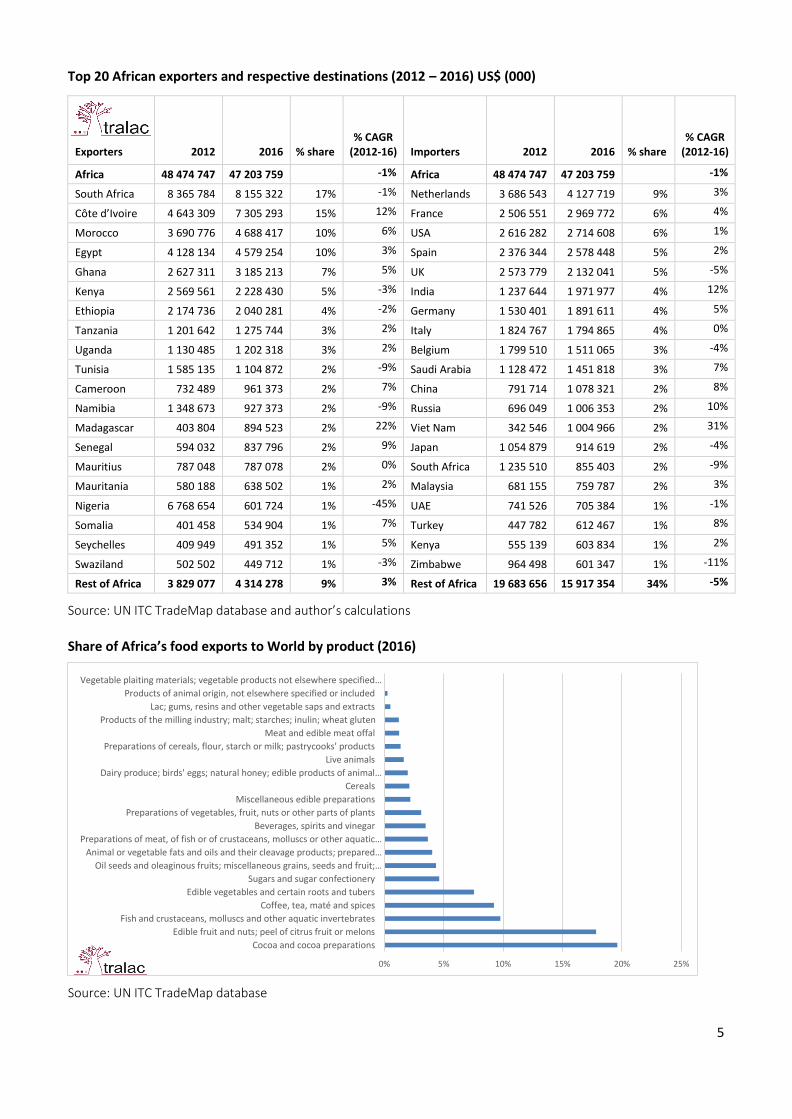
Next, we look at the exporters in Africa and note that over 90% of exports are covered by the top 20 exporters
with the top 5 once again accounting for over 50% of total African food exports. South Africa; Ivory Coast;
Morocco and Egypt all have double digit share of exports.
In terms of destinations, the main destination is the EU which as a group accounts for 39% of Africa’s total
exports, with the Netherlands and France, Spain, the UK and Germany as main destinations. This is mainly
because of the long-standing trading relationship wherein African agricultural exports have received
preferential access to the EU market over the past few decades. The US is also a major market and here
countries benefit from the African Growth Opportunity Act (AGOA) preferences which include some
agricultural products. Beyond the EU and US, some exports are destined to Asia countries (India; China;
Vietnam; Japan and Malaysia); Middle East (Saudi Arabia and UAE); and Kenya and Zimbabwe as the top
importers from Africa on the global level.
Compared to food imports, Africa’s agricultural exports have remained relatively stagnant. Furthermore, there
is limited diversification that has occurred in Africa in terms of its agricultural and food exports over the review
period 2012 – 2016 and even prior to that. Africa’s food exports composition shows that the traditional exports
(coffee, cocoa, tea, and spices) along with fruits; vegetables; edible oils; sugar and beverages still cover an
important share (over 65% in 2016) of agricultural food exports and remain the largest components of food
exports It is important to note that cereals are among Africa’s other main agricultural exports but cereals’
export shares have been fluctuating and most importantly as shown in next section, most of the cereal exports
are for markets within Africa, while exports of fruits and vegetables, as well as coffee, cocoa, and spices, are
mostly for markets outside the continent.
0% 5% 10% 15% 20% 25% 30% 35%
Cereals
Animal or vegetable fats and oils and their cleavage products; prepared…
Sugars and sugar confectionery
Dairy produce; birds' eggs; natural honey; edible products of animal…
Meat and edible meat offal
Fish and crustaceans, molluscs and other aquatic invertebrates
Preparations of cereals, flour, starch or milk; pastrycooks' products
Miscellaneous edible preparations
Beverages, spirits and vinegar
Edible vegetables and certain roots and tubers
Coffee, tea, maté and spices
Oil seeds and oleaginous fruits; miscellaneous grains, seeds and fruit;…
Preparations of vegetables, fruit, nuts or other parts of plants
Edible fruit and nuts; peel of citrus fruit or melons
Products of the milling industry; malt; starches; inulin; wheat gluten
Preparations of meat, of fish or of crustaceans, molluscs or other aquatic…
Live animals
Cocoa and cocoa preparations
Products of animal origin, nes
Lac; gums, resins and other vegetable saps and extracts
Vegetable plaiting materials; vegetable products nes
5
Top 20 African exporters and respective destinations (2012 – 2016) US$ (000)
Exporters 2012 2016 % share % CAGR
(2012-16) Importers 2012 2016 % share % CAGR
(2012-16)
Africa 48 474 747 47 203 759
-1% Africa 48 474 747 47 203 759
-1%
South Africa 8 365 784 8 155 322 17% -1% Netherlands 3 686 543 4 127 719 9% 3%
Côte d’Ivoire 4 643 309 7 305 293 15% 12% France 2 506 551 2 969 772 6% 4%
Morocco 3 690 776 4 688 417 10% 6% USA 2 616 282 2 714 608 6% 1%
Egypt 4 128 134 4 579 254 10% 3% Spain 2 376 344 2 578 448 5% 2%
Ghana 2 627 311 3 185 213 7% 5% UK 2 573 779 2 132 041 5% -5%
Kenya 2 569 561 2 228 430 5% -3% India 1 237 644 1 971 977 4% 12%
Ethiopia 2 174 736 2 040 281 4% -2% Germany 1 530 401 1 891 611 4% 5%
Tanzania 1 201 642 1 275 744 3% 2% Italy 1 824 767 1 794 865 4% 0%
Uganda 1 130 485 1 202 318 3% 2% Belgium 1 799 510 1 511 065 3% -4%
Tunisia 1 585 135 1 104 872 2% -9% Saudi Arabia 1 128 472 1 451 818 3% 7%
Cameroon 732 489 961 373 2% 7% China 791 714 1 078 321 2% 8%
Namibia 1 348 673 927 373 2% -9% Russia 696 049 1 006 353 2% 10%
Madagascar 403 804 894 523 2% 22% Viet Nam 342 546 1 004 966 2% 31%
Senegal 594 032 837 796 2% 9% Japan 1 054 879 914 619 2% -4%
Mauritius 787 048 787 078 2% 0% South Africa 1 235 510 855 403 2% -9%
Mauritania 580 188 638 502 1% 2% Malaysia 681 155 759 787 2% 3%
Nigeria 6 768 654 601 724 1% -45% UAE 741 526 705 384 1% -1%
Somalia 401 458 534 904 1% 7% Turkey 447 782 612 467 1% 8%
Seychelles 409 949 491 352 1% 5% Kenya 555 139 603 834 1% 2%
Swaziland 502 502 449 712 1% -3% Zimbabwe 964 498 601 347 1% -11%
Rest of Africa 3 829 077 4 314 278 9% 3% Rest of Africa 19 683 656 15 917 354 34% -5%
Source: UN ITC TradeMap database and author’s calculations
Share of Africa’s food exports to World by product (2016)
Source: UN ITC TradeMap database
0% 5% 10% 15% 20% 25%
Cocoa and cocoa preparations
Edible fruit and nuts; peel of citrus fruit or melons
Fish and crustaceans, molluscs and other aquatic invertebrates
Coffee, tea, maté and spices
Edible vegetables and certain roots and tubers
Sugars and sugar confectionery
Oil seeds and oleaginous fruits; miscellaneous grains, seeds and fruit;…
Animal or vegetable fats and oils and their cleavage products; prepared…
Preparations of meat, of fish or of crustaceans, molluscs or other aquatic…
Beverages, spirits and vinegar
Preparations of vegetables, fruit, nuts or other parts of plants
Miscellaneous edible preparations
Cereals
Dairy produce; birds' eggs; natural honey; edible products of animal…
Live animals
Preparations of cereals, flour, starch or milk; pastrycooks' products
Meat and edible meat offal
Products of the milling industry; malt; starches; inulin; wheat gluten
Lac; gums, resins and other vegetable saps and extracts
Products of animal origin, not elsewhere specified or included
Vegetable plaiting materials; vegetable products not elsewhere specified…
6
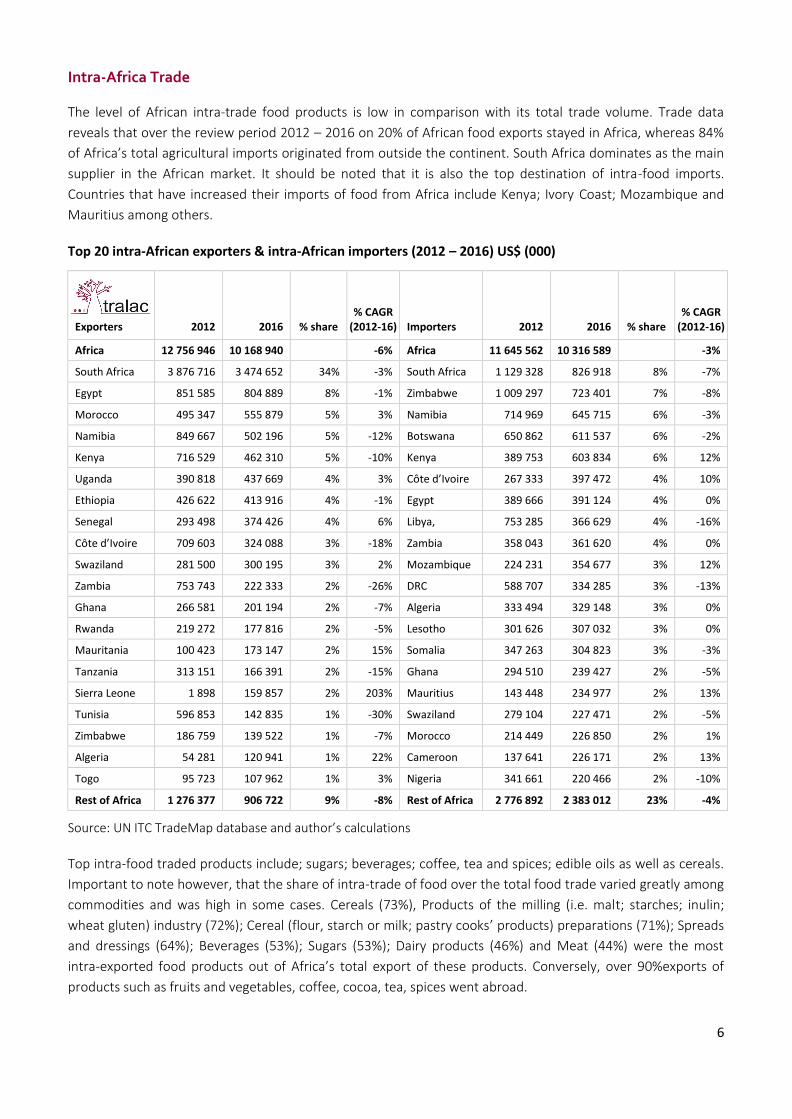
Intra-Africa Trade
The level of African intra-trade food products is low in comparison with its total trade volume. Trade data
reveals that over the review period 2012 – 2016 on 20% of African food exports stayed in Africa, whereas 84%
of Africa’s total agricultural imports originated from outside the continent. South Africa dominates as the main
supplier in the African market. It should be noted that it is also the top destination of intra-food imports.
Countries that have increased their imports of food from Africa include Kenya; Ivory Coast; Mozambique and
Mauritius among others.
Top 20 intra-African exporters & intra-African importers (2012 – 2016) US$ (000)
Exporters 2012 2016 % share % CAGR
(2012-16) Importers 2012 2016 % share % CAGR
(2012-16)
Africa 12 756 946 10 168 940
-6% Africa 11 645 562 10 316 589
-3%
South Africa 3 876 716 3 474 652 34% -3% South Africa 1 129 328 826 918 8% -7%
Egypt 851 585 804 889 8% -1% Zimbabwe 1 009 297 723 401 7% -8%
Morocco 495 347 555 879 5% 3% Namibia 714 969 645 715 6% -3%
Namibia 849 667 502 196 5% -12% Botswana 650 862 611 537 6% -2%
Kenya 716 529 462 310 5% -10% Kenya 389 753 603 834 6% 12%
Uganda 390 818 437 669 4% 3% Côte d’Ivoire 267 333 397 472 4% 10%
Ethiopia 426 622 413 916 4% -1% Egypt 389 666 391 124 4% 0%
Senegal 293 498 374 426 4% 6% Libya, 753 285 366 629 4% -16%
Côte d’Ivoire 709 603 324 088 3% -18% Zambia 358 043 361 620 4% 0%
Swaziland 281 500 300 195 3% 2% Mozambique 224 231 354 677 3% 12%
Zambia 753 743 222 333 2% -26% DRC 588 707 334 285 3% -13%
Ghana 266 581 201 194 2% -7% Algeria 333 494 329 148 3% 0%
Rwanda 219 272 177 816 2% -5% Lesotho 301 626 307 032 3% 0%
Mauritania 100 423 173 147 2% 15% Somalia 347 263 304 823 3% -3%
Tanzania 313 151 166 391 2% -15% Ghana 294 510 239 427 2% -5%
Sierra Leone 1 898 159 857 2% 203% Mauritius 143 448 234 977 2% 13%
Tunisia 596 853 142 835 1% -30% Swaziland 279 104 227 471 2% -5%
Zimbabwe 186 759 139 522 1% -7% Morocco 214 449 226 850 2% 1%
Algeria 54 281 120 941 1% 22% Cameroon 137 641 226 171 2% 13%
Togo 95 723 107 962 1% 3% Nigeria 341 661 220 466 2% -10%
Rest of Africa 1 276 377 906 722 9% -8% Rest of Africa 2 776 892 2 383 012 23% -4%
Source: UN ITC TradeMap database and author’s calculations
Top intra-food traded products include; sugars; beverages; coffee, tea and spices; edible oils as well as cereals.
Important to note however, that the share of intra-trade of food over the total food trade varied greatly among
commodities and was high in some cases. Cereals (73%), Products of the milling (i.e. malt; starches; inulin;
wheat gluten) industry (72%); Cereal (flour, starch or milk; pastry cooks’ products) preparations (71%); Spreads
and dressings (64%); Beverages (53%); Sugars (53%); Dairy products (46%) and Meat (44%) were the most
intra-exported food products out of Africa’s total export of these products. Conversely, over 90%exports of
products such as fruits and vegetables, coffee, cocoa, tea, spices went abroad.

7
The most intra-imported products were coffee, cocoa, and tea (41%), Beverages (33%); Fisheries (32%); and
Preparations of meat or fish (31%). While some African countries have been importing their cereals, oils and
fats, and dairy products from other African countries, such intra-imports have remained less than 10% of
Africa’s total imports for these products; the rest, about 90 percent, is imported from outside the continent,
especially from EU, Brazil, India, the US among others as highlighted already.
Comparison of African intra-imports and intra-exports of food (2016)
Source: UN ITC TradeMap database
In conclusion, there is scope for Africa to become a surplus food exporter. However, this requires several
changes to the business as usual approach, with less rhetoric and more concerted efforts, especially in terms of
implementation of policy, increased productivity, skills development and enhanced market integration. There is
therefore a need to shift from primary agricultural exports to value added processing. Here the whole value
chain from variety, seed, harvest, storage, processing, and export should be strengthened. Access to finance
and security of tenure are areas that also need serious considerations given that traditional approaches to
financing in Africa have had limited success rates. Lastly African countries should take advantages of
opportunities that arise from regional integration and the tripartite and continental free trade agreements
(TFTA and CFTA) have the potential to increase intra-regional trade and promote regional value chain
development and food security in Africa.
1 Christiaensen, L. Demery, L. 2007. Down to Earth: Agriculture and Poverty Reduction in Africa, The World Bank, Washington. [online]: http://siteresources.worldbank.org/INTPOVERTY/Resources/335642-1130251872237/DownToEarth _final.pdf 2 See: http://www.nepad.org/programme/comprehensive-africa-agriculture-development-programme-caadp 3Rakotoarisoa, M.A. Iafrate, M. Paschali, M. 2011. Why Has Africa Become a Net Food Importer? Explaining Africa agricultural and food trade deficits, Food and Agricultural Organisation, Rome, [online]: http://www.fao.org/docrep/015 /i2497e/i2497e00.pdf 4 IFAMA, 2017. Bucking the trend of Africa’s Food Trade Deficit, Panel Discussion, International Food and Agribusiness Management Association (IFAMA) World Conference, Miami, Florida. [online]: http://www.bfap.co.za/documents/ Articles%20and%20Conference%20Papers/IFAMA%20Africa%20Panel%202017%20final.pdf