Financing livestock services insome countries of East …pdf.usaid.gov/pdf_docs/PNAAS226.pdf · LPU...
41
LPU WORKING PAPER No. 6 Financing livestock services in some countries of East and southern Africa ADDIS ANTENEH FEBRUARY 1985 INTERNATIONAL LIVESTOCK CENTRE FOR AFRICA (ILCA) ADDIS ABABA, ETHIOPIA
Transcript of Financing livestock services insome countries of East …pdf.usaid.gov/pdf_docs/PNAAS226.pdf · LPU...
LPU WORKING PAPER No. 6
Financing livestock services insome countries of East
and southern Africa
ADDIS ANTENEH
FEBRUARY 1985
INTERNATIONAL LIVESTOCK CENTRE FOR AFRICA (ILCA) ADDIS ABABA, ETHIOPIA

3
LPU
In 1982 the International Livestock Centre for Africa (ILCA) established a Livestock Policy Unit (LPU).
The objectives of the LPU are:
1. To heighten 'he awareness in African governments and in other organisations of the importance of livestock policy issues.
2. To collate in an easily assimilable form what is already known about policy issues and to present it to policy makers
To carry out research of its own (includingthat commissioned from consultants) on priority livestock policy issues and to present the results to policy makers.
4. To encourage others to carry out similar research and to assist Inpresenting their rmults to policy makers.
LPU Working Papers Staff members and consultants of the LPU write working papers at several stages during their research on a topic Puolication or the final results of research may not occur until several years after tileresearch starled The LPU. therefore. makes its working documents available to anyone requesting them in order to provide access to data and ideas on African ivestock policy issues as early as possible to those with a need for them.
This is an LPU working paper It has f of oen nrepareo in accordance with procedures appropriate to formal printed texls, and ILCA accepis n roepons:b,,y for errors. Both data and ideas are subject to revision. The views and irterpretattoas in thiS duocunerit are those of the author and should not be attribluted to ILCA ILCA however retains copyright and reserves all othe' rights.
A list of all LPLJ working papers is g ven on the back page of this document, together with the adr..s from which they may be ordered.

LPU WO1RKING PAPER NO. 6
Financing livestock services in some countries
of East and southern Africa
ADDIS ANTENEH
FEBRUARY 1985
INTERNATIONAL LIVESTOCK CENTRE FOR AFRICA (ILC
ADDIS ABABA, ETHIOPIA

SUMMARY
Like many other agricultural services, livestock services in most African countries are funded from central government budgets. In many cases government funds are becoming increasingly inadequate in the face of growing livestock populationr and the high demand for such services. In many African countries staff expenditureshave tended to take a large cnd increasing portion of total recurrent expenditure and prima facie this seems to affect adversely tMe effective provision of services at field level.
Government revenues originating from service fees have fallen far short of government outlays for livestock services and governments continue to subsidi2e heavily the cost of services. The number of staff available and the ratio between different staff categories affect the capacity of' the services to carry out their functions more effectively.
This paper, which is the second in it series reviewing the financing of livestock services " A -rica, describes the si! lation in six East ar J southern African c,untries. The contribution of he livestock sector to agricultural output and the size of the recurrent expenditure on livestock services are briefly discussed. The composition of expenditure termsin of slatf and non-staff categories as well as the sources and methods of financing including revenues collectec from service fees and sale of veterinary requisites compared.are Although the impact of the size and composition of expenditures on production or on the welfare of users cannot be quantified at this stage, some measures of adequacy are discussed. A comparison of some important patterns of expenditure of the six countries and of those reviewed in an earlier study is briefly outlined.
Acknowledgements
Stephen Sandford reviewed and commented on earlier drafts of the paper; Gil
Rodriguez, Jr. substantially helped in sharpening the concept of the relative expenditure to GDP ratio as a measure of adequacy. Tibebu Deribe assisted in compiling and tabulating the Kenya data. The author gratefully acknowledges their contribution.
Many thanks are also due to all those government officials in the six countries who cooperated in either providing information themselves or making it possible for the author to get access to documents. Any errors in judgement or omissions of fact,
however, remain the auth3r's responsibility.
CONTENTS'
Page
11. INTRODUCTION
2. THE ROLE OF LIVESTOCK IN THE ECONOMY 2
3. THE SIZE AND COMPOSITION OF RECURRENT EXPENDITURE 2
4. SOURCES AND METHODS OF FINANCING 9
5. INDICATIVE MEASURES OF ADEQUACY 16
21
24
6. CONCLUSION
REFERENCES
ANNEX TABLE3

1. Introduction
1.01 The paper is the second in a series reviewing the f;nancing of livestock services in Africa. The first paper dealt with about 13 countries in West Africa plus Madagascar (Anteneh, 1983) and was based on a review of the available literature. Sources of data for the present paper are government and non-government published and unpublished documents as well as information supplied by individuals. The countries covered by the review are Botswana, Kenya, Malawi, Tanzania, Zambia and Zimbabwe. Unless otherwise indicated, sources of tables
in text are the same as those indicated in the annex tablesl/ and the reference
list at the end of the paper.
1.02 The paper is divided into five sections. Section 2 which follows this introduction
presents a brief picture of the role of livestock in the economies of the different countries. Section 3 deals with the size and composition of the livestock services budget. Section 4 reviews the sources and methods of financing in the countries considered. Section 5 attempts to evaluate the adequacy of livestock services by using measures which are normally used in assessing such services. Section
6 concludes with a comparison of some important patterns of expenditure in the West African countries reviewed in the first paper and in those dealt with
in the present paper.
1.03 Like the first paper, this rev,.!w also concentrate., on the recurrent budgetary
allocation by central government or the actual expenditure by the departments responsible for the provision of livestock services. Data on in-country local or regional allocations are hard to come by. A' exception is Tanzania where there has been a deliberate attempt at decentrah ... Jon.
I/ Annex tables Al to A6 provide detailed information on expenditures and other related data summarized and discussed in the text.
-l
2. The role of livestock in the economy
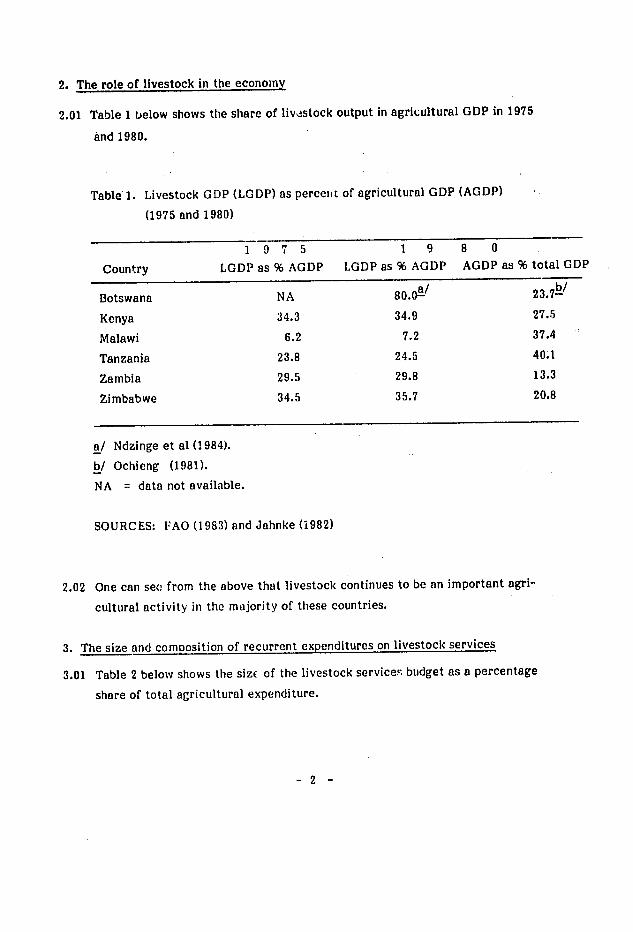
2.01 Table 1 below shows the share of livestock output in agrikultural GDP in 1975
and 1980.
Table 1. Livestock GDP (LGDP) as perceit of agricultural GDP (AGDP)
(1975 and 1980)
1 9 7 5 1 9 8 0
Country LGDP as % AGDP LGDP as % AGDP as % total GDPAGDP
Botswana NA 80.0Y 23.7A/
Kenya 34.3 34.9 27.5
Malawi 6.2 7.2 37.4
Tanzania 23.8 24.5 40.1
Zambia 29.5 29.8 13.3
Zimbabwe 34.5 35.7 20.8
a/ Ndzinge et al (1984).
b/ Ochieng (1981).
NA = data not available.
SOURCES: FAO (1983) and Jahnke (1982)
2.02 One can see from the above that livestock continues to be an important agri
cultural activity in the majority of these countries.
3. The size and composition of recurrent expenditures on livestock services
of the livestock service!, budget as a percentage3.01 Table 2 below shows the sizE
share of total agricultural expenditure.
-2

Table 2.! Percentage share of livestock services in total agricultural recurrent
expenditure by governments.
Country 1970/71 1971/72 1973/74 1975/76 1977/78 1979/80 1980/81< 1981/82
Botswana 53 51 56 55 50 48 54 51
Kenya NA NA 33./ 32 30 37 23 27
Malawi 27 24 24 23 NA 21 21 23
Tanzania 23 NA NA 64 61 34 47 34
Zambia 7 lu 15 5 7 2 NA 4
Zimbabwe 10 NA NA 10b / 6 9 10 19
a/ 1974/75.
b/ 1976/77.
NA = data not available.
SOURCE: IMF (1982) for total agricultural expenditure.
3.02 Table 3 shows the average growth rate of actual expenditure over varying
perids for the different countries.
Table 3. Annual growth rates in certain governments' recurrent expenditure (percent
per year).
Livestock services Agricultural services Period covered Current Constant Constant prices
Prices (Prices (1975) (1975)
Botswana 1970/71-1979/80 14.2 3.6 4.7
Kenya 1974/75-1980/81 9.9 4.8 6.2
Malawi 1970/71-1979/80 9.2 3.4 7.2
Tanzania 1974/75-1979/80 2.6 - 3.0 - 9.0
3

3.03 In Botswana, Kenya and Malawi recurrent expenditure on livestock services
grew by less than 5% per year while inranzania it declined by about 30o on
average. Compare these growth rates with the growth rate of recurrent
budgetary expenditure for agriculture as a whole. During the same periods
shown, except for Tanzania where it declined by an average of 9% p.a., recurrent
budgetary expenditure for agriculture as a whole in the other three countries
grew at a faster rate than expenditure on livestock services.
3.04 The fcllowing discussion on the composition of recurrent expenditure heavily
emphasizes the aspect of how much of the total is allocated to staff and non
staff categories of expenditure. One important reason for emphasizing this
aspect is that it is a variable over which those responsible for livestock services
(at departmental level) have greater control, and which can be manipulated
to provide more effective services at field level (Sandford. 1983).
3.05 Table 4 below shows that the non-staff expenditure (NSE) category, which
comprises such items as internal transport and travel, purchase of vcccines.
drugs etc. and other operating expenditures, grew at a much faster rate than
the staff expenditure (SE) category. While one can generally say that this
is a much healthier sign than is usually the case in many other African countries
(see Anteneh, 1983 for West African countries), it may also be indicative of
the absolute shortage of staff available for livestock services in the face of
an increasing livestock population.
Table 4. Growth rates of recurrent expenditure on staff (SE') and non-staff (NSE)
categories (% p. a.) (1975 constant prices)-.
SE NSE
Botswana 0.4 4.0
Kenya 4.6 4.1
Malawi 0.6 5.0
Tanzania - 6.1 5.4
Zimbabwe 4.0 38.0
a/ Periods covered for each country are the same as in Table 3 above.
-4

3.06 The growth rates in the allocation to non-staff expenditure could Indicate
the concerted efforts of government to provide more effective services.
However, it does not necessarily mean that these growth rates have really
affected the relative share of staff and non-staff expenditure in the total.
table 5 beelow shows the percentage shares of SE anC NSE.
Table 5. Percentage shares of SE and NSE in recurrent expenditure on livestock
services.
Average 1970/71-74/75 75/76 75/77 77/78 78/79 79/80 80/81 81/82
Botswana SE 41 33 36 26 32 26 21 21
NSE 59 67 64 74 68 74 79 79
Kenya SE NA 42 48 51 41 39 51 69
NSE NA 58 52 49 59 61 49 31
Malawi SE 46 38 32 38 45 39 37 34
NSE 54 62 68 62 55 61 63 66
Tanzanian/ SE 76111 70 71 60 55 60 61 54
24b/ NSE 30 29 40 45 40 39 46
Zambia SE 32S/ NA NA 46 50 NA 45 NA
NSE 68 NA NA 54 50 NA 55 NA
Zimbabwe SE 471/ NA 57 61 54 49 48 32 /NSE 53A_ NA 43 39 46 51 52 68
a/ Dati for years prior to 1974/75 available only for central government, figures
from 1974/75 include regional expenditure.
b/ 1974/75 only.
c/ Average of 1970-72 and 1974.
d/ Average of 1971/72 and 1972/74.
NA = data not available.
- 5

3.07 In the case of Botswana, taking into account the relative low share of SE'at
the beginning of the period considered, one can see that consistent with the differential growth rates, tL.a share of staff ex.:enditures has declind from about 40%'at the beginning of the period to about 20% in 1981/82. In Malawi, where the differential growth rate in SE and NSE is similar to that of Botswana, there has been a substential decline in the share of SE, although lo a lesser degree. One possible cause for this in both ccuntries is the limited availability
of professional and technical staff to provide livestock services. Another possible cause is the replacement of highly paid contract expatriate staff by local professionals without the total number being affected, although the extent to which this has taken place could not be determined. In Botswana the number of high-level veterinary staff remained at about the same level from 1973/74 through 1981/82 while the livestock population increased by more than 25% during the same period. FMD control campaigns from 1974/75 onwards have contributed to the increased share of NSE in total expenditure for livestock services. Increased fuel prices should have also resulted in higher
transport expenditure.
3.08 In Malawi, a country comprising a much zmailer ar,±a and a more denselyrsettled livestock-keeping population, veterinary staff in total increased to about 1.2 times their number in 1971/72 against an increase of 1.5 times in the livestock population (LSU). In both Botswana and Malawi government officials have stated that fund availability is not a major constraint.
3.09 In Kenya the relative proportions of SE and NSE were very similar to those in Botswana at the beginning of the period. When available manpower is not a major constraint, the cause for the substantial reversal, during 1980-1982, of the percentage shares must lie somewhere else. The sharpdecline in the percentage share of non-staff e: 'penditures during these years is largely attributed to the financial crisis which set in at the beginring of 1980. This has obviously forced the government to cut down on funding the non-staff operating costs of livestock services while keeping a relatively large establishment of professional and technical personnel under continued employment. In 1980/81 there were about 2600 professional and technical staff of all categories in the government establishment for livestock
development.
-6

3.10 The composition of the livestock services budget in Tanzania presents a
substantially different picture -- SE has consistently had the larger share of
tbtal recurrent expenditures. The shares of staff and non-staff expenditures
i tota7 recuirrent livestock expenditures are markedly different in the central
doverhment's budget compared to the regions (see Annex Table A4). We will rdWtrh to this aspect at a later stage of the paper.
3.11 From Tables 4 and 5 above one can readily see that in Tanzania the SE 1O'rcentage share remains higher than that of NSE despite absolute decreases
in' staff expenditure and the high growth rate of the absolute values for NSE.
While the Tanzanian data for both SE and NSE show considerable fluctuation
;between years, this is more pronounced for the NSE figures (see Annex Table
A4). Fluctuations ranging sometimes between 25 and 50% up or down from
one year to another cast serious doubt on the reliability of the data found in official publications. Despite this, while financial constraints affecting
* NSE should partly explain the continued high percentage share of SE in total
recirrent livestock expenditure. lack of data on the staffing situation of livestock services did not make it possible to see whether the prevailing situation
in Tanzania is similar to that in Kenya.
3.112 There are significant differences between the composition of central government
and regional budgets (see Annex Table A4). In Tanzania, a deliberate programme
of decentralization of development including separate regional budgetary
allocations has been in operation for some years. Such decentralization
apparently started some time in 1972 but it did not become operational in
budgeting terms until 1974/75. Published estimates on budgetary allocations
are available starting from that year.
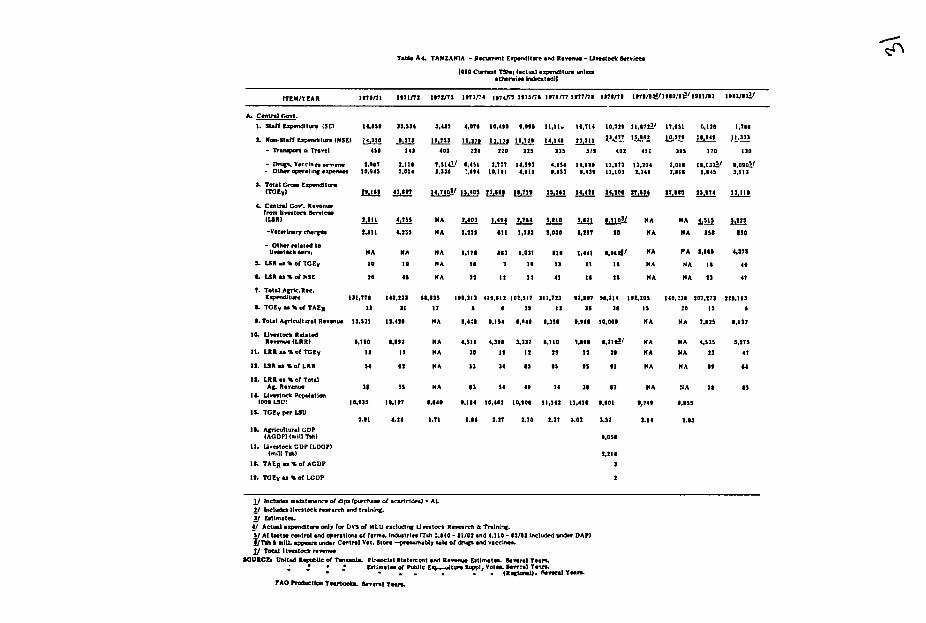
3.101 Table A4 in the annex shows that the composition of the recurrent livestock
'expenditure at the central government level in Tanzania is radically different
from that of regional expenditure. During the period 1974/75-1981/82 staff
expenditure at the central government level had on average a 381A, share (with
a range of 24-63% between different years) in the total recurrent expenditure
on livestock services as opposed to an average of 77% (range of 61-93%) at
the regional level or 63% (range of' 54-76%) of the combined central and regional
* expeii'ditul'es. Judging by the level of expenditure which obtained prior to
1974'Y7l)ahd thereafter, there is'no eviden'ce that the decentralization process
- 7

has substantially shifted expenditure on livestock services from the central
administration to the regions. In other words, it seems that the expenditure budget for livestock services at the central gover-iment level has more or less been maintained while additional allocations were made to the regions.
This being the case, the relatively small share of operating expenditures -which
continued to be allocated at the regional level could be a signa, of the potentially
limited effectiveness of regionally posted staff without enough funds for transport and material inputs to provide veterinary and hitsbandry services. The causes for this situation are likely to be more fundamental than can be deduced from the figures shown. However, the reported intention of the Tanzanian Government to recentralize agriculture and livestock services is
probably indicative of how much less effective than expected decentralization
has been in the provision of field services.
3.14 The data for Zambia are not available continuously over the years, and
calculating growth rates of the recurrent expenditures on livestock services
does not make much sense. However, it can be generally said that total recurrent expenditure has declined in real terms over the years,, with
non-staff expenditures having decreased in 1980 to about 40% of the absolute
figure in 1971. Staff expenditures fluctuated over the years, amounting in 1980 to about 90% of those in. 1971, again in real terms. Staff numbers in
all categories seem to have remained at the same level.
3.15 Although one cannot be conclusive on the basis of the data available (only
for 4 years out of a possible 8), it seems probable that financial constraints
have played an important role in the decrease of both the total recurrent and non-staff expenditures over the yerrs. In the latter case in particular budgetary cuts seem to have bee! a more imporiant cause. For example, in 1982 about
86% of all the reductions made from allocated budgets were accounted for by reductions in the no',-staff budgets. These reductions were made due to economy measures which seem to have aff'ected solely non-staff operating
expenditures. In 1978, as much as 30% of the under-expenditure of. the
authorized budget for veterinary services was accounted for by "non-availability
of vaccines and drugs".
3.16 In Zimbabwe the share of staff expenditure in the total recurrent expenditure
on livestock services was relatively high during 1976/77 through 1978/79 but started declining relatively rapidly to become only 32% of the total in 1981/82.
-8

In current prices, total expenditures as well as expenditures in both categories
of recurrent expenditure grew at very high rates, with NSE having increased
by about 38% p. a. on average. As in other sectors of the Zimbabwean economy,
the manpower situation during and after the liberation war became increasingly
acute. Although only 1-year data could be obtained on the number of different
categories of staff available, it is a fact that the outmigration of a considerable
number of the professional/technical cadre of while Rhodesians has depleted
the pool of adequately trained and experienced staff in livestock services.
it is most likely that staff ex'penditure has been affected more by this event
than the lack of funds in absolute terms.
Sources and methods of financing
4.01 In Botswana, Malawi and Zambia funding for recurrent expenditure on livestock
services is provided by the central treasury through the department responsible
for livestock services. The same is mostly true in Kenya. But here, community
dips had been run by county councils until they were recentralized following
misallocation problems which adversely affected animal disease control
operations (FAO, 1981). As mentioned earlier, in Tanzania there are distinct
regional allocations under the control of regional administrations, even though
the funds are provided by the central government. At the same time, regions
seem to be allowed to collect veterinary service charges but have no authority /
to use these funds without going through the central allocation process.
In Zimbabwe, dipping services used to be run by district commissioners who
could use the proceeds from the dipping charges to run the service with some
central government support when revenue fell short. This arrangement was
said to work quite satisfactorily. Recently dipping services have been
transferred to the Department of Veterinary Services which must surrender
any collections from user fees to the Central Treasury. Dipping services are
now provided free of charge (Madzima, personal communication).
4.02 There is no evidence available in any of the six countries studied that recurrent
expenditures for the provision of non-capital, on-going livestock services draw
2/ Tanzania is strongly committed to central planning; funds collected have to be
vetted through the planning process before they can be allocated to a particuar
activity (Mrisho, personal communication).
9

'on ary external sources of financing. However, many livestock development
projects are heavily dependent on external financing from several sources. There are details of sources of financing in the development budget estimates
for Kenya and Malawi. In Kenya, up to 50% of capital items in livestock
development projects have been financed by external loans and grants; it is
only in a few cases that expenditures of a recurrent nature (e.g. salaries an('
wages of local project personnel, non-staff operating expenditures such as
for transport) are financed from external sources. In contrast, in Malawi external loans and grants financed between 85 and 90% of the development
budget expenditures and in almost all cases include both capital and recurrent items, the latter including personal emoluments. Despite initial plans to
gradually shift the funding of recurrent expenditures to the revenue accounts
of the government, it has been observed that the same projects continue to show the same share of financing from external sources over relatively long
periods (e.g. UK financed projects).
4.03 Part of the problem arises because governments are unwilling to charge for
certain, even beneficiary-specific, services to meet part of the operating cost
necessary to maintain such services. In one case donor pressure to reduce
service charges to a low level could have been the reason for the inability
of government to maintain project-introduced services or even to re-introduce nominal economic charges -- Kenya's Al service exemplifies this problem
(Leonard, 1983).
Livestock-related revenue
4.04 There is no evidence from published information that any of the six countries
charges livestock head taxes similar to those which used to be charged in West
African countries.
4.05 Other taxes, charges and levies used are in the majority of cases associated
with veterinary services, which normally include artificial insemination services.
Export and import duties on live animals and livestock products are a feature
of many of the suinplus producing countries. 3 / Botswana has the most extensive
tax levy on cattle export and livestock by-products which include blood -,
3/ Kenya levies a cess on hides and skins exports which are earmarked for hides and skins improvement programmes (Leonard, 1983). Zimbabwe does not levy taxes on live animal exports (Rodriguez, personal communication).
- 10
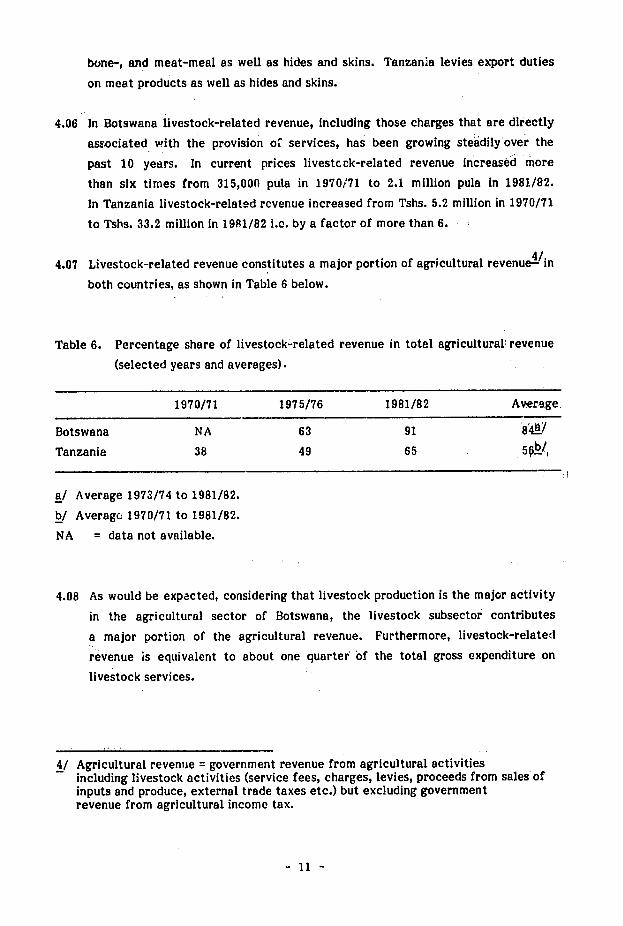
bone-, and meat-meal as well as hides and skins. Tanzania levies export duties
on meat products as well as hides and skins.
4.06 In Botswana livestock-related revenue, including those charges that are directly
associated with the provision of services, has been growing steadilyover the
past 10 years. In current prices livestcck-related revenue increased more
than six times from 315,000 pula in 1970/71 to 2.1 million pula in 1981/82.
In Tanzania livestock-related revenue increased from Tshs. 5.2 million in 1970/71
to Tshs. 33.2 million in 19A1/82 i.c. by a factor of more than 6.
4.07 Livestock-related revenue constitutes a major portion of agricultural revenue4/in
both countries, as shown in Table 6 below.
Table 6. Percentage share of livestock-related revenue in total agricultural: revenue
(selected years and averages).
1970/71 1975/76 1981/82 Average
!Botswana NA 63 91 84YP65 51 b /
Tanzania 38 49
a/ Average 1973/74 to 1981/82.
b/ Average 1970/71 to 1981/82.
NA = data not available.
4.08 As would be expected, considering that livestock production is the major activity
in the agricultural sector of Botswana, the livestock subsector, contributes
a major portion of the agricultural revenue. Furthermore, livestock-related
revenue is equivalent to about one quarter' of the total gross expenditure on
livestock services.
4/ Agricultural revenue = government revenue from agricultural activities including livestock activities (service fees, charges, levies, proceeds from sales of inputs and produce, external trade taxes etc.) but excluding government revenue from agricultural income tax.
- 11

calculations involving livestock-related4.09 bue to lack of readily available data,
cannot be made for the other five countries. However, data on revenuerevenue are availableon some of the services providedcollected from charges and fees
for most of the countries studied from government-published data ,of several
Table 7 below shows the amounts of such collections over-the years.years.
Revenue from service fees, sale of inputs and produce '('000 nationalTable 7.
at 1975 constant prices).currencies
GrowthAverage 1970/71- 1975/76 1976/77 1977/78 1978/79 1979/80 1980/81 rate
p.a. (%)1974/75
379 443 444 392 NA 29 Botswana (Pula) 109 351
708 1288 1.4_/Kenya (Kshs) 1130 1172 1369 1073 736
309 4.2408 342 NAMalawi (MK) 379 435 449
NA 12.1 b / 2128 3776 3600 5382 NATanzania (Tshs) 3399
NA 35 28 NA 19 52 a /
14 NAZambia (ZK)
a/ 6 years to 1980/81.
b/ 4 years to 1978/79.
NA = date not available.
4.10 Three major categories constitute revenue from livestock services:
a) veterinary fees and cesses;
b) collection from the sale of drugs, vaccines, semen etc.; and
c) proceeds from the sale of livestock and livestock products from research
the more importantstations and similae establishments. For our purposes
the revenues collected' from the 'first twoand comparable figures are
directly to the quantity of services provided.categories, as they relate more
impressive. However,4.11 The growth rates for some countries shown in Table 7 are
LSU using a common currency are a comparison of revenues collected per
more revealingasshown in Table 8 below.
12
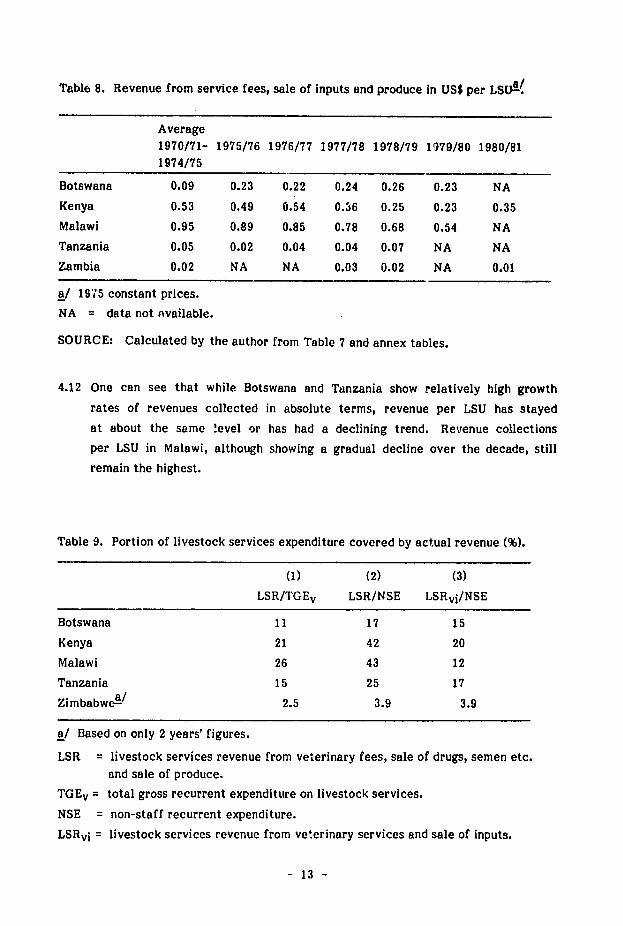
Table 8. Revenue from service fees, sale of inputs and produce in US$ per LSU -
Average 1970/71- 1975/76 1976/77 1977/78 1978/79 1979/80 1980/81 1974/75
Botswana 0.09 0.23 0.22 0.24 0.26 0.23 NA
Kenya 0.53 0.49 0.54 0.36 0.25 0.23 0.35
Malawi 0.95 0.89 0.85 0.78 0.68 0.54 NA
Tanzania 0.05 0.02 0.04 0.04 0.07 NA NA
Zambia 0.02 NA NA 0.03 0.02 NA 0.01
a/ 1975 constant prices.
NA = data not available.
SOURCE: Calculated by the author from Table 7 and annex tables.
4.12 One can see that while Botswana and Tanzania show relatively high growth
rates of revenues collected in absolute terms, revenue per LSU has stayed
at about the same !evel or has had a declining trend. Revenue collections
per LSU in Malawi, although showing a gradual decline over the decade, still
remain the highest.
Table 9. Portion of livestock services expenditure covered by actual revenue (%).
(1) (2) (3)
LSR/TGEv LSR/NSE LSRvi/NSE
Botswana 11 17 15
Kenya 21 42 20
Malawi 26 43 12
Tanzania 15 25 17
Zimbabwe a / 2.5 3.9 3.9
a/ Based on only 2 years' figures.
LSR livestock services revenue from veterinary fees, sale of drugs, semen etc.
and sale of produce.
TGEv = total gross recurrent expenditure on livestock services.
NSE = non-staff recurrent expenditure.
LSRvi = livestock services revenue from veterinary services and sale of inputs.
- 13

4.13 On the basis of the revenue data shown in Table 7 above, we can calculate
how much such revenue could actually contribute to defraying the cost of
the services. Table 9 shows the extent to which revenues covered recurrent
expenditures irrespective of whether the proceeds were actually earmarked
to the departments providing the services. Over the years shown, revenues
constituted the following average percentage shares of the total recurrent
expenditure and non-staff expenditure of livestock services.
4.14 Column (3) of Table 9 shows the average percentage share in non-staff
expenditures (NSE) of the revenue collected from veterinary fees and the sale
of inputs (LSRvi). There is a reason for using NSE as a base in calculating
the share of revenue in this manner. In the majority of African countries
livestock services are a monopoly of government veterinary departments.
For historical reasons, as well as for reasons of deliberate policy, this situation
has been maintained. In the countries considered, except perhaps Zimbabwe,
there is no evidence that governments have so far encouraged the private
sector or government-promoted cooperatives to provide, on their own account,
even some of the services.
4.15 At the same time, livestock producers have had very little or no control on
what government personnel do or should do (in the contractual sense) in terms
of the quantity and quality of services rendered. In such circumstances, it
would seem reasonable to argue that users should only be charged for the non
staff expenditures (the variable costs) incurred by government departments
providing the services, and that government services should try to maximize
the portion of the variable costs covered by user fees and charges. In such
a case it would make more sense to see to what extent revenues from veterinary
fees and the sale of inputs cover actual non-staff expenditures incurred.
4.16 The averages shown in Table 9 mask considerable fluctuations between the
years. In the light of what contributions such revenues could make toward
meeting the cost and maintenance of viable livestock services, it would have
been worthwhile to go into more analysis of what causes underlie such
fluctuations, on the premise that livestock services revenue from veterinary
fees and sale of inputs is a function of non-staff expenditure rather than total
expenditure for livestock services. Unfortunately, it was not possible to
establish a di.cernible pattern in this relationship from the available data,
- 14

partly because sharp declines or increases in partially non-recoverable
expenditures affec4 the level of total non-staff expenditures. An example
is the level of non-staff expenditure in Botswana in 1980/81 which almost
doubled while revenues collected remained at about the same level as the
:preceding year (Annex Table Al). The ficrease in expenditure was a result
of the outbreak of FMD for which vaccination is compulsory but free. Kenya's
case is different in that in 1979/80 the proportion of revenue declined in absolute
terms while non-staff expenditures increased by about 16% over the preceding
year (Annex Table A2). In the case of Malawi, which is a country less subjected
to epidemic outbreaks, both non-staff expenditures and revenues grew steadily
at about the same rate thus resulting in less sharp fluctuations in the proportion
of expenditure covered by revenues (Annex Table A3). Table 10 below depicts
the situation in the three countries for which continuous data are available
over several years.
i! " as aTable 10. Revenue from veterinary fees and the sale of inputs (LSRvi)
proportion of NSE (%).
Average 1970/71- 74/75 75/76 76/77 77/78 78/79 79/80 80/81 81/82
1973/74
Botswana 6 1.3 9,4 27.1 18.5 26.7 18.9 9.5 17.4
Kenya NA 19.3 22.1 32.9 30.9 16.5 9.7 14.7 32.3
Malawi 16.2 16.3 14.8 10.6 7.2 9.9 13.0 4.5 10.7
NA = data not available.
4.17 naspite the fluctuations it is still clear that revenue from these sources, which
the services could legitimately put a clairh to as part of their funding
requirement, accounted for no more than 25% of the expenditures actually
incurred. Thus governments have continued to heavily subsidize non-staff
expenditures even in cases where benefits from services provided almost totally
accrue to the individual user. In certain cases this has resulted in the veterinary
services being denied funds for operating expenses because of government
fund shortages in spite of the declared willingness of users to pay higher fees.
4.18 A good example is Kenya's Al service which is reported to be encountering
budgetary difficulties in several districts in providing uninterrupted services
- 15

to farmers who have become heavily dependent on A[ (FAO, 1981). The Al
service is heavily subsidized (up to 97 % of the average cost) by the government.
The Al fee is currently Ksh 1 per insemination set (minimum of 3 inseminations)
instead of Ksh 10 (grade) and Ksh 5 (zebu) charged up to 1971. Proposals to
increase the fee have been made since the mid-1970s (Hopcraft, 1970) and
were repeated in the early 1980s (FAO, 1981), but they do not seem to have
been accepted, at least not up to 1983 (Githae et al, 1983). It is understood
that farmers, particularly those with grade cows, are wilng to pay higher
fees to ensure a reliable service (Leonard, 1983).
5. Indicative measures of adequacy
5.01 Measuring the quantity and quality of services delivered for given outlays
over a period of years is part of the test of the effectiveness of policy in
resource use and management. Quantitative data on the number of the ultimate
beneficiaries served or on the effect on livestock productivity over time as
a result of financial policy are not readily available at present for all the
countries studied and/or services. HLwever, there are proxies which can indicate
the degree of adequacy of the prevailing financing situation. For our purposes,
the following proxies are expected to indicate if 'he trend of financing livestock
services in the different countries has tended to be similar to or divergent
from generally accepted standards. These are:
(i) the expenditure to GDP ratio;
(ii) the proportion and ratio of staff to non-staff expenditures;
(iii) the number and proportion of technical staff of different categories.
(i) Relative expenditure ratio
5.02 Table 11 shows the ratio between the expenditure 5 / to GDP ratios in the
agricultural and livestock sectors of the countries listed.
5/ Government recurrent expenditure on agricultural and livestock services.
- 16
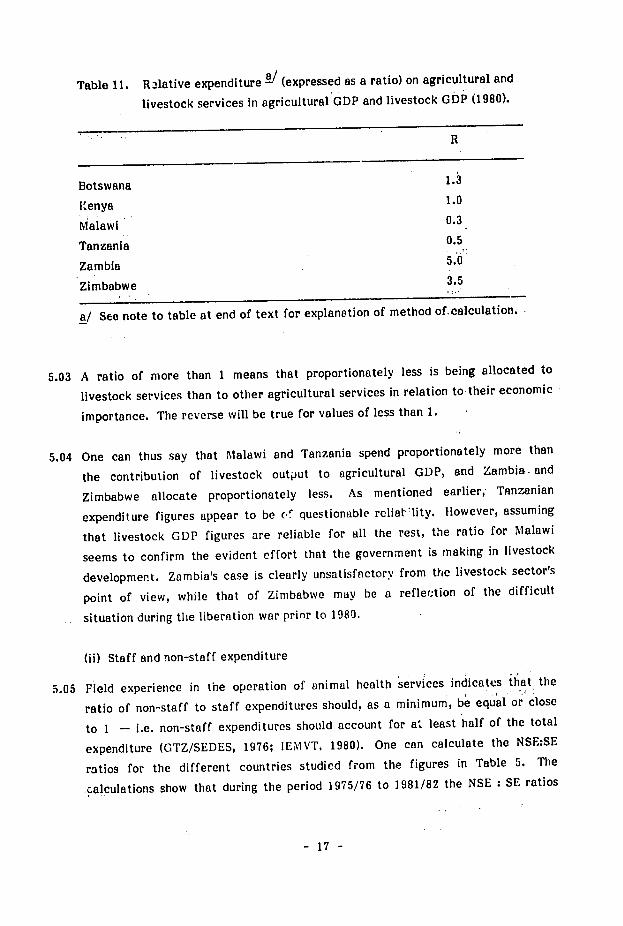
Table 11. R2lative expenditure / (expressed as a ratio) on agricultural and
livestock services in agricultural GDP and livestock GDP (1980).
R
1.3Botswana 1.0Kenya 0.3Malawi 0.5Tanzania 5.0Zambia 3.5Zimbabwe
See note to table at end of text for explanation of method of calculation.a/
5.03 A ratio of more than 1 means that proportionately less is being allocated to
livestock services than to other agricultural services in relation to their economic
will be true for values of less than 1.importance. The reverse
5.04 One can thus say that Malawi and Tanzania spend proportionately more than
the contribution of livestock out-put to agricultural GDP, and Zambia. and
earlier, TanzanianZimbabwe allocate proportionately less. As mentioned
be c'.questionable reliat'1ity. However, assumingexpenditure figures appear to
all the ratio for Malawithat livestock GDP figures are reliable for the rest,
the that the government is making in livestock seems to confirm evident effort
case is clearly unsatisfactory from the livestock sector'sdevelopment. Zambia's
point of view, while that of Zimbabwe may be a reflet.tion of the difficult
situation during the liberation war prior to 1980.
(ii) Staff and non-staff expenditure
health services that the 5.05 Field experience in the operation of animal indicates
ratio of non-staff to staff expenditures should, as a minimum, be equal or close
to 1 - i.e. non-staff expenditures should account for a, least half of the total
1976; 1980). One can calculate the NSE:SEexpenditure (GTZ/SEDES, IEMVT.
ratios for the different countries studied from the figures in Table 5. The
to : SE ratioscalculations show that during the period 1975/76 1981/82 the NSE
17

for Botswana, Malawi and Zimbabwe have increased frora 2.02 to 3.8, 1.6 to 1.9 and irom 0.7 to 2.1 respectively. The figures for Tanzania again fluctuate too much to give a meaningful trend, while those for Zambia are not available continuously. The ratio for Kenya has generaUy tended to deteriorate (from 2.4 to 0.4) during the same period.
5.06 The "ideal" NSE:SE ratio clearly cannot be identical in all situations and countries. However, the implication of a deteriorating ratio should be of serious concern to policy makers as long as services are funded from goverment budgets and delivered by government staff. To use the available resources to pay steadily increasing salaries to an increasing number of staff without providing the operating means necessary to deliver the services is clearly an inefficient way of running the services. This seems to be the case in Kenya while the other countries with reliable data appear to be able to avoid such a situation.
5.07 On the other hand, one must also be aware that a favourable NSE:SE ratio does not automatically depict an efficient operation of services. The factors which cause a rise in the NSE : SE ratio could be several: increasing non-staff expenditure resulting from rising fuel costs for transport, rising prices of veterinary requisites etc. These factors tend to affect the cost situation in all countries, but they do so to different degrees.
5.08 An important factor may be the bsolute shorcage of killed manpower available for livestock services; this tends to put a limit to what governments can spend on this element in recurrent expenditures unless they recruit expensive expatriates directly. Under such a situation ncn-staff expenditures, particularly transport costs, are likely to rise quickly in order to make the limited staff more mobile. It is interesting to note that countries with small human populations but large land ereas (e.g. Botswana) seem to fit this picture. Prima facie this would appear to be a more efficient use of resources. However, compensating for staff shortages by high non-staff expenditures must be evaluated for cost effectiveness before judging a high NSE : SE ratio to be more efficient.
(iii) Staff categories and proportions
5.09 One important aspect is that there be a pioper balance between different staff categories so that the provision of services is effective at both the planning and management levels as well as the actual delivery of the service to the
- 18

ultimate beneficiaries. Ratios of 1:5 middle- to low-level (ML:LL) and a ratio of 1:3 high- to middle-level (HL:ML) staff are generally accepted as appropriate
in livestock services (GTZ/SEDES, 1977).
5.10 The ratios are based on experience in the West and central African countries,
particularly those in the Sahelian zone. These ratios can vary depending on
several factors of which the major ones are as follows:
(i) the geographical distribution and density of the livestock population;
(i) the production systems in which the services are provided (e.g. pastoral,
settled sy. tems) ;
(iii) the size of the individual herds with which the livestock services have to
deal; and
(iv) the size of functions carried out by the different classes of professional
and technical staff providing livestock services.
5.11 Factors listed under (i) - (iii) cannot be directly manipulated through
financial allocations. The range of functions (factor iv), on the other hand, is
partially dependent on how much money is made available to the veterinary
services. It is therefore relevant to see :ow the range of functions of the
veterinary staff influence staffing ratijs.
5.12 Sandford (1983) distinguishes three levels of functions for purposes of estimating
ratios between high- and low-level staff (middle- and low-level staff are treated
together as auxiliary personnel). First, where the high-level staff are' mainly
concerned with visual diagnosis of diseases in the field, mass vaccinations against
epizootic diseases and quarantine control, a'ratio of 1 lIL to 20-30 LL staff
would be appropriate. Second, where the functions consist of more sophisticated
diagnosis, preventive medicine on a herd/flock basis and simple advisory work
to livestock owners, a HL to LI, ratio of 1 to 10 would be more appropriate.
Third, where the veterinarian carries out a full range of services including Al
and the treatment of individual animals, a much lower ratio (of 1 to 3-5) between
high-level and low-level staff would be required.
5.13 In most African countries, veterinary services have historically tended to
emphasize disease prevention and mass treatment of the major diseases
(Rinderpest-,' CBPP, trypanosomiasis, FMO, ECF). The ratios Which are most
- 19

relevant under such a situation are those related to the first and second set of functions indicated above. To that extent, the "appropriate" ratio between high- and low-level staff (1 to 15) established by CTZ/SEDES (see paragraph 5.09 above) on the basis of West and central African experience would be within the range of 1 to 25 to 1 to 10 suggested by Sandford and would be equally applicable to the East and southern African countr-ies considered in this paper. Table 12 below shows the staffing ratios for five of the countries where data are available.
Table 12. Ratios between different staff categories (selected years).
1974/75 1975/76 197,.'/78 1979/80 1980/81 Botswana ML:HL./ 1.6 1.6 1.7 2.3 2.3
LL:MIa/ 4.2 3.8 3.34.3 3.1 Kenya ML:HL 2.6 1.2NA 1.8 2.6
LL:ML NA 5.75.1 7.2 5.2 Malawi ML:HL 4.0 2.7 3.1 3.4 3.9
LL:ML 6.4 6.5 5.5 5.8 5.5 Zambia ML:HL 1.7/ 1.2-/ 1.0 / NA NA
LL:ML 1.9 1.9 1.9 NA NA Zimbabwe ML:HL NA NA NA NA 0.9s/
LL:ML NA NA NA NA 7.5-e/
a/ High-level: veterinary doctors and surgeons, senior livestock officers. Mliddle-level: assistant veterinarians, livetock officers. Low-level: field-level animal health and livestock assistants including those with some technical training.
b/ 1973
c/ 1975
d/ 1976
e/ 1981/82
NA = data not available
5.14 As can be seen the general trend in Botswana is for the ML:HL ratio to increase and for the LL:ML ratio to decrease. This could perhaps be an indication of
- 20
7B3otswana's efforts to mitigate the shortage of highly skilled manpower. If. the
high non-staff expenditures imply greater transport costs this then Is consistent
with the strategy of having a limited number of high-level staff who are more
mobile. Only Kenya and Malawi display overall raiios between low and high
level staff in the range 10-25 indicated above as being appropriate for the sort!
of functions being carried out.
6. Conclusion.
6.01 Although one needs to be cautious about making generalizations, some contrating
patterns seem to emerge between the East and southern African cbtiitrles
reviewed in this pnner ad the West African countries reviewed in Anteneh
(1983). Some of these findings are briefly summarized as follows:
(i) In real terms recurrent expenditures on livestock services seem to have
increased at a corqiderably faster rate in the East and southern African
countriea;
(ii) The East and southern African countries for which data are available seem
to have either maintained or increased the share of expenditure on livestock
services in total agricultural recurrent expenditure;
(iii) In general the East and southern African countries have allocated a more
"adequate" portion of total expenditure to non-staff expenditures;
(iv) The practice of applying user fees to finance services is more widespread
in the East and southern African countries;
(v) In regard to staffing, the East and southern African countries tended to
concentrate on increasng the number of low-level staff while the West
African countries tended to concentrate on increasing middle-level staff.
6.02 Another interesting pattern that seems to emergc is that small countries in
both groups (e.g. Sierra Leone, Malawi) seem to allocate proportionately much
more to non-staff expenditures than the larger countries.
6.03 That these differences in some important aspects of expenditures on livestock
serv-cs exist, cannot be totally coincidental. It is interest, to note that
the East and southern African col,.itries presently considered are British ex
colonies while most of the West African countries are French ex-colonies. These
two groups of countries seem to use different political and economic as well
as administrative processes in dealing with financing issues, which have probably
- 21

'given rise to the different expenditure patterns. This may have important impli
'e tions for p6licy if the patterns listed above are a reflection of the use of
different policy processes and instrument;.
6.04 "It would be' beyond the scope of subseqient studies related to financing of live
in depth. But further coveragestock services to deal with all these aspects
of some countries that do not e:actly hive the above characteristics would
be quite useful. Further, other in-depth studies would be of interest to see
if the different pattern of staff and non-staff expenditures that seems to exist
between small and large countries holds true e.g. by a review of the situation
at the same timein such small countries as Swaziland and Lesotho who have
an important livestock sector.

Not0 to Table 11
a/ The figure for each country represents the ratio obtained from:
R = ARE (xi))\ . R x. AGDP (Yi) " LGDP (Y2))
where ARE (xi ) agricultural recurrent expenditure AGDP (Yl) = agricultural GDP LRE (x2 ) = recurrent expenditure on livestock servi,-_ LGDP (Y2) livestock GDP
R can thus be expressed as:
YI Y2
The ratio basically tells us the intensity of input expenditure in the livestock sector relative to the intensity in the agricultural sector as a whole.
R can also be expressed as:
R (I • Y2 = r I . r2 x2 Yl
where r I ( . a) is the ratin between ARE and LREx2)
and r 2 (.- Y2 is the ratio between livestock sector output (LDGP) and-yl)
agricultural output (AG DP).
Since r 2 is greater than zero but less than or equal to 1, then R is also a weighted
average of the ratio r I .
SOURCE: Calculated from data in annex tables.
- 23

REFERENCES
Anteneh A. 1933. Financing livestock services in some African countries.
LPU Working Paper No. 1. ILCA, Addis Ababa.
Department of Veterinary Services, Zimbabwe. 1984. Several data from
Deputy Director, Department of Veterinary Services, Harare.
FAO. 1981. International Scheme for the Coordination of Dairy Development --
Kenya. Final Report. Rome.
FAO. 1983. Agriculture: Towards 2000 (AT: 2000). Computer printouts of
macro indicators. Rome.
FAO. Production Yearbooks. Several years. Rome.
Githae G K, saksson I N and Muthieki G M G. 1983. improving the collection
of A I As and review of user charges. Unpublished report. Ministry
of Agriculture and Livestock i'evelopment, Nairobi.
GTZ/SEDES. 1976. La sante animale au Tchad, Mali, Ilaute-Volta,
Mauritanie, Gambie et Senegal. Frankfurt and Paris.
GTZ/SEDES. 1977. La sante animale dans les etats saheliens au sud du
Sahara. Frankfurt and Paris.
Hopcraft P N. 1976. An evaluation of the Kenya dairy production improvement
programme (Al service). IDS Occasional Paper No. 20. University
of Nairobi.
IEMVT. 1980. Intensification de la lutte contre les epizooties (Afrique de l'ouest
et du centre). 2 vol. Maisons - Alfort.
International Monetary Fund (IM F). 1982. Government financial statistics
yearbook, Vol. vi. Washington, D.C.
- 24

Jahnke H E. 1982, Livestock production systems and livestock development
in tropical Africa. Kieler Wissenschaftsverlag Vauk, Kiel.
Leonard D K. 1983. African practice and the theory of user fees. Unpublished
paper.
Ndzinge L 0 et al. 1984. Herd inventory and slaughter supply response of Botswana beef cattle producers. J. Agric. Econ. 35 (1) : 97.
Ochieng' E 0. 1981.' Botswana's structure compared with those of other small countries. In: Harvey C (ed) Papers on the economy of Botswana.
Sussex, UK.
Republic of Botswana. Estimates of recurrent revenue and expenditure. Several years. Government Printer, Gaborone.
Republic of Botswana. Financial statements, tables and estimates of consolidated and development fund revenues. Several years. Government Printer,
Gaborone.
Republic of Botswana/Carl Bro International A/S. 1982. An evaluation of livestock management and production in Eotswana with special reference to communal areas. Gaborone.
Republic of Kenya. Appropriations accounts. Several years. Government
Printer, Nairobi.
Estimates of expenditure. Several years. Government Printer,
Nairobi.
Republic of Malawi. Approved estimates of expenditure on revenue account. Several years. Government Printer, Zomba and Lilongue.
Republic of Zambia. Annual Report of the Department of Veterinary Services. Several years. Government Printer, Lusaka.
Financial reoort. Several years. Government Printer, Lusaka.
- 25

Republic of Zimbabwe. Estimates of expenditure. Several years. Government
Printer, Salisbury/Hararc.
Republic of Zimbabwe. 1978. Report of the Comptroller and Auditor-General.
Government Printer, Salisbury.
Department of Veterinary Services. 1982. Annual Report.
Government Printer, Harare.
Sandford S. 1983. Management of pastoral development in the Third World.
John Wiley & Sons, Chichester.
United Republic of Tanzania. Financial statement and revenue estimates.
Several years. Government Printer, Dar-es-Salaam.
Estimates of public expenditure supply votes. Several years.
Government Printer, Dar-es-Salaam.
Estimates of public expenditure supply votes (regional). Several
years. Government Printer, Dar-es-Salaam.
- 26
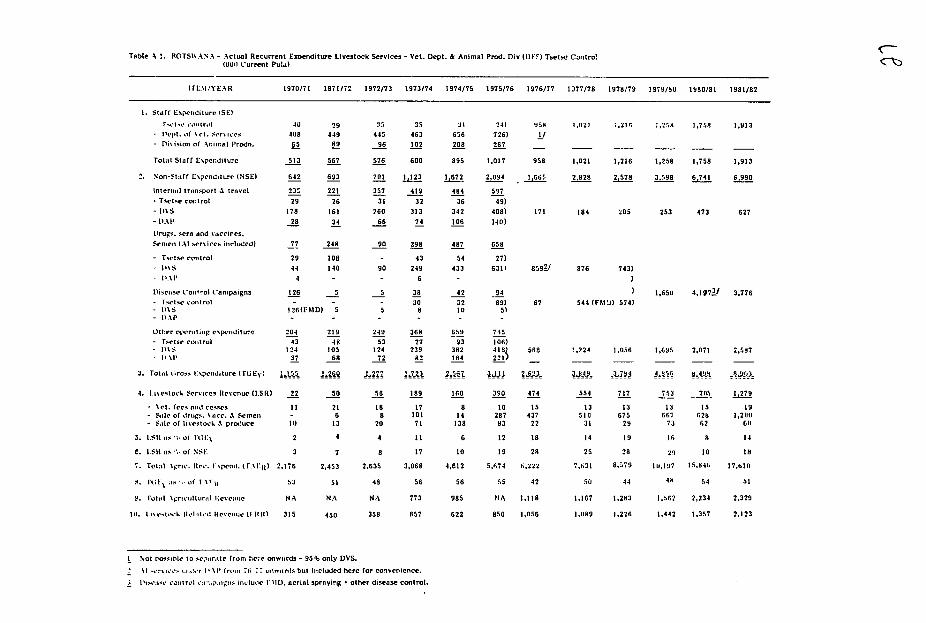
Table A !. RTSW.ANA - Actual Recurrent Exoenditure Livestock Services - Vet. (0011Current Pule)
Dept. & Animal Prod. Div (IDF) Tsetse Control
ITEXI/YEAR 1970/71 19711? 1972/73 1973/74 1974/75 1975/76 1976/77 1377/78 1978/79 1979/80 1980/81 1981/82
I. Staff Ependiture (SE)
- Dept. of xet. .orrices
- Division of Animal Prodn.
840
408
6-
29
449
.89
35
445
96
35
463
102
31
656
208
24)
726)
267
958
I/
1,0(21 1,215 1,259 1,758 1.913
Tota Staff E\perditure 513 567 576 600 895 1,017 958 1,021 1,216 1,258 1,758 1,913
Z. Non-Starf E\pendilure INSE) 642 693 781 1,123 1,672 2,094 1,665 2,828 2 ,598 6,741 6,990
Internal transport %travel
- Tsetse control
- IS
- AP Drugs. sera and vaccines,
Scoen tAt services included)
235
29
178
28
77
221
26
161
34
248
357
31
260
68
90
419
32
313
74
298
484
36
342
106
487
597
49)
408)
140)
658
171 184 205 253 473 627
- Tsetse control
- DS
-t(.\P
29
44 4
108
140 -
-
90 -
43
249 6
54
433 -
27)
6311 8591/ 876 743)
Diseas
- rtve - )S5
DP
Control Campaigns cotrol
126 -
126(1MD)
5 -5
9 -5
38 30
8
42 32 tO
94
89 51
67 544 (FINSt)574) 1,650 4,1971/ 3,776
Other o,cratiig espeiditure
- rvetse control - 1\S - '\l'
204
43 124
37
219
48 103
68
249
53 124
72
368
77 239
82
65
93 382 184
745
106) 4181 221)
568 !,224 I.956 1,695 2,071 2,587
3. Totailtroialpenditure IrhEyl I1Atk! 9q Q 277 M.1 2.59? 3433 2.521 245.U-S A.05Ci 0.45 6,1(
4. liestock Services Revenue {tSR)
- Set. fees and ce-s - Sle of drags. \acc. A Semen - Sale of livestock . proluce
3. I.Sit 1sl 1"t;I:\
22
II -
10
2
s9
21 8
13
4
98
ls 9
20
4
189
17 101 71
11
10
8 14 138
8
39
19 287 93
12
474
15 437
22
18
554
13 510
31
14
717
13 675
29
19
753
13 667
73
16
270 15
628 62
a
1,279
19 1,20
611
14
C. l.S as ", of NSE 3 7 8 17 18 19 28 25 28 24 10 18
7. Total \grc. He, spent.
. 1761\ a " of t S!It (TAE1 I) 2.176
53 2.453
9 2,635
9
3,068 56
4,612 56
5,674 55
6,222 42
7,631 50
8,579 44
£8,197 48
15,846 54
17,61 1
9. fotal Sgrrclturl Reveoae NA NA NA 773 985 NA 1,118 1,167 1,283 1,.62 2,234 2,329
1lt. 1 vesto-k ReltId Ilevelie (111l) 315 450 358 657 622 850 1,056 1,989 1,226 1,442 1,357 2,123
1 Not rcssirle to sepatrate from here onwards - 96% only DVS.
.wSI cr% iw- I I 1|' fr\ o. t; 7 owals but included here for convenience.
ontrol c'a'mspamsl'r :ne w induce I'S) D, aerial spraying + other disease control.

Table NI. IIOTSW' N N - \ctuel Recurrent .......
1010 91 19181 F2 ITEM/ YEAR 197071 1971/72 1972/73 1973/74 1974/75 1975/76 1976/77 1977178 1979/79 1979'q 0
It 7428 32 3024 27 4027 36 26 3811. LRR as % or TGL;E
6058 52 52 7 11 16 29 26 45 45 51
12. LSR as ofL.Rl 9196 91 61
65 63 NA 94 93 13. LRR as % of Agricultural Rev.
24 25 25 24 24 25 2, 23 73lVet. Set. 4/
44 36 36 44 41 7 641 314. NO. & Category of IlL 237 198 ?40
professional and i NIL 173 192 192 200 200 47
8 12 13 12 12 12 7 16 16 22 22
technical .taff 25 35 3312 17 17 26
II. 44 30 30 43 48 68 68 36 36
I Mt.{ILL
2,000 2,170 2.090 2.140 2.165 15. Ruminant Livestock PopuL. (000 L.) 1,604 1,665 1,640 1,715 1,810 1,900
2.27 3.P31.31 1.77 1.821.00 1.42 1.640.72 0.76 0.7816. TGEv/LSU (current P)
i6 9480 84 (I1L 48 52 36
71 72 76 83 42 42 43 56 6017. LSL W001 Per
10 9 10 16 11 9 11 9 6
IL. 18. Agricultural Gill (,A\DP)(inmill. P)
6t 19. Livestock ;Il' lt.r;DI) (inmill. P)
13.o! 20. TAEI1 as % of AGLDP (unit. in mill P)
8.55 21. TrEv as % of LGDJPtamt. in mill P)
4/ Includes Tsetse control and Al (upIo 11976/77)
5/ Al included from 7r,/77 onwards 6/ Total agricultural expenditure (TAKII) is average of 3 yenrs (19789-1980/1)
lira1982. VO.II. SOURCE: IAO Proluction Yearbook.s 1972-l980; Republic of Votswuna / Carl
Renelue und Expenditure. Several years. Tables and Estiniates of (owsoldialed and Ievelopmnlt:tepulaicor ilotswun,. E.stimtes of Recurrent Several )'trm.Futd Revellu-.
lIaowou. I irmniil Stuteuiet, SNdzinge at Jl 11984);fchieng (1981). Iltepublic of

TithleA 2. KENY. - Recurrent Expenditure Livestock Services 1_ - actual unless otherwise indicated - in 00 Kenya Pounds (current prices)I
ITEM, 'EARS 1974/75 1975176 1976/77 1977/78 1978/79 1979/80 1980/81 1981/82
1. Staff Expenditure (SE) 1,668 2.116 2,276 2,784 3,104 3,290 5,690 7,082 2. Non-lutff Expenditure (NSE) 2,664 2,847 2,481 2,634 4,406 5,208 5,460 3,213
- Transport and travel 518 647 971 1,551 1.797 1,831- Prugp. sera. accnies & pesticides 2,406 1,579195 309 215 211 288 447- Other operating expenses 911 3991,951 1.891 1,295 872 2,401 2,930 2,143 1,235
3. Total Gross Expenditure (TGE,) 4,332 4,963 4,757 5,418 7,50 8,4!8 11,150 10,295 4. Appropriations in Aid (LSH) 1,130 1,363 1,847 1,491 1,099 1,180- \eterinar Fees & cesses 2,082 1,889
279 .70 579 584 555 279 548 758- S4te of dru'4. vaccines, etc. 235 260 238 229 186 225 255 -79595 689 1,905 604 319 - S;tleof liri 'rloduce & Stock
-SWell cous 31 44 585 1,043 822
25 74 39 91 236 30
5. LS .- '\,of TtGE, 26 27 39 27 14 14 19 18
6. LSR a NofSE 42 48 74 56 24 23 38 59
7. Total Agricultural Recurrent Expenditure IrAER) 13,215 15.511 12,268 17,876 22,211 23,051 47,530 38.274
8. TtE, o- "., -'" .E 33 32 :19 301 24 37 23 27
9. Totul .gricultu-.I Appropriation-in-Aid (.1.} 2,316 2,321 2,925 2,593 2,266 2,191 3,141 2,94810. LSR as "o of Total Agricultural A-I-A
49 59 63 67 48• IlL 54 66 64llI 1t0 129 169 23511. No. & Category of Professional(,I 39 34 15l 11 10 12 19 23 294 344 154o 1 289 282 29 319 338 356 331 408
(LL 1,445 1,451 1,735 1,828 2,027 2,579 2,598 2,119 12. Livestock Population (60 LSU) 5,910 6,090 6,021 7,350 7,820 8,179 8,583 8,878 13. Tt;L
v per LSL 0% Sits) 14.6 16.3 15.8 14.7 19.4 20.8 26.0 23.2 14. LSl (00) (ILper (ML 5320 . 5522 47 4318 23 33 28 2523 5823 26 22
LL 4 4 3.5 4 4 3 3 4 15. AgricJltural (DP (AGDP) - (mill K sh.) 8,466
16. Ltisetoc 1 P) )tI1w (I., 2,(2,946
17. TAER as 1. of AGDP
5.00
tI.riE. - - - LGIP 5.00
1 Lisestock under Ministry of Agriculture upto and including 1978/79, Ministry or Livestock Development from 1979/80 onwards.
Z Exclwutes training.
so RL'S: RepurIth of xenya. Appropriations Accounts. Several Years. - - Itinmates of Expenditure. Several Years.
FAO Production Yearbooks: 1972, 1976, 1977, 1979, 1980, 1981.
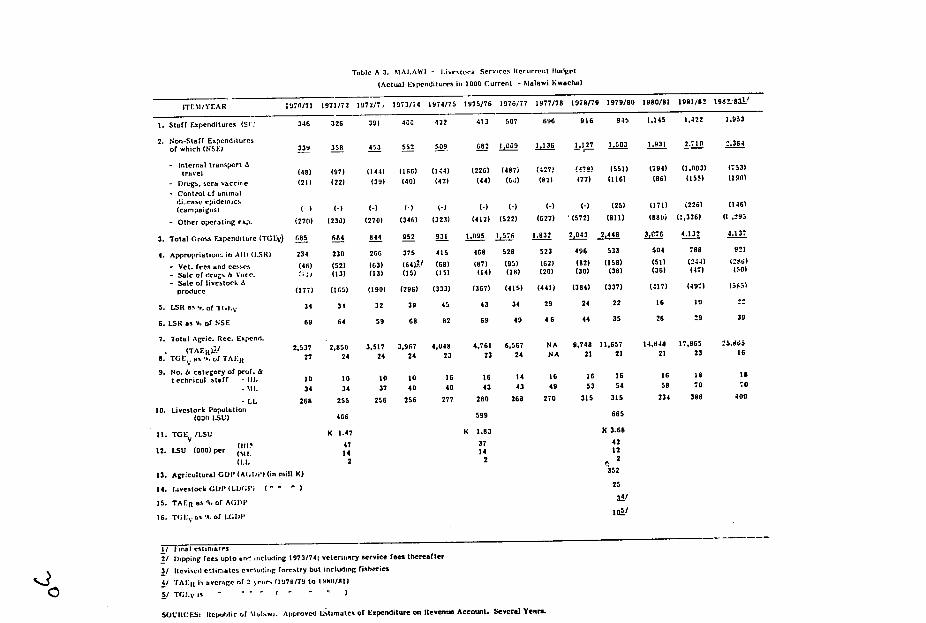
Table A 3. IALAWI - livestock ServicesRerorre,,t Budget
(Actual Expendituresin 100 Current - Malawi Kwacha)
ITL3I/YrAR 1270/71 1971/72 1972/7, 1973/74 1974/75 1975/76 1976177 1977/78 1978/79 1979/80 1980/81 1981/82 1982:831!
1. Staff Expenditures (S:' 346 326 391 400 422 413 507 696 916 945 1,145 1,422 1.953
2. Non-Staff Expenditures or which (NSEI 339 358 453 552 509 82 L 1,136 1.127 0 1.931 2.710 .364
- Internal transport & travel
- Drugs. sera vaccir
- Control of animal disense epidenics {camrpaigns?
- Other operating exp.
(48)
(21)
(_)
(270)
(97)
(22)
(-)
(230)
(144)
(39)
(-1
(270)
(169)
(40)
1-)
(346)
(144)
(42)
(-}
(323)
(226)
(44)
(-)
(412)
(487)
(6 J)
(-)
(522)
7
(82)
(-)
(627)
(479)
(77)
(-
"(572)
(551)
(116)
(25)
(811)
(794)
(86)
(171)
(980)
(1.003)
(155)
(226)
(1,326)
(7531
(190)
(1461
(1 .495
3. Total Gross Expenditure (TGEv)
4. Appropriations in All) (LSR)
- Vet. fees and ce.ses - Sole of drugs & V,,ce.
-Sale of livestock & produce
5. ISI a, .,of "(;Il:v
6.LSR as% of NSE
985
234
(46) ;,
(177)
34
69
684
230
(52) (13)
(165)
31
64
944
266
(63) (13)
(190)
32
59
952
375
(64L2 /
(15)
(296)
39
68
931
415
(68) (15)
(333)
45
82
1.095 1576
468 528
(87) (95) (14) (19)
(367) (415)
43 34
69 49
1.8322
523
(62) (20)
(441)
29
46
2,043
496
(92) (30)
(384)
24
44
2,448
533
(158) (38)
(337)
22
35
3,C76
504
(51) (36)
(M17)
16
26
4.132
798
(244) (47)
(497)
19
29
4.137
971
1266) (001
(585)
2
39
7. Totul Agric. Rec.Expend.
(TAEItII / S. TGE V
as '-, of TALI,
9. No. & cate~gory of prof. & t ecwicul staff - Ill.
-'il.
- .L 10. Livestock Population
(000 LSU)
2,537 27
10 34
268
2,8050 24
10 34
255
4G6
3,517 24
10
37
256
3,967 24
10
40
256
4,048 23
16
40
277
4,761 23
16
43
280
599
6,567 24
14
43
268
NA NA
16
49
270
9,748 11,657
21 21
16 16
53 54
315 315
665
14,648 21
16
58
234
17,965
23
1
79
388
25.865 16
18
70
409
11. TGE /LSUV
(Il0 12. LSU (000) per ('I.
(I.L
13. Agricultural GDP (AtAil)' (in mill K)
14. I.ivestock GD)P'(LD(;I') ( )
15. TAE R as % of AGDP
16. TGEV s 'a,of LtG)i)
K 1.47
47 14
2
K 1.83
37 14
2
K 3.68
42 12
* 2
352
25
34/
I(1/
i/
2/
3/
4
S/
Finalest'laalS
Dipping fees upto ant! including 1973174; veteritiary service fees thereafter
Ievised estiniate, exrluding forestry but including fisheries
TAI:I1 is avcrure. of 09eis 1178/79 to 19HO/RI1
TG V is ..... . " I
SOIICE: Itelhlptic of 'Nahji. Approved Ltimutcs or Expenditure on Itevenue Account. Several Years.
Toble A4. TANZANIA - PNo- t ET.dllo. and R0venue - Uvestock S.nic..
1000Cwa.nt TSwo (actul p-dit- -lothorie Irfitltod)
/ ITEM/YEAR 170,71 l111 t972173 1973174 iT4) 3975M/7 1074 117178 1171M 19791061111001 1811/13 19121-3./
A. Cetral Govt. 3
1. StUfI " Itwlw.M1) 14,431 33,534 3,48? 4,070 10,410 l.010 11,114 14,714 10.72 11.721 17.51 1,128 1,716
. Non-Stff E-Plotwo (P5SE) 1.,30 9,273 MISS 11.379 .LLJ 19,72 14,144 23,711 2.7 13,9&2 I 0.220 111,14 JI.333
- Trar m A 1ao.l 450 143 403 234 220 225 35 J20 403 412 305 170 130
- 04.V-6tl. -- 2.407 2. 0110 ?.SI4-1/ 6.451 2.177 14.53 4.050 14.888 11,72 13,204 7.018 12,033. 1309.1 - O1theyOp ting- penpn.. 10.045 7,014 .331 .1194 10,1111 4.011 ,853 ,43 11.103 2.348 2.11 1.145 3.113
3, Total G I'xIp1cjl. I11.20y1o 0169 -20 J!74011 13 40% -366 21719 -026 84 40025 .0 0.00 2 1111364
4. Cellr2 Go-. R.e"-eftomUootock 3nov40.. (211) 2.811 4.153 NA 7.403 0.404 3,764 11.11111 ! L.!j.61L NA NA 4.0 5.12S
-VIatetInry chlargs fll 4.2I NA 1.225 Il1 1,733 0,000 LST s0 A NA 850 IS0
- ther rlated to 2l2.a0m soro. NA NA MA 1.171 802 1.031 Big 1,441 110d NA MA 3,065 4,37
* L1ts % OT2EV 10 NA is 1 10 03 it i NA NA 1 40
. LSR " %oof E 20 40 NA 22 12 10 41 is 20 HA NA 23 47
I. Total ACrI.Rc. LolndtU 131,780 140.233 60.835 101.312 410.112 102S.7 212.733 07.07 26.714 192.205 140.221 207.273 229.112
S. O21.Vo % ofTAE 0 23 31 07 0 6 30 12 38 26 is 20 13 0
0.TotI Afri c1.7 t-IR w 12.521 12,420 NA 8,4¢0 1.154 6,140 I,259 0,lll 10,00 NA NA 7,120 .122
IL Un.tock Related R.,.o (LRFU 0.190 4.801 NA 4,511 4.38 3.337 010 1,160 417102Y NA NA 4,S35 3.275
It. LRR as S of TGEV to 17 NA 30 it 12 25 12 20 NA NA 23 4?
12. UKs %of LRR 54 60 NA 53 34 83 is Is 91 NA NA Is 04
I3. LRR u Is of Total As R.vmw 320 1 NA 03 04 40 74 3 07 NA N2A 50 as .
I4. I.26tock Popolation (254 L.20 10,235 10.17 0,640 0.104 10,407 10,108 11,141 11,410 0601 ,74 0.115S
IL- TOEV per LSU 3.11 4.14 1.10 0.U8 2.27 2.10 2.27 3.02 3.57 2.34 2.03
IL AS , Ilto.. GOP (AGDP)(WlU Tuh) 1.056
1?. Uesotock GDP (LDP) (ri1 TaO) 2,210
IL TAER - % of AGDP 3
It. TGEV Us% of ?DP 2
./ 000d1,e milntean of 'Up. (poh... of .clddes) * AL / b.Inoodn 2i-2t0k - 0rdh.d tra l.C .
if EyHn..._ 41 Aotual aqmnltor only for D3 of MLD excluding Uotomk RObonrch& Trining. 5 Al tsete control and operoti of firms, Indmtrlnl (Th 3,240 - 81112 and 4.110 -02/33 nlo ded uder DAP) V/rplh 0 L. appeas rder C00rtfl V.I. St"0 -- ,r..n..bl T .sle of 1 .o 00 C . / Total limtock re -
OUOICZ UIt d Re iUc of Tanzani.. FL,.oliol Otatent and R w tit nat. Seral YIa.. 0up2~lyol ,Zstimates of Public t L.i.op otM l T$- ort.
"-. . . * (Reogirai). 5010000yol.. PAO Productn Yogbook. 3*v7.L Toor.

1972/73 1973/74 1974/75 1975/76 1976/771/
1977/76 1979/79 1979/RL/ 19819/11/ 1981/82 1962/43-3IrI I' YlV\%R 197,71 1971/72
It. ItHIGIONS
I. Stoft ieMditures 1ol:I 39,785 49,149 43,487 39,032 39,312 38,736 41,630 46,057
2. cOln-Staff l:spctndilurc
iNSDt 3,080 4,759 7,874 9,702 36,716 17.005 27,022 24,111
tru.9rt A
trm',l 181 34 594 894 1,110 1,424 1.913 1,433
II rugs.szacc,,.e,. s"'enetc. 1,120 807 954 814 5,616 6,401 9,194 10,232
* t 5
Ier oper.titg cxpenses 1,779 3,918 6,326 7,994 9,990 9,180 16,915 12,446
- Totl (ro.s ixpe
it'ure ( lt;t,) 42,165 52,908 51,361 4R,734 56.028 55,741 68,652 70,160
4. Regiton, revenue
I Sit (o,,v Ouirg"e)
%el. NA NA NA 2,230 3,169 4,319 5,669 4,093
5. LSH is % TGE v
6. I Si us '% NSC
C. TOTt . it
I. Slaf I~pcnditores I ) 50.275 58.139 54,603 49.746 50,041 50,408 59.281 52.183
.. Not,-Stuff Exp. (NS:) 16,258 24,488 22,020 33,413 40,193 32,967 37,251 43,959
- Tr,,sport & Trawl 401 259 829 1,270 1,512 1,836 2,308 1, 603
- rugs. vaccines. - n 3,897 15,400 5,012 20.725 17.589 19.605 15,212 29,265
- Other operating exp.
semen :1,960 8,929 16,179 16,430 21,093 11.526 19,731 14,091
3. TIE, 56.533 82.627 76.623 83.159 90,234 83."7- 96.532 96,142
4. 101.0 5,901 9,279 N' NA 98,626
5. .Sit as % or TGE NA NA NA 7 11 *L.. NA NA .
6. ' NSE 09 ^3
:.T: 439,69 129,614 244,892 136,989 138,819 246,156 209.931 286,424
8. Tt'O;:. of TAE:R 16 64 32 61 65 34 47 34
9. otol.LIi 9,769 15,989 NA NA 33,181
10. It H as l., TGE v 12 is NA NA 35
11. rAEr.R is,, of AGDP 2
Iz. rt;L, as '., of
I t' P 4
13. rG;U, p.r i.SU 6.46 7.65 6.88 7.29 9.40 8.52 9.80

Table A 6. ZIMlAI-E Recurrent Expenditure I.tvestock services - Dept. of Vet. Services
000 Z $ (stimates unless otherwise indicated)
ITEM/Y1:XR 1971/72 1972/73 1973/74 1974/75 1975/76 1976/77 1977/78 1978179 1979/80 1980181 1981/82 1982/93
1. Staff Expenditures (SE) 1,384 1,451 NA NA NA 2,270 2,420 2,802 2,911 3,361 6,217 8.588
2. Non-Stuff I:xpediures (NSE) 1,444 1,840 1,739 1,529 2,362 3,002 3.078 12.947 13.270
- Transport ,, ravel 524 586 68 813 1,180 1,532 2.030 3.157 3.110 - Drugs, vacr.ne. etc. 138 139 651 2801 47 686 6789 1 411 1.9
782 1,171 - Other opcr.trg expend.
3. Total fiross |s(.,tare ITGE, ) 2,828 3,291 4,009 3,949 5,164 5,913 6.931 19.164 21.85il
4. Appropriation%ta-Aid LSIW) NA NA 463 50
- rees and cv,.cs NA 281 344
- Sale of druga. vaccine etc. NA 182 226
5. LSR as % T(;I: NA 2.4 1.6 v
6. LSK as '%,of N.11 3.6 4.3
7. Total Agric. IRccurrent Expenditure (i.51:1(1 29,205 34,748 NA NA NA 38,852 65,246 67.762 63.628 66,939 93.643 141.910
8. fGEU as ', of TAI 10 9 NA NA NA 00 6 8 9 to 19 15 l 53
Irfesaisnal t,lc", ( I. 46
nial taff $1.1. 349
9. No. & (:,,Ie;.ory of 1I 1
10. livestock Pop. 10011I.SU) 4,185 4,221 4,287 4,563 4,667 4,882 4,484 4,092 4,532 3,871 4.078 NA
1. TrE per LSUlc-rrent M.) 0.86 8.78 NA NA NA 0.82 0.88 1.21 1.30 1.79 4.70 NA
12. I.St: ((1011,) pe, (Ill. 177 I/Il 89
(II 12
13. f.f.ricultural C;t'i' WAt(lJ' (ioill Z$) 462
14. Liuetock (hllA ll't (Nil. ZS (35"%,)162
15. "I-AE a,' '.of °;D1p 14
16. TGit:n as W. of LGIt,; 4
1/ Actual expenditrec from Report of the Conmplrollcr und Audltor-General. 1978.
2/ Dipping servic %rintroduced: 11%andt 45.f of other operating expenditure in 1981/22 and 1982/83 respectively.
SOURCES: te,,ublic of Zimbabwe. E-stimates of Expecditure. Several Years.
Report of the Comptroller and Auditor-;eneral (1978).
Dut,, supplicl by the Ast. Director, Departlnent of Veterinury Services (1984).
Dept. or %eterinury.Services. Annual Report, 1982.
Agricultural Marketing Authority. Economic iteview of the Agricultural Industry of Zimbabwe. Several Years.
%tadzima (Personal communication).

rablc A 5. ZAMIIIA - Dcpartment of Veterinary Services + Tsetse Control
000 current Zkwacha (actual expenditure or revenue)
ITEM YE\R 19, 1971 1972 1973 1974 1975 1976 1977 1978 1979 19H0 1981 1982
I. Staff x ,penditrcsISl) 2. Non-Staff Expcnditures tNSE)
703 .90
844 2.290
967 1,932
NA "
1,151 1,728
NA NA 1,572 1,855
1,766 1,764
NA 1,784 .,170
NA 2.758 3,943
- Tranos xrt & rravel - ars.saccices.etc. - t2 e. eroto c-p.
3. r:. ro- vit ue t rtu: )
4. Appreprii.s-i -ni,(I.SRlI
% , t.Acc'
- oIrOf ,!rOci. s.Iccjoes-
- Nile of fr, produce & stock
3.1,1. of- t', K%
6. l Nsl
". Tot.a1 Agrlc. Rtecurrent x(pend.
iTsr R)I
P. Tt1i' zis -, or r \un 9. No. S Calcgo,%of profe- (Ill,
9.5.% thct llcsstrorfr (e11 .
ILL.
IW).I l sevl-k I'e'tlatiom (OV9 ISLU)
II. rt;fU I ,L*
I-. LSU 000 1-L per 1
OIL ILL
211 463
1.188
2,613
2111
28
I
I
24,876
11 NANA
NA
1,03
2.3,
NA NA N.A
346 589
1.355
3,134
12
12
I
I
46,468
7 NANA
NA
1,141
2.75
NA NA NA
214 695
1.033
2.899
2
1
...
...
31,452
10 1925
43
1,177
2.47
59 -47
27
1525
48
1,212
NA 81 48 25
270 6411/ 817
2,879
22-/
2'
-
l
19,340
NANA
NA
1,433
2.01 NA NA N,,
'5 2024
45
1,279
NA 64 53 28
2122
42
1,303
NA 62 59 31
326 530
1,002
3,430
44
44
-
2
2
79,746
NANA
NA
1.336
2.57 NA NA
NA
286 495 993
3,530
39
39
-
2
2
56,044
7
1,295
2.73
"
1,489
NA
298 569
1.393
3.954
39
39
1
1
222,175
2
1542
2.57
1,594
NA
686 724
2,533
6,711
51
51
1
1
182,800"
4
13. Agricultural GDP (MUIM) (Mill. ZK)
14. Liest3Lc GDP (LUDP) " )
15. TA: Ras of AtIDP
16. f iE \ as of I.t P
216
65
26
5
1
!
Materials - CIIPP - F[I Al.
Paid seraices introe.uced in 1974.
SOURCES: Republic of Znmbia. Financial report. Several Years.
:1%\ Prodiuction Yearooks. Severaly Years
Xi\nonitl Reports of the lctertmient of Veterinary Services 1972, 1973, 1975 and 1976.

ILCA/LPU WORKING PAPERS
No. Year Title Author
1. 1983 Financng animal health services Insome AddlsAntoneh African co ntries
2. 1983 What causessupply levels from African John McClintock livestock sectors to change
3. 1984 The allocation of resources to livestock CamillaToulmln research InAfrica
4. 1984 Dairy Imports Into sub-Saharan Africa: Valentin von Massow Development andpolicies
5. 1984 Dairy development and Internal dairy Stephen. G. Mbogoh marketing in sub-Saharan Africa: Performance, policies and options
6. 1985 Financing livestockservices in some AddisAnteneh countries of East and southem Africa
$inq cccle. ol these worikng papersare available, free of charge,from the Ubrarian,ILCA, P.O.Box 5889, Addis Ababa, Ethiopia.


![1 2Material Sciences Division, Lawrence Berkeley National ...arXiv:1406.3311v1 [cond-mat.stat-mech] 12 Jun 2014 Heterogeneity-induced large deviations in activityand (insome cases)](https://static.fdocuments.us/doc/165x107/60de6dd53f88e100ab562454/1-2material-sciences-division-lawrence-berkeley-national-arxiv14063311v1.jpg)