FinanCial STaTEMEnTS 20122012.elenia.com/sites/lnicom2012/files/Elenia_fr_2012_en.pdf · structure...
40
FINANCIAL STATEMENTS 2012
Transcript of FinanCial STaTEMEnTS 20122012.elenia.com/sites/lnicom2012/files/Elenia_fr_2012_en.pdf · structure...

PB ElEnia
FinanCial STaTEMEnTS 2012

TablE oF ConTEnTS
ConSolidaTEd FinanCial STaTEMEnTS
Report of the Board of Directors 1Consolidated income statement 4Consolidated balance sheet 5Consolidated statement of changes in equity 6Consolidated cash flow statement 7Accounting policies applied to the consolidated
financial statements 8Notes to the consolidated financial statements 16
ParEnT CoMPany FinanCial STaTEMEnTSParent company profit and loss 32Parent company balance sheet 33Cash flow statement 35Accounting policies applied to parent company’s
financial statements 36
Auditor’s report 38

FinanCial STaTEMEnTS 2012 1
ConSolidaTEd FinanCial STaTEMEnTSRePoRt of the BoaRd of diRectoRs 2012
ThE GrouP’S oriGinS, STruCTurE and ownErShiPThe Finnish Electricity Market Act, which entered into force in 1995, opened the Finnish electricity market up to competition. Following the deregulation of the market, the Swedish energy company Vattenfall AB (“Vattenfall”) acquired Lapuan Sähkö, Hämeen Sähkö, Revon Sähkö, Heinolan Energia, Keski-Suomen Valo and Hämeenlinnan Energia. These companies were then reorganised into Vattenfall Sähkönmyynti, Vattenfall Verkko, Vattenfall Lämpö and Vattenfall Sähköntuotanto.
Vattenfall sold its Finnish electricity distribution and district heating operations as an enterprise sale on 10 January 2012 to LNI Acquisition Oy, which at the time of acquisition was indirectly owned by a consortium con-sisting of GS Global Infrastructure Partners II L.P. , GS International Infra-structure Partners II L.P. (together 45%), 3i Networks Finland LP (45%) and Ilmarinen Mutual Pension Insurance Company (10%). The acquired busi-nesses now form the Elenia Group (“Elenia Group”) which originally com-prised the parent company Elenia Oy (“Elenia”), the electricity distribution provider Elenia Verkko Oy, the heating solutions provider Elenia Lämpö Oy (“Elenia Lämpö”) and the customer service unit Elenia Asiakaspalvelu Oy. On 28 August 2012, Elenia acquired full ownership of Asikkalan Voima Oy, of which it had previously held 50%, with Lahti Energia Oy owning the other half.
The company’s new Elenia name and brand were launched on 11 May 2012. LNI Lämpö Holding Oy merged with Elenia Lämpö Oy on 31 August 2012, Elenia Asiakaspalvelu Oy was merged with Elenia Oy on 31 December 2012, while Elenia Verkko Oy and Asikkalan Voima Oy were merged with Elenia Oy on 1 January 2013. As of 1 January 2013, Elenia Group comprises of Elenia Oy as parent company and its 100% owned subsidary Elenia Lämpö Oy.
The enterprise sale and the formation of Elenia opened up new pros-pects for the operations of the electricity network and district heating companies involved. At the same time, it has required the development of independent Group functions.
ElEnia’S buSinESS oPEraTionSElenia Group comprises electricity distribution and district heating business operations.
ElECTriCiTy diSTribuTionElenia is Finland’s second-largest provider of electricity distribution services after Fortum. At the end of 2012, the company had approximately 410,000 homes, businesses and organisations as its customers in 100 municipalities in Häme, Pirkanmaa, Central Finland and Ostrobothnia. Elenia has over 64,000 kilometres of electricity networks, of which one quarter is under-ground.
While Elenia’s areas of operation include several cities, they mainly consist of sparsely populated areas. As a result, the company’s operating environment is quite different from that of energy companies operating in major cities. One indication of this is that Elenia has approximately 160 metres of power lines for each resident in its area of operation, whereas the corresponding figure for an urban electricity company may be less than 20 metres.
Elenia holds an electricity system licence issued by the Finnish Energy Market Authority, which grants Elenia the right to manage and maintain an electricity distribution network. Elenia is responsible for the functionality and modernisation of its electricity networks, building electricity networks and connections in cooperation with its business partners, measuring its customers’ electricity consumption and submitting energy data to electricity retailers.
Elenia’s primary goal is to provide continuously developing electricity network services to its customers allowing society to function, mainly prior-itizing improved distribution reliability by increasing the use of underground power lines and improving customer service by implementing smart services that take advantage of automation. The company is a pioneer in weather-tolerant electricity network solutions. Since 2009, the company has built only weather-resistant underground distribution power lines. In 2012, Elenia invested approximately EUR 60 million in developing electricity networks.
Elenia is recognised both domestically and internationally as a leader in the field of developing smart electricity networks. Elenia’s customers use smart electricity meters, the first of which were installed a decade ago.
Elenia’s service solutions promote greater energy efficiency. Customers can monitor their electricity consumption on web-based and mobile services that provide comprehensive and customised information on power consump-tion on an hourly, daily and monthly basis. Invoicing is based on actual, not estimated consumption. Elenia is now focusing on developing a next-genera-tion Smart Grid 2.0 ecosystem that responds to tomorrow’s needs for energy efficiency, decentralised renewable electricity generation and elec-tric traffic.
In the event of power outages, Elenia’s smart electricity network auto-matically isolates fault locations, directing power distribution to parts of the grid that are functioning normally. During power outages, customers receive real-time status updates via SMS, email, an online map service and a tele-phone helpdesk.
Elenia’s strategic objectives are:1. To create superior service experiences for customers 2. To achieve financial targets 3. To grow the business

2 ElEnia
hEaTinG buSinESSElenia Lämpö generates district heating and sells and distributes district heating and natural gas. The company’s power plant in Vanaja produces district heating as well as electricity. Elenia Lämpö has 4,800 customers in its operating areas of Häme, Central Finland, Northern Ostrobothnia and Heinola.
District heating has a strong position in the Finnish heating market with a combined market share of just below 50%. District heating is available in population centres, but the district heating network can also be extended to less densely populated residential areas nearby. Elenia Lämpö uses auto-matic meter-reading technology that allows it to provide accurate heat invoices and consumption reports to customers on a monthly basis.
Elenia Lämpö focuses on renewable fuels, which make up over 50% of total fuel consumption for heat generation. In the Finnish district heating market as a whole, the share of renewable fuels is approximately 20%.
The core focal points of Elenia Lämpö’s strategy are:• Stable development in terms of the result of operations• Growing the business through active sales work, new services and com-
munications• Improving and maintaining the efficiency of operating performance• Successful fuel purchasing • Low environmental impact from operations through the use of biofuels
buSinESS rEviEw2012 was Elenia’s first year as an independent electricity distribution and heating company. Early 2012 was operationally challenging due to the worst storms in Finnish history for a decade at the turn of 2011–2012, with wide-spread power outages, yet Elenia came through these challenges.
During the year, the company successfully built the independent Group’s administration and operations. Group achieved its targets relating to the new organisation, customer service and investments. Elenia highlighted customer service development as a key priority in the first year of operation. As con-firmed by customer satisfaction surveys, customer service was substantially improved through the development of management models and operating processes and the creation of new service solutions.
Elenia took a major technological step forward in its electricity network operations in 2012 that allows it to manage the electrical energy across the entire network at the hourly output level. This makes Elenia the first electric-ity distribution company in Europe that has the ability to distinguish between electricity to be sold and the required grid loss. As a result, Elenia is able to purchase grid loss electricity, which is required for maintaining electricity distribution operations, through competitive tendering.
Elenia has long used smart electricity meters that allow customers to monitor their consumption on hourly basis. The smart meters also report meter readings to Elenia automatically. Late in 2012, Elenia launched an advanced mobile application free of charge for its customers for monitoring electricity consumption data, checking power outages and reporting threat-ening faults in the network. In the future, the application will enable the control of electricity consumption.
Elenia Lämpö was successful in its new customer acquisition in 2012 despite the sluggishness in construction activity due to economic uncer-tainty. The temperature-corrected total district heating volume supplied in 2012 was normal. Elenia Lämpö increased the price of district heat by 5–8% late in the year. There are currently major projects underway in Elenia Lämpö’s area of operation that will be connected to the district heating network.
nuMbEr oF EMPloyEESThe Group employed approximately 350 persons during 2012. Close coop-eration with local partner companies is an integral part of the Group’s opera-tions. Including the personnel of partner companies, Elenia’s business opera-tions utilise some 1,000 people.
FinanCial rESulTElenia Group’s total revenue in 2012 was EUR 299.6 million. Operating profit was EUR 53.5 million and loss for the year was EUR -44.2 million. Loss is due to net finance costs in aggregate EUR 104.4 million.
invESTMEnTS, aCquiSiTionS and divESTMEnTSElenia Verkko Oy acquired 50% of Asikkalan Voima Oy in August. In Decem-ber, Elenia Lämpö Oy sold 44.68% of Saarijärven Kaukolämpö Oy to the City of Saarijärvi.
buSinESS uniTS: kEy FiGurES and briEF dESCriPTionS oF ThE FinanCial dEvEloPMEnT oF oPEraTionSElectricity distribution’s revenue was EUR 221.7 million and EBITDA EUR 133.6 million. District heating’s revenue was EUR 78.8 million and EBITDA EUR 20.9 million. Electricity distribution business was affected by the severe storm in the early part of the year, but otherwise year 2012 did not operation-ally contain any exceptional items. District heating had normal year in terms of temperature-corrected heating volume delivered, but the actual volume delivered was higher than in 2011.
CorPoraTE GovErnanCEElenia Oy’s Board of Directors convened 10 times in 2012. Members of the Board of Directors at the end of period were Anna Dellis (Chairman), Antoine Clauzel, Dominique Le Gal, Katja Salovaara and Anirudha Satchcroft. Tapani Liuhala was elected Managing Director of the company. Members of the Board of Directors as of 2 January 2013 are Timo Rajala (Chairman), Heidi Koskinen, Tapani Liuhala, Peter Lyneham, Scott Moseley, Aapo Nikunen, Anirudha Satchcroft and Philip White.
SharESThe company has 100 outstanding shares, each share entitles the holder to one vote at the Annual General Meeting and carrying equal rights to dividend.
nEGaTivE EquiTy and rEMoval oF rEGiSTraTionThe Board of Directors of Elenia Oy has made a register notification on the loss of share capital on 12 June 2012. Elenia Oy intends to make a register notification on the removal of this register entry as soon as practicable after the preparation of its accounts. The removal of this register entry will be based on the depreciation difference shown in Elenia Oy’s books after prepa-ration of its accounts. The Finnish Companies Act provides that, in the calcu-lation of equity for the purposes of loss of share capital, the compound difference between the actual and planned depreciation of the assets of Elenia Oy (depreciation difference) shall be taken into account as addition to equity.
Negative equity is caused by capital structure as shareholder loans in the amount of EUR 590.8 million are interest bearing liability. However, the shareholder loans rank junior with respect to payment of interest and princi-pal to a loan of EUR 959.7 million from Finnish and international banks. In addition, interest and principal payments of the shareholder loans is subject to Elenia Group meeting financial ratios in the loan agreement. Also in 2012 the operating expenses contained non-recurring costs of EUR 29.7 million,

2 ElEnia FinanCial STaTEMEnTS 2012 3
which will not affect profitability in future years. On balance, negative equity is not affecting ability of Elenia Group to carry out its business operations.
CorPoraTE rESPonSibiliTy Elenia is continuously focused on improving occupational health and safety across all operations. The aim is to get employees actively prevent health and safety risks in their working environments. The company’s uncompromis-ing target is to have zero accidents. The company conducted an extensive health, safety and environmental review in 2012.
Elenia Lämpö has successfully increased the proportion of renewable fuels in heating generation. As a result, the average carbon dioxide emissions per unit of energy generated have declined. No environmental damage occurred in 2012 and Elenia Lämpö was in full compliance with the environ-mental permit requirements for its heating generation operations. External and internal audits and inspections have been carried out on the HSE system.
EnvironMEnTal MaTTErSBoth companies, Elenia Verkko Oy and Elenia Lämpö Oy, have adopted the Energy Efficiency System that is expected of companies which have signed the energy efficiency agreement for industries.
Electricity distribution business has a certified ISO 14001 Environmental Management System. In the ordinary course of electricity distribution opera-tion an environmental permit is not necessary, but construction of new transmission and distribution lines may require such permits and an Environ-mental Impact Assessment.
Also Elenia Lämpö’s operations in Finland have certified ISO 14001 Environmental Management System, except its associate Oriveden Aluelämpö Oy.
Energy production plants with a fuel power exceeding 5 MW have been subject to an environmental permit issued by the municipalities or Regional Centre for Economic Development, Transport and the Environment. However, the amendments in the Environmental Protection Law in 2010 changed the environmental procedure. Since then, the environmental permits have been issued by the municipalities (5–50 MW) or the Regional State Administrative Agencies (>50 MW). In most cases the environmental permit is needed only for electricity or heat producing plants using solid fuels with a fuel power exceeding 20 MW and gas or oil-fired plants with fuel power at least 50 MW. Smaller plants just need to be registered to the environmental authority register. All Elenia Lämpö’s operating plants have the required environmental permits. Currently there are 23 plants having an environmental permit and two having environmental registrations. Most of the environmental permits will gradually be replaced by the registration. It will be done when the valid permit needs to be renewed, latest by 1.1.2018.
riSkS and riSk ManaGEMEnTAs electricity distribution business is based on license awarded by Finnish Electricity Market Authority, Elenia has the right solely to manage its elec-tricity network in the designated geographical area. The biggest operational risks relate to weather conditions, which affect the network causing outages. Outages are managed through having preparedness plan for major outages, constantly developing outage management process, investing in network automation and smart grid technology and having long term capital expendi-ture plan comprising of investments in weatherproof network.
Operational risks relating to heating business comprise of fluctuation of price of fuels as well as sourcing of fuels, price of electricity and emission rights. Risks associated with fuels is mitigated through long terms supply agreements and having own storage. Risks relating to emission rights are mitigated by increasing use of biofuels in own production.
EvEnTS aFTEr ThE balanCE ShEET daTEElenia Verkko Oy and Asikkalan Voima Oy merged with Elenia Oy on 1 January 2013.
ouTlookSociety is increasingly reliant on the distribution reliability and quality of electricity. As the industry changes slowly, Elenia anticipates the developing needs of customers and society in the long term and makes strategic deci-sions accordingly. The uninterrupted availability of electricity will be an absolute requirement of the customers in the future. Elenia’s investment plan, which extends to 2027, emphasises the importance of building under-ground electricity networks that meet this requirement.
In addition to the construction of a weather-tolerant electricity network, future investments will also be focused on business growth in line with the company’s strategic objectives. The first investment to expand the business was the acquisition of the remaining 50% of the share capital of Asikkalan Voima Oy from Lahti Energia. Prior to the acquisition, Elenia already owned half of the company.
Despite the dampened construction activity due to economic uncer-tainty, current construction projects will connect new customers to the district heating network. Companies using fossil fuels and peat will face growing costs as the number of emissions permits for carbon dioxide emis-sions trading will be reduced. District heating will remain a competitive heating technology in terms of its price as well as its environmental impacts in the future.
ThE board oF dirECTorS dividEnd ProPoSal The Board of Directors proposes that no dividend will be paid.

4 ElEnia
consolidated income statementEUR 1,000 Note 1.1.–31.12.2012 1.1.–31.12.2011
Revenue 299,559 0
Other operating income 5 7,912 0Materials and services -106,598 0Employee benefits expense 6 -19,554 0Depreciation and amortisation 7 -74,250 0Other operating expenses 5 -53,805 -1Share of profit of an associate 8 266 0
operating profit 53,530 -1
Finance income 832Finance costs -105,256 -2,296
finance income and costs 9 -104,424 -2,296
loss before tax -50,894 -2,297
Income tax 10 6,697 0
loss for the period -44,196 -2,297
consolidated statement of comPRehensive income EUR 1,000 1.1.–31.12.2012 1.1.–31.12.2011
loss for the period -44,196 -2,297
Other comprehensive income
Net movement of cash flow hedges -34,949 0Income tax effect 8,562 0Net/(loss)/gain on available-for-sale financial assets 1,175 0Income tax effect -288 0Actuarial changes in defined benefit plans -534 0Income tax effect 131 0
Other comprehensive income for the period after tax -25,902 0
total comprehensive income for the period -70,099 -2,297
4 ElEnia FinanCial STaTEMEnTS 2012 5
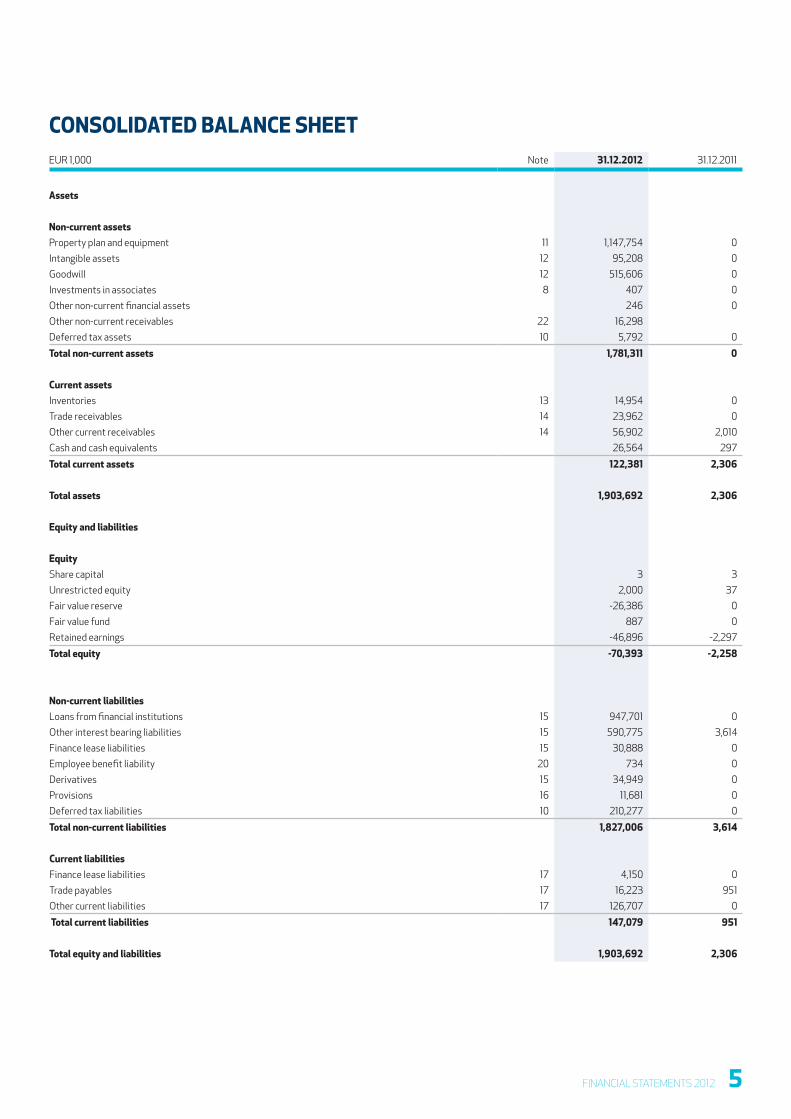
consolidated Balance sheetEUR 1,000 Note 31.12.2012 31.12.2011
assets
non-current assetsProperty plan and equipment 11 1,147,754 0Intangible assets 12 95,208 0Goodwill 12 515,606 0Investments in associates 8 407 0Other non-current financial assets 246 0Other non-current receivables 22 16,298Deferred tax assets 10 5,792 0
total non-current assets 1,781,311 0
current assetsInventories 13 14,954 0Trade receivables 14 23,962 0Other current receivables 14 56,902 2,010Cash and cash equivalents 26,564 297
total current assets 122,381 2,306
total assets 1,903,692 2,306
equity and liabilities
equityShare capital 3 3Unrestricted equity 2,000 37Fair value reserve -26,386 0Fair value fund 887 0Retained earnings -46,896 -2,297
total equity -70,393 -2,258
non-current liabilitiesLoans from financial institutions 15 947,701 0Other interest bearing liabilities 15 590,775 3,614Finance lease liabilities 15 30,888 0Employee benefit liability 20 734 0Derivatives 15 34,949 0Provisions 16 11,681 0Deferred tax liabilities 10 210,277 0
total non-current liabilities 1,827,006 3,614
current liabilities Finance lease liabilities 17 4,150 0Trade payables 17 16,223 951Other current liabilities 17 126,707 0
total current liabilities 147,079 951
total equity and liabilities 1,903,692 2,306

6 ElEnia
consolidated statement of changes in equity
EUR 1,000 Share capital
Reserve for invested
non-restricted equity
Available for sale reserve
(Fair value fund)
Cash-Flow hedge fund
(Fair value reserve)
Retained earnings Total equity
equity at 1 January 2011 0 0 0 0 0 0Comprehensive income
Profit for the year -2,297 -2,297total comprehensive income for the period 0 0 0 0 -2,297 -2,297Transactions with shareholders
Increase 3 37 39Total transactions with shareholders 3 37 0 0 0 39
equity at 31 december 2011 3 37 0 0 -2,297 -2,258
equity at 1 January 2012 3 37 0 0 -2,297 -2,258Comprehensive income
Profit for the year -44,196 -44,196Other components of comprehensive income (adjusted by tax effect)
Cash flow hedging -26,386 -26,386Available-for-sale financial assets 887 887Change in defined benefit plans -403 -403
total comprehensive income for the period 0 0 887 -26,386 -44,599 -70,099Transactions with shareholders
Increase 1,964 1,964Total transactions with shareholders 0 1,964 0 0 0 1,964
equity at 31 december 2012 3 2,000 887 -26,386 -46,896 -70,393

6 ElEnia FinanCial STaTEMEnTS 2012 7
consolidated cash flow statementEUR 1,000 1.1.–31.12.2012 1.1.–31.12.2011
cash flow from operating activitiesLoss for the period -44,196 -2,297adjustmentsDepreciation, amortisation and impairment 74,250 0Other adjustments 105,013 0
change in net working capitalChange in inventories -1,395 0Change in non-interest bearing liabilities -277,593 951Change in non-interest bearing receivables 113,621 -2,010
Interests received 872 0Interests paid -33,657 0Taxes paid -19,211 0
cash flow from operating activities -82,295 -3,356
cash flow from investing activitiesAcquired subsidiaries -1,335,008 0Capital expenditure -64,421 0Changes in investments 3,829 0
cash flow from investing activities -1,395,599 0
cash flow from financing activitiesCapital increase 1,963 39Proceeds from long-term borrowings 1,561,692 3,614Loan facility arrangement costs -24,261 0Repayment of long-term borrowings -15,253 0Repayment of finance lease liabilities -3,682 0Proceeds from short-term loans -16,298 0
cash flow from financing activities 1,504,162 3,653
total 26,267 297
Cash and cash equivalents 1.1.2012 297 0Cash and cash equivalents 31.12.2012 26,564 297change in cash and cash equivalents 26,267 297
Cash and cash equivalents comprises of cash balance at bank accounts.

8 ElEnia
2. descRiPtion of Business oPeRationsElenia Oy is a Finnish limited liability company domiciled in Helsinki (address: Televisiokatu 4). Elenia Oy’s parent company is Lakeside Network Invest-ments Holding B.V., a company duly incorporated under the laws of the Neth-erlands and having its registered office at Telestone 8, Teleport, Naritaweg 165, 1043 BW Amsterdam, The Netherlands. The parent of the Lakeside Network Investments Holding B.V. is Lakeside Network Investments S.à.r.l, domiciled in Luxembourg.
The consolidated financial statements are consolidated in the financial statements of Lakeside Network Investments S.à.r.l, available at the follow-ing address: 2, rue du Fossé L - 1536 Luxembourg.
Elenia’s business operations comprise electricity distribution and dis-trict heating solutions as well as customer service functions.
Elenia Group was formed on 10 January 2012 as a result of Vattenfall selling its Finnish electricity distribution and district heating operations.
The Board of Directors approved the financial statements on the 17th of April 2013. The shareholders have the right either to approve, reject or change the financial statements in the Annual General Meeting.
2.1 aCCounTinG PoliCiESThe consolidated financial statements have been prepared in accordance with the International Financial Reporting Standards (IFRS) and their inter-pretations (IFRIC) approved for application within the EU. The financial statements are compliant with the provisions of the Finnish Accounting Act and other regulations governing the preparation of financial statements in Finland.
The consolidated financial statements have been prepared based on original cost, except for available-for-sale financial assets, financial assets and liabilities recorded at fair value through profit or loss and derivative contracts used for hedging purposes.
All Group companies use the euro as their operating currency and all figures are reported in euros. The consolidated financial statements are presented in thousands of euros. There may be rounding discrepancies in the sum totals due to the presentation method used.
2.2 CoMParabiliTy wiTh PrEviouS FiGurESAs the Group formed and began operations as a result of an enterprise sale completed on 10 January 2012, comparison figures for 2011 are only available for some of the items presented in the financial statements and the notes to the financial statements. Comparison figures are only presented for parent company items, primarily involving financial transactions. The parent com-pany was established on 2 December 2011 and its previous accounting period was 2 December 2011–31 December 2011.
2.3 nEw STandardS and aMEndMEnTS To and inTErPrETaTionS oF ExiSTinG STandardSNew accounting standards are adopted by the Group on the date when their implementation becomes mandatory, with the exception of IAS 19 Employee Benefits, which was already implemented in the financial year 2012.
As the Group has prepared its first IFRS financial statements for the financial year ended on 31 December 2012, new standards and amendments
to existing standards have not had any impact on the accounting policies applied.
2.4 ConSolidaTion PrinCiPlESThe consolidated financial statements comprise the parent company Elenia Oy and, as subsidiaries, all companies in which Elenia Oy directly or indirectly holds a share in excess of 50% of voting rights or otherwise has the power to govern the financial and operating policies of the corporation or business entity in question. The consolidated financial statements also include, as associated companies, any companies in which the Group holds 20–50% of the votes or otherwise has significant influence without having control.
Subsidiaries are included in the financial statements using the acquisi-tion cost method. The acquisition cost is measured as the aggregate of the fair value of the assets given and liabilities incurred or assumed at the date of exchange. Costs related to acquisitions are recorded on the income state-ment as other operating expenses. The excess of the cost of acquisition over the fair value of the Group’s share of the net assets acquired is recorded as goodwill. Subsidiaries are fully consolidated from the date on which control is transferred to the Group.
Intercompany transactions, receivables and debts are eliminated in the consolidated financial statements.
Where necessary, the accounting policies of subsidiaries have been changed to ensure consistency with the accounting policies adopted by the Group.
The subsidiaries do not have non-controlling interests.Investments in associated companies are valued at acquisition cost on
the date of the acquisition. Interests in associated companies are accounted for using the equity method. The Group’s share of its associated companies’ post-acquisition profits or losses after tax is recognised in the income state-ment.
The carrying value of the investment is adjusted by post-acquisition changes in equity. Investments in associated companies include the goodwill recorded for the acquisition. Goodwill is not amortised or individually tested for impairment. If the Group’s share of losses in an associated company exceeds the carrying value of the investment, the investment is recorded on the balance sheet as having zero value and losses in excess of the carrying value are not recognised in the consolidated financial statements unless the Group has incurred obligations on behalf of the associated company.
After consolidation, the Group assesses whether there is a need to record impairment for an associated company. If there are indications that the value of the investment has declined, the Group calculates the loss on impairment and records the difference between the working value and book value on the income statement as a loss.
Unrealised gains on transactions between the Group and its associates are eliminated to the extent of the Group’s interest in the associated com-pany. The Group’s share of the results of associated companies for the finan-cial period is presented as a separate item after operating profit.
The accounting policies of associated companies have been changed where necessary to ensure consistency with the policies adopted by the Group.
accounting Policies aPPlied to the consolidated financial statements

8 ElEnia FinanCial STaTEMEnTS 2012 9
2.5 CalCulaTion PrinCiPlES
2.5.1 TranSlaTion diFFErEnCESTransactions denominated in foreign currencies are translated using the exchange rate at the date of the transaction. Receivables and liabilities denominated in foreign currencies outstanding on the date of closing the accounts are translated using the exchange rate quoted on the closing date. Exchange rate differences are recorded in financial income and expenses, or other business expenses, depending on the nature of the item in question.
2.5.2 rESEarCh and dEvEloPMEnT CoSTSResearch and development costs are recognised as an expense in the year in which they are incurred. Research and development costs are included in the consolidated income statement under personnel costs and other business expenses. As research expenses, these costs do not meet the criteria for capitalisation.
2.5.3 GovErnMEnT GranTSGovernment grants relating to the purchase of property, plant and equip-ment are recognised by reducing the book value of the asset they relate to when the decision on the grant has been received. The grants are thus capi-talised in the form of lower depreciation over the useful life of the asset.
Other government grants are recognised as other income in the income statement for the period in which the expenses relating to the grant are incurred and in which the decision on the grant is received.
2.5.4 rEvEnuE rECoGniTionRevenue from the sale of electricity and heat is recognised at the time of delivery.
Sales revenue from customer service operations is recognised for the period in which the service is produced.
Connection fees paid by customers for joining an electricity or heating network are recognised as revenue in the income statement.
Electricity network connection fees paid by customers prior to 2008 must be refunded, less termination fees, to customers that terminate the service contract. District heating network connection fees are also refund-able for customers who want to terminate the heating service contract. A provision has been recorded for future refunds.
2.5.5 oThEr oPEraTinG inCoMEOther operating income includes ordinary income from non-operating activi-ties, such as insurance compensation and rental income. Rental income is recognised as other operating income over the course of the rental period.
2.5.6 EMiSSion allowanCESPurchased emission allowances are accounted for as intangible assets at acquisition cost plus transaction costs. Unused emission allowances received free of charge are not recognised on the balance sheet. In the event that the amount of emission allowances returned exceeds the amount of emission allowances received, a provision is recognised at the market value of the emission allowances at the date of closing the accounts. The cost of the provision is recognised in the income statement within materials and services. Gains from the sales of emission rights are reported in other income.
2.5.7 ProPErTy, PlanT and EquiPMEnTProperty, plant and equipment comprise mainly power and heat distribution networks, machinery, equipment and buildings.
Property, plant and equipment are stated at original acquisition cost less accumulated depreciation and accumulated impairment losses as applicable on the consolidated balance sheet. The original acquisition cost includes expenditure that is directly attributable to the acquisition of an item. Subse-quent costs are included in the asset’s carrying amount or recognised as a separate asset, as appropriate, only when it is probable that future economic benefits associated with the item will flow to the Group and the acquisition cost of the item can be reliably measured.
When a property, plant and equipment asset no longer has any expected revenue streams, the asset is dismantled and the remaining carrying value is recognised as an expense under other operating expenses.
Acquired assets on the acquisition of a new subsidiary are stated at their fair values at the date of acquisition.
All other repairs and maintenance costs are charged to the income statement during the financial period in which they are incurred.
Land and water areas are not depreciated since they have indefinite useful lives. Depreciation on other assets is calculated using the straight-line method to allocate their cost to their residual values over their estimated useful lives, as follows:
Buildings and structures 15–50 yearsElectricity transport network 25–40 yearsElectricity distribution network 10–30 yearsDistrict heating and natural gas network 30 yearsMachinery and equipment 3–30 years
The assets’ residual values and useful lives are reviewed, and adjusted, if appropriate, at each closing date. An asset’s carrying amount is written down immediately to its recoverable amount if the asset’s carrying amount is greater than its estimated recoverable amount.
Gains and losses on the sales of property, plant and equipment are recorded as the difference between the selling price and carrying value and recognised in the income statement under other operating income or expenses.
2.5.7.1 Borrowing costsBorrowing costs directly attributable to the acquisition or construction of an asset that necessarily takes a substantial period of time to get ready for its intended use or sale are capitalised as part of the cost of the asset. All other borrowing costs are expensed in the period in which they occur. Borrowing costs consist of interest and other costs that an entity incurs in connection with the borrowing of funds. Currently, Elenia has not capitalized any borrow-ing costs since there has not been any qualifying assets.
2.5.8 inTanGiblE aSSETS Intangible assets, except goodwill and paid connection fees, are stated at original acquisition cost less accumulated amortisation and impairment losses if applicable and amortised on a straight-line method over their expected useful lives.
2.5.8.1 Computer softwareAcquired computer software licences are capitalised on the basis of the costs incurred from the acquisition and implementation of the software. These costs are amortised over their estimated useful lives (three to five years). Costs associated with developing or maintaining computer software are recognised as an expense as incurred.
10 ElEnia
2.5.8.2 Compensation paid to landowners One-time compensation payments paid to landowners for inconvenience and damage caused by the power company’s cables and equipment are capital-ised.
Recurring annual compensation payments are recognised as an expense on the income statement under other operating expenses.
2.5.8.3 Contractual customer relationshipsContractual customer relationships acquired in a business combination are recognised at fair value on the acquisition date. The contractual customer relations have a finite useful life and are carried at acquisition cost less accumulated amortisation. Amortisation is calculated using the straight-line method over the expected life of the customer relationship.
2.5.8.4 GoodwillGoodwill represents the excess of the cost of an acquisition over the fair value of the Group’s share of net assets of the acquired subsidiary/associate at the date of acquisition.
Goodwill on acquisitions of subsidiaries is included in intangible assets. Separately recognised goodwill is tested annually for impairment and carried at acquisition cost less accumulated impairment losses. Impairment losses on goodwill are not reversed.
2.5.8.5 Amortisation periods for intangible assetsComputer software and licences 3 yearsCustomer relationships 20 yearsCompensation paid to landowners 10–30 years
2.5.8.6 Impairment of non-financial assetsThe carrying values for individual assets are assessed at each reporting date to determine whether there is any indication of impairment. When consider-ing the need for impairment, the Group assesses whether events or changes in circumstances indicate that the carrying amount may not be recoverable. An impairment loss is recognised if the balance sheet value of an asset or cash-generating unit exceeds its recoverable amount.
An impairment loss relating to property, plant and equipment and intan-gible assets other than goodwill is reversed in the event of a change in cir-cumstances that results in the asset’s recoverable amount changing from the time the impairment loss was recorded. An impairment loss recorded on goodwill is not reversed under any circumstances.
Goodwill is tested for impairment annually as at 31 December and when circumstances indicate that the carrying value may be impaired.
In assessing value in use, the estimated future cash flows expected to be derived from a cash-generating unit are discounted to their present value. The financial projections used in the calculations are based on business plans approved by management.
2.5.9 TradE rECEivablESTrade receivables are recorded on the balance sheet at their fair value. Impairment is recorded on trade receivables when there is evidence that the Group will not be able to collect all amounts due according to the original terms of the agreements. Such evidence of impairment may include signifi-cant financial difficulties of the debtor, probability that the debtor will enter into bankruptcy or financial reorganisation, and default or delinquency in payments. The impairment amount is measured as the difference between the asset’s original balance sheet value and the estimated future cash flows.
Trade receivables also include invoiced sales revenue based on esti-mates.
2.5.10 CaSh and CaSh EquivalEnTSCash and cash equivalents comprise deposits held at call with banks.
2.5.11 lEaSES2.5.11.1 The Group as the lesseeLeases of property, plant and equipment, where the Group has a substantial share of the risks and rewards of ownership, are classified as finance leases. Finance leases are capitalised at the commencement of the lease term at the lower of the fair value of the leased property and the present value of the minimum lease payments determined at the inception of the lease. Each lease payment is allocated between the finance charges and the reduction of the outstanding liability. The interest element of the finance cost is charged to the income statement over the lease term so as to produce a constant periodic rate of interest on the remaining balance of the liability for each period. The property, plant and equipment acquired under finance leases are depreciated over the shorter of the useful life of the asset or the lease term. The corresponding rental obligations, net of finance charges, are included in the long-term or short-term interest-bearing liabilities according to their maturities.
Leases of property, plant and equipment, where the risks and rewards of ownership remain with the lessor, are classified as operating leases. Lease payments for operating leases are recognised on the income statement under other operating expenses over the lease term.
2.5.11.2 The Group as the lessorLeases in which the Group is the lessor are all categorised as operating leases and the assets concerned are included in the Group’s property, plant and equipment. Lease payments received for operating leases are recog-nised on the income statement under other operating income over the lease term.
2.5.12 invEnToriESInventories mainly consist of fuels and spare parts used in the production process Inventories are stated at the lower of acquisition cost and net realis-able value. Acquisition cost is determined using the first-in, first-out (FIFO) method. Net realisable value is the estimated selling price under standard operations, less variable selling expenses and other production costs.
2.5.13 ProviSionSProvisions are recognised when the Group has a present legal or constructive obligation as a result of past events to a third party, provided that it is prob-able that the obligation will be realised and the amount can be reliably esti-mated.
2.5.13.1 Refundable connection fees Electricity network connection fees, which have been paid by the customers before 2008, must be refunded net of demolition costs, if the customer wants to terminate the electricity connection. Similar refunding obligation applies to all district heating connection fees.
A provision has been made for future refunds by calculating a net pre-sent value of estimated future refunds.
2.5.14 inCoME TaxESThe income tax payable for the period is based on taxable profit for the year. Taxable profit differs from profit as reported in the consolidated income statement due to items of income or expense that are taxable or deductible in other years and items that are never taxable or deductible.

10 ElEnia FinanCial STaTEMEnTS 2012 11
Tax expense comprises the tax based on the company’s taxable income for the period and the change in deferred taxes. Taxes are recognised through profit or loss, except where they are related to the statement of comprehensive income or items entered directly through equity.
In such cases, the tax effect is also recognised in the corresponding items. The tax based on taxable income for the period is calculated on the taxable income according to the applicable tax rate. The tax is adjusted for any tax related to previous periods.
Deferred tax is calculated on the basis of temporary differences between carrying value and taxable value. However, deferred tax is not accounted for if it arises from the initial recognition of an asset or liability in a transaction other than a business combination that, at the time of the transaction, affects neither accounting nor taxable profit or loss.
The most significant temporary differences result from adjustments based on fair value recorded in conjunction with business combinations, losses for the financial period and the differences in timing between taxation and amortisation as well as financial assets.
Deferred tax assets are recognised to the extent that it is probable that they can be utilised against future taxable income.
Deferred tax is calculated using the tax rates that have been enacted or substantively enacted by the end of the reporting period.
Deferred tax assets and liabilities are offset when the company has a legally enforceable right to offset current tax assets against current tax liabilities and it intends to realise the asset and settle the liability simultane-ously.
2.5.15 PEnSion obliGaTionS Pension arrangements are categorised as defined benefit or defined contri-bution plans.
Under defined contribution plans, the Group pays fixed pension contri-butions and has no legal or constructive obligation to make additional pay-ments. This category includes the Finnish Statutory Employment Pension Scheme (TyEL). Payments relating to defined contribution pension plans are recognised in the income statement under personnel expenses for the period in which they are due.
For defined benefit plans, pension costs are assessed using the pro-jected unit credit method. The cost of providing pensions is recorded on the income statement as to spread the service cost over the service lives of employees. The defined benefit obligation is calculated annually on the reporting date and is measured as the present value of the estimated future cash flows.
The company applies the new IAS 19 standard to calculations on defined benefit pension plans. Under the new standard, all actuarial gains and losses are recognised in the period in which they occur in total in other comprehen-sive income and the net defined benefit liability or asset is presented in full on the balance sheet. The expected return on plan assets is calculated using the same discount rate as applied for the purpose of discounting the benefit obligation to its present value. Current and past service costs as well as net interest on net defined benefit liability is recorded in profit or loss. Items arising from the remeasurement of the net defined benefit liability are recognised in other comprehensive income.
2.5.16 FinanCial inSTruMEnTS – iniTial rECoGniTion and SubSEquEnT MEaSurEMEnT
ClaSSiFiCaTion oF CurrEnT and non-CurrEnT aSSETS and liabiliTiESAn asset or a liability is classified as current when it is expected to be real-ised within twelve months after the balance sheet date or it is classified as
financial assets or liabilities held at fair value through profit or loss. Liquid funds are classified as current assets.
All other assets and liabilities are classified as non-current assets and liabilities.
2.5.16.1 Financial assets
Initial recognition and measurementFinancial assets within the scope of IAS 39 are classified as financial assets at fair value through profit or loss, loans and receivables, available-for-sale financial assets, or as derivatives designated as hedging instruments in an effective hedge, as appropriate. The Group determines the classification of its financial assets at initial recognition.
All financial assets are recognised initially at fair value plus transaction costs, except in the case of financial assets recorded at fair value through profit or loss. Purchases or sales of financial assets are recognised on the trade date.
Subsequent measurementThe subsequent measurement of financial assets depends on their clas-sification as described below:
2.5.16.1.1 Financial assets at fair value through profit or lossA financial asset is classified in this category if acquired principally for the purpose of selling in the short term. Derivatives are categorised as held for trading unless they are designated as hedging instruments.
Financial assets at fair value through profit or loss are carried in the statement of financial position at fair value with net changes in fair value presented as finance costs (negative net changes in fair value) or finance income (positive net changes in fair value) in the income statement.
2.5.16.1.2 Loans and receivablesLoans and receivables are non-derivative financial assets with fixed or deter-minable payments that are not quoted in an active market. Loans and receiv-ables also include trade receivables and other receivables. Loans are carried at amortised cost using the effective interest method less accumulated impairment. The losses arising from impairment are recognised in the income statement in finance costs for loans and in cost of sales or other operating expenses for receivables.
2.5.16.1.3 Available-for-sale financial investments Available-for-sale financial investments include equity investments. Equity investments classified as available for sale are those that are neither classi-fied as held for trading nor designated at fair value through profit or loss.
After initial measurement, available-for-sale financial investments are subsequently measured at fair value with unrealised gains or losses recog-nised as other comprehensive income in the available-for-sale reserve until the investment is derecognised, at which time the cumulative gain or loss is recognised in other operating income, or the investment is determined to be impaired, when the cumulative loss is reclassified from the available-for-sale reserve to the income statement in finance costs. Interest earned whilst holding available-for-sale financial investments is reported as interest income using the EIR method.
2.5.16.1.4 Derecognition of financial assets Financial assets are derecognised when the rights to the related cash flows have expired or have been transferred and the Group has transferred all substantial risks and rewards of ownership.
12 ElEnia
2.5.16.2 Impairment of financial assetsThe Group assesses, at each reporting date, whether there is objective evidence that a financial asset or a group of financial assets is impaired. A financial asset or a group of financial assets is deemed to be impaired if there is objective evidence of impairment as a result of one or more events that has occurred since the initial recognition of the asset (an incurred ‘loss event’) and that loss event has an impact on the estimated future cash flows of the financial asset or the group of financial assets that can be reliably estimated. Evidence of impairment may include indications that the debtors or a group of debtors is experiencing significant financial difficulty, default or delinquency in interest or principal payments, the probability that they will enter bankruptcy or other financial reorganisation and observable data indicating that there is a measurable decrease in the estimated future cash flows, such as changes in arrears or economic conditions that correlate with defaults.
2.5.16.2.1 Financial assets carried at amortised costIf there is objective evidence that an impairment loss has been incurred, the amount of the loss is measured as the difference between the asset’s carry-ing amount and the present value of estimated future cash flows (excluding future expected credit losses that have not yet been incurred). The present value of the estimated future cash flows is discounted at the financial asset’s original effective interest rate. If a loan has a variable interest rate, the discount rate for measuring any impairment loss is the current EIR.
The carrying amount of the asset is reduced through the use of an allow-ance account and the loss is recognised in profit or loss. (Interest income continues to be accrued on the reduced carrying amount and is accrued using the rate of interest used to discount the future cash flows for the purpose of measuring the impairment loss. The interest income is recorded as finance income in the income statement. Loans together with the associated allow-ance are written off when there is no realistic prospect of future recovery and all collateral has been realised or has been transferred to the Group. If, in a subsequent year, the amount of the estimated impairment loss increases or decreases because of an event occurring after the impairment was recog-nised, the previously recognised impairment loss is increased or reduced by adjusting the allowance account. If a write-off is later recovered, the recov-ery is credited to finance costs in the income statement.
2.5.16.2.2 Available for sale financial investmentsFor available-for-sale financial investments, the Group assesses at each reporting date whether there is objective evidence that an investment or a group of investments is impaired.
In the case of equity investments classified as available-for-sale, objec-tive evidence would include a significant or prolonged decline in the fair value of the investment below its cost. ‘Significant’ is evaluated against the original cost of the investment and ‘prolonged’ against the period in which the fair value has been below its original cost. When there is evidence of impairment, the cumulative loss – measured as the difference between the acquisition cost and the current fair value, less any impairment loss on that investment previously recognised in the income statement – is removed from other comprehensive income and recognised in the income statement. Impairment losses on equity investments are not reversed through profit or loss; increases in their fair value after impairment are recognised directly in other comprehensive income.
2.5.16.3 Financial liabilitiesFinancial liabilities within the scope of IAS 39 are classified as financial liabilities at fair value through profit or loss, loans and borrowings, or as
derivatives designated as hedging instruments in an effective hedge, as appropriate. The Group determines the classification of its financial liabili-ties at initial recognition.
All financial liabilities are recognised initially at fair value and, in the case of loans and borrowings, net of directly attributable transaction costs.
The Group’s financial liabilities include trade and other payables, loans and borrowings, and derivative financial instruments.
Subsequent measurementThe measurement of financial liabilities depends on their classification as described below:
2.5.16.3.1 Financial liabilities at fair value through profit or lossFinancial liabilities at fair value through profit or loss include financial liabili-ties held for trading. Financial liabilities are classified as held for trading if they are acquired for the purpose of selling in the near term. This category includes derivative financial instruments entered into by the Group that are not designated as hedging instruments in hedge relationships as defined by IAS 39.
Gains or losses on liabilities held for trading are recognised in the income statement.
2.5.16.3.2 Loans and borrowingsAfter initial recognition, interest bearing loans and borrowings are subse-quently measured at amortised cost using the EIR method. Gains and losses are recognised in profit or loss when the liabilities are derecognised as well as through the EIR amortisation process.
Amortised cost is calculated by taking into account any discount or premium on acquisition and fees or costs that are an integral part of the EIR. The EIR amortisation is included as finance costs in the income statement.
2.5.16.3.3 DerecognitionA financial liability is derecognised when the obligation under the liability is discharged or cancelled, or expires. When an existing financial liability is replaced by another from the same lender on substantially different terms, or the terms of an existing liability are substantially modified, such an exchange or modification is treated as the derecognition of the original liability and the recognition of a new liability. The difference in the respective carrying amounts is recognised in the income statement.
2.5.16.4 Fair value of financial instruments The fair value of financial instruments that are traded in active markets at each reporting date is determined by reference to quoted market prices or dealer price quotations, without any deduction for transaction costs.
For financial instruments not traded in an active market, the fair value is determined using appropriate valuation techniques. Such techniques may include:• Using recent arm’s length market transactions• Reference to the current fair value of another instrument that is sub-
stantially the same• A discounted cash flow analysis or other valuation models
2.5.16.5 Derivative financial instruments and hedge accounting
Initial recognition and subsequent measurementThe Group uses derivative financial instruments, such as forward currency contracts, interest rate swaps and forward commodity contracts, to hedge its foreign currency risks, interest rate risks and commodity price risks,

12 ElEnia FinanCial STaTEMEnTS 2012 13
respectively. Such derivative financial instruments are initially recognised at fair value on the date on which a derivative contract is entered into and are subsequently remeasured at fair value. Derivatives are carried as financial assets when the fair value is positive and as financial liabilities when the fair value is negative.
For the purpose of hedge accounting, hedges are classified as cash flow hedges when hedging the exposure to variability in cash flows that is either attributable to a particular risk associated with a recognised asset or liability or a highly probable forecast transaction or the foreign currency risk in an unrecognised firm commitment. Currently, Elenia uses only cash flow hedges to hedge against interest rate risk.
At the inception of a hedge relationship, the Group formally designates and documents the hedge relationship to which the Group wishes to apply hedge accounting and the risk management objective and strategy for under-taking the hedge. The documentation includes identification of the hedging instrument, the hedged item or transaction, the nature of the risk being hedged and how the entity will assess the effectiveness of changes in the hedging instrument’s fair value in offsetting the exposure to changes in cash flows attributable to the hedged risk. Such hedges are expected to be highly effective in achieving offsetting changes in cash flows and are assessed on an ongoing basis to determine that they actually have been highly effective throughout the financial reporting periods for which they were designated.
2.5.16.5.1 Cash flow hedgesThe effective portion of the gain or loss on the hedging instrument is recog-nised directly in other comprehensive income in the cash flow hedge reserve, while any ineffective portion is recognised immediately in the income state-ment as other operating expenses.
Amounts recognised as other comprehensive income are transferred to profit or loss when the hedged transaction affects profit or loss, such as when the hedged financial income or financial expense is recognised.
If the forecast transaction or firm commitment is no longer expected to occur, the cumulative gain or loss previously recognised in equity is trans-ferred to the income statement. If the hedging instrument expires or is sold, terminated or exercised without replacement or rollover, or if its designation as a hedge is revoked, any cumulative gain or loss previously recognised in other comprehensive income remains in other comprehensive income until the forecast transaction or firm commitment affects profit or loss.
2.5.17 nEw STandardS and ChanGES To and inTErPrETaTionS oF ExiSTinG STandardSamendments to IFRS 7 Financial Instruments: Disclosures and IAS 32 Finan-cial Instruments: Presentation – Offsetting Financial Assets and Financial Liabilities
The amendments to IFRS 7 are effective for annual periods beginning on or after 1 January 2013. The amendments to IAS 32 are effective for annual periods beginning on or after 1 January 2014.
The amendments to IAS 32 clarify when an entity “currently has a legally enforceable right to set off the recognised amounts” and when offsetting is sufficiently simultaneous for the asset and liability to be netted. The amend-ments are still subject to endorsement by the EU. According to the estimate of the company’s management, the amendment will not have a material effect on the consolidated financial statements.
iFrS 9 FinanCial inSTruMEnTS: ClaSSiFiCaTion and MEaSurEMEnTIFRS 9 is effective for annual periods beginning on or after 1 January 2015. IFRS 9 will completely replace the existing IAS 39 Financial Instruments: Recognition and Measurement.
The initial measurement of financial instruments is made at fair value for all financial assets. Financial assets that are debt instruments and to which the fair value option is not applied are measured following initial recognition either at amortised cost or fair value, depending on the company’s business model for the management of financial assets and contractual cash flows of the financial assets.
As a rule, all equity instruments are measured at fair value following the initial measurement, either through profit or loss or through other compre-hensive income. All equity instruments are to be measured at fair value through profit or loss. Items that are recognised through other comprehen-sive income will no longer be recognised in the income statement if the entity has elected to measure it at fair value through other comprehensive income.
With regard to financial liabilities, the main amendment is that when applying the fair value option, the effect of changes in the entity’s own credit risk on the fair value of the financial liability will be recognised through other comprehensive income. These changes in value recognised through other comprehensive income will no longer be recognised in the income statement. The other current IAS 39 provisions pertaining to financial liabilities will remain largely unchanged. The standard is still subject to endorsement by the EU.
iFrS 10 ConSolidaTEd FinanCial STaTEMEnTS and iaS 27 SEParaTE FinanCial STaTEMEnTS (rEviSEd)The new standard and the amendments to IAS 27 are effective for annual periods beginning on or after 1 January 2013. The EU has endorsed the stand-ard but its implementation will not become mandatory until 1 January 2014.
The new IFRS 10 standard on consolidated financial statements replaces the portion of IAS 27 Consolidated and Separate Financial Statements that addresses the accounting for consolidated financial statements. IFRS 10 does not have an effect on how an entity is consolidated in a Group, but instead on whether an entity is to be consolidated in a Group according to a new definition of which entities are controlled. According to the estimate of the company’s management, the new standard will not have an effect on the consolidated financial statements.
iFrS 11 JoinT arranGEMEnTS and iaS 28 invESTMEnTS in aSSoCiaTES and JoinT vEnTurES (rEviSEd)The new standard and the amendments to IAS 28 are effective for annual periods beginning on or after 1 January 2013. The EU has endorsed the stand-ard but its implementation will not become mandatory until 1 January 2014.
The new standard will replace the IAS 31 Interests in Joint Ventures standard and the SIC 13 Jointly Controlled Entities – Non-Monetary Contri-butions by Venturers interpretation.
According to the new standard, more attention must be paid to the actual nature than the legal form of the arrangement in identifying joint ventures. A significant amendment to the previous treatment of joint ven-tures is that in the future, joint ventures in which the parties have the right to the net assets related to the venture (joint venture) can no longer be consoli-dated proportionately but only with the equity method. According to the estimate of the company’s management, the new standard will not have an effect on the consolidated financial statements.
iFrS 12 diSCloSurES oF inTErESTS in oThEr EnTiTiESThe new standard is effective for annual periods beginning on or after 1 January 2013. The EU has endorsed the standard but its implementation will not become mandatory until 1 January 2014.
The new standard compiles all of the requirements for notes to consoli-dated financial statements in a single standard and includes the require-

14 ElEnia
ments for notes concerning subsidiaries, joint ventures, associates and structured entities.
The standard must be applied retrospectively in accordance with IAS 8 Accounting Policies, Changes in Accounting Estimates and Errors.
According to the estimate of the company’s management, the new standard will result in more extensive information being provided on Group companies in the notes to the financial statements.
iFrS 13 Fair valuE MEaSurEMEnT The new standard is effective for annual periods beginning on or after 1 January 2013.
The standard sets out a single definition of fair value applicable to all IFRS standards and a single approach to measuring fair value. It does not amend the regulations regarding when the reporting entity should measure an asset or liability at fair value. Furthermore, the standard significantly increases the notes to be disclosed on the use of fair values.
The new standard is still subject to endorsement by the EU. According to the estimate of the company’s management, the new standard will not have a material effect on the consolidated financial statements.
aMEndMEnT: iaS 1 PrESEnTaTion oF iTEMS oF oThEr CoMPrEhEnSivE inCoMEThe new standard is effective for annual periods beginning on or after 1 July 2012.
Items of other comprehensive income will be classified with those that will be subsequently reclassified through profit or loss and those that will never be reclassified through profit or loss. The amendment has no impact on which items are recognised in comprehensive income or when the items are reclassified through profit or loss and when they are not. The EU has endorsed the amendment
According to the estimate of the company’s management, the amend-ment will not have a material effect on the consolidated financial state-ments.
annual iMProvEMEnTS To iFrSS (2009–2011 CyClE)The following annual improvements to IFRSs are effective for annual periods beginning on or after 1 January 2013. The amendments are still subject to endorsement by the EU.
iFrS 1 FirST-TiME adoPTion oF iFrSS:The amendment specifies how IFRS 1 is applied in a situation where the entity has previously applied IFRSs, then discontinued the application of IFRSs, and begins to apply IFRSs again.
In addition, the amendment specifies the treatment of borrowing costs capitalised based on the previous financial statements standards when adopting IFRSs.
IAS 1 Presentation of Financial Statements: The amendment clarifies certain requirements for the presentation of com-parison data.
IAS 16 Property, Plant and Equipment:The amendment clarifies that significant spare parts and maintenance tools that meet the definition of property, plant and equipment, i.e. the entity expects to use them during more than one financial periods, are not invento-ries.
IAS 32 Financial Instruments: Presentation:The amendment omits the income tax-related regulations of IAS 32 and requires that entities apply the regulations of IAS 12 Income Taxes.
IAS 34 Interim Financial Reporting:The amendment clarifies the requirements for information on assets and liabilities to be presented for operating segments in connection with interim reports so that the requirements are consistent with IFRS 8 Operating Segments.
The following amendments and interpretations will not have an effect on the consolidated financial statements:
amendment: IFRS 1 Government Loansamendment: IFRS 1 First-time Adoption of IFRSs – Severe Hyperinfla-
tion and Removal of Fixed Dates for First-time Adopters amendments: IFRS 10, IFRS 12, IAS 27 and IAS 28 concerning the con-
solidation of Investment entities in the consolidated financial statements amendment: IAS 12 Income Taxes – Deferred Taxes: Recovery of Under-
lying Assets new interpretation: IFRIC 20 Stripping Costs in the Production Phase of
a Surface Mine.

14 ElEnia FinanCial STaTEMEnTS 2012 15
3. cRitical accounting estimates and discRetionaRy items
The preparation of consolidated financial statements requires management to make estimates and assumptions that affect the reported amounts of assets and liabilities at the dates of the consolidated financial statements and the reported amounts of revenues and expenses during the reporting period. Estimates are based on the management’s best judgement on the reporting date. Estimates are made on the basis of historical experience and expectations of future events that are considered probable on the reporting date. However, actual results and timing may differ from these estimates. The Group’s critical accounting estimates and discretionary items are described below.
3.1 TESTinG Goodwill For iMPairMEnT The Group tests goodwill annually for impairment.
The recoverable amounts of cash-generating units are based on esti-mated future cash flows. Preparation of these estimates requires manage-ment to make assumptions relating to future cash flows. The main variables in determining cash flows are the discount rate and the assumptions and estimates used.
The Group has conducted a sensitivity analysis of the effects of the key assumptions underlying the impairment testing on the test results. (Note 12)
3.2 dEFErrEd TaxESThe Group has deferred tax assets and liabilities which are expected to be realised through the income statement over certain periods of time in the future. The calculation of deferred tax assets and liabilities involves making certain assumptions and estimates regarding the future tax consequences attributable to differences between the carrying amounts of assets and liabilities as recorded in the financial statements and their tax basis. (Note 10)
3.3 ProviSionS Electricity network connection fees paid by customers prior to 2008 must be refunded, less termination fees, to customers that terminate the service contract. District heating network connection fees are also refundable for customers who want to terminate the heating service contract. The provision for refundable connection fees for electricity and heating networks has been calculated by discounting estimated future annual connection fee refunds to their
present value. The calculation is based on the management’s estimate of the volume and timing of refundable connection fees. (Note 16)
3.4 Fair valuES oF inTanGiblE aSSETS and ProPErTy, PlanT and EquiPMEnT aCquirEd in a buSinESS CoMbinaTionIn a business combination, the acquired intangible and tangible assets are measured at fair value and their remaining useful lives are determined. The determination of fair values is based on calculation models that, according to the view of the management, accurately represent the value of the assets. The actual values and useful lives differing from the estimates used may have an impact on the reported amounts. (Appendices 2,3)

16 ElEnia
notes to the consolidated financial statements
note 1
adoPTion oF iFrS STandardSThese financial statements, for the year ended 31 December 2012, are the first the Group has prepared in accordance with IFRS. The previous financial statements for the period that ended on 31 December 2011 were prepared in accordance with the Finnish Accounting Act. The IFRS financial statements for 31 December 2012 contain information ending on 31 December 2011 as comparative information that has been adjusted to correspond to IFRS calculation principles.
The IFRS opening balance sheet was prepared for the date of establish-ment of the company, 2 December 2011, and this is also the Group’s IFRS transition date.
None of the exemptions granted in IFRS 1 First-time Adoption of Interna-tional Financial Reporting Standards have been used in the transition.
ThiS noTE dESCribES ThE kind oF ChanGES ThaT wErE CauSEd by ThE iFrS TranSiTionThe Group was established and the business operations were included in the Group through an enterprise sale that took place on 10 January 2012. Only the parent company’s figures are presented as comparative figures. They mainly include financing transactions.
The adoption of IFRS standards caused no changes to the calculation principles and the figures of the 2011 reporting period.
note 2
buSinESS CoMbinaTionS and aCquiSiTion oF non-ConTrollinG inTErESTSElenia Oy (formerly LNI Acquisition Oy) purchased the Finnish electricity distribution and district heating business operations from the swedish Vattenfall Ab through a share transaction on 10 January 2012. The transaction transferred all shares in Vattenfall Oy engaging in service business (the current Elenia Asiakaspalvelu Oy) and in the distric heating business holding company , Vattenfall Lämpö Holding Oy.
The transaction included the subsidiary engaging in district heating business, Vattenfall Lämpö Oy (the current Elenia Lämpö Oy), Vattenfall Verkko Oy engaging in electricity distribution business (the current Elenia Verkko Oy) and the associates, Asikkalan Voima Oy, Oriveden Aluelämpö Oy and Saarijärven Kaukolämpö Oy.
Elenia Oy acquired the companies in order to begin business operations in Finland, so the entire business operations, revenue and results of business operations of Elenia Group were formed as a result of this transaction.
EUR 1,000 2012
Other intangibles 14,498Customer related intangibles 88,200
intangible assets 102,698
Land and buildings 12,181Network 1,000,628Plant, machinery and equipment 95,995Other fixed assets 21,302
net fixed assets 1,130,106 Inventory 13,559Trade receivables 18,813Other receivables 116,412Shareholdings and financial assets 8,381
other assets 157,165 cash and cash equivalents 59,776
Goodwill 514,157Total assets (excl Goodwill) 1,449,746
total assets (incl goodwill) 1,963,902
Trade payables 17,148Provisions 11,954Deferred tax liabilities 236,226Other liabilities 86,685
non interest bearing liabilities 352,013 Short term liabilities 112,359
interest bearing liabilities 112,359
total liabilities 464,372
net assets 985,374Goodwill 514,157
Purchase consideration 1,499,530

16 ElEnia FinanCial STaTEMEnTS 2012 17
Total acquisiton price was EUR 1,500 billion of which EUR 1,159 billion was paid and net debt amounting EUR 340 million was acquired.
The deferred tax liability is directed at customer relationships, property, plant and equipment, intangible rights and the depreciation difference. Goodwill arises as the difference between the purchase price and identifi-able assets acquired and liabilities undertaken at the time of acquisition. Goodwill is allocated to the Network and Heat segments. Goodwill is not tax deductible
The fair value of current receivables on the balance sheet is 135,2 M€. Current receivables include 18,8 M€ in trade receivables. The fair value of other current receivables corresponds to the gross value.
The Group’s entire revenue and profit before tax arise from the business combination and acquisitions. After the business combination and acquisi-tions took place on the 10 January 2012. the Group’s revenue and profit before tax do not materially differ from the revenue and profit before tax presented in the financial statements.
ANALySIS OF THE CASH FLOWS FROM THE BUSINESS COMBINATION AND ACqUISITIONMEUR 2012
transaction costs from the business combination and acquisition -22- cash at banks and on hand in the companies 60- total consideration paid -1,500
cash flow from the business combination and acquisition -1,462
Transaction costs are included in other operating expenses in the income statement.
note 3
buSinESS CoMbinaTionS and aCquiSiTion oF non-ConTrollinG inTErESTSElenia Verkko Oy acquired a holding of 50% in Asikkalan Voima Oy from Lahti Energia. Asikkalan Voima was an electricity distribution company in which Elenia Verkko and Lahti Energia each held 50% stakes.
After the acquisition, Asikkalan Voima Oy became a wholly-owned sub-sidiary of Elenia Verkko Oy. Elenia already previously had the responsibility for the management of Asikkalan Voima’s electricity network, the enterprise sale meant that the electricity distribution business of Asikkalan Voima was integrated overall as part of Elenia’s electricity distribution operations.
The Group previously owned 50% of the company, so this was a phased business combination. In the business combination, the previously owned equity-based share in the object of the acquisition was valued at a fair value of EUR 7,792 thousand. This was taken into account as part of the acquisi-tion cost in the calculation.
The entire balance sheet of the company (100%) is presented below at the time of acquisition on 28 August 2012 when Elenia Verkko Oy aquired 50%. The purchase price paid was EUR 7,600 thousand, in addition to which the fair value of the previous holding, EUR 7,792 thousand, is taken into account in the calculation below.
EUR 1,000 2012
Intangible assetsOther intangibles 1,555
intangible assets 1,555 Land and buildings 8Network assets 16,559Machinery and equipments 1Other fixed assets (construction in progress) 536
net fixed assets 17,103 Inventory 9Trade receivables 312Other receivables 391
other assets 712 cash and cash equivalents 306 Goodwill 1,449Total assets (excl Goodwill) 19,676
total assets (incl goodwill) 21,125 Trade payables 317Deferred tax liabilities 2,909Other liabilities 187
non interest bearing liabilities 3,413 Short term liabilitiesLong term liabilities 2,320
interest bearing liabilities 2,320 total liabilities 5,733 net assets 13,943Goodwill 1,449
Purchase consideration 15,392
The deferred tax liability is directed at property, plant and equipment, intan-gible rights and the depreciation difference. Goodwill arises as the difference between the purchase price and identifiable assets acquired and liabilities undertaken at the time of acquisition.
The fair value of current receivables on the balance sheet is EUR 704 thousand. Current receivables include trade receivables whose gross value is EUR 312 thousand. The fair value of the current receivables also corresponds to the gross value. The company’s revenue for the entire reporting period amounted to EUR 3,948 thousand and profit to EUR 786 thousand. After the acquisition, EUR 1,452 thousand of this is included in revenue in the consoli-dated financial statements and EUR 439 thousand is included in profit.
ASIKKALAN VOIMAMEUR 2012
Analysis of the cash flows from the business combination- transaction costs from the business combination -122- cash at banks and on hand in the companies 306- total consideration paid -7,600
cash flow from the business combination -7,416
Transaction costs are included in other operating expenses in the income statement.

18 ElEnia
note 4
SEGMENT INFORMATION
EUR 1,000 Networks Heat ServicesSegments
totalCommon
functions
Eliminationsand IFRS
conversionsConsolidated
result
income- income outside the Group 221,666 78,824 6,788 307,277 460 -266 307,471- internal income 387 459 11,201 12,047 -12,047 0
Operating expenses -88,447 -58,336 -23,082 -169,865 -22,138 12,047 -179,956
eBitda 133,606 20,946 -5,094 149,459 -21,678 -266 127,515
Depreciation and amortisation -35,602 -7,350 -677 -43,629 -30,621 -74,250
Share of profit of an associate 266 266eBit 98,004 13,597 -5,771 105,830 -21,678 -30,621 53,531
finance income and costs, net -104,424 -104,424income tax 6,697 6,697loss for the period -44,196
nwc *) 11,546 16,408 0 27,954 -82,426 -54,472
investments 67,808 3,331 -291 70,848 0 70,848
average number of employees 162 91 90 343 6 349
NWC *) Consists of trade receivables, other current receivables, trade payables and other current liabilities excluding short term interest bearing liabilities.
The Group presents segment information in a way that is consistent with the management reporting which is carried out in accordance with IFRS. The segments comprise the Networks and Heat segments defined on the basis of business areas and the Services segment comprising the customer ser-vice functions. Other functions are presented as common functions. The highest operational decision-maker is the Board of Directors of Elenia Oy.
nETworkS SEGMEnTManages, maintains and operates electricity distribution networks and provides electricity transmission services to approximately 410,000 home, business and public sector customers in the area of approximately one hundred municipalities in Tavastia, Pirkanmaa, Central Finland and Ostro-bothnia. The Networks segment is responsible for the functionality and renewal of the electricity network, the construction of the electricity net-work and electricity connections and the measurement of its customers’ electricity consumption.
hEaT SEGMEnTThe Heat segment comprises the joint production of electricity and heat and district heating operations in a number of localities in Finland. In addition, Heat engages in the sales and distribution of natural gas.
SErviCES SEGMEnTThe Services segment manages the common customer service functions of Elenia Group, which include inbound and outbound services to customers on the telephone and in electronic channels. The Service segment also manages customer invoicing and collection and produces services related to the processing and management of customer data. Common functions include financial items and taxes and the figures of the parent company, Elenia Oy.
The intra-Group transactions are eliminated in consolidation, and they are included in the “eliminations and IFRS adjustments” column in order to obtain consolidated revenue, EBITDA and EBIT.
The Group’s entire business operations are in Finland, and the Group has no customer which accounts for more than 10% of the income.

18 ElEnia FinanCial STaTEMEnTS 2012 19
note 5
oThEr oPEraTinG inCoME and ExPEnSES
OTHER OPERATING INCOMEEUR 1,000 2012
Gains from the sales of emission allowances 1,390Rental income 493Insurance indemnities 3,142Capital gains on tangible and intangible assets 800Subsidy for bio-based electricity production 168Other operating income 1,919
total 7,912
OTHER OPERATING ExPENSES EUR 1,000 2012 2011
Lease expenses 3,627External services 6,646IT and communication expenses 6,623Research and development costs 573Non-recurring costs related to business combina-tions and acquisitions 27,247Other non-recurring costs 2,410Other expenses 6,679 1
total 53,805 1
Other operating expenses include non-recurring costs relating to completion of acquisition and subsequent separation costs in the amount of 29,657 t€. In addition to non recurring costs, other expenses include lease and other real estate related costs and purchase of services. IT- and communication costs comprise of both internal operating IT costs and purchased IT services from Vattenfall.
Research and development costs mainly include costs of research projects that do not meet the criteria for capitalisation.
AUDITORS’ FEESEUR 1,000 2012
Auditing fees 88Fees for tax services 17Fees for other services 2
total 106
Ernst & young was appointed as the auditor until the Annual General Meeting held in the 2013 reporting period.
Auditing fees include fees for auditing the consolidated financial state-ments and for auditing the parent company and subsidiaries. Fees for tax services include fees charged for tax advice. Fees for other services consist of assignments concerning the establishment of the Group and other assign-ments.
note 6
EMPLOyEE BENEFITS ExPENSEEUR 1,000 2012
Salaries and remuneration -15,126Pensions
Defined contribution plans -3,213Defined benefit plans -30
Social security costs -1,185
total -19,554
The total remuneration paid by Elenia Group to its employees consists of salaries, fringe benefits and short-term performance bonus schemes. All employees of Elenia Group are included within the scope of the performance bonus scheme.
EUR 1,000 2012
Salaries and remuneration paid to CEOs 504Pension expenses related to salaries 116
note 7
DEPRECIATION, AMORTISATION AND IMPAIRMENTEUR 1,000 2012
Depreciation and amortisation on property, plant and equipment -63,855Depreciation and amortisation on intangible assets -10,395
total -74,250
note 8
INVESTMENT IN AN ASSOCIATEEUR 1,000 2012
Acquisition cost at 1 January 0Business combination 7,972Share of profit for the year 266Decrease -7,791Dividends received -41
acquisition cost at 31 december 2012 407
Elenia Lämpö Oy owned 44.6% of Saarijärven Kaukolämpö Oy until 19 December 2012. On 28 August 2012, Elenia Verkko Oy acquired 50% of the shares in Asikkalan Voima, after which the company is included in the consoli-dated financial statements as a subsidiary. Both transactions are presented in the above calculation in the “decrease” row.
Elenia’s share of the profit of associates and joint ventures for 2012 was EUR 266 thousand.

20 ElEnia
ASSOCIATES AT 31 DECEMBER 2012
EUR 1,000 Segment Holding, % Assets Liabilities Revenue Profit/loss
Oriveden Aluelämpö Oy Heat 50 4,212 3,903 1,677 91
note 9
FINANCE INCOME AND COSTSEUR 1,000 2012 2011
Interest expensesLoans -99,311 0Other interest expenses -1,594 0
total interest -100,905 0Impairment losses on available-for-sale financial investmentsOther finance costs -3,282 0Interest rate hedges not qualified for hedge accounting,
changes in fair value -1,059 -2,296Ineffective portion of cash flow hedgingExchange rate differences
Loans and receivables -10
total -105,256 -2,296
Interest incomeOther interest income 831 0
Dividend income 1 0Exchange rate differencesLoans and receivables
total 832 0finance costs (net) -104,424 -2,296
FinanCE inCoME and CoSTSInterest expenses include interest expenses on interest-bearing loans and interest rate swaps.Other interest expenses mainly consist of interest on finance leases (EUR 1.4 million). Interest income includes interest on bank deposits (EUR 48 thousand) and income from the interest on mutual funds in limited partnerships (EUR 250 thousand)
Operating profit includes EUR 2 thousand (2011: 0) and finance costs EUR 10 thousand (2011:0) of exchange rate differences.
note 10
INCOME TAxEUR 1,000 2012
Specification of income taxes -50,894Tax paid on the basis of the profit for the year -20,741Adjustments to taxes for previous periods -657Deferred taxes 28,095
loss for the period -44,196
inCoME Tax raTETax on profit before tax deviates from the nominal tax calculated according to the tax rate as follows:
EUR 1,000 2012
Profit before tax -50,894Tax calculated using the nominal tax rate 12,469- tax-free income items 1,125- expenses that are non-deductible in taxation -6,306- share of the profits of associates 65- adjustment of taxes based on previous periods -657
income tax in the income statement 6,697
The tax rate according to the income statement was 13%

20 ElEnia FinanCial STaTEMEnTS 2012 21
CHANGE IN DEFERRED TAx RECEIVABLES AND LIABILITIES IN 2012
Deferred tax receivables EUR 1,000
Business combinations
and acquisition of non-
controlling interests
Recognised in the income statement
Recognised in other
components of comprehensive
incomeBalance sheet
31.12.2012
Interest-bearing liabilities 8,562 8,562Deferred tax receivable for the loss for the period 30,377 30,377Defined benefit plans 66 -17 131 180Finance leases 958 97 1,054
total 1,024 30,456 8,693 40,173Offset by deferred tax liabilities -34,381
5,792
INCOME TAx
Deferred tax liabilities EUR 1,000
Business combinations
and acquisition of non-
controlling interests
Recognised in the income statement
Recognised in other
components of comprehensive
incomeBalance sheet
31.12.2012
Interest-bearing liabilities 4,004 4,004Depreciation differences 91,538 4,547 96,086Measurement of assets at fair value in acquisition 150,501 -6,221 144,280Available-for-sale financial assets 288 288
total 242,040 2,330 288 244,658Offset by deferred tax receivables -34,381
210,277
The Group has recorded a deferred tax asset on the losses for 2012 for the parent company. The losses carried forward are available for ten years. The losses will be offset against future profits.

22 ElEnia
note 11
PROPERTy, PLANT AND EqUIPMENT
EUR 1,000Land and
water areas BuildingsElectricity
networks
Machinery and
equipment
Other tangible
assets Prepayments total
Cost at 1 January 2012 0 0 0 0 0 0 0Business combinations and acquisition of non-controlling interests 2,112 19,224 1,437,461 267,411 715 20,291 1,747,214Additions 78 67,462 727 0 66,086 134,352Transfers between balance sheet items 0 0 0 4,193 0 -4,645 -452Disposals 0 -517 0 -986 0 -62,636 -64,140
Acquisition cost at 31 December 2012 2,189 18,707 1,504,923 271,344 715 19,095 1,816,973
Accumulated depreciation, amortisation and impairment at 1 January 2012 0 0 0 0 0 0 0Business combinations and acquisition of non-controlling interests 0 -8,944 -462,703 -133,782 -488 0 -605,918Depreciation and amortisation for the period 0 -642 -51,822 -11,354 -37 0 -63,855Transfers between balance sheet items 0 0 0 321 0 0 321Accumulated depreciation and amortisation on disposals 0 232 0 0 0 0 232
Accumulated depreciation, amortisation and impairment at 31 December 2012 0 -9,354 -514,525 -144,815 -525 0 -669,219
Book value at 31 december 2011 0 0 0 0 0Book value at 31 december 2012 2,189 9,352 990,398 126,529 190 19,095 1,147,754
The property, plant and equipment item machinery and equipment includes EUR 34,036 thousand of assets acquired through finance leases. Elenia Lämpö Oy has received an investments grant of 415 t€. The grant has been recorded as deduction of costs in machinery and equipments.
note 12
INTANGIBLE ASSETS
1000 € GoodwillIntangible
rights
Other long-term
expenditure
Other intangible
assets total
Acquisition cost at 1 January 2012 0 0 0 0 0Business combinations and acquisition of non-controlling interests 515,606 51,528 14,776 88,200 670,110Increase 0 577 332 0 909Decrease 0 0 -102 0 -102Decrease 0 0 281 0 281
Acquisition cost at 31 December 2012 515,606 52,105 15,287 88,200 671,197
Accumulated depreciation, amortisation and impairment at 1 January 2012 0 0 0 0 0Business combinations and acquisition of non-controlling interests 0 -38,200 -11,808 0 -50,009Depreciation and amortisation for the period 0 -4,728 -2,139 -3,528 -10,395Accumulated depreciation and amortisation on decrease 0 0 20 0 20
Accumulated depreciation, amortisation and impairment at 31 December 2012 0 -42,928 -13,927 -3,528 -60,384
Book value at 31 december 2011 0 0 0 0 0Book value at 31 december 2012 515,606 9,177 1,360 84,672 610,814
Other intangible assets mainly consist of customer relationships capitalised in connection with the business combination and acquisition.As a result of acquisitions a goodwill of 515.6 MEUR was created. Goodwill is based on the assesment of organisational competence and knowhow which
is expected to benefit business operations in coming years.

22 ElEnia FinanCial STaTEMEnTS 2012 23
iMPairMEnT TESTinG oF GoodwillGoodwill has been allocated to cash generating units which are Network and Heat business segments. The goodwill allocated to Network is 418 M€ and Heat 98 M€. Projected cash flows have been assessed based on long-term operational plans which have been approved by the the senior management and the Board of Directors. Cash flows have been discounted in order to determine the value in use. The discount factor applied reflects the different risk profiles of the businesses
nETwork SEGMEnTDue to the regulated and stable nature of the electricity distribution busi-ness, the basis for cash flow projections has been long-term business plan for the period 2013–2027. Long term capital expenditure plans have been prepared in order to meet the security of supply reguirements by 2028 as published by the Ministry of Employment and Economy. A growth rate of 1% has been incorporated in the cash flow projections for the whole period and beyond. The discount rate applied for Network segment is 3.91% which is derived from the regulatory WACC calculation.
hEaT SEGMEnTCash flow projections for 25 year are based on the 5 year business plan which has been approved by the the Board of Directors. Due to the stable nature of the District heating business, long term projections are appropri-ate. Applied discount rate is 4.1% which is based on the prevailing return and risk assumptions in the business. Growth rate for distric heating is expected to modestly increase until 2020, and thereafter the volumes are gradually expected to decrease. Revenue of the business is expected to grow 2 to 3% annually for the next 25 years and thereafter growth of 0.5% p.a. has been applied. The fluctuation of fuel prices is estimated to be modest as the business has several optional fuels available. Capital expenditure plans are based on maintaining the exsisting power plants and distric heating network.
SEnSiTiviTy analySiSWith regard to the assessment of the value in use in both segments, manage-ment believes that no reasonably possible change in any of the above key assumptions would cause the carrying value of the unit to materially exceed its recoverable amount.
note 13
invEnToriES
EUR 1,000 2012
Oil 3,159 Bio fuels 10,433 Other inventories 593 Prepayments on inventories 769
total 14,954
During 2012, 13.420 k€ was recognised as an expense for inventories carried at net realisable value. This is recognised in cost of sales. There were no write-offs in inventory values.
note 14
TradE and oThEr rECEivablES
EUR 1,000 2012
Trade receivables 23,962Other current receivables 56,889Other current interest-bearing receivables 13
total trade and other receivables 80,864
The fair value of trade and other receivables does not materially differ from the values on the balance sheet
brEakdown oF TradE rECEivablES by aGE
EUR 1,000 2012
Not fallen due 12,881Due for 1–90 days 8,369Due for 91–180 days 489Due for more than 181 days 3,491
total 25,230Uncertain receivables -1,268
total 23,962
All trade receivables are denominated in euro.Credit losses are booked based on the recommendations by credit
agencies or based on the official documents in case of debt restructuring of bankruptcies of the debtor. The Group records uncertain receivables on a specific account.
BREAK-DOWN OF OTHER CURRENT RECEIVABLESEUR 1,000 2012
Sales accruals 47,341Accrued financial expenses 5,865Other accrued income 3,683
total 56,889

24 ElEnia
note 15
CarryinG aMounTS oF FinanCial aSSETS and liabiliTiES by CaTEGory
VALUES AT 31 DECEMBER 2012
Balance sheet item1,000 EUR
Financial assets/
liabilities at fair value
through profit or loss
Loans and other
receivables
Available-for-sale financial
assets
Financial liabilities at
amortised cost
Derivatives qualified for
hedge accounting
Book value of balance sheet
items Fair value
non-current financial assetsNon-current interest-bearing receivables 16,298 16,298 16,298
current financial assetsTrade receivables and other non-interest-bearing receivables 23,863 23,863 23,863
- Derivatives 0
Interest-bearing receivables 13 13 13Available-for-sale financial assets 1,566 1,566 1,566Cash and cash equivalents 26,564 26,564 26,564
Book value by measurement category 66,738 1,566 0 0 68,304 68,304
non-current financial liabilitiesInterest-bearing non-current liabilities 1,569,365 1,569,365 1,553,612
- Derivative liabilities 34,949 34,949 34,949total interest-bearing non-current liabilities 0 0 1,569,365 34,949 1,604,314 1,588,561current financial liabilitiesOther current interest-bearing liabilities 4,150 4,150 4,150Trade payables 16,223 16,223 16,223total other non-interest-bearing liabilities 0 0 20,373 0 20,373 20,373Book value by measurement category 0 0 1,589,738 34,949 1,624,687 1,608,934

24 ElEnia FinanCial STaTEMEnTS 2012 25
VALUES AT 31 DECEMBER 2011
Balance sheet item1,000 EUR
Financial assets/
liabilities at fair value
through profit or loss
Loans and other
receivables
Available-for-sale financial
assets
Financial liabilities at
amortised cost
Derivatives qualified for
hedge accounting
Book value of balance sheet
items Fair value
non-current financial assetsAvailable-for-sale financial investments
Non-current interest-bearing receivables
current financial assetsTrade receivables and other non-interest-bearing receivables
- Derivatives 1,059 1,059 1,059
Interest-bearing receivablesFinancial assets at fair value through profit or lossCash and cash equivalents 297 297 297
Book value by measurement category 1,059 297 0 0 0 1,356 1,356
non-current financial liabilitiesInterest-bearing non-current liabilities 3,614 3,614 3614
- Derivativestotal interest-bearing non-current liabilities 0 0 0 3,614 0 3,614 3,614current financial liabilitiesOther current interest-bearing liabilitiesTrade payables 951 951 951total other non-interest-bearing liabilities 0 0 0 951 0 951 951Book value by measurement category 0 0 0 4,565 0 4,565 4,565
FinanCial aSSETS Available-for-sale financial assets are investments in the shares of joint ventures in limited partnerships. The companies own unlisted funds at EUR 1.6 million. These investments are measured at fair value based on assess-ments received from external fund managers on 31 December 2012.
CaSh aT bankS and on handElenia had short-term bank deposits amounting to EUR 26.6 million (2011: EUR 0.3 million). All bank deposits were denominated in Euro.
FinanCial liabiliTiESInterest-bearing liabilities grew by EUR 1.6 billion during the year, and inter-est-bearing liabilities at the end of the year totalled EUR 1.6 billion. During the first quarter of 2012, Elenia Oy has drawn up a working capital loan of EUR 12 million, which it has repaid during the second quarter of the year. In May, the company amortised its interest-bearing loan by EUR 15 million.

26 ElEnia
note 16
PROVISIONS
EUR 1,000Provisions due to
disputesEnvironmental
provisions
Provision for refunds
of connection fees total
Provisions at 1 January 2012 0 0 0 0Business combinations and acquisition of non-controlling interests 0 110 11,683 11,793Increase 50 0 238 288Cancellations of provisions 0 -110 0 -110Use of provisions 0 0 -290 -290
Provisions at 31 december 2012 50 0 11,631 11,681
The provision made for the refunds of electricity and heat connection fees in coming years is calculated by discounting the cash flows from estimated refunds to their current value.
note 17
TradE and oThEr PayablES
EUR 1,000 2012
Short term financial lease liability 4,150Trade payables 16,223Other current liabilities
Employee benefits expense 3,925
Interest expenses 63,667Other current liabilities 41,892
Other liabilities VAT liability 9,764Energy taxes 5,418Tax liability for the period 1,204Prepayments received 7Other liabilities 829
total 147,079
According to the management’s estimate, the fair value of trade and other payables does not materially deviate from the balance sheet value.
Other current liabilities comprise of deferred material and service purchases.
note 18
ChanGES in ThE Fair valuE oF dErivaTivES in ThE inCoME STaTEMEnT
EUR 1,000 2012 2011
included in finance costsExchange rate differences for loans and receivables 0 0Ineffective portion of the value change of fair value hedges
Interest rate swaps 0 0Changes in the fair value of derivatives not designated as hedges
Interest rate swaps -1,059 -2,296
overall effect on finance costs -1,059 -2,296
overall effect on profit before tax -1,059 -2,296
Changes in the fair value of interest rate swaps not designated as hedges are included in financial items. The change in fair values amounted to EUR -1,059 thousand (2011: -2,296).

26 ElEnia FinanCial STaTEMEnTS 2012 27
note 19
Fair valuE oF FinanCial aSSETS and liabiliTiES
Fair valuE hiErarChyThe Group uses the following hierarchy for determining and disclosing the fair value of financial instruments by valuation technique:Level 1: quoted (unadjusted) prices in active markets for identical assets
or liabilitiesLevel 2: other techniques for which all inputs that have a significant effect
on the recorded fair value are observable, either directly or indi-rectly
Level 3: techniques that use inputs that have a significant effect on the recorded fair value that are not based on observable market data
As at 31 December 2012, the Group held the following financial instruments carried at fair value in the statement of financial position:
FINANCIAL ASSETS
Level 1 Level 2 Level 3 Total
EUR 1,000 2012 2011 2012 2011 2012 2011 2012 2011
financial instruments, current assetsHeld-to-maturity financial investmentsAvailable-for-sale financial investments 1,566 1,566Derivative instruments
Interest rate swapsHedge accounting is appliedHedge accounting is not applied 0 1,059 1,059
total 0 0 0 1,059 1,566 0 1,566 1,059
FINANCIAL LIABILITIES
Level 1 Level 2 Level 3 Total
EUR 1,000 2012 2011 2012 2011 2012 2011 2012 2011
financial instruments, current liabilitiesInterest rate swaps
Hedge accounting is appliedHedge accounting is not applied
financial instruments, non-current liabilitiesInterest-bearing liabilitiesDerivative instruments
Interest rate swapsHedge accounting is applied 34,949 0 34,949Hedge accounting is not applied
total 0 0 34,949 0 0 0 34,949 0
Fair valuE oF FinanCial aSSETS and liabiliTiESDuring the reporting period ended 31 December 2012, there were no trans-fers between Level 1 and Level 2 fair value measurements.
rEConCiliaTion oF Fair valuE MEaSurEMEnTS oF lEvEl 3 FinanCial inSTruMEnTSThe Group carries unquoted equity shares as available-for-sale financial instruments classified as Level 3 within the fair value hierarchy.
The Group has had equity interests in three unlisted entities which it originally acquired when it purchased municipal electricity companies.
As part of the purchase agreement, the Group invested in equity instru-ments of those entities whose aim is to develop local business activity.
A reconciliation of the beginning and closing balances including move-ments is summarised below:

28 ElEnia
EUR 1,000 MidinvestJokilaaksojen
rahastoVirtaa
Hämeeseen total
1 January 2012 0 0 0 0Investment 838 446 48 1,332Sales/Return of equity -625 -268 -48 -941Total gains and losses recognised in OCI 1,166 9 0 1,17531 december 2012 1,379 187 0 1,566
note 20
PEnSionS and oThEr PoST-EMPloyMEnT bEnEFiTSThe plan is a final average pay pension plan concerning additional pensions. The benefits are insured with an insurance company. The benefits include both defined benefit (DB) and defined contribution (DC) parts as defined in IAS 19. The figures presented below include only the DB part of the plan.
iTEMS rECoGniSEd on ThE balanCE ShEET aT 31 dECEMbEr
EUR 1,000 2012
Current value of funded obligations 4,606Fair value of assets -3,873
Deficit 733
value of the obligation on the balance sheet 733
The obligations of defined benefit pension plans have changed as follows:
EUR 1,000 2012
Obligation at the beginning of the period 3,451Past service costs 30Interest expenses 174Actuarial losses 1,094Benefits paid -143
obligation at the end of the period 4,606
The fair value of the assets of defined benefit pension plans has developed as follows:
EUR 1,000 2012
Fair value of assets, profit for the year 3,181Expected income from assets 159Actuarial gains 560Payments by the employer 116Benefits paid -143
fair value 3,873
The obligation on the balance sheet consists of the following items:
EUR 1,000 2012
Obligation at the beginning of the periodAcquisitions 270Net cost recognised in the income statement 45Payments by the employer -116Profits and losses recognised in comprehensive income 534
value of the obligation on the balance sheet at period end 734
Items recognised in the income statement
EUR 1,000 2012
Expenses based on service in the reporting period -30Interest income -174Interest expenses 159
total -45
Items recognised in the statement of comprehensive income for the period.
EUR 1,000 2012
Actuarial gains on assets -560Actuarial losses on obligations 1,094
total 534

28 ElEnia FinanCial STaTEMEnTS 2012 29
note 20
PEnSionS and oThEr PoST-EMPloyMEnT bEnEFiTS
SEnSiTiviTy analySiS oF dEFinEd bEnEFiT PEnSion PlanSThe following table shows how the discount rate affects to projected benefit obligation, related service cost and interest cost.
Rate of benefit increase EUR 1,000
Change in assumption
Defined ben-efit obligations
Fair value of Plan asstes Net Liability
Service costs for the next
reporting year Net interest
Discount rate 3% 4,606 3,873 733 48 20Discount rate 3.5% +0.50% 4,285 3,677 608 50 19Discount rate 2.5% -0.50% 4,967 4,176 791 53 18
As the defined benefit plans are managed by an external insurance company, it is not possible to present a division of the fair values of the plan assets.
Expected contributions for 2013 are estimated to be 60 t€
Insurance mathematical assumptions:Discount rate 3%Estimate of salary increases 2%Inflation 2%
note 21
obJECTS on lEaSE and rEnTal rECEivablESThe Group has leased out real estate, whose leases are classified as other leases. Real estates are included in the balance sheet item “Property, plant and equipment”.
Rental income was invoiced to a total value of EUR 493 thousand during the period.
All leases are open-ended.
note 22
CoMMiTMEnTS and ConTinGEnCiES
PRESENT VALUE OF FINANCIAL LEASE PAyMENTS1,000 € 2012
financial lease liabilitiesWithin one year 3,976After one year but not more than five years 15,883More than five years 18,711
total 38,570
Operating lease agreements do not include any special renewal or purchase options.
OTHER COMMITMENTSEUR 1,000 2012
Registered floating charges:Provided on behalf of own and Group liabilities 7,500,000
RENTAL LIABILITIES:EUR 1,000 2012
operating leases:Within one year 117After one year but not more than five years 163
280
Operating lease agreements do not include any special renewal or purchase options.
RENTAL LIABILITIESEUR 1,000 2012
Within one year 901After one year but not more than five years 1,826More than five years 875
3,602
Pledged bank account 16,298
Refundable connection fees 312,504

30 ElEnia
note 23
EquiTy
SharE CaPiTal Note 7 in Parent financial statements The shares are issued and fully paid
rESErvE For invESTEd non-rESTriCTEd EquiTyThe reserve for invested non-restricted equity comprises of all other equity investments and paid share subscription price, that has not been specifically booked as share capital.
availablE For SalE rESErvEThe reserve include the gain and losses on available for sale instruments
CaSh Flow hEdGE FundThe effective portion of the gain or loss on the hedging instrument is recon-ised in the cash flow hedge reserve
EarninGS PEr SharE Earnings per share are calculated by dividing the profit or loss attributable to equity holders of the parent by the average number of shares during the reporting period :
2012 2011
Profit attributable to equity holders of the parent, EUR -44,196,402 -2,296,821Average number of shares, pcs 100 100
earnings/share, euR – basic= diluted -441,964 -22,968
note 24
rElaTEd ParTy diSCloSurES
SharEholdErSAll shares in Elenia Oy are owned by a Dutch company, Lakeside Network Investments Holding B.V.
SubSidiariES and aSSoCiaTESElenia Oy owns shares in Elenia Verkko Oy and Elenia Lämpö Oy. Elenia Verkko Oy owns all shares in Asikkalan Voima Oy. Elenia Lämpö Oy has an associate, Oriveden Aluelämpö Oy;it holds 50% of its shares.
ToP ManaGEMEnTElenia Oy is managed by its Board of Directors. Elenia’s top management includes the Board of Directors and the CEO. Elenia has not had any business transactions with persons included in its top management and Elenia has not granted loans to these persons.
buSinESS TranSaCTionSAll transactions with related parties take place in an arm’s length manner.
Group companies have intercompany transactions which are related to administrative and services . These are eliminated upon consolidation.
Elenia Oy has two loans from Lakeside Network Investments Holding B.V. amounting to to EUR 590.8 million. The interest expense for these loans was EUR 61.4 million.
Transactions and outsanding items with associated company Oriveden Aluelämpö Oy are not material.
note 25
EvEnTS aFTEr ThE rEPorTinG PEriodOn 1 January 2013, Elenia Verkko Oy and Asikkalan Voima Oy merged with Elenia Oy. After 1 January 2013, Elenia Group consists of the parent company, Elenia Oy, the subsidiary, Elenia Lämpö Oy, and the associate, Oriveden Aluelämpö Oy, owned 50% by Elenia Lämpö Oy.
note 26
FinanCial riSk ManaGEMEnT The management of financial risks is based on the following principles. Elenia’s Treasury unit under the Finance Department is responsible for financial risk management. The Group’s existing loan arrangements include guidelines and restrictions pertaining to financial risk management.
CurrEnCy riSkElenia operates in Finland and uses the euro as its primary operating cur-rency. Elenia’s currency risk is based on purchases of raw materials and services denominated in currencies other than the euro. The purchases of raw materials and services denominated in currencies other than the euro have a negative effect on Elenia’s result and cash flow in the event that the currencies in question appreciate against the euro. As the Group’s purchasing operations are currently primarily focused on Finland, the currency risk related to purchasing is low.
As the Group expands its operations, it is probable that currency risk management related to purchasing will become more extensive. The Group has guidelines for the management of currency risk as part of the purchasing policy for network operations approved by the Executive Board. According to the guidelines, currency risks that have an impact on profit or loss are hedged either operationally through contractual currency rate clauses or, if that is not possible, through forward contracts concluded by the Treasury unit.
Operating profit includes EUR 2,000 and finance costs EUR 10,000 exchange rate differences. At the end of 2012 the currency risk comprised of trade payables which amounted to SEK 4,030,739 and whose counter value was EUR 469,000.
liquidiTy riSkLiquidity risk refers to the risk of the Group not having adequate liquid assets to finance its operations, pay interest and repay its loans.
The management of liquidity risk is divided into short-term and long-term liquidity management. Short-term liquidity risk is managed by cash flow planning that takes into account the expected trade receivables, trade paya-bles and other known expenses for a period of two weeks. The adequacy of long-term liquidity is assessed by 12-month forecasts conducted monthly.
In addition to cash funds, the Group has access to a committed credit facility of EUR 225 million for the purpose of carrying out investments and a committed working capital facility of EUR 50 million. These credit facilities may be used as necessary.

30 ElEnia FinanCial STaTEMEnTS 2012 31
rEFinanCinG riSk The Group has a EUR 959.7 million loan from Finnish and international banks. The loan was taken in conjunction with an acquisition and matures in 2017. According to the terms of the loan agreement, the loan must be repaid ahead of time in stages in the event that business operations generate free cash flow as defined in the loan agreement. The shareholder of the company has
LOANS By MATURITyRefinancing
EUR 1,000Effective interest
rate %Carrying amount
2012 Under 1 year 1–5 years Over 5 years
Loans from financial institutions 3.14% 900,000 900,000 Loans from financial institutions 1-mo Euribor + 2% 59,747 59,747 Other long-term interest-bearing liabilities 10.5 590,775 590,775total long-term interest-bearing liabilities 1,550,522 Other short-term interest-bearing liabilities 0 total short-term interest-bearing liabilities 0 total 1,550,522
also provided loans to the company totalling EUR 590.8 million. The loans are subordinated to the aforementioned bank loan. Half of the total amount will mature in 2021 and the remaining half in 2023. The company’s Treasury unit monitors the financial markets in order to carry out loan refinancing at an appropriate time, well ahead of the due date of the current bank loan.
inTErEST raTE riSkInterest rate risk refers to the effect of changes in interest rates on financial expenses.
The interest rate risk is managed by entering into interest rate swaps and by withdrawing fixed interest loans. Under its current loan agreement, the Group must hedge a minimum of 75% of the principal amount by interest rate swaps for the maturity of the loan, which is five years. On the reporting date, EUR 900 million of the loans were converted into fixed-rate loans until maturity and loan principal of EUR 59.7 million carried variable interest, with the 1-month Euribor rate as the reference rate.
Fair values of derivative instruments was EUR 34.9 million. All derivative instruments mature on 10 January 2017.
Change in the market value of interest rate swaps in response to a 0.5 percentage point change in market rates would have EUR 14 million effect on equity. Increase of the market rate would increase equity and decrease of the market rate would correspondingly decrease equity.
CrEdiT and CounTErParTy riSkDue to the electricity distribution companies having regional monopolies based on electricity system licences, customers do not have the option of choosing which distribution company’s network they connect to. As a result, the local distribution company always provides electricity distribution ser-vices, with the exception of electricity generation customers who, pursuant to the Finnish Electricity Market Act, have the right to choose which electric-ity distribution company’s network to connect to.
Invoicing for electricity distribution services is based on measured consumption and the distribution tariffs specified in the public electricity network price list. The invoicing period may be one month, two months or four months. In the event that a customer fails to pay the invoice, the elec-tricity distribution company has the right to discontinue the supply of elec-tricity after sending the required collection letters.
In district heating business operations, the credit risk is based on the difference between the invoicing period and the heating supplied. Credit risk is mitigated by monthly invoicing.
Accepted financial counterparties are counterparties approved in exist-ing loan agreements and other counterparties separately approved by the Board of Directors.
TradE rECEivablESThe Group’s trade receivables at the end of 2012 were EUR 23.9 million No collateral security was received for trade receivables.
BREAKDOWN OF TRADE RECEIVABLES By AGEEUR 1,000 2012
Not fallen due 12,881Due for 1–90 days 8,369Due for 91–180 days 489Due for more than 181 days 3,491
total 25,230Uncertain receivables -1,268
total 23,962
voluME and PriCE riSkSElectricity distribution operations do not involve particular volume or price risks due to being subject to a licence.
In district heating operations, fluctuations in average and monthly tem-peratures give rise to volume risks. However, the maximum annual range is only approximately 10%. During periods of low volume the company’s heating generation costs per unit are also lower, which mitigates the volume risk. The company has the right to adjust its district heating prices by giving one month’s notice. This mitigates the price risk of production costs.
CaPiTal ManaGEMEnT As the electricity distribution and heating businesses are capital-intensive, the company must ensure it has adequate capital to meet its operating requirements. Business planning includes assessing the adequacy of avail-able capital in relation to the risks arising from business operations and the operating environment.

32 ElEnia
ParEnT CoMPany FinanCial STaTEMEnTS
PaRent comPany PRofit and lossFAS FAS
€ Note1 January 2012–
31 december 20122 December 2011– 31 December 2011
Revenue 2,005,340.05 0.00
Materials and servicesMaterials, supplies and goods
Purchases during the period -437.63 0.00
-437.63 0.00
Employee benefit expensesSalaries and remuneration -601,253.73 0.00Indirect employee benefit expenses
Pension costs -86,511.29 0.00Other indirect employee benefit expenses -45,688.14 0.00
-733,453.16 0.00
Other operating expenses -6,572,757.76 -1,016.50
oPeRating PRofit (loss) -5,301,308.50 -1,016.50
Finance income and costsOther interest and finance income
From Group companies 1,193,804.58 0.00From others 539.75 0.00
Interest expenses and other finance costsTo Group companies -61,416,694.07To others -58,552,111.23 -2,295,805.38
Total finance income and costs 4 -118,774,460.97 -2,295,805.38
PRofit (loss) BefoRe eXtRaoRdinaRy items -124,075,769.47 -2,296,821.88
PRofit (loss) BefoRe aPPRoPRiations and taXes -124,075,769.47 -2,296,821.88
Income taxTaxes for the period 30,376,644.30 0.00
30,376,644.30 0.00
PRofit (loss) foR the yeaR -93,699,125.17 -2,296,821.88

32 ElEnia FinanCial STaTEMEnTS 2012 33
PaRent comPany Balance sheetFAS FAS
€ Notes 31 december 2012 31 December 2011
assets
NON-CURRENT ASSETSBuildings 1,834,390.33 0.00Machinery and equipment 844,779.85 0.00
Total tangible assets 1.1.1; 5 2,679,170.18 0.00
Holdings in Group companies 1,518,021,144.47 0.00Other investments 391,323.96 0.00
Total investments 6 1,518,412,468.43 0.00
Other interest-bearing receivables 22 16,298,250.00 0.00
total non-cuRRent assets 1,537,389,888.61 0.00
CURRENT ASSETSReceivables
CurrentTrade receivables 12 3,668,334.43 0.00Deferred tax receivables 2 30,376,644.30 0.00Other receivables 12 4,206,865.08 0.00Other current receivables 0.00 2,009,600.84
total cuRRent ReceivaBles 38,251,843.81 2,009,600.84
Cash at banks and on hand 25,643,886.49 296,888.12
25,643,886.49 296,888.12
total cuRRent assets 63,895,730.30 2,306,488.96
total assets 1,601,285,618.91 2,306,488.96

34 ElEnia
PaRent comPany Balance sheetFAS FAS
€ Notes 31 december 2012 31 December 2011
equity and liaBilities
EqUITyShare capital 7 2,500.00 2,500.00
2,500.00 2,500.00
Other reservesReserve for invested non-restricted equity 7 2,000,000.00 36,500.00
2,000,000.00 36,500.00 Retained profit (loss) 7 -2,296,821.88 0.00
Profit (loss) for the year 7 -93,699,125.17 -2,296,821.88
total equity -93,993,447.05 -2,257,821.88
accumulated aPPRoPRiationsDepreciation difference 370,784.03 0.00
370,784.03 0.00
LIABILITIESNon-current
Loans from financial institutions 959,746,711.00 0.00Liabilities to Group companies 12 590,775,000.00 3,613,500.00
total non-current liabilities 1,550,521,711.00 3,613,500.00
CurrentTrade payables 12 1,692,079.43 950,796.84Accrued interest 12 117,752,888.79 0.00Other accrued expenses 12 24,941,602.71 14.00
total current liabilities 144,386,570.93 950,810.84
total liaBilities 1,694,908,281.93 4,564,310.84
total equity and liaBilities 1,601,285,618.91 2,306,488.96

34 ElEnia FinanCial STaTEMEnTS 2012 35
PaRent comPany cash flow statementFAS FAS
€ 1.1.2012– 31.12.2012 2.12.2011–31.12.2011
Cash flow from operating activitiesProfit from operating activities -124,075,769.47 -2,296,821.88Adjustments
Depreciation 0.00 0.00Finance income and expense 118,774,460.97 0.00Other adjustments 0.00 0.00
Cash flow before change in net working capital -5,301,308.50 -2,296,821.88
Change in net working capitalChange in non-interest bearing receivables (increase(-)/decrease (+)) 1,008,813.57 -2,009,600.84Change in non-interest bearing liabilities (increase(+)/decrease (-)) 9,102,517.02 950,810.84
Cash flow from operating activities before financial items and taxes 4,810,022.09 -3,355,611.88
Interest payments and payments for other finance costs -56,287,388.14 0.00Interest income 1,194,344.33 0.00Tax payments 0.00 0.00Cash flow before extraordinary items -50,283,021.72 -3,355,611.88Cash flow from extraordinary items (net)
cash flow from operations (a) -50,283,021.72 -3,355,611.88
Cash flow from investing activities Investments in group companies' shares and other investments -1,481,459,433.46 0.00
cash flow from investing activities (B) -1,481,459,433.46 0.00
Cash flow from financing activities:Increase in long-term loans 1,546,908,211.00 3,613,500.00Change in receivables -16,298,250.00Increase in invested non-restricted equity 1,963,500.00 39,000.00
cash flow from financing activities (c) 1,532,573,461.00 3,652,500.00
change in cash and cash equivalents (a+B+c) increase (+)/decrease (-) 831,005.82 296,888.12
Cash and cash equivalents in the start of the accounting periond 296,888.12 0.00Cash and cash equivalents in the start of the accounting periond + change 1,127,893.94 296,888.12Cash and cash equivalents received at the merger 24,515,992.55Cash and cash equivalents at the end of the accounting periond 25,643,886.49 296,888.12
Cash and cash equivalents comprises of cash balance at bank accounts.

36 ElEnia
notes to the PaRent comPany financial statements
notes conceRning the PRePaRation of financial statements
1. aCCounTinG PoliCiES
1.1 valuaTion PrinCiPlES and TEChniquES and aCCrual PrinCiPlES and METhodS aPPliEd whEn PrEParinG ThE FinanCial STaTEMEnTS
1.1.1 Property, plant and equipment, intangible assets and depreciation and amortisationProperty, plant and equipment and intangible assets are recognised on the balance sheet at original acquisition cost, less accumulated depreciation and amortisation and potential accumulated impairment losses. The original acquisition cost includes expenditure that is directly attributable to the acquisition of an item.
When a property, plant and equipment asset no longer has any expected revenue streams, the asset is scrapped and the remaining carrying value is recognised as an expense under other operating expenses.
All other repair and maintenance costs are charged to the income state-ment during the reporting period in which they are incurred.
Land and water areas are not depreciated since they have indefinite useful lives. Depreciation and amortisation on other assets is calculated using the straight-line method to allocate their cost to their residual values over their estimated useful lives, as follows:
Buildings and structures 15–50 yearsMachinery and equipment 3–30 yearsComputer software and licences 3–5 years
1.1.2 Items denominated in foreign currencies and derivative contractsTransactions denominated in foreign currencies are translated using the exchange rate at the date of the transaction. Receivables and liabilities denominated in foreign currencies outstanding on the date of closing the accounts are translated using the exchange rate quoted on the closing date. Exchange rate differences are recorded in financial income and expenses, or other operating expenses, depending on the nature of the item in question.
Elenia Oy mainly concludes derivative contracts to manage the interest rate risk. Derivatives are measured at acquisition cost or likely assignment price, whichever is lower.
Option premiums are treated as prepayments until the options fall due. Losses arising from option agreements concluded are recognised as expenses in the income statement.
2 dEFErrEd TaxES Elenia Oy has recorded a deferred tax asset on the losses for 2012. The losses carried forward are available for ten years. The losses will be offset against future profits. Deferred taxes are recognised on the balance sheet.
3 CoMParabiliTy wiTh PrEviouS rEPorTinG PEriodElenia Oy was established on 2 December 2011 and its previous reporting period was 2 December 2011–31 December 2011. Elenia Asiakaspalvelu Oy was merged with its parent company, Elenia Oy, on 31 December 2012, which
increased the balance sheet and rental liabilities compared to the previous financial statements.
4 FinanCE inCoME and CoSTS
EUR 1,000 2012 2011
Interest and other finance income, group companies 1,193 0Interest and other finance income 1 0Exchange rate differences -10 0Interest and other finance expenses, group companies -61,417 0Other interest expense -31,065 0Other finance costs -26,417 0Changes in fair value of interest rate hegdes -1,059 -2,296
total -118,774 -2,296
interest income and costs, totalInterest income 1,194 0Interest expense -92,482 0interest income and costs, net -91,288 0
5 TanGiblE FixEd aSSETS
EUR 1,000Buildings and
structures
Machinery and
equipment Total
acquisition cost 1.1.2012 0 0 0Merger 1,834 845 2,679acquisition cost 31.12.2012 1,834 845 2,679accumulated depreciation 1.1.2012 0 0 0Depreciation for the period 0 0 0accumulated depreciation 31.12.2012 0 0 0Balance sheet value 31.12.2012 1,834 845 2,679Balance sheet value 31.12.2011 0 0 0
6 invESTMEnTS
EUR 1,000
Shares in group
companies
Other invest-ments Total
acquisition cost 1.1.2012 0 0 0Additions 1,518,021 1,518,021Merger 0 391 391acquisition cost 31.12.2012 1,518,021 391 1,518,412

36 ElEnia FinanCial STaTEMEnTS 2012 37
7 noTES ConCErninG aSSETS on ThE balanCE ShEET
EUR 2012 2011
itemisation of equity
Share capital at the beginning and end of the period 2,500.00 2,500.00
Other reserves at the beginning of the period 36,500.00 0.00Change during the period 1,963,500.00 36,500.00Other reserves at the end of the period 2,000,000.00 36,500.00
Profit/loss for previous periods at the beginning of the period -2,296,821.88 0.00Profit/loss for previous periods at the end of the period -2,296,821.88 0.00
Profit/loss for the year -93,699,125.17 -2,296,821.88
Total equity -93,993,447.05 -2,257,821.88
The company has no distributable funds.The negative equity has been registered at the Trade Register on June
12th, 2012.
8 noTES ConCErninG PErSonnEl and MEMbErS oF CorPoraTE bodiESThe company employed an average of six people during the reporting period.
9 SalariES and rEMunEraTion oF ThE board oF dirECTorS and ThE CEoNo salaries or remuneration were paid to the Board of Directors and the CEO.
10 board oF dirECTorS’ ProPoSal For ThE handlinG oF ProFiTThe loss for the period is €93,699,125.17. The Board of Directors proposes that no dividend be distributed and the loss be transferred to the retained loss account.
11 SharES in ThE CoMPanyThe company has one hundred shares, the nominal value of which is € 2,500.00. Each share entitles to one vote at a General Meeting, and they confer equal rights to dividends and the company’s assets.
12 rElaTEd ParTy diSCloSurES
EUR 1,000 2012 2011
acquisition cost 31.12.2012Trade receivables 3,668 0Other receivables 1,775 0total current receivables from subsidiaries 5,443 0
short-term loans to subsidiariesTrade payables 4 0Other current liabilities to Group companies 7,654 0total short-term loans to subsidiaries 7,658 0
Loans from the parent company 590,775 3,614Falling due in more than 5 years 590,775 3,614
Interest expenses to the parent company 61,368 0Loan interest income from subsidiaries 1,194 0Loan interest expenses to subsidiaries 49 0
Elenia Oy has drawn up two loans of equal amounts from its parent company. The first loan was withdrawn in two instalments so that the first instalment (€ 3.6 million) was withdrawn in December 2011 and the second instalment in January 2012. The interest on the loan is 9%, and it will fall due in 10 years. The second loan was withdrawn in January 2012, and it will fall due in 12 years. The interest rate on the loan is 12%.
13 ConTinGEnT liabiliTiES
EUR 1,000 2012
Rental liabilitiesFalling due in the next reporting period 901Falling due later 2,701Total 3,602
operating leasesFalling due in the next reporting period 2Falling due later 0Total 2
The rental agreements and leases are normal rental agreements, with which no redemption obligation is associated.
14 CollaTEral ProvidEd and liabiliTiESFloating charges provided on behalf of own and Group liabilities amount to € 3,000,000,000.00
dErivaTivE ConTraCTSElenia Oy has interest rate swaps whose fair value is €-34.9 million and the value of the underlying asset is € 900 million. In accounting, the interest rate swaps are treated as cash flow hedging derivatives, and they will fall due on 10 January 2017.
15 SubSidiariES and aSSoCiaTESSee the list in note no. 24 to the consolidated financial statements.

38 ElEnia
auditoR’s RePoRt
To ThE annual GEnEral MEETinG oF ElEnia oyWe have audited the accounting records, the financial statements, the report of the Board of Directors, and the administration of Elenia Oy (former LNI Acquisition Oy) for the year ended 31 December, 2012. The financial state-ments comprise the consolidated statement of financial position, statement of comprehensive income, statement of changes in equity and statement of cash flows, and notes to the consolidated financial statements, as well as the parent company’s balance sheet, income statement, cash flow statement and notes to the financial statements.
rESPonSibiliTy oF ThE board oF dirECTorS and ThE ManaGinG dirECTorThe Board of Directors and the Managing Director are responsible for prepa-ration of consolidated financial statements that give a true and fair view in accordance with International Financial Reporting Standards (IFRS) and adopted by the EU, as well as for the preparation of financial statements and the report of the Board of Directors that give true and fair view in accord-ance with the laws and regulations governing the preparation of the financial statements and the report of the Board of Directors in Finland. The Board of Directors is responsible for the appropriate arrangement of the control of the company’s accounts and finances, and the Managing Director shall see to it that the accounts of the company are in compliance with the law and that its financial affairs have been arranged in a reliable manner.
audiTor’S rESPonSibiliTyOur responsibility is to express an opinion on the financial statements, on the consolidated financial statements and on the report of the Board of Direc-tors based on our audit. The Auditing Act requires that we comply with the requirements of professional ethics. We conducted our audit in accordance with good auditing practice in Finland. Good auditing practice requires that we plan and perform the audit to obtain reasonable assurance about whether the financial statements and the report of the Board of Directors are free from material misstatement, and whether the members of the Board of Directors of the parent company and the Managing Director are guilty of an act of negligence which may result in liability in damages towards the com-pany of have violated the Limited Liability Companies Act of the articles of association of the Company.
An audit involves performing procedures to obtain audit evidence about the amounts and disclosures in the financial statements and the report of the Board of Directors. The procedures selected depend on the auditor’s judgment, including the assessments, the auditor considers internal control relevant to the entity’s preparation of the financial statements and report of the Board of Directors that give a true and fair view in order to design audit procedures that are appropriate in the circumstances, but not for the pur-pose of expressing an opinion on the effectiveness of the company’s internal control. An audit also includes evaluating the appropriateness of accounting policies used and the reasonableness of the accounting estimates made by management, as well as evaluating the overall presentation of the financial statements and the report of the Board of Directors.
We believe that the audit evidence we have obtained is sufficient and appropriate to provide a basis for our audit opinion.
oPinion on ThE ConSolidaTEd FinanCial STaTEMEnTSIn our opinion, the consolidated financial statements give a true and fair view of the financial position, financial performance, and cash flows of the group in accordance with International Financial Reporting Standards (IFRS) as adopted by the EU.
oPinion on ThE CoMPany’S FinanCial STaTEMEnTS and ThE rEPorT oF ThE board oF dirECTorSIn our opinion, the financial statements and the report of the Boards of Direc-tors give a true and fair view of both the consolidated and the parent com-pany’s financial performance and financial position in accordance with the laws and regulations governing the preparation of the financial statements and the report of the Board of Directors in Finland. The information in the report of the Board of Directors is consistent with the information in the financial statements.
Helsinki, April 17, 2013Ernst & young OyAuthorized Public Accountant Firm
Mikko RytilahtiAuthorized Public Accountant