![NEC Display Solutions NEC SHOWCASE 20122012.showcase-nec.com/files/NEC_ShowCase_2012_Brochure.pdf · NEC SHOWCASE 2012 6 DOOH | ZONE FEATURES 3D holographic projection [ entrance]](https://static.fdocuments.us/doc/165x107/5f09f0207e708231d42939a9/nec-display-solutions-nec-showcase-nec-showcase-2012-6-dooh-zone-features-3d-holographic.jpg)
BUDGETED FUNDS SUMMARY 2011-20122012-20132013-2014% ACTUALREVISEDPROPOSEDInc/(Decr) BY FUND:...
16
-
Upload
jaliyah-josey -
Category
Documents
-
view
213 -
download
0
Transcript of BUDGETED FUNDS SUMMARY 2011-20122012-20132013-2014% ACTUALREVISEDPROPOSEDInc/(Decr) BY FUND:...

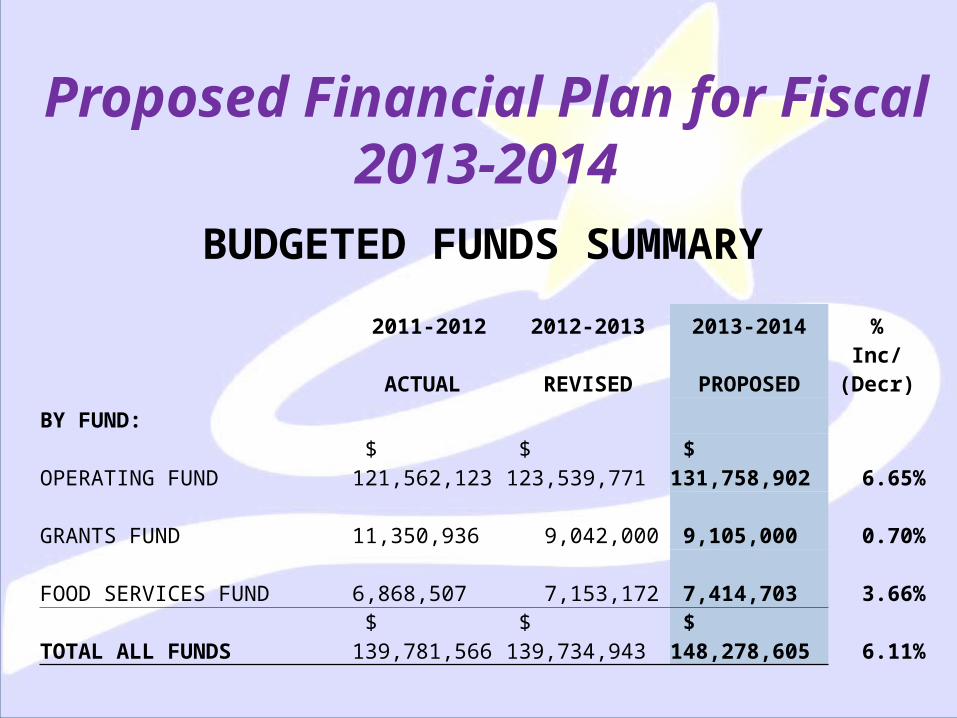
Proposed Financial Plan for Fiscal 2013-2014BUDGETED FUNDS SUMMARY
2011-2012 2012-2013 2013-2014 %
ACTUAL REVISED PROPOSED Inc/(Decr)
BY FUND:
OPERATING FUND $ 121,562,123 $ 123,539,771 $ 131,758,902 6.65%
GRANTS FUND 11,350,936 9,042,000 9,105,000 0.70%
FOOD SERVICES FUND 6,868,507 7,153,172 7,414,703 3.66%
TOTAL ALL FUNDS $ 139,781,566 $ 139,734,943 $ 148,278,605 6.11%
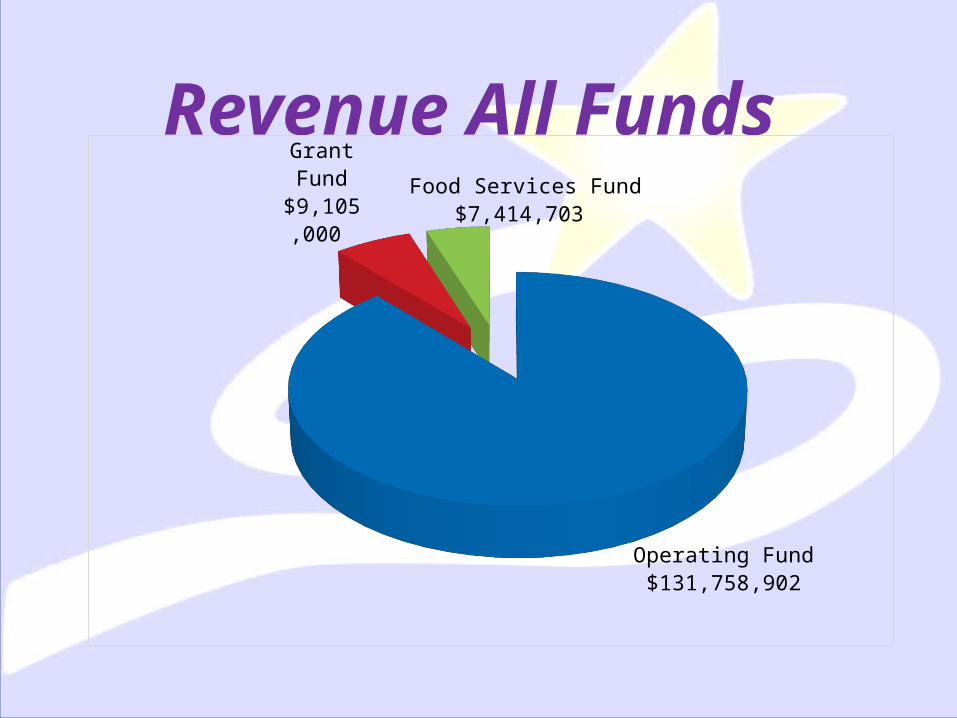
Revenue All Funds
Operating Fund $131,758,902
Grant Fund $9,105,000
Food Services Fund $7,414,703
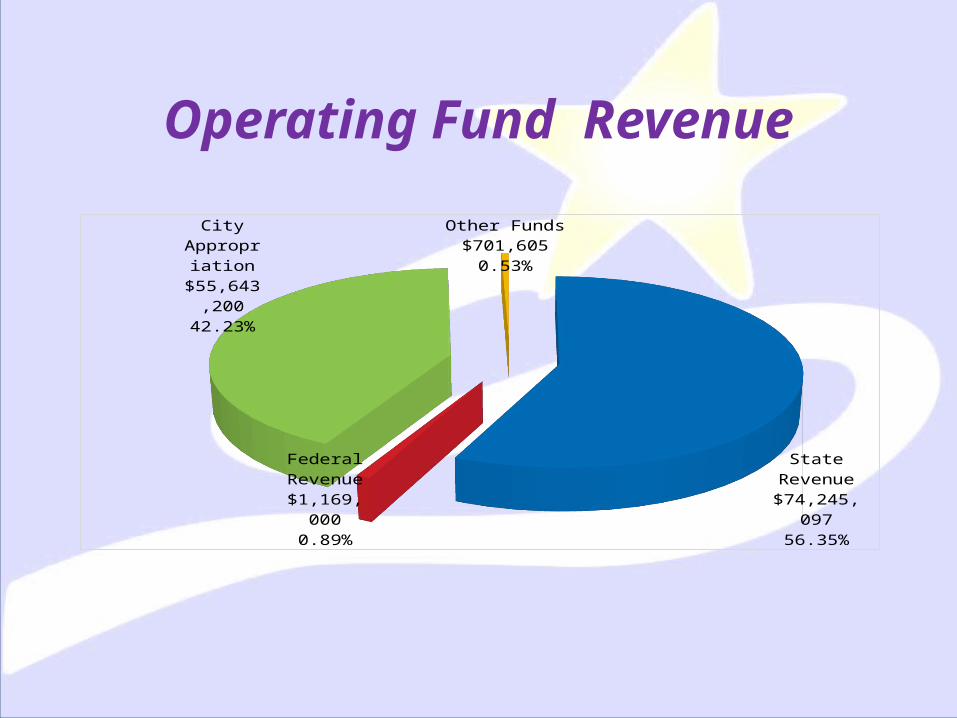
Operating Fund Revenue
State Revenue$74,245,
09756.35%
Federal Rev-enue
$1,169,000
0.89%
City Appro-priation$55,643
,20042.23%
Other Funds$701,605
0.53%
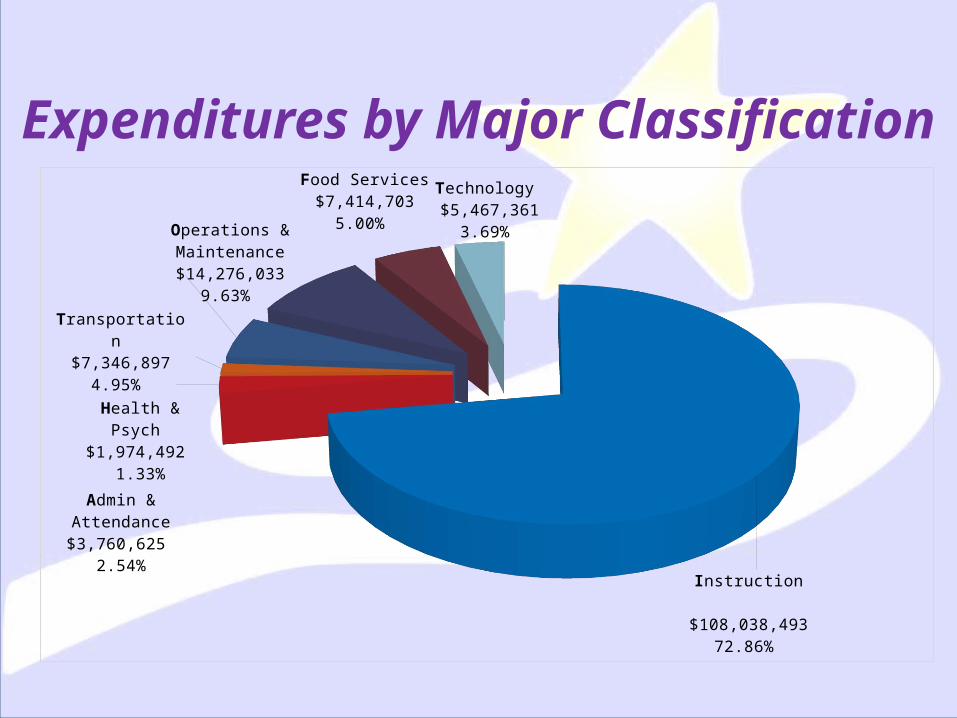
Expenditures by Major Classification
Instruction $108,038,493
72.86%
Admin & At-tendance
$3,760,625 2.54%
Health & Psych $1,974,492
1.33%
Transportation $7,346,897
4.95%
Operations & Maintenance $14,276,033
9.63%
Food Services $7,414,703
5.00% Technology $5,467,361
3.69%
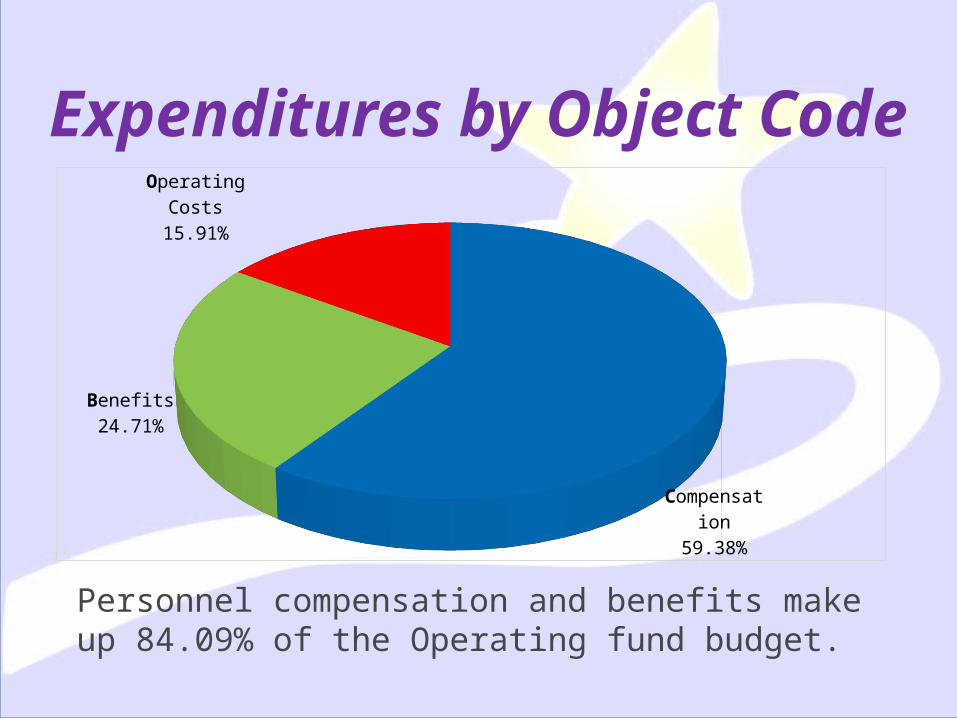
Expenditures by Object Code
Personnel compensation and benefits make up 84.09% of the Operating fund budget.
Com-pensa-
tion59.38%
Benefits24.71%
Operating Costs
15.91%
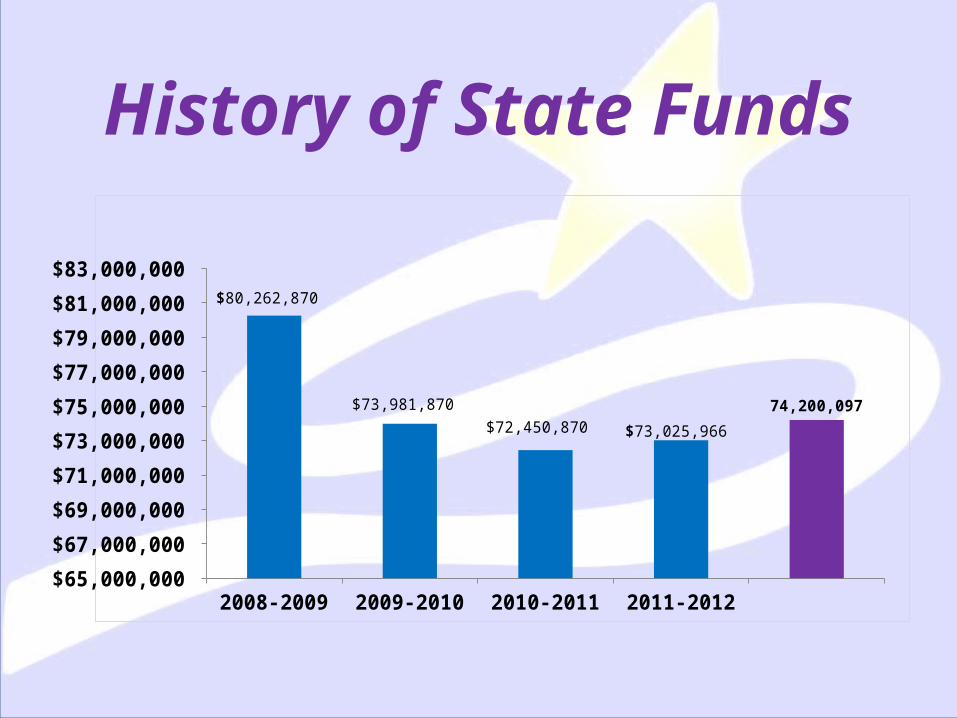
History of State Funds
2008-2009 2009-2010 2010-2011 2011-2012 $65,000,000
$67,000,000
$69,000,000
$71,000,000
$73,000,000
$75,000,000
$77,000,000
$79,000,000
$81,000,000
$83,000,000 $80,262,870
$73,981,870 $72,450,870 $73,025,966
74,200,097
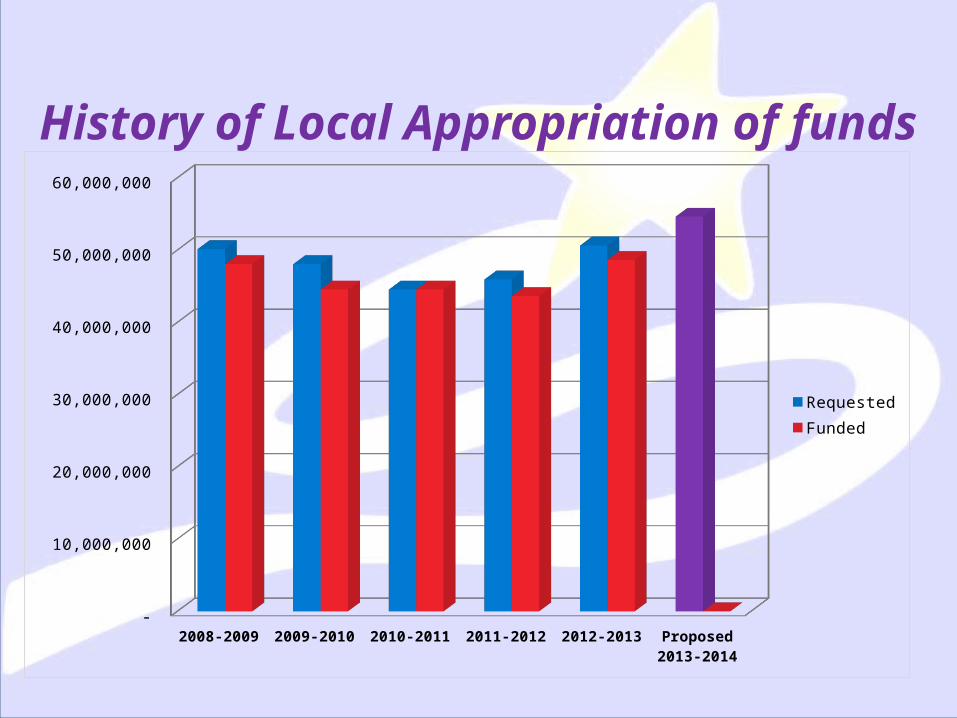
History of Local Appropriation of funds
2008-2009 2009-2010 2010-2011 2011-2012 2012-2013 Proposed 2013-2014
-
10,000,000
20,000,000
30,000,000
40,000,000
50,000,000
60,000,000
RequestedFunded
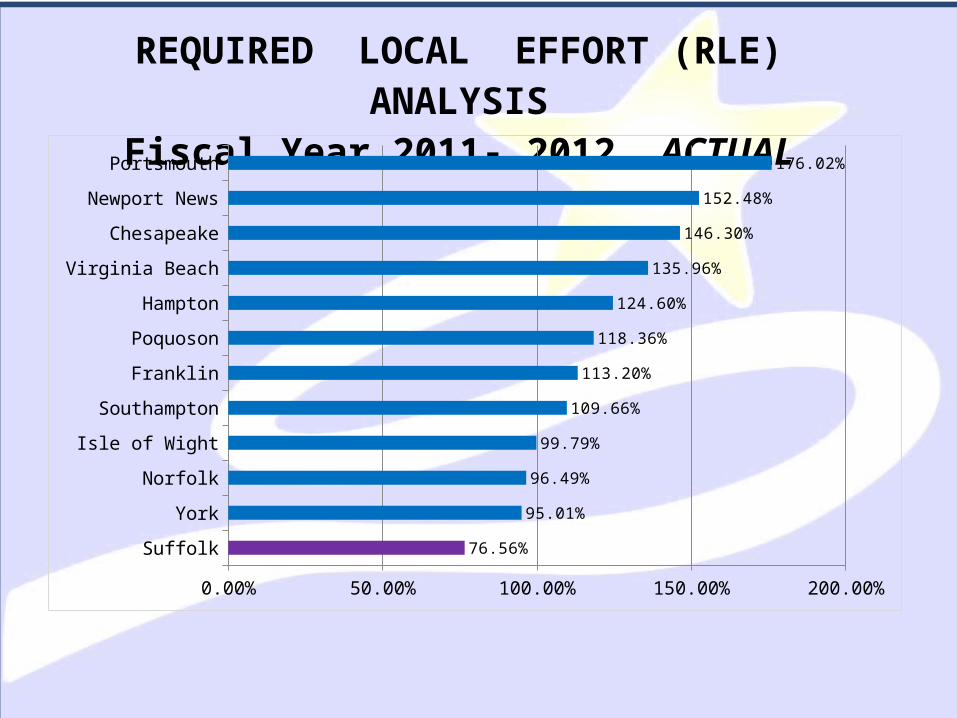
REQUIRED LOCAL EFFORT (RLE) ANALYSISFiscal Year 2011- 2012 ACTUAL
Suffolk
York
Norfolk
Isle of Wight
Southampton
Franklin
Poquoson
Hampton
Virginia Beach
Chesapeake
Newport News
Portsmouth
0.00% 50.00% 100.00% 150.00% 200.00%
76.56%
95.01%
96.49%
99.79%
109.66%
113.20%
118.36%
124.60%
135.96%
146.30%
152.48%
176.02%
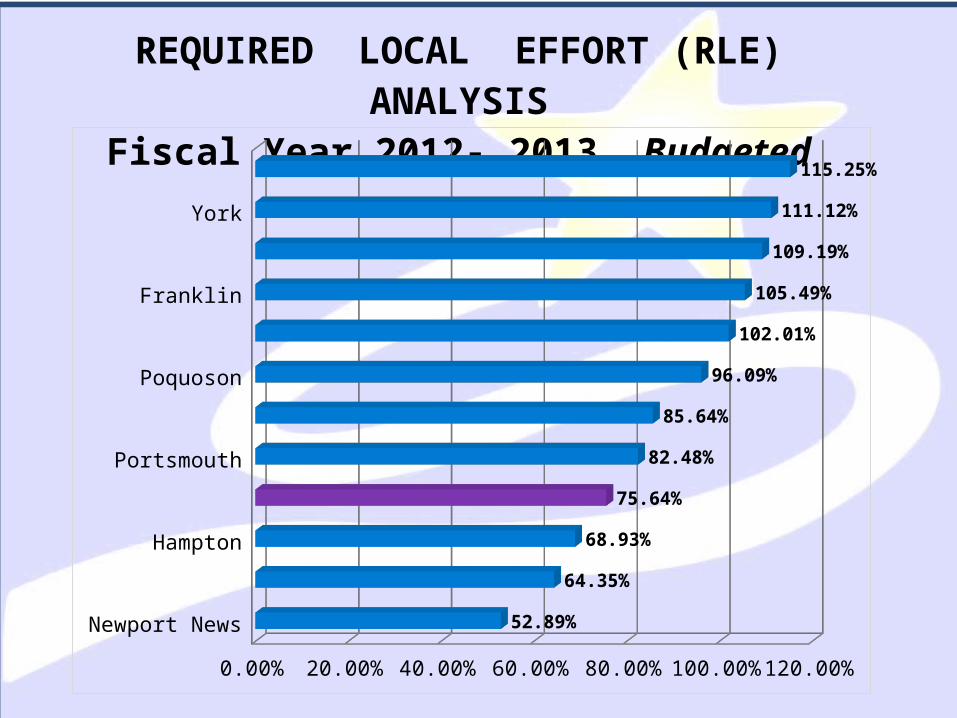
REQUIRED LOCAL EFFORT (RLE) ANALYSISFiscal Year 2012- 2013 Budgeted
Newport News
Southampton
Hampton
Suffolk
Portsmouth
Isle of Wight
Poquoson
Chesapeake
Franklin
Norfolk
York
Virginia Beach
0.00% 20.00% 40.00% 60.00% 80.00% 100.00%120.00%
52.89%
64.35%
68.93%
75.64%
82.48%
85.64%
96.09%
102.01%
105.49%
109.19%
111.12%
115.25%

• Staggered bus schedule of $700,000
• Efficiency savings found from:• PD360/Staff Development• Financial software• Purchase card rebates/PO reduction • Electronic Application portal• Safe Schools/Worker’s compensation benefit• External review of copier equipment usage• Copy cost tracking software• Utility behavioral changes
Proposed Budget includes reductions:
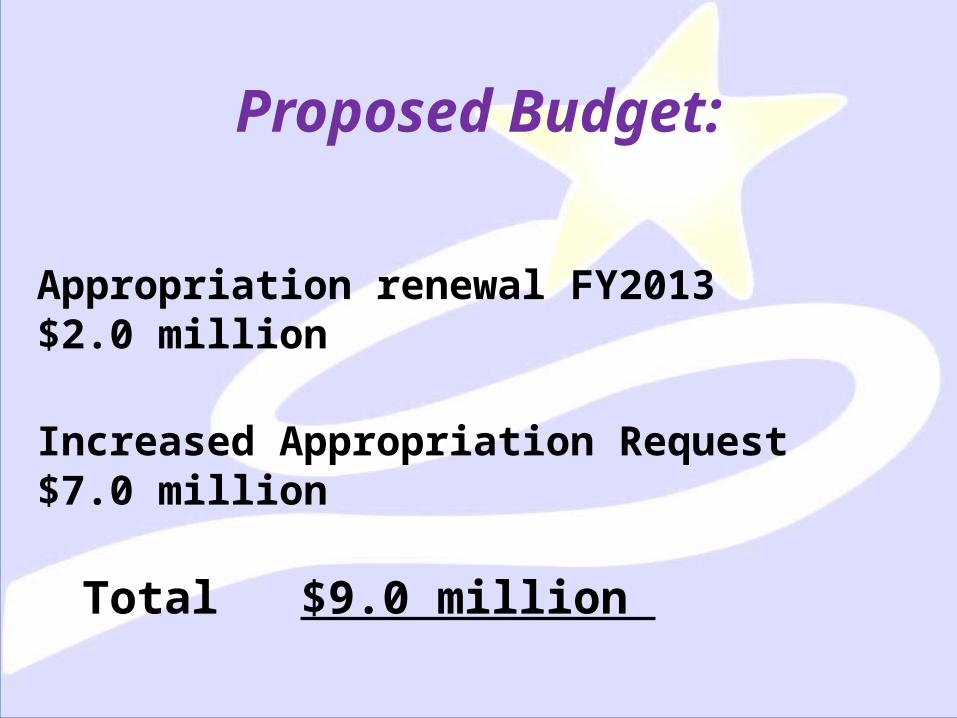
Appropriation renewal FY2013 $2.0 million
Increased Appropriation Request $7.0 million
Total $9.0 million
Proposed Budget:
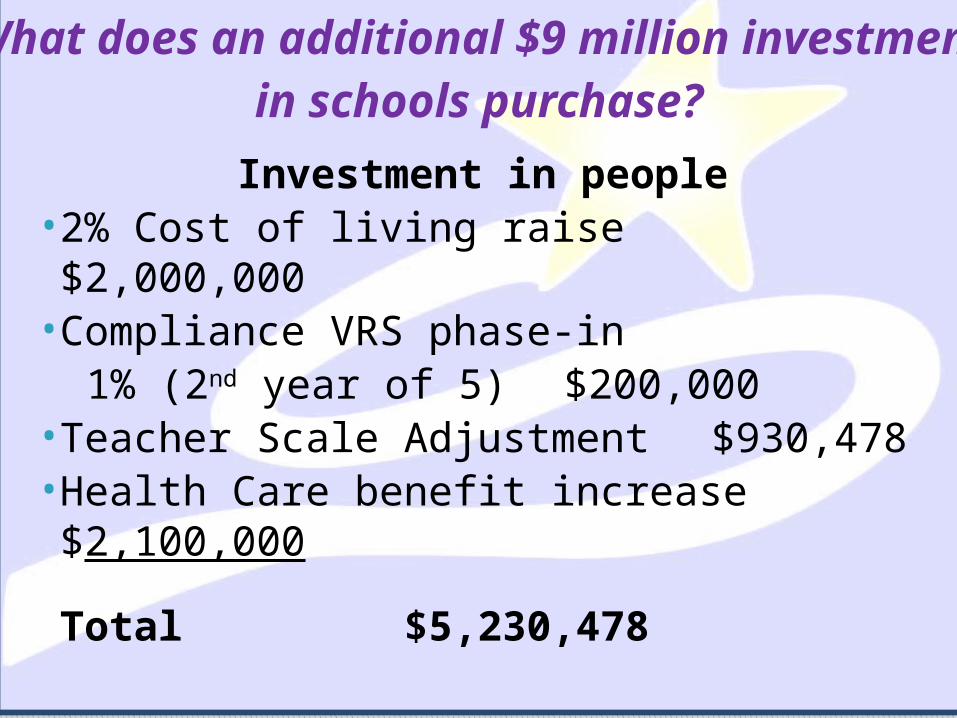
Investment in people• 2% Cost of living raise $2,000,000• Compliance VRS phase-in 1% (2nd year of 5) $200,000• Teacher Scale Adjustment $930,478•Health Care benefit increase $2,100,000
Total $5,230,478
What does an additional $9 million investment in schools purchase?
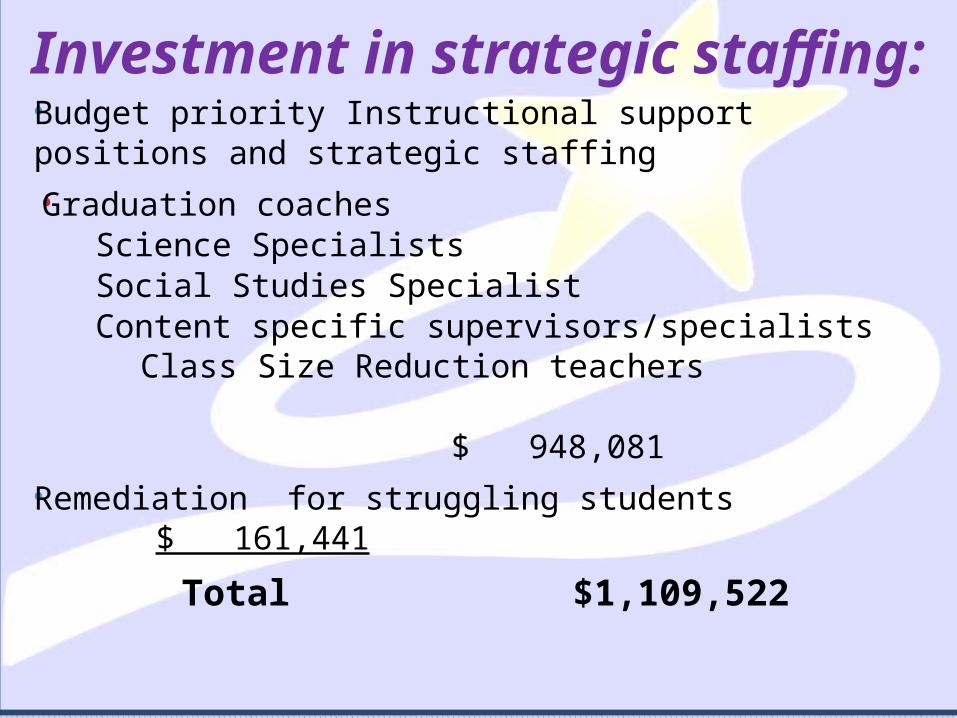
• Budget priority Instructional support positions and strategic staffing• Graduation coaches Science Specialists Social Studies Specialist Content specific supervisors/specialists Class
Size Reduction teachers $ 948,081
• Remediation for struggling students $ 161,441
Total $1,109,522
Investment in strategic staffing:
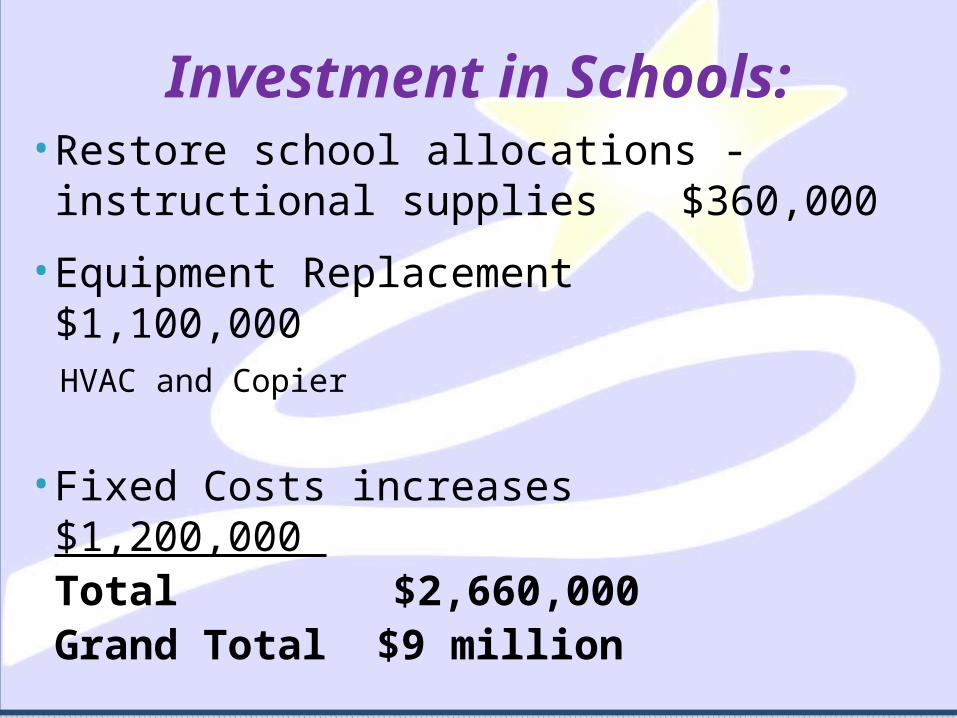
• Restore school allocations -instructional supplies $360,000
• Equipment Replacement $1,100,000 HVAC and Copier
• Fixed Costs increases $1,200,000 Total $2,660,000
Grand Total $9 million
Investment in Schools: