Financial Modelling of PV Risks - SunSniffer€¦ · 3 Modelling of Technical PV Risks Foreword The...
94
Financial Modelling of PV Risks Financial Modelling of Technical Risks in PV Projects Deliverable D4.2 (M18)
Transcript of Financial Modelling of PV Risks - SunSniffer€¦ · 3 Modelling of Technical PV Risks Foreword The...
Financial Modelling of PV Risks Financial Modelling of Technical Risks in PV Projects Deliverable D4.2 (M18)

2Modelling of Technical PV Risks
3Modelling of Technical PV Risks
Foreword The photovoltaic (PV) sector has overall experienced a significant growth globally in the last decade, reflecting the recognition of PV as a clean and sustainable source of energy. Project investment has been and still is a primary financial factor in enabling sustainable growth in PV installations. When assessing the investment-worthiness of a PV project, different financial stakeholders such as investors, lenders and insurers will evaluate the impact and probability of investment risks differently depending on their investment goals. Similarly, risk mitigation measures implemented are subject to the investment perspective. In the financing process, the stakeholders are to elect the business model to apply and be faced with the task of taking appropriate assumptions relevant to, among others, the technical aspects of a PV project for the selected business model.
The Solar Bankability project aims at establishing a common practice for professional risk assessment serving to reduce the risks associated with investments in PV projects.
The risks assessment and mitigation guidelines are developed based on market data from historical due diligences, operation and maintenance records, and damage and claim reports. Different relevant stakeholders in the PV industries such as financial market actors, valuation and standardization entities, building and PV plant owners, component manufacturers, energy prosumers and policy makers are engaged to provide inputs to the project.
The technical risks at the different phases of the project life cycle are compiled and quantified based on data from existing expert reports and empirical data available at the PV project development and operational phases. The Solar Bankability consortium performs empirical and statistical analyses of failures to determine the manageability (detection and control), severity, and the probability of occurrence. The impact of these failures on PV system performance and energy production are evaluated. The project then looks at the practices of PV investment financial models and the corresponding risk assessment at present days. How technical assumptions are accounted in various PV cost elements (capital expenditures (CAPEX), operational expenditures (OPEX), yield, and performance ratio) is inventoried. Business models existing in key countries in the EU market are gathered. Several carefully selected business cases are then simulated with technical risks and sensitivity analyses are performed.
The results from the financial approach benchmarking and technical risk quantification are used to identify the gaps between the present PV investment practices and the available extensive scientific data in order to establish a link between the two. The outcomes are best practices guidelines on how to translate important technical risks into different PV investment cost elements and business models. This will build a solid fundamental understanding among the different stakeholders and enhance the confidence for a profitable investment.
The Solar Bankability project is funded by the Horizon 2020 Framework Programme of the European Commission. The project runs for two years from March 2015 to 2017.
The Solar Bankability consortium is pleased to present this report which as one of the public deliverables from the project work.

4Modelling of Technical PV Risks
Principal Authors
Matthias von Armansperg (ACCELIOS Solar GmbH)
Daniel Oechslin (ACCELIOS Solar GmbH)
Martina Schweneke (ACCELIOS Solar GmbH)
Contributors
Tom Caldara (Resoltec AG)
Ingo Klute (juwi AG)
David Moser (EURAC)
Michael Vogtmann (DGS Landesverband Franken e.V.)
Acknowledgements
The Solar Bankability Consortium would like to extend special thanks to the Members of the Project’s Advisory Board for their input and support: 123 Ventures, Deutsche Bank, Grünstromwerk, HSH-Nordbank, KGAL, SEL Spa, SMA, Solarcentury, Triodos Bank, WHEB group.
Project Information
EC Grant Agreement Number: No 649997
Duration: March 2015 until February 2017 (24 months)
Coordinator: EURAC Institute for Renewable Energy (IT)
Project Partners: 3E N.V. (BE), ACCELIOS Solar GmbH (DE), SolarPower Europe (BE), and TÜV Rheinland Energie GmbH (DE)
Disclaimer
The sole responsibility for the content of this publication lies only with the authors. It does not necessarily reflect the opinion of the European Communities. The European Commission is not responsible for any use that may be made of the information contained therein.

5Modelling of Technical PV Risks
Table of Contents FOREWORD ...................................................................................................................................... 3 TABLE OF CONTENTS ..................................................................................................................... 5 Figures ............................................................................................................................................... 7 Tables ............................................................................................................................................... 8 Glossary & Abbreviations ................................................................................................................... 9 1. INTRODUCTION .................................................................................................................. 17 1.1. Financial Modelling of PV Projects ....................................................................................... 17 1.1.2. INPUT PARAMETERS ...................................................................................................... 17 1.1.2. OUTPUT PARAMETERS .................................................................................................. 19 1.1.3. CASH FLOW MODELLING TOOLS .................................................................................. 20 2. RISK MODELLING TOOL .................................................................................................... 21 2.1. Definition of Total Failure Costs ........................................................................................... 21 2.2. Specifications for Risk Modelling Tool ................................................................................. 24 3. RISK MODELLING INPUT ................................................................................................... 26 3.1. PV Business Model Selection .............................................................................................. 26 3.2. Technical Risk Selection ...................................................................................................... 28 3.3. Technical Risk Scenario Selection ....................................................................................... 32 3.4. Repair and Maintenance Cost Assumptions ........................................................................ 34 3.5. Risk Modelling Input Factors ................................................................................................ 37 4. FINANCIAL MODELLING OF TECHNICAL RISKS ............................................................. 38 4.1. Assessment of Risk Impact .................................................................................................. 38 4.2. Impact of Technical Risks on Business Model 1 .................................................................. 41 4.2.1. Modelling of Single Technical Risks ..................................................................................... 41 4.2.2. Modelling of Technical Risk Scenario .................................................................................. 44 4.3. Impact of Technical Risks on Business Model 2 .................................................................. 46 4.3.1. Modelling of Single Technical Risks ..................................................................................... 46 4.3.2. Modelling of Technical Risk Scenario .................................................................................. 49 4.4. Impact of Technical Risks on Business Model 3 .................................................................. 51 4.4.1. Modelling of Single Technical Risks ..................................................................................... 51 4.4.2. Modelling of Technical Risk Scenario .................................................................................. 54 4.5. Impact of Technical Risks on Business Model 4 .................................................................. 56 4.5.1. Modelling of Single Technical Risks ..................................................................................... 56 4.5.2. Modelling of Technical Risk Scenario .................................................................................. 59 4.6. Risk Mitigation measures ..................................................................................................... 61 5. IMPACT OF NEW CAPITAL MARKET REGULATIONS ...................................................... 65 5.1. Financial Crisis 2008 ............................................................................................................ 65 5.2. Impact of New Banking Regulations .................................................................................... 66 5.3. Impact of New Insurance Regulations ................................................................................. 66 5.4. Impact of New Investment Funds Regulations ..................................................................... 67 5.5. Overall Impact of New Capital Market Regulations .............................................................. 68 6. CLOSING REMARKS .......................................................................................................... 71

6Modelling of Technical PV Risks
REFERENCES ................................................................................................................................ 74 APPENIDX A – BUSINESS MODEL DESCRIPTION ...................................................................... 77 APPENDIX B – RISK DATABASE ................................................................................................... 81 APPENDIX C – SINGLE RISK RESULTS ....................................................................................... 86 APPENDIX D – RISK SCENARIO RESULTS ................................................................................. 92
7Modelling of Technical PV Risks
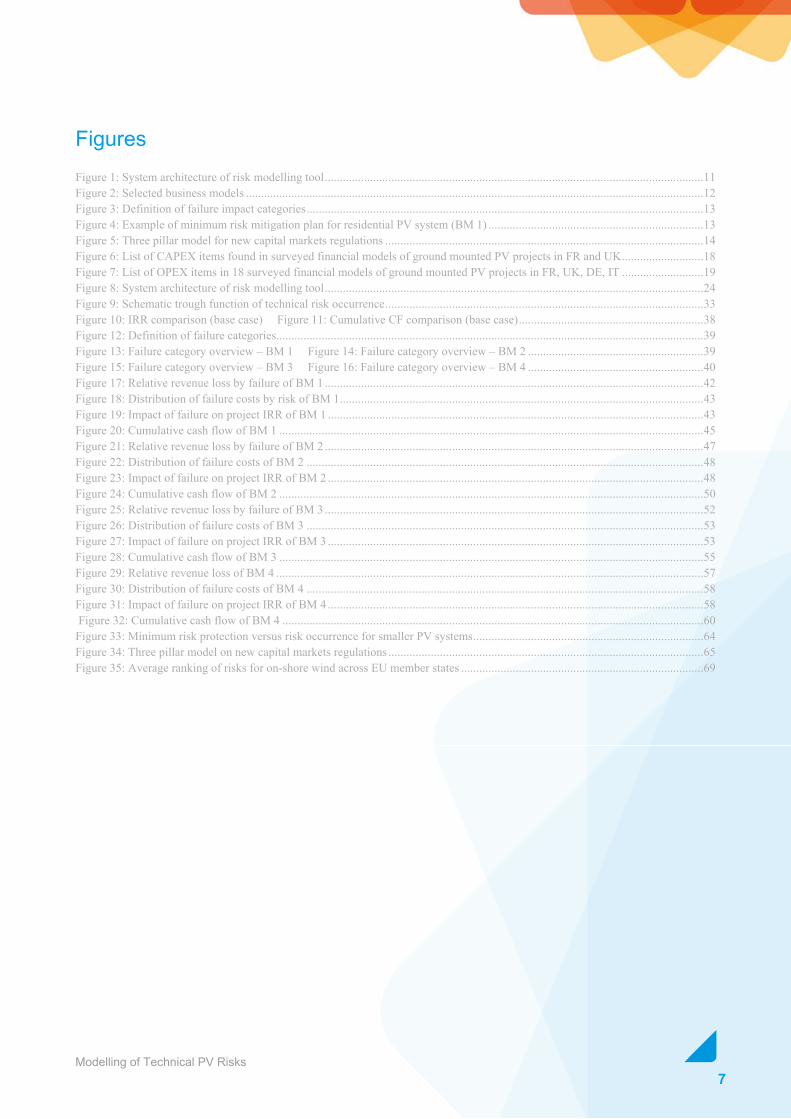
Figures Figure 1: System architecture of risk modelling tool ............................................................................................................................. 11 Figure 2: Selected business models ....................................................................................................................................................... 12 Figure 3: Definition of failure impact categories ................................................................................................................................... 13 Figure 4: Example of minimum risk mitigation plan for residential PV system (BM 1) ....................................................................... 13 Figure 5: Three pillar model for new capital markets regulations ......................................................................................................... 14 Figure 6: List of CAPEX items found in surveyed financial models of ground mounted PV projects in FR and UK ........................... 18 Figure 7: List of OPEX items in 18 surveyed financial models of ground mounted PV projects in FR, UK, DE, IT ........................... 19 Figure 8: System architecture of risk modelling tool ............................................................................................................................. 24 Figure 9: Schematic trough function of technical risk occurrence ......................................................................................................... 33 Figure 10: IRR comparison (base case) Figure 11: Cumulative CF comparison (base case) ............................................................. 38 Figure 12: Definition of failure categories ............................................................................................................................................. 39 Figure 13: Failure category overview – BM 1 Figure 14: Failure category overview – BM 2 .......................................................... 39 Figure 15: Failure category overview – BM 3 Figure 16: Failure category overview – BM 4 .......................................................... 40 Figure 17: Relative revenue loss by failure of BM 1 ............................................................................................................................. 42 Figure 18: Distribution of failure costs by risk of BM 1 ........................................................................................................................ 43 Figure 19: Impact of failure on project IRR of BM 1 ............................................................................................................................ 43 Figure 20: Cumulative cash flow of BM 1 ............................................................................................................................................ 45 Figure 21: Relative revenue loss by failure of BM 2 ............................................................................................................................. 47 Figure 22: Distribution of failure costs of BM 2 ................................................................................................................................... 48 Figure 23: Impact of failure on project IRR of BM 2 ............................................................................................................................ 48 Figure 24: Cumulative cash flow of BM 2 ............................................................................................................................................ 50 Figure 25: Relative revenue loss by failure of BM 3 ............................................................................................................................. 52 Figure 26: Distribution of failure costs of BM 3 ................................................................................................................................... 53 Figure 27: Impact of failure on project IRR of BM 3 ............................................................................................................................ 53 Figure 28: Cumulative cash flow of BM 3 ............................................................................................................................................ 55 Figure 29: Relative revenue loss of BM 4 ............................................................................................................................................. 57 Figure 30: Distribution of failure costs of BM 4 ................................................................................................................................... 58 Figure 31: Impact of failure on project IRR of BM 4 ............................................................................................................................ 58 Figure 32: Cumulative cash flow of BM 4 ........................................................................................................................................... 60 Figure 33: Minimum risk protection versus risk occurrence for smaller PV systems ............................................................................ 64 Figure 34: Three pillar model on new capital markets regulations ........................................................................................................ 65 Figure 35: Average ranking of risks for on-shore wind across EU member states ................................................................................ 69
8Modelling of Technical PV Risks
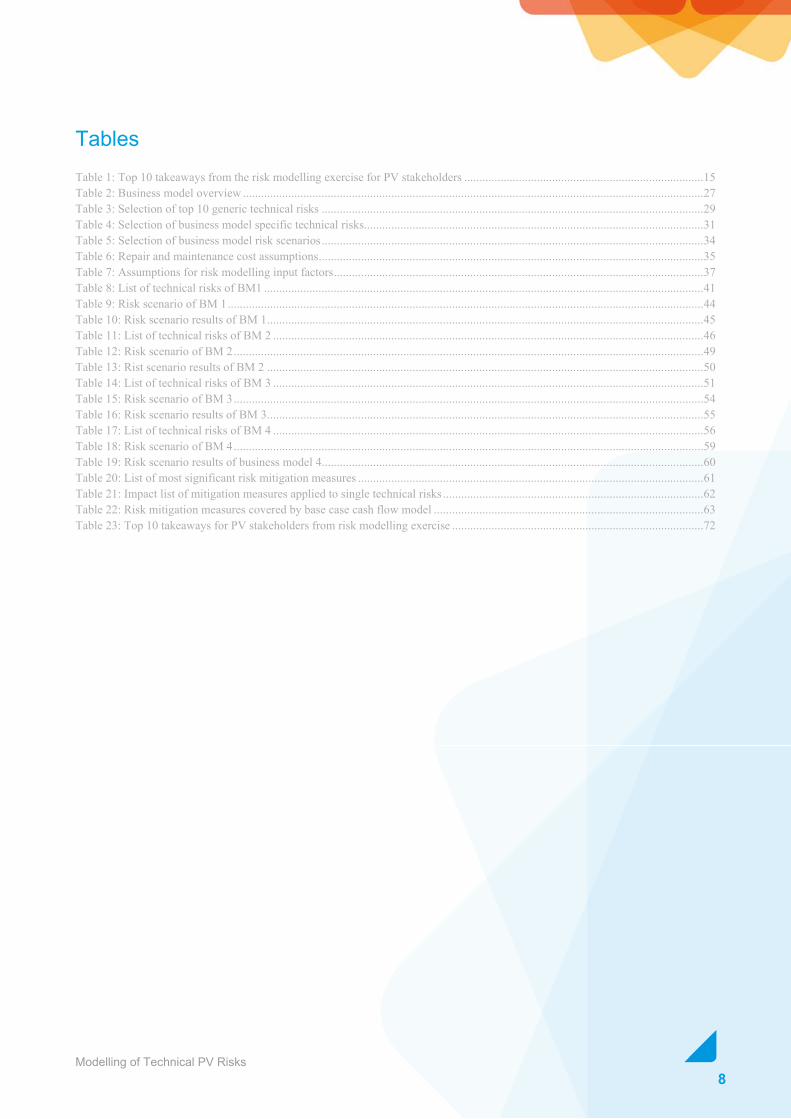
Tables Table 1: Top 10 takeaways from the risk modelling exercise for PV stakeholders ............................................................................... 15 Table 2: Business model overview ........................................................................................................................................................ 27 Table 3: Selection of top 10 generic technical risks .............................................................................................................................. 29 Table 4: Selection of business model specific technical risks ................................................................................................................ 31 Table 5: Selection of business model risk scenarios .............................................................................................................................. 34 Table 6: Repair and maintenance cost assumptions ............................................................................................................................... 35 Table 7: Assumptions for risk modelling input factors .......................................................................................................................... 37 Table 8: List of technical risks of BM1 ................................................................................................................................................. 41 Table 9: Risk scenario of BM 1 ............................................................................................................................................................. 44 Table 10: Risk scenario results of BM 1 ................................................................................................................................................ 45 Table 11: List of technical risks of BM 2 .............................................................................................................................................. 46 Table 12: Risk scenario of BM 2 ........................................................................................................................................................... 49 Table 13: Rist scenario results of BM 2 ................................................................................................................................................ 50 Table 14: List of technical risks of BM 3 .............................................................................................................................................. 51 Table 15: Risk scenario of BM 3 ........................................................................................................................................................... 54 Table 16: Risk scenario results of BM 3 ................................................................................................................................................ 55 Table 17: List of technical risks of BM 4 .............................................................................................................................................. 56 Table 18: Risk scenario of BM 4 ........................................................................................................................................................... 59 Table 19: Risk scenario results of business model 4 .............................................................................................................................. 60 Table 20: List of most significant risk mitigation measures .................................................................................................................. 61 Table 21: Impact list of mitigation measures applied to single technical risks ...................................................................................... 62 Table 22: Risk mitigation measures covered by base case cash flow model ......................................................................................... 63 Table 23: Top 10 takeaways for PV stakeholders from risk modelling exercise ................................................................................... 72
9Modelling of Technical PV Risks
Glossary & Abbreviations
AIFMD Alternative Investment Fund Managers Directives
BM Business model
CAPEX Capital expenditures
CDF Cumulative distribution function
CdTe Cadmium telluride
CPN Cost priority number
cts Cents
DSCR Debt service coverage ratio
DSRA Debt service reserve account
EIOPA European Insurance and Occupational Pensions Authority
EPC Engineering, procurement and constructions
ESMA European Securities Markets Agency
ESRB European Systemic Risk Board
EU European Union
EUR Euro
EURIBOR Euro Interbank Offered Rate (reference for interest rate)
FMEA Failure mode and effects analysis
FiT Feed-in tariff
GHI Global horizontal irradiation
GPR Guaranteed performance ratio
GW Gigawatt
GWp Gigawatt peak (size of PV installation)
IRR Internal rate of return
kWh Kilowatt hour
kWh/a Kilowatt hour per year
kWh/m²/a Kilowatt hour per square meter and year
kWp Kilowatt peak
10Modelling of Technical PV Risks
LCOE Levelised cost of electricity
LCR Liquidity coverage ratio
MCR Minimum capital requirement
MW Megawatt
MWp Megawatt peak (size of PV installation)
n.a. Not applicable
NPV net present value
NREAP National Renewable Energy Action Plan
NSFR Net stable funding ratio
O&M Operations and maintenance
OPEX Operational expenditures
PID Potential induced degradation (PV panel failure)
POA Plane-of-array (irradiation)
PR Performance ratio
PV Photovoltaic
REC Renewable energy certificate
SCR Solvency capital requirement
TCO Transparent conductive oxides
UCITSD Undertakings for Collective Investment in Transferable Securities Directives
UV Ultraviolet
WEEE (European) Waste Electronics and Electrical Equipment
11Modelling of Technical PV Risks
Executive Summary Whilst writing these lines Europe is celebrating the milestone “100 GW of Solar Power Installed in Europe”. In the last decade grid-connected photovoltaic power has advanced from an absolute niche position to a central building block of future electricity generation. Costs of PV systems have fallen more than 70% since 2008 and levelised cost of electricity will continue decline supported by economies of scale and ongoing innovation.
Along with the increasing importance in Europe’s future energy mix the technical reliability and financial stability of PV investments has to match established standards in the utility industry. Hence, the Solar Bankability project aims to establish a common practice for professional risk assessment which will serve to reduce technical risks associated with investements in photovoltaic projects.
Since the start of the Solar Bankability project several reports have already been published. They provide an overview of technical risks of PV systems and introduce a systematic cost-based FMEA method to rank these risks using cost priority numbers (CPN). They describe suitable risk mitigation measures under different cost scenarios and their impact on the cost priority number. They analyse the concept of levelised cost of electricity (LCOE) and summarise technical assumptions and gaps influencing the calculation of lifecycle costs including CAPEX, OPEX and yield. All reports can be downloaded free of charge from the project website www.solarbankability.eu.
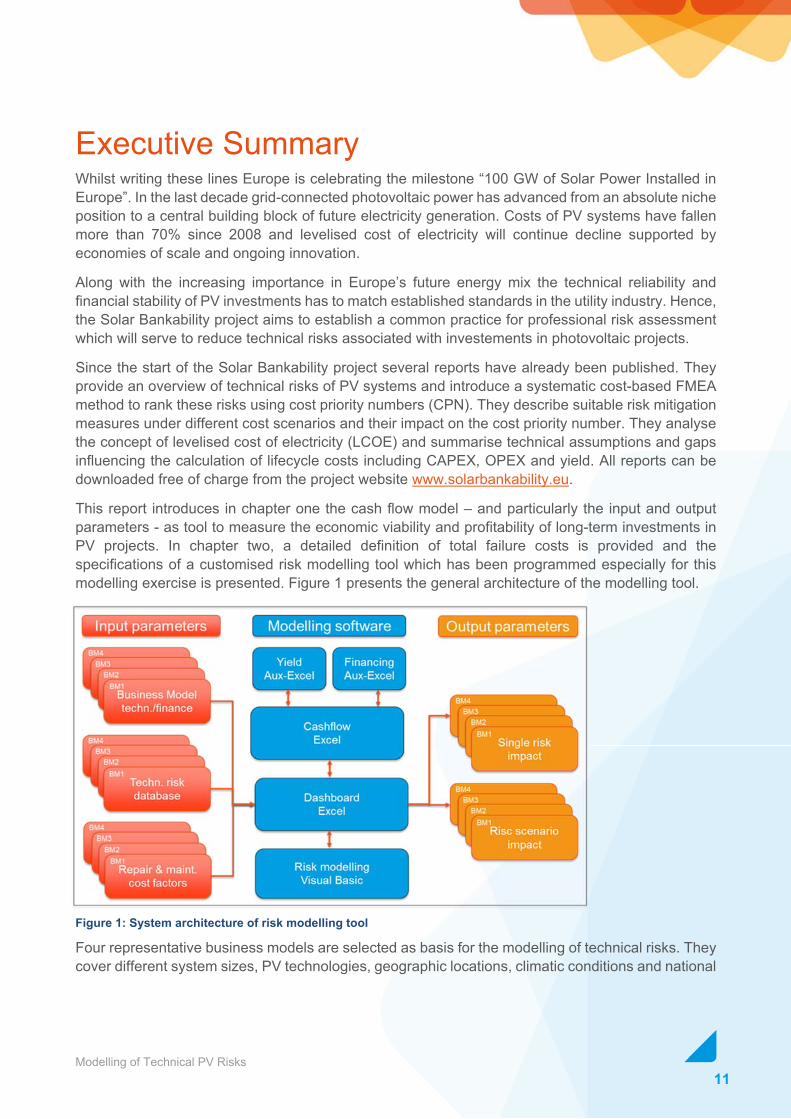
This report introduces in chapter one the cash flow model – and particularly the input and output parameters - as tool to measure the economic viability and profitability of long-term investments in PV projects. In chapter two, a detailed definition of total failure costs is provided and the specifications of a customised risk modelling tool which has been programmed especially for this modelling exercise is presented. Figure 1 presents the general architecture of the modelling tool.
Figure 1: System architecture of risk modelling tool
Four representative business models are selected as basis for the modelling of technical risks. They cover different system sizes, PV technologies, geographic locations, climatic conditions and national

12Modelling of Technical PV Risks
incentive schemes. A summary of the four business models is shown in figure 2. Further PV business models can be easily integrated into the modelling software upon demand.
Figure 2: Selected business models
Based on the CPN risk priority list developed earlier in the project – Report on technical risks in PV project development and PV plant operation [8] – 10 to 12 single technical risks are identified per business model. Input parameters for a corresponding best and worst case are put together. For each business model a sample risk scenario consisting of up to four technical risks (from the 10 to 12 selected) is defined for the simulation of cumulative risks along the life cycle of a PV project.
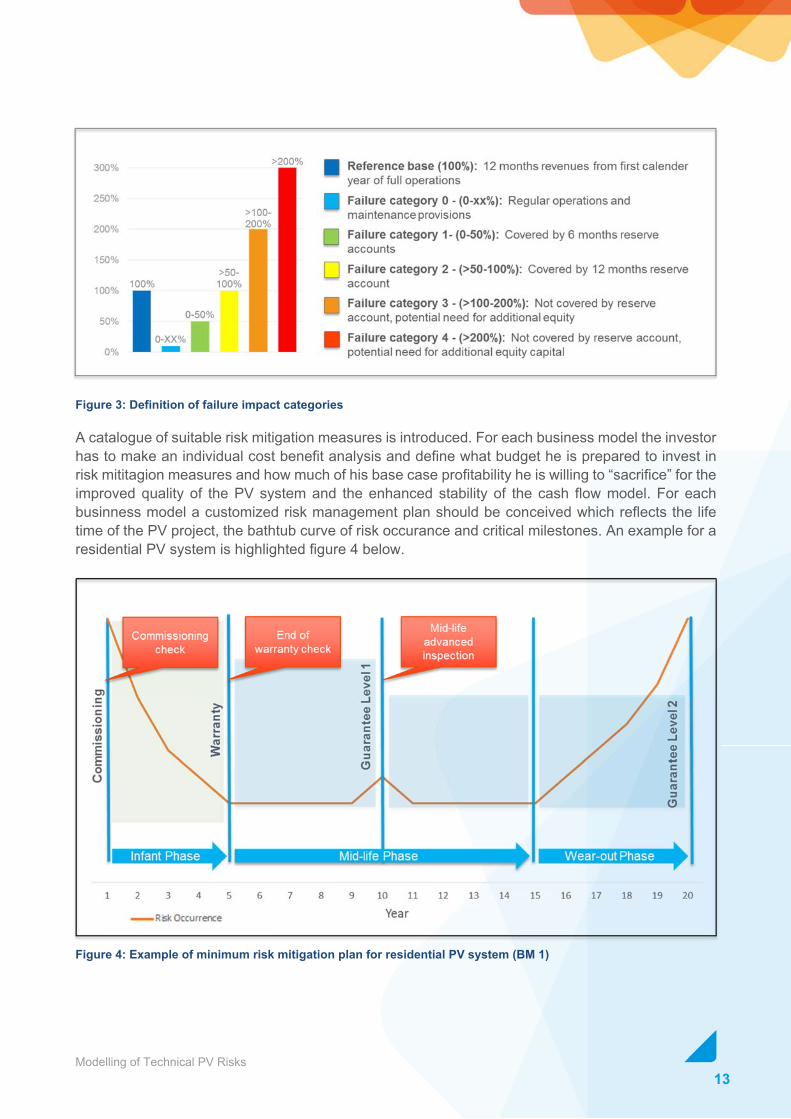
Technical risks, once occurred turn into technical failures. These are distinguished according to the timing of their occurance into infant, mid-life and wear-out failures. The economic impact of failures is measured against year one revenues of a PV project and divided in five categories. Category 0 is normally covered by the regular O&M budget. Categories 1 and 2 are normally covered by a debt service reserve account. Categories 3 and 4 require the injection of additional equity capital, if not covered otherwise by guarantees, warranties or insurances. These are presented in figure 3.
In the risk modelling exercise for each of the four business models the impact of technical failures is analysed. For each failure the failure category, the impact on the internal rate of return (IRR) and a detailed break down of total failure costs in its sub-components is determined and the impact of the risk scenario on the cumulative cash flow of the PV project is measured.
13Modelling of Technical PV Risks
Figure 3: Definition of failure impact categories
A catalogue of suitable risk mitigation measures is introduced. For each business model the investor has to make an individual cost benefit analysis and define what budget he is prepared to invest in risk mititagion measures and how much of his base case profitability he is willing to “sacrifice” for the improved quality of the PV system and the enhanced stability of the cash flow model. For each businness model a customized risk management plan should be conceived which reflects the life time of the PV project, the bathtub curve of risk occurance and critical milestones. An example for a residential PV system is highlighted figure 4 below.
Figure 4: Example of minimum risk mitigation plan for residential PV system (BM 1)

14Modelling of Technical PV Risks
Chapter five provides a short overview of new capital market regulations introduced after the financial crisis in 2008 and their impact on infrastructure investments in general and PV projects in particular. Under the Basel III framework for the banking industry PV projects don’t fall under the category of “high quality liquid assets” and therefore require higher liquidy reserves making PV financing less attractive and more costly. On the other hand under the Solvency II framework for the insurance industry, PV projects are considered as favorable infrastructure investements with somewhat reduced solvency capital requirements. With the Capital Markets Union an action plan is introduced by the European Union to channel additional capital investments from institutional investors such as insurances and pension funds to long-term infrastructure and sustainable projects. The new capital market regulations introduce new risk management and reporting requirements which lead to an increase in administrative costs. The findings of the project aim to provide a sound reference to guide the banking and insurance industry to enhance existing risk management systems and to build up their own inhouse team specialised in PV risk assessment or to engage the expertise of external professional rating services. Figure 5 illustrates the fundamentals of these new capital market regulations.
Figure 5: Three pillar model for new capital markets regulations
15Modelling of Technical PV Risks
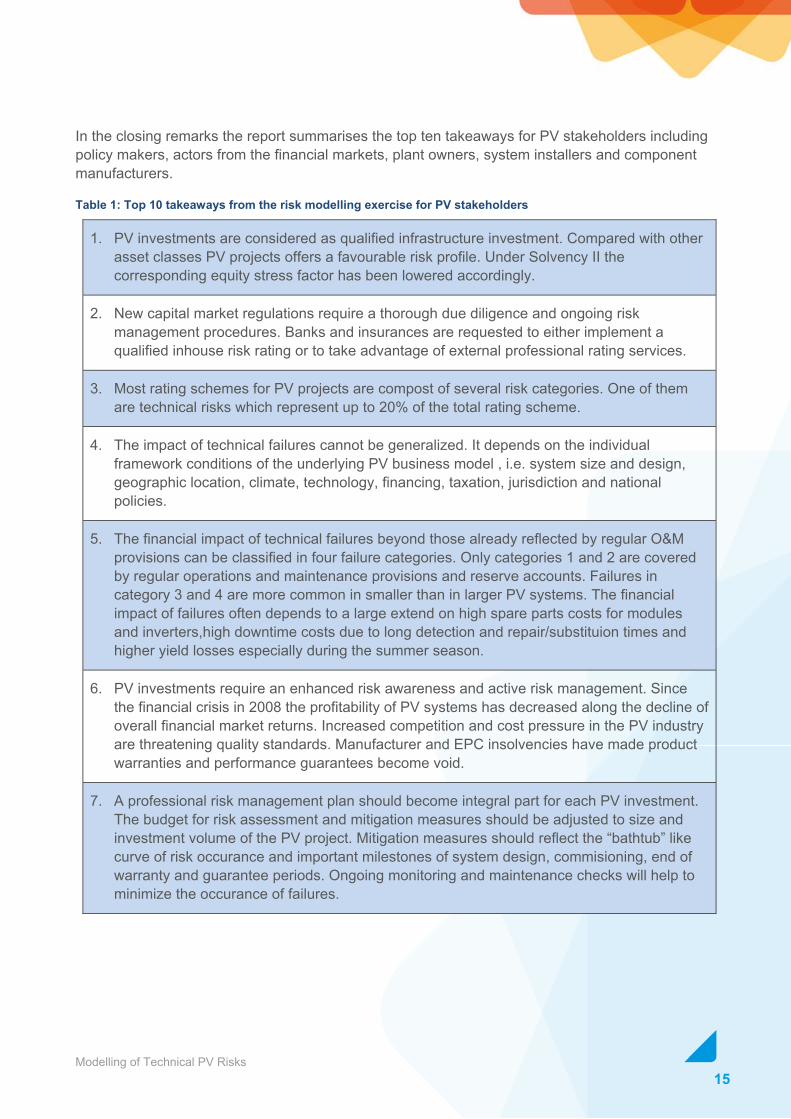
In the closing remarks the report summarises the top ten takeaways for PV stakeholders including policy makers, actors from the financial markets, plant owners, system installers and component manufacturers.
Table 1: Top 10 takeaways from the risk modelling exercise for PV stakeholders
1. PV investments are considered as qualified infrastructure investment. Compared with other asset classes PV projects offers a favourable risk profile. Under Solvency II the corresponding equity stress factor has been lowered accordingly.
2. New capital market regulations require a thorough due diligence and ongoing risk management procedures. Banks and insurances are requested to either implement a qualified inhouse risk rating or to take advantage of external professional rating services.
3. Most rating schemes for PV projects are compost of several risk categories. One of them are technical risks which represent up to 20% of the total rating scheme.
4. The impact of technical failures cannot be generalized. It depends on the individual framework conditions of the underlying PV business model , i.e. system size and design, geographic location, climate, technology, financing, taxation, jurisdiction and national policies.
5. The financial impact of technical failures beyond those already reflected by regular O&M provisions can be classified in four failure categories. Only categories 1 and 2 are covered by regular operations and maintenance provisions and reserve accounts. Failures in category 3 and 4 are more common in smaller than in larger PV systems. The financial impact of failures often depends to a large extend on high spare parts costs for modules and inverters,high downtime costs due to long detection and repair/substituion times and higher yield losses especially during the summer season.
6. PV investments require an enhanced risk awareness and active risk management. Since the financial crisis in 2008 the profitability of PV systems has decreased along the decline of overall financial market returns. Increased competition and cost pressure in the PV industry are threatening quality standards. Manufacturer and EPC insolvencies have made product warranties and performance guarantees become void.
7. A professional risk management plan should become integral part for each PV investment. The budget for risk assessment and mitigation measures should be adjusted to size and investment volume of the PV project. Mitigation measures should reflect the “bathtub” like curve of risk occurance and important milestones of system design, commisioning, end of warranty and guarantee periods. Ongoing monitoring and maintenance checks will help to minimize the occurance of failures.

16Modelling of Technical PV Risks
8. Manufacturers and EPC should use the risk assessment and modelling methodology and the risk data base developed under the Solar Bankability project and incorporate the lessons learnt into their component and system design. Rather than exchanging entire components, smart repair should become market standard i.e. to exchange defective module junction box diodes or inverter circuit boards. A PV system design based on. micro or string inverters sometimes might be less downtime prone than one based on central inverters.
9. Banks and insurers should use the risk assessment and modelling methodology and the risk data base developed under the Solar Bankability project to optimize and adjust i.e. required debt service reserve accounts or to adjust insurance premiums according to the risk rating and age of the PV system
10. To enhance the effectiveness of government tender schemes for large PV projects regulators should consider to include also non-monetary qualification requirements beyond the price-only criteria. A professional risk management plan to ensure the financial viability and technical reliability of the PV system should be incorporated. A quality monitoring program should accompany the tendering process. It should cover the project realization rate and a technical quality and performance check before the end of the PV system warranty period.
17Modelling of Technical PV Risks
1. Introduction
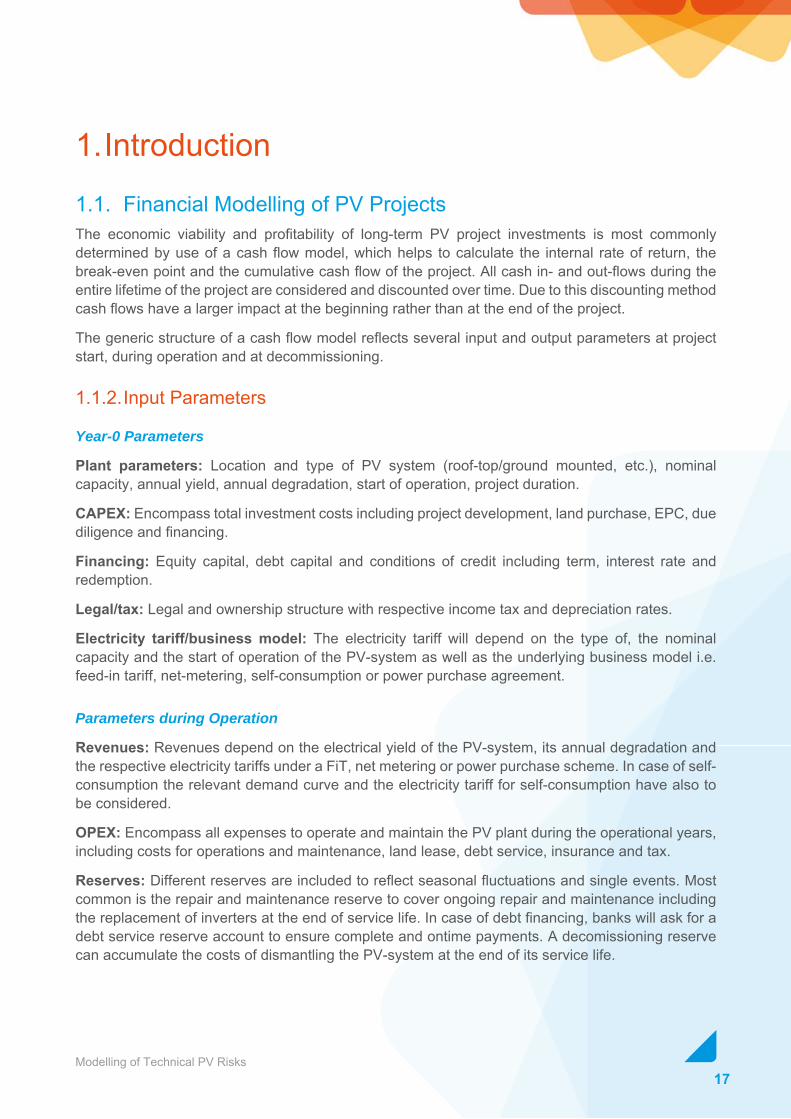
1.1. Financial Modelling of PV Projects The economic viability and profitability of long-term PV project investments is most commonly determined by use of a cash flow model, which helps to calculate the internal rate of return, the break-even point and the cumulative cash flow of the project. All cash in- and out-flows during the entire lifetime of the project are considered and discounted over time. Due to this discounting method cash flows have a larger impact at the beginning rather than at the end of the project.
The generic structure of a cash flow model reflects several input and output parameters at project start, during operation and at decommissioning.
1.1.2. Input Parameters
Year-0 Parameters
Plant parameters: Location and type of PV system (roof-top/ground mounted, etc.), nominal capacity, annual yield, annual degradation, start of operation, project duration.
CAPEX: Encompass total investment costs including project development, land purchase, EPC, due diligence and financing.
Financing: Equity capital, debt capital and conditions of credit including term, interest rate and redemption.
Legal/tax: Legal and ownership structure with respective income tax and depreciation rates.
Electricity tariff/business model: The electricity tariff will depend on the type of, the nominal capacity and the start of operation of the PV-system as well as the underlying business model i.e. feed-in tariff, net-metering, self-consumption or power purchase agreement.
Parameters during Operation
Revenues: Revenues depend on the electrical yield of the PV-system, its annual degradation and the respective electricity tariffs under a FiT, net metering or power purchase scheme. In case of self-consumption the relevant demand curve and the electricity tariff for self-consumption have also to be considered.
OPEX: Encompass all expenses to operate and maintain the PV plant during the operational years, including costs for operations and maintenance, land lease, debt service, insurance and tax.
Reserves: Different reserves are included to reflect seasonal fluctuations and single events. Most common is the repair and maintenance reserve to cover ongoing repair and maintenance including the replacement of inverters at the end of service life. In case of debt financing, banks will ask for a debt service reserve account to ensure complete and ontime payments. A decomissioning reserve can accumulate the costs of dismantling the PV-system at the end of its service life.

18Modelling of Technical PV Risks
Parameters at Decomissioning
CAPEX: Potential costs of decommissioning of the PV system at the end of its regular service life or proceeds from a sale of PV system in case of a potential repowering of the PV-system.
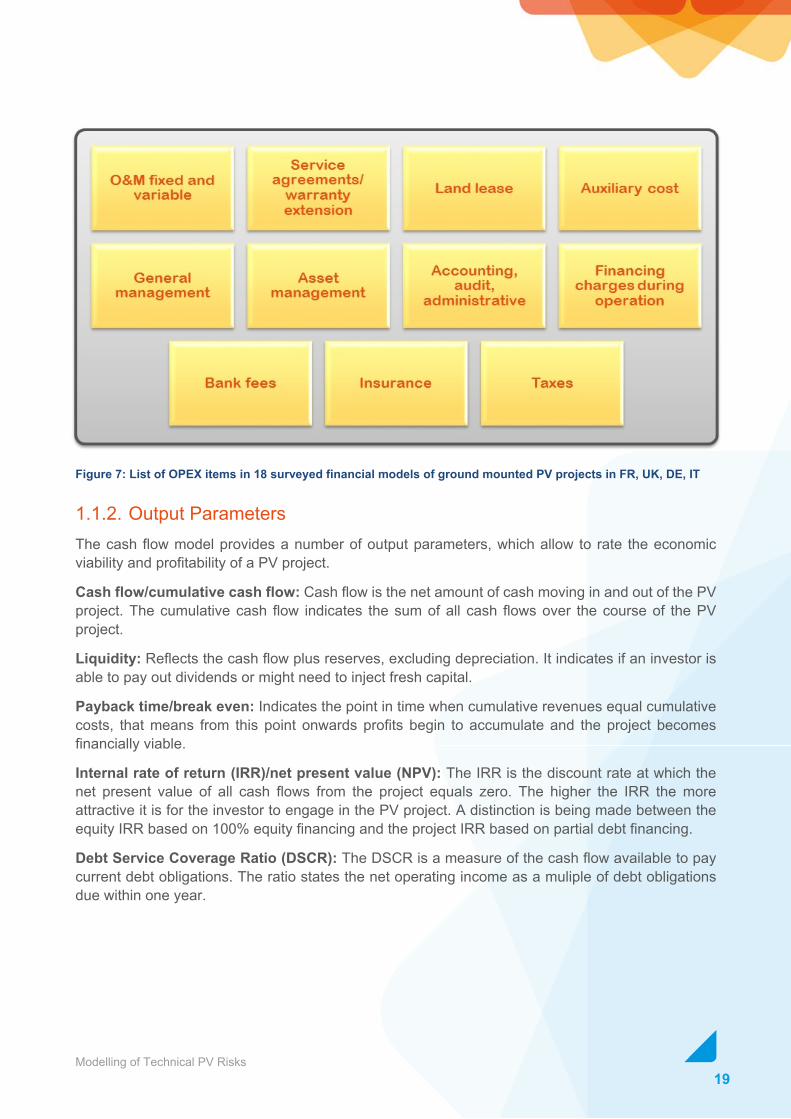
Figures 6 and 7 show an overview of CAPEX and OPEX items found in surveyed financial models. A more detailed description of these expenditures is provided in the report “Review and Gap Analyses of Technical Assumptions in PV Electricity Cost” [1]. The comparison of CAPEX respectively OPEX figures for particular projects turns out to be difficult, because the cost elements accounted under CAPEX and OPEX are not standardized and can vary from project to project.
Figure 6: List of CAPEX items found in surveyed financial models of ground mounted PV projects in FR and UK
19Modelling of Technical PV Risks
Figure 7: List of OPEX items in 18 surveyed financial models of ground mounted PV projects in FR, UK, DE, IT
1.1.2. Output Parameters The cash flow model provides a number of output parameters, which allow to rate the economic viability and profitability of a PV project.
Cash flow/cumulative cash flow: Cash flow is the net amount of cash moving in and out of the PV project. The cumulative cash flow indicates the sum of all cash flows over the course of the PV project.
Liquidity: Reflects the cash flow plus reserves, excluding depreciation. It indicates if an investor is able to pay out dividends or might need to inject fresh capital.
Payback time/break even: Indicates the point in time when cumulative revenues equal cumulative costs, that means from this point onwards profits begin to accumulate and the project becomes financially viable.
Internal rate of return (IRR)/net present value (NPV): The IRR is the discount rate at which the net present value of all cash flows from the project equals zero. The higher the IRR the more attractive it is for the investor to engage in the PV project. A distinction is being made between the equity IRR based on 100% equity financing and the project IRR based on partial debt financing.
Debt Service Coverage Ratio (DSCR): The DSCR is a measure of the cash flow available to pay current debt obligations. The ratio states the net operating income as a muliple of debt obligations due within one year.
20Modelling of Technical PV Risks
1.1.3. Cash Flow Modelling Tools The structure of PV cash flow modelling tools available in the market nowadays, is quite similar. The format of the modelling tool however is not standardised and will vary depending on the underlying PV business model.
Ready-to-use modelling tools can be found in the internet either as online or download version. Dedicated cash flow modelling tools are available as simple FiT-based versions like PVCalc [2] or more sophisticated versions, which can simulate different PV business models like pv@now [3] or PV Power Invest [4]. Combined modelling tools include cash flow and yield calculation. Well known combined tools on a commercial basis are PV*SOL® [5] or PVsyst [6]. Inverter manufacturers often offer free-of-charge combined tools such as SMA Sunny Design [7].
The above tools do not provide any guarantee for the modelling results. For large utility scale PV projects showing a high degree of complexity with regard to the legal, tax and financing structure, it is most common to develop a dedicated PV project modelling tool, which subsequently can be certified by an external auditor to meet the professional risk management requirements of institutional investors.
However, until today there are no commercial risk modelling tools available in the market which allow for the analysis of technical failures and their economic impact over the entire lifecycle of PV systems.
21Modelling of Technical PV Risks
2. Risk Modelling Tool The cash flow model assesses the financial performance of a PV system under regular operating conditions. However throughout the life cycle of a PV system additional risks are likely to occur. The Solar Bankability project has developed a systematic methodology to identify technical risks, to structure them in a risk matrix, to quantify their economic impact with a CPN and to prioritize them. A CPN list has been determined on the basis of more than 700 PV plants with a total capacity of around 420 MWp across all market segments [8]. In contrast to this rather statistical methodology the risk modelling approach tries to simulate the impact of technical risks on selected PV business models with a clearly defined system technology at a given geographic location. A dedicated modelling tool has been developed within the Solar Bankability project to cover these parameters.
2.1. Definition of Total Failure Costs For the calculation of the economic impact of technical risks on the cash flow model, the total failure costs can be split in two parts, the downtime costs and the fixing costs .
= + (1)
Downtime costs
The downtime costs reflect impact from a reduced power production or a complete outage of the PV system and the associated loss in revenues from the missed sale of electricity or missed self-consumption (e.g. for PV installed on buildings). Downtime costs are influenced by the occurence over time and the severity of the failure.
The occurence can be broken down in several time elements. The time to detect desribes the duration from the start of the PV system fault till detection. The time to repair/substitute / describes the duration to repair or substitute components including procurement and transportation lead times. The time to fix describes the duration to fix the failure till restart of normal system operations.
The severity can be described by a performance loss factor , a multiplier and the yield loss of the affected component. represents the fraction of performance loss caused by the failure, where = 1 indicates a total loss.The multiplier reflects the circumstance that a failure can cause performance losses at a higher component level, i.e. a single module failure can affect the performance of an entire module array. Depending on the affected component the yield loss can be broken down from inverter, to string and eventually to module level. Therefore any yield loss of a component can be expressed as a multiple of the yield of a single module .
The performance loss factor is composed of two elements and , where covers the time frame and / and covers . equals 1 if fixing of the PV system requires a complete shut down of the PV system, i.e. for safety reasons.

22Modelling of Technical PV Risks
Thus the downtime costs can be calculated by the formula:
= (( + / )) × × + × × ) × × (2) where
• = downtime costs [EUR]
• = time to detect [days]
• / = time to repair/substitute - including transpotation time [days]
• = time to fix [days]
• = muliplier at higher component level [-]
• = performance loss during and / [-]
• = performance loss during [-]
• = module yield = PV system yield/number of modules [kWh]
• = electricity price under FiT, REC or PPA scheme [EUR/kWh]
For PV systems with battery storage and self-consumption there are two elements of downtime costs. Different electricity prices have to be reflected for the feed-in share and the self-consumption share of solar electricity. The formula for downtime costs needs to be adjusted accordingly.
= , + , (3) Fixing costs
The fixing costs can be broken down in detection, repair/substitution, transportation and labour costs.
The detection costs cover various cost elements including visual inspection, field test (i.e. hot spot), laboratory (i.e. electroluminescence) and third party expert opinions. Costs for a monitoring system usually are accounted for under regular O&M costs.
The repair/substituion costs / cover costs for the repair of defect components or the complete subtitution of irreparable components.
The transportation costs cover the tranportation of components and other miscellaneous costs such as security costs (i.e. the protection of a PV site) and safety costs (i.e. the scaffolding at a roof-top PV system).
The labour costs cover all personnel related costs during time to fix including hourly wages, travel costs and other expenses. = + / + + (4)

23Modelling of Technical PV Risks
where
• = detection costs [EUR]
• / = repair/substitution costs [EUR]
• = transportation costs [EUR]
• = labour costs [EUR]
The CPN methodology introduced in the Solar Bankability report Techical Risks in PV Projects [8] uses a statistically driven top-down cost approach, where the overall , / , and are considered to be directly proportional to the number of failures .
This approach can be most suitable for large utility scale PV systems. However, under certain circumstances it has some drawbacks. The detection costs for animal bites can be rather high and are not directly proportional to the number of defect components. Repair and substitution costs of components depend on the degree of damage and often require further differentiation. Some components can be repaired whilst others must be substituted. Transportation costs depend very much on the batch size and vary whether pallets or containers are used. For small residential PV systems, the labour cost for the replacement of a single component can be less than the actual travelling expenses.
For the modelling of technical risks basically the same cost calculation method as for the CPN can be applied. However, for the modelling, a more detailed bottom-up approach is preferred, based on the experience gained during the handling of more than 3,500 PV insurance claims. This allows to determine more accurately the fixing costs for both large and small PV systems.

24Modelling of Technical PV Risks
2.2. Specifications for Risk Modelling Tool There are no commercial risk modelling tools available in the market which allow the analysis of technical failures and their economic impact over the lifecycle of PV systems. Therefore a customized tool had to be developed for the Solar Bankability project as shown in figure 8.
Figure 8: System architecture of risk modelling tool
The system architecture of the risk modelling software uses a proven spreadsheet based cash flow model as backbone. Auxiliary spreadsheets are dedicated to the yield and debt financing calculation. The cash flow model is linked with a risk modelling module programmed in Visual Basic. The entire modelling software is controlled from a dashboard which is embedded in the spreadsheet-based tool.
A business model selector in the dashboard enables the selection of the technical and financial data of individual business models and the corresponding risk database. The user can select between one to four technical risks from the risk database for the modelling of single risks or risk scenarios. Every failure, it´s starting date and duration can be manually adjusted to simulate the impact at different stages of the PV project lifecycle. The option to combine several failures with different attributes enables the user to simulate various risk scenarios along the entire lifecycle.
Upon completion of the input parameters a starter button initiates the dynamic calculation of technical risks in the risk modelling tool. The associated failure costs are split into fixing and downtime costs. The fixing costs are added to the OPEX in the cashflow. The downtime costs are deducted from the solar energy yield. The results of the calculation are written into a report sheet for
25Modelling of Technical PV Risks
each business model. The sheet contains both tables and graphs to summarize the impact of single risks and entire risk scenarios.
The risk modelling tool is based on a 40 year time frame. Many feed-in tariff schemes reach up to 20 years.Today’s physical lifetime of PV systems ranges between 20 and 30 years. In the future more and more PV systems will be repowered at reasonable costs and their theoretical lifetime will be extended up to 40 years. Thus the tool enables investors like insurances and penion funds to cover their longterm investment horizon.
The yield of PV systems is subject to sizeable seasonal changes due to the fluctuation of solar irradiation. Hence the impact of technical risks varies considerable with the date of risk occurance. In order to reflect this circumstance, quarterly instead of yearly time increments have been implemented in the risk modelling tool.
To limit the complexity and shorten the run time of the risk modelling software, some compromises in the system design turned out to be necessary:
• The accuracy of input and output parameters is limited to two digits.
• In the modelling of performance lossses only was considered for the total duration of failure while was neglected. Usually total downtime costs are more heavily influenced by the time to detect and repair/substite than by the time to fix the failure. In most cases downtime costs during the time to fix are limited to the fraction of affected components.
Prior to the risk modelling exercise, the individual modules of the risk modelling tool have been thoroughly tested. The cash flow module in the spreadsheet-based tool was tested with pv@now as reference. The risk modelling module in Visual Basic was reviewed by an independent software expert. For individual technical risks the output of the modelling tool was compared with offline manual calculations. Through these measures, it was secured that the single modules of the modelling tool are working accurately and also display correct results, both for long (> 360 days) and short failure durations (< 2 days). The next step was to align all these proven calculation modules over a timeline and integrate them into a Visual Basic code. The timeline had to reflect a freely selectable starting date and the quaterly seasonality of solar irradidation. To evaluate the results which are generated by the different modules, a complex write-out topology had to be generated.
The variability of PV system technologies and business models, and the compilation of input parameters requires a deep understanding of PV system design, CAPEX and OPEX, and repair and maintenance practices. Given the overall complexity of the risk modelling tool, only a trained and experienced user can operate the tool in a meaningful manner.
26Modelling of Technical PV Risks
3. Risk Modelling Input Modelling the economic impact of technical risks on the cash flow of PV projects requires the selection of the underlying business models, selection of associated technical risks, likely risk scenarios and the underlying cost assumptions.
3.1. PV Business Model Selection The Solar Bankability report PV Business Model Country Snapshots [9] introduces eight generic PV business models and provides a snapshot of seven national PV markets and their current business model roll-out situation, including Germany, Italy, France, Spain, United Kingdom (UK), Romania and the Netherlands.
At the end of this report four business models were selected for the financial modelling of technical risks. In the selection process various criteria were considered such as PV system size, module and inverter technology, ground and roof-top mounting, solar electricity feed-in and self-consumption, geographic location and climatic conditions.
1) Business model 1: Residential rooftop PV system with crystalline silicon modules located in central Europe (base case),
2) Business model 2: Residential rooftop PV system with crystalline silicon modules and battery storage located in central Europe,
3) Business model 3: Utility scale ground mounted PV system with crystalline silicon modules located in central Europe,
4) Business model 4: Utility scale ground mounted PV system with thin film CdTe modules located in southern Europe.
Based on these descriptions four existing PV systems were identified with the support of the consortium partners and members from the Project Advisory Board, which is a cluster of mainly investors/bankers with long experience in solar financing accompanied with project developers and EPCs and component manufacturers. For each business model technical and financial parameters were obtained from the system owners and are summarized in Appendix A. Solar irradiation and yield data were obtained from the PVGIS photovoltaic calculator Europe [10]. Table 2 gives an overview over the particular business models. More details are provided in Appendix A.

27Modelling of Technical PV Risks
Table 2: Business model overview
BM 1 BM 2 BM 3 BM 4
Location Palatinate Germany
Bavaria Germany
Nottinghamshire UK
South Tyrol Italy
System type residential, roof-top
residential, roof-top
utility, ground mounted
utility, ground mounted
Nominal capacity (kWp)
5.64 5.20 7619.00 662.6
Module Yingli 235P Aleo S79 L260 Q CELLS Q.Pro-G3 260
First Solar FS277
Inverter SMA SB5000TL
SMA SB2.5 1VL-40
SMA SC800CP-XT
SMA SMC8000TL
Battery n.a. IBC Solstore Li 6.5
n.a. n.a.
CAPEX (EUR) confidential confidential confidential confidential
OPEX (EUR/a) confidential confidential confidential confidential
Global tilted irradiadiance (kWh/m²/a)
1229 1260 1195 1675
Annual Production (kWh/a)
5558 5267 7355057 966016
Start of operation
January 2011 January 2015 January 2011 July 2010
Feed-in tariff 0.2874 0.1231 0.1560 0.3600
Self-cons. tariff (EUR/kWh)
n.a. 0.2792 n.a. n.a.
28Modelling of Technical PV Risks
Since the focus of the financial modelling exercise lies on the assessment of the economic impact of technical risks, certain compromises were made on purpose to simplify the implementation of the cash flow model and to enhance the transparency and comparability of results.
Details of the CAPEX and OPEX figures were not disclosed by the system owners. Therefore the figures had to be entered on an aggregate rather than on a breakdown level. The PVGIS calculator provides rather basic irradiation and yield data. No special effort was made to further optimise these values.
In a discussion with the Project Advisory Board, it was decided to base the cash flow modelling for all business models on a 100% equity financing structure. Thus the economic impact of technical risks remains more objective and comparable and is not influenced by different financial leverage ratios which are subject to the individual risk/return preferences of individual investors.
3.2. Technical Risk Selection In the Solar Bankability report “Technical Risks in PV Projects” [8], technical risks were identified and categorised for components and phases of the value chain of a PV project. The technical risks were broadly divided into risks to which one can assign an uncertainty to the initial yield assessment and risks to which one can assign a CPN. While failures arising from technical risks belonging to the first group have an impact on the overall uncertainty of the initial yield assessment, failures with a CPN have a direct impact on the annual cost of running a PV plant caused by economic losses due to downtime and component repair or substitution.
For the purpose of this report the focus lies on the assessment of the economic impact of technical risks occurring during the operations and maintenance phase (O&M) of a PV project. Risk associated with the uncertainty of the initial yield assessment have been extensively analysed in the Solar Bankability report “Review and Gap Analysis of Technical Assumptions in PV Electricity Cost” [1].
The selection of technical risks during the O&M phase is based on the failure database described in the report “Technical Risks in PV Projects” [4]. This database was developed with a portfolio of more than 700 PV plants, 420 MWp, ~2,000,000 modules, ~12,000 inverters, etc. for a total of ~2.4 million components. With the help of filter criteria the database can be sorted into different sub-databases.
In a multistep selection process the database is filtered for a set of top 10 general technical risks which apply to all four business models and can be compared across these business models.
Step 1: Sub-database 1 contains top 10 technical risks from all affected plants with a maximum assumed detection time for technical risks of 365 days. This selection step focuses on maximum total loss as sum of fixing costs ( ) and downtime costs ( ).
Step 2: Sub-database 2 contains top 10 technical risks from all affected plants where the failures are fixed immediately and downtime costs are minimal. This selection step focuses on maximum fixing costs ( )
Step 3: Sub-database 3 contains top 10 technical risks from all plants with a maximum assumed detection time for technical risks of 365 days. This selection step focuses primarily on the risks with the highest occurance and secondarily on the the maximum total loss as sum of fixing costs ( ) and downtime costs ( ).
29Modelling of Technical PV Risks
Step 4: Sub-database 4 contains top 10 technical risks from all plants where the failures are fixed immediately. This selection step focuses primarily on the risks with the highest occurence and secondarily on the maximum fixing costs ( ).
From each sub-database those risks which contain an evident numerical error, which are not described in detail in Appendix 2 [8], or which are not applicable to all four PV business models, are eliminated.
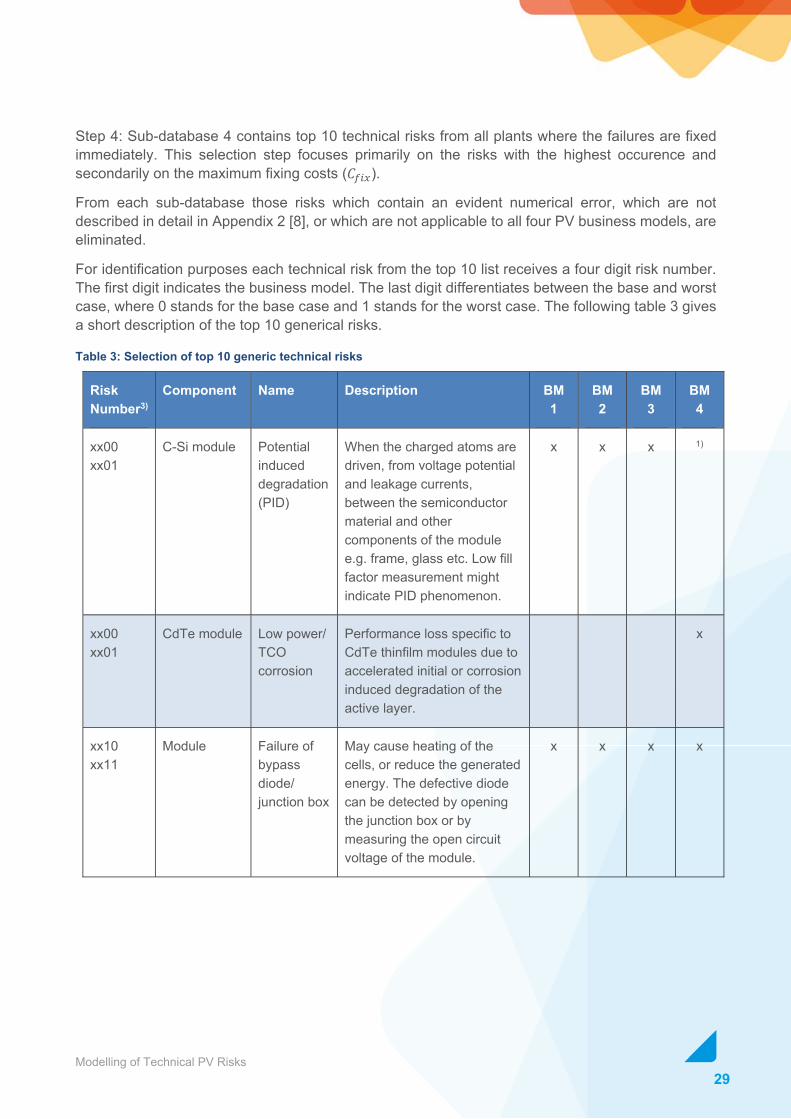
For identification purposes each technical risk from the top 10 list receives a four digit risk number. The first digit indicates the business model. The last digit differentiates between the base and worst case, where 0 stands for the base case and 1 stands for the worst case. The following table 3 gives a short description of the top 10 generical risks.
Table 3: Selection of top 10 generic technical risks
Risk Number3)
Component Name Description BM 1
BM 2
BM 3
BM 4
xx00 xx01
C-Si module Potential induced degradation (PID)
When the charged atoms are driven, from voltage potential and leakage currents, between the semiconductor material and other components of the module e.g. frame, glass etc. Low fill factor measurement might indicate PID phenomenon.
x x x 1)
xx00 xx01
CdTe module Low power/ TCO corrosion
Performance loss specific to CdTe thinfilm modules due to accelerated initial or corrosion induced degradation of the active layer.
x
xx10 xx11
Module Failure of bypass diode/ junction box
May cause heating of the cells, or reduce the generated energy. The defective diode can be detected by opening the junction box or by measuring the open circuit voltage of the module.
x x x x

30Modelling of Technical PV Risks
Risk Number3)
Component Name Description BM 1
BM 2
BM 3
BM 4
xx20 xx21
C-Si Module Hotspot Overheating of cells etc. can cause burn marks. Temperature difference between neighbour cells should not be over 30°C. Infrared cameras can be used for imaging the defects of the modules. Hotspots can also be identified by visual inspection from the rear side of the module.
x x x 2)
xx30 xx31
Module Theft or vandalism
Significant reduction in the energy production
x x x x
xx40 xx41
Inverter Fan failure and overheating
May cause the temperature derating and reduce the production. Following the inverters’ error message, appropriate measures must be taken immediately.
x x x x
xx50 xx51
Inverter Lightning strike
European standards require the protection of metallic structures and electronic devices against lightning strike. A lightning protection can prevent the plant from being stopped for several weeks and substitution of expensive components.
x x x x
xx60 xx61
Mounting Mismatch of module clamp
May cause frame damage, glass breakage or unsufficient fixation of module.
x x x x
xx70 xx71
Cable UV aging of string cable
Happens when the cable is exposed to UV radiation. This phenomenon can be reduced by protecting the cables from direct exposure to sunlight.
x x x x

31Modelling of Technical PV Risks
Risk Number3)
Component Name Description BM 1
BM 2
BM 3
BM 4
xx80 xx81
Cable Wrong/ absent cable connection
Different types (brands) of connectors are used often in practice. Besides the fact that they may not fit correctly, the durability of the connection is not certain. Thus, it is highly recommended that only connectors of the same type are installed.
x x x x
xx90 xx91
Cable Cabling damaged by rodents
This may lead to a performance reduction and even a safety risk. The repair costs depend on the design of the plant.
x x x x
1) PID is not applicable to CdTe thin film modules 2) Hot spots are only typical for crystalline silicon modules 3) Base case: Last digit = 0 / Worst case: Last digit = 1
This list of top 10 general technical risks - shown in table 4 - is then amended by a selection of one or two risk specific to the technical design or the climatic conditions of each of the four business models.
Table 4: Selection of business model specific technical risks
Risk number
Component Name Description BM 1
BM 2
BM 3
BM 4
1100 1101
Module Glass breakage by hail
Glass breakage during operation caused by hail
x
1110 1111
Module Soiling of module
Performance loss due to soiling caused, amongst others, by pollution, bird droppings, and accu-mulation of dust and/or pollen. Its impact is strongly site dependent.
x

32Modelling of Technical PV Risks
Risk number
Component Name Description BM 1
BM 2
BM 3
BM 4
2100 2101
Battery Failure of battery
Performance loss of battery caused, amongst others, by premature aging of battery cells
x
2110 2111
Inverter Failure of battery inverter
Performance loss caused by overheating or complete destruction by grid or lighting surcharge
x
3100 3101
Inverter Flooding of inverter
Partial performance loss or complete destruction of inverters caused by flooding
x
3110 3111
Module Soiling of module
Performance loss due to soiling caused, amongst others, by pollution, bird droppings, and accumulation of dust and/or pollen. Its impact is strongly site dependent.
x
4100 4101
Module Glass breakage, frameless module
Glass breakage of frameless CdTe modules caused, amongst others, by mishandling, thermal stress, snow load
x
For each business model a database with a complete list of the selected technical risks is provided in Appendix B.
3.3. Technical Risk Scenario Selection A PV project will be exposed to several technical risks throughout its operational phase. According to the occurrance of technical risks three categories of failure can be distinguished.
• Infant failure: Occurs during the initial run-in phase of the PV system, normally this is during the first two years of operations and should be covered by warranties from EPC or component manufacturers.
• Mid-life failure: Occurs in the middle of the project life cycle. Some of them might be covered by manufacturer guarantees like the module performance guarantee.
• Wear-out failure: Usually occurs during the end of the project life cycle. However for inverters the regular wear-out usually takes already place after 10 to 15 years.
33Modelling of Technical PV Risks
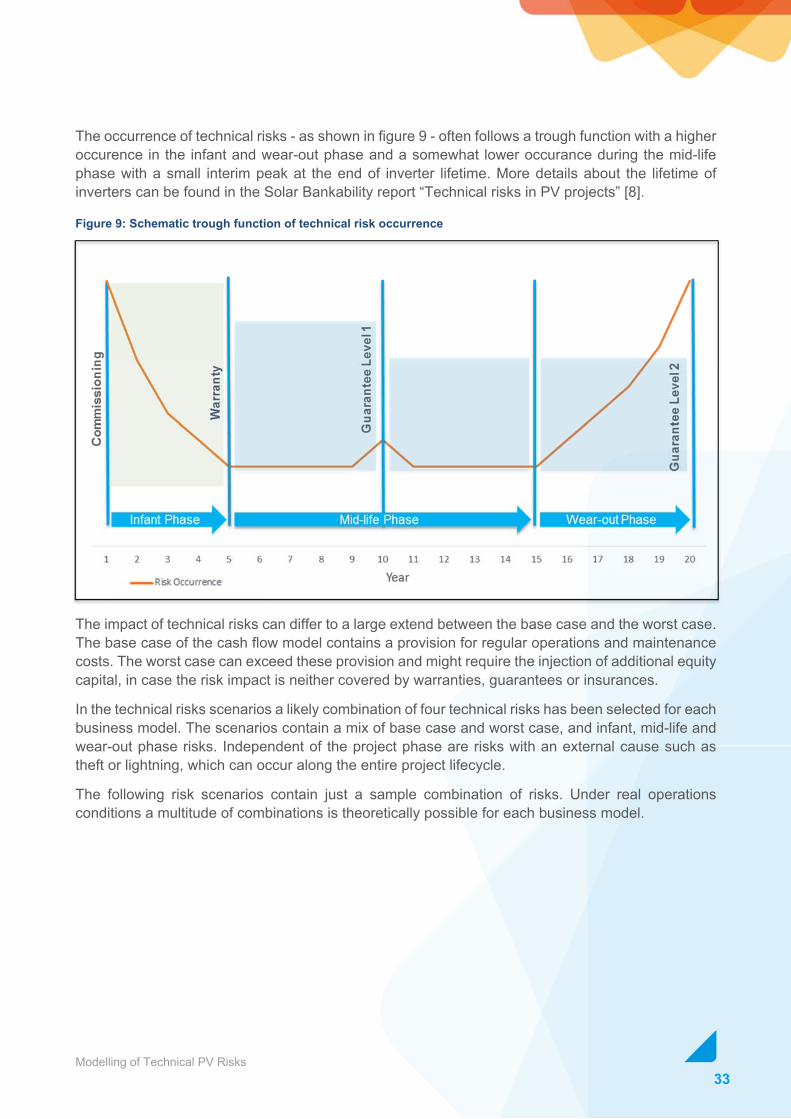
The occurrence of technical risks - as shown in figure 9 - often follows a trough function with a higher occurence in the infant and wear-out phase and a somewhat lower occurance during the mid-life phase with a small interim peak at the end of inverter lifetime. More details about the lifetime of inverters can be found in the Solar Bankability report “Technical risks in PV projects” [8].
Figure 9: Schematic trough function of technical risk occurrence
The impact of technical risks can differ to a large extend between the base case and the worst case. The base case of the cash flow model contains a provision for regular operations and maintenance costs. The worst case can exceed these provision and might require the injection of additional equity capital, in case the risk impact is neither covered by warranties, guarantees or insurances.
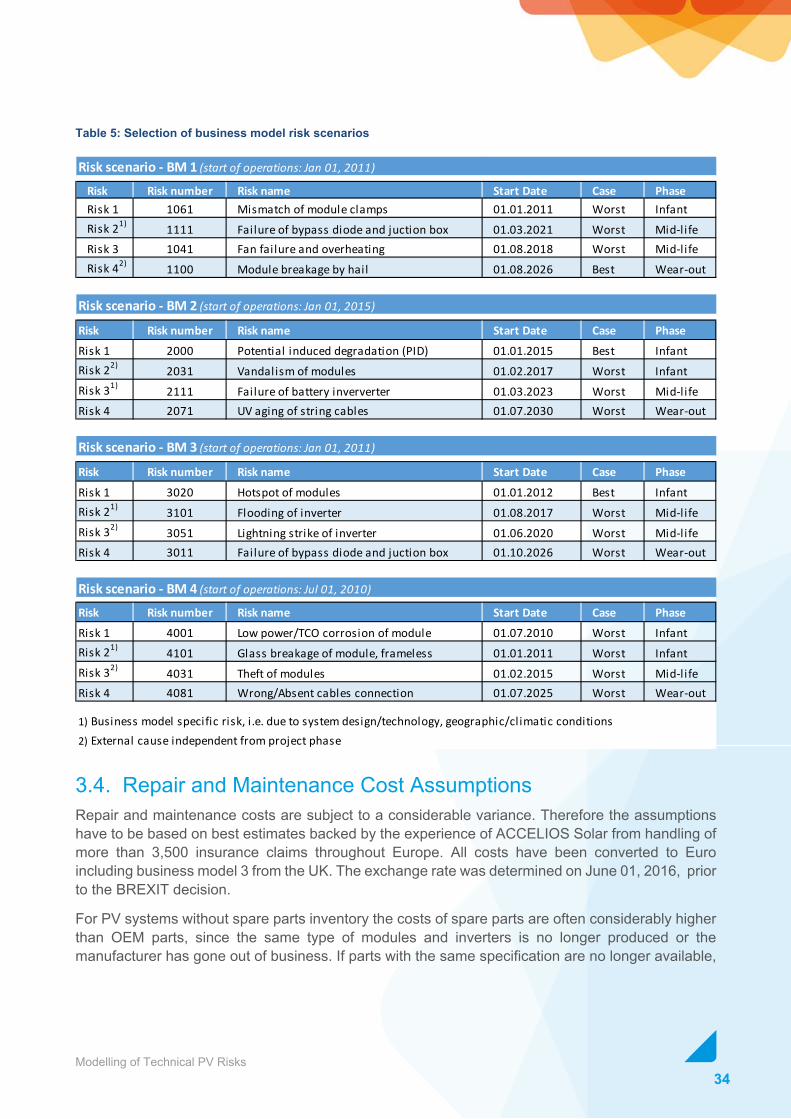
In the technical risks scenarios a likely combination of four technical risks has been selected for each business model. The scenarios contain a mix of base case and worst case, and infant, mid-life and wear-out phase risks. Independent of the project phase are risks with an external cause such as theft or lightning, which can occur along the entire project lifecycle.
The following risk scenarios contain just a sample combination of risks. Under real operations conditions a multitude of combinations is theoretically possible for each business model.
34Modelling of Technical PV Risks
Table 5: Selection of business model risk scenarios
3.4. Repair and Maintenance Cost Assumptions Repair and maintenance costs are subject to a considerable variance. Therefore the assumptions have to be based on best estimates backed by the experience of ACCELIOS Solar from handling of more than 3,500 insurance claims throughout Europe. All costs have been converted to Euro including business model 3 from the UK. The exchange rate was determined on June 01, 2016, prior to the BREXIT decision.
For PV systems without spare parts inventory the costs of spare parts are often considerably higher than OEM parts, since the same type of modules and inverters is no longer produced or the manufacturer has gone out of business. If parts with the same specification are no longer available,
Risk Risk number Risk name Start Date Case PhaseRisk 1 1061 Mismatch of module clamps 01.01.2011 Worst InfantRisk 21) 1111 Failure of bypass diode and juction box 01.03.2021 Worst Mid-lifeRisk 3 1041 Fan failure and overheating 01.08.2018 Worst Mid-lifeRisk 42) 1100 Module breakage by hail 01.08.2026 Best Wear-out
Risk Risk number Risk name Start Date Case PhaseRisk 1 2000 Potential induced degradation (PID) 01.01.2015 Best InfantRisk 22) 2031 Vandalism of modules 01.02.2017 Worst InfantRisk 31) 2111 Failure of battery inververter 01.03.2023 Worst Mid-lifeRisk 4 2071 UV aging of string cables 01.07.2030 Worst Wear-out
Risk Risk number Risk name Start Date Case PhaseRisk 1 3020 Hotspot of modules 01.01.2012 Best InfantRisk 21) 3101 Flooding of inverter 01.08.2017 Worst Mid-lifeRisk 32) 3051 Lightning strike of inverter 01.06.2020 Worst Mid-lifeRisk 4 3011 Failure of bypass diode and juction box 01.10.2026 Worst Wear-out
Risk Risk number Risk name Start Date Case PhaseRisk 1 4001 Low power/TCO corrosion of module 01.07.2010 Worst InfantRisk 21) 4101 Glass breakage of module, frameless 01.01.2011 Worst InfantRisk 32) 4031 Theft of modules 01.02.2015 Worst Mid-lifeRisk 4 4081 Wrong/Absent cables connection 01.07.2025 Worst Wear-out
Risk scenario - BM 4 (start of operations: Jul 01, 2010)
1) Business model specific risk, i.e. due to system design/technology, geographic/climatic conditions2) External cause independent from project phase
Risk scenario - BM 1 (start of operations: Jan 01, 2011)
Risk scenario - BM 2 (start of operations: Jan 01, 2015)
Risk scenario - BM 3 (start of operations: Jan 01, 2011)

35Modelling of Technical PV Risks
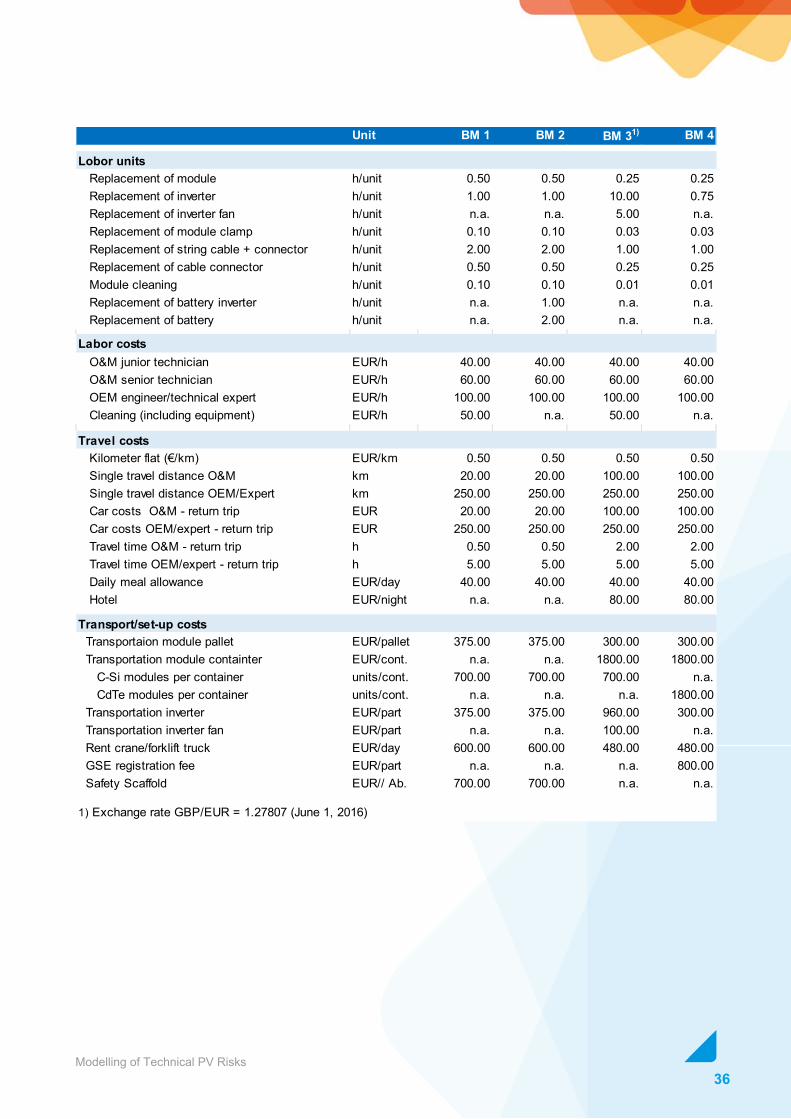
a redesign of module strings or the inverter configuration might become necessary. Due to economies of scale spare part prices for utility PV systems tend to be lower than for residential PV systems. As there are no established secondary markets in the PV industry the future price development for spare parts is hard to predict. Therefore fixed spare part prices are considered throughout the risk modelling exercise.
Labour rates can be split in three qualification levels. The highest rates apply especially for failure detection by PV experts and central inverter repair by OEM technicians. Sometimes safety regulations require the presence of two persons, i.e. for residential roof-top systems or for central inverter repair. Despite the fact that labour rates can vary significantly across countries for simplicity reasons the the labour rates were assumed to be identical in the risk modelling exercise.
Unit costs for the replacement include the time for disassembly and reassembly of components. Residential roof-top PV systems tend to be more complex and time consuming than large utility PV systems. Unit costs are hard to estimate and can vary with individual site conditions.
Travel, transportation and set-up costs can add a considerable amount to the total failure fixing costs, especially if the site of the PV system is far away, several trips are involved, safety scaffolding, cranes or forklift trucks have to be rented.
Table 6: Repair and maintenance cost assumptions
Unit BM 1 BM 2 BM 31) BM 4Spare parts Module EUR/unit 200.00 260.00 187.20 64.90 Inverter EUR/unit 1325.00 980.00 62472.00 960.00 Inverter 10 year replacement/overhaul EUR/unit 650.00 475.00 24000.00 960.00 Inverter fan EUR/unit n.a. n.a. 2779.20 n.a. Module clamp EUR/unit 3.00 3.00 2.40 2.40 DC string cable EUR/m 12.70 12.70 34.80 21.00 Cable connector (MC4) EUR/unit 3.00 3.00 2.40 2.40 Battery inverter EUR/unit n.a. 1025.20 n.a. n.a. Battery EUR/unit n.a. 7226.90 n.a. n.a.
1) Exchange rate GBP/EUR = 1.27807 (June 1, 2016)
36Modelling of Technical PV Risks
Unit BM 1 BM 2 BM 31) BM 4
Lobor units Replacement of module h/unit 0.50 0.50 0.25 0.25 Replacement of inverter h/unit 1.00 1.00 10.00 0.75 Replacement of inverter fan h/unit n.a. n.a. 5.00 n.a. Replacement of module clamp h/unit 0.10 0.10 0.03 0.03 Replacement of string cable + connector h/unit 2.00 2.00 1.00 1.00 Replacement of cable connector h/unit 0.50 0.50 0.25 0.25 Module cleaning h/unit 0.10 0.10 0.01 0.01 Replacement of battery inverter h/unit n.a. 1.00 n.a. n.a. Replacement of battery h/unit n.a. 2.00 n.a. n.a.
Labor costs O&M junior technician EUR/h 40.00 40.00 40.00 40.00 O&M senior technician EUR/h 60.00 60.00 60.00 60.00 OEM engineer/technical expert EUR/h 100.00 100.00 100.00 100.00 Cleaning (including equipment) EUR/h 50.00 n.a. 50.00 n.a.
Travel costs Kilometer flat (€/km) EUR/km 0.50 0.50 0.50 0.50 Single travel distance O&M km 20.00 20.00 100.00 100.00 Single travel distance OEM/Expert km 250.00 250.00 250.00 250.00 Car costs O&M - return trip EUR 20.00 20.00 100.00 100.00 Car costs OEM/expert - return trip EUR 250.00 250.00 250.00 250.00 Travel time O&M - return trip h 0.50 0.50 2.00 2.00 Travel time OEM/expert - return trip h 5.00 5.00 5.00 5.00 Daily meal allowance EUR/day 40.00 40.00 40.00 40.00 Hotel EUR/night n.a. n.a. 80.00 80.00
Transport/set-up costs Transportaion module pallet EUR/pallet 375.00 375.00 300.00 300.00 Transportation module containter EUR/cont. n.a. n.a. 1800.00 1800.00 C-Si modules per container units/cont. 700.00 700.00 700.00 n.a. CdTe modules per container units/cont. n.a. n.a. n.a. 1800.00 Transportation inverter EUR/part 375.00 375.00 960.00 300.00 Transportation inverter fan EUR/part n.a. n.a. 100.00 n.a. Rent crane/forklift truck EUR/day 600.00 600.00 480.00 480.00 GSE registration fee EUR/part n.a. n.a. n.a. 800.00 Safety Scaffold EUR// Ab. 700.00 700.00 n.a. n.a.
1) Exchange rate GBP/EUR = 1.27807 (June 1, 2016)
37Modelling of Technical PV Risks
3.5. Risk Modelling Input Factors Based on the selection of risks and the repair and maintenance cost assumptions a dedicated table with risk modelling input factors has been prepaired for each of the four business models (see Appendix B).
The assumptions for the residential and utility scale PV systems can be summarized as follows in table 7:
Table 7: Assumptions for risk modelling input factors
Business models 1 and 2 refer to residential PV systems without monitoring. The base case describes an attentive owner, a low failure detection time, and only one of two module strings affected by a failure with low severity. The worst case describes a careless owner, a long failure detection time, and both module strings affected by a failure with high severity. For both cases the set-up and repair time are kept as short as possible.
Business models 3 and 4 refer to utility scale ground mounted PV systems. The base case describes a PV system equipped with simple monitoring, only a minor number of modules and inverters affected by a failure with low severity. The worst case describes a PV system without monitoring, a major number of inverters and modules affected by a failure with high severity. For both cases the set-up and repair time vary to a great extent due to different lead times and number of defective components.
In the modelling of performance lossses only was considered for the total duration of failure while was neglected. Usually total downtime costs are more heavily influenced by the time to detect and repair/substite than by the time to fix the failure. In most cases downtime costs during the time to fix are limited to the fraction of affected components.
A risk database containing all input factors for the risk modelling exercise for each business model is provided in Appendix B.

38Modelling of Technical PV Risks
4. Financial Modelling of Technical Risks 4.1. Assessment of Risk Impact In the risk modelling section both single technical risks and combined risk scenarios are analysed with respect of their financial impact on the base case of the underlying business model. The base case reflects the budgeted performance of the PV system under normal operating conditions and regular aging of components, i.e. module degradation or exchange of inverters after approximately 10 years. In the context of risk modelling the term failure is used for risks after their actual occurence.
As explained in section 1.1.2 the profitability of a business model can be assessed with a cash flow model on the basis of the internal rate of return IRR or the cumulative cash flow. Both measures are dependent on the boundary conditions of each business model, which depend on the start date, design, size, geographic, legal, fiscal, and financial framework of the PV system. A higher IRR or a higher cumultative cash flow tend to either reflect a higher risk/return ratio or a better buffer against the impact of risk. In line with financial market conditions and the increasing maturity of the PV market, the profitability of PV business models has decreased in recent years.
Whether a business model is financially viable depends very much on the individual preferences of an investor. Professional investors are often predominantly profitability driven. Purely financial investors tend to focus on maximum profit, whilst strategic investors like utilities might be prepared to compromise profitability against the renewable energy share in their overall energy portfolio. Retail investors show mixed investment motivations; especially residential house owners often pursue environmental and self-reliance motives beyond or besides pure profitability.
Given the above reasons a direct financial comparison of business models tends to be misleading as shown in the figures below, where i.e. business model 1 shows the highest IRR due to favorable feed-in tariff, CAPEX, OPEX and business model shows the highest cumulative cash flow due to the large nominal capacity of the project.
Figure 10: IRR comparison (base case) Figure 11: Cumulative CF comparison (base case)
13,58%
0,20%
5,52%
10,47%
0%
2%
4%
6%
8%
10%
12%
14%
16%
BM 1 BM 2 BM 3 BM 4
14.742 242
5.579.932
3.449.957
0 EUR
1.000.000 EUR
2.000.000 EUR
3.000.000 EUR
4.000.000 EUR
5.000.000 EUR
6.000.000 EUR
BM 1 BM 2 BM 3 BM 4
39Modelling of Technical PV Risks
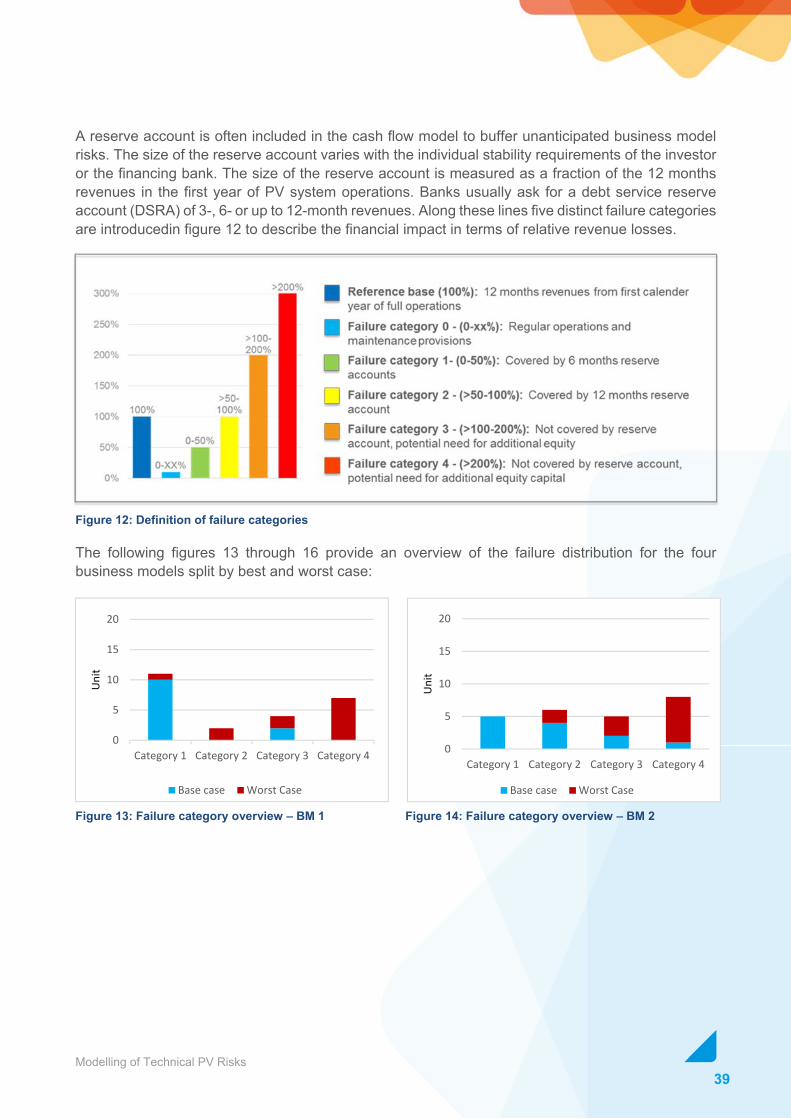
A reserve account is often included in the cash flow model to buffer unanticipated business model risks. The size of the reserve account varies with the individual stability requirements of the investor or the financing bank. The size of the reserve account is measured as a fraction of the 12 months revenues in the first year of PV system operations. Banks usually ask for a debt service reserve account (DSRA) of 3-, 6- or up to 12-month revenues. Along these lines five distinct failure categories are introducedin figure 12 to describe the financial impact in terms of relative revenue losses.
Figure 12: Definition of failure categories
The following figures 13 through 16 provide an overview of the failure distribution for the four business models split by best and worst case:
Figure 13: Failure category overview – BM 1 Figure 14: Failure category overview – BM 2
0
5
10
15
20
Category 1 Category 2 Category 3 Category 4
Unit
Base case Worst Case
0
5
10
15
20
Category 1 Category 2 Category 3 Category 4
Unit
Base case Worst Case

40Modelling of Technical PV Risks
Figure 15: Failure category overview – BM 3 Figure 16: Failure category overview – BM 4
The residential sized business models 1 and 2 are most affected by the impact of technical failures, while the utility sized business models 3 and 4 turn out to be more robust. Business model 2 with 54% of all failures in categories 3 and 4 is the least robust, whereas business model 4 with just 13% of all failures in categories 3 and 4 is least impacted.
Residential PV systems are more vulnerable to failures, due to higher labour and spare parts costs and prolonged downtime costs due to in many cases missing monitoring systems. For utility scale PV systems a failure often affects only a fraction of the total solar electricity production. Online monitoring in combination with a service and maintenance contract lead to reduced downtime costs. With respect to labour costs and spare parts utility scale PV systems often can take advantage of additional economies of scale.
0
5
10
15
20
Category 1 Category 2 Category 3 Category 4
Unit
Base case Worst Case
0
5
10
15
20
Category 1 Category 2 Category 3 Category 4
Unit
Base case Worst Case

41Modelling of Technical PV Risks
4.2. Impact of Technical Risks on Business Model 1 Business model 1 represents a residential roof-top PV system with a nominal capacity of 5,64 kWp located in central Germany. The system consists of a single string inverter and two strings with a total of 24 crystalline silicon modules. The system was commissioned in January 2011. The owner is a private investor interested in financial returns based on the 20 year feed-in tariff scheme.
4.2.1. Modelling of Single Technical Risks Table 8 lists twelve single technical risks, each with a best case and worst case version covered by
the modelling exercise.
Table 8: List of technical risks of BM1
For 10 of the best case failures the economic impact remains in category 1 with only two best case failures fall in category 3. The impact of worst case failures is spread across all failure categories,
Risknumber Name of risk Case
1000 PID = Potential Induced degradation Best1001 PID = Potential Induced degradation Worst1010 Failure of bypass diode and juction box Best1011 Failure of bypass diode and juction box Worst1020 Hotspot of modules Best1021 Hotspot of modules Worst1030 Theft/ vandalism of modules Best1031 Theft/ vandalism of modules Worst1040 Fan failure and overheating Best1041 Fan failure and overheating Worst1050 Lightning strike of inverter Best1051 Lightning strike of inverter Worst1060 Mismatch of module clamps Best1061 Mismatch of module clamps Worst1070 UV aging of string cables Best1071 UV aging of string cables Worst1080 Wrong/Absent cables connection Best1081 Wrong/Absent cables connection Worst1090 Cabling damaged by rodents Best1091 Cabling damaged by rodents Worst1100 Module breakage by hail Best1101 Module breakage by hail Worst1110 Soiling of modules Best1111 Soiling of modules Worst
Table 8: List of technical risks of BM1
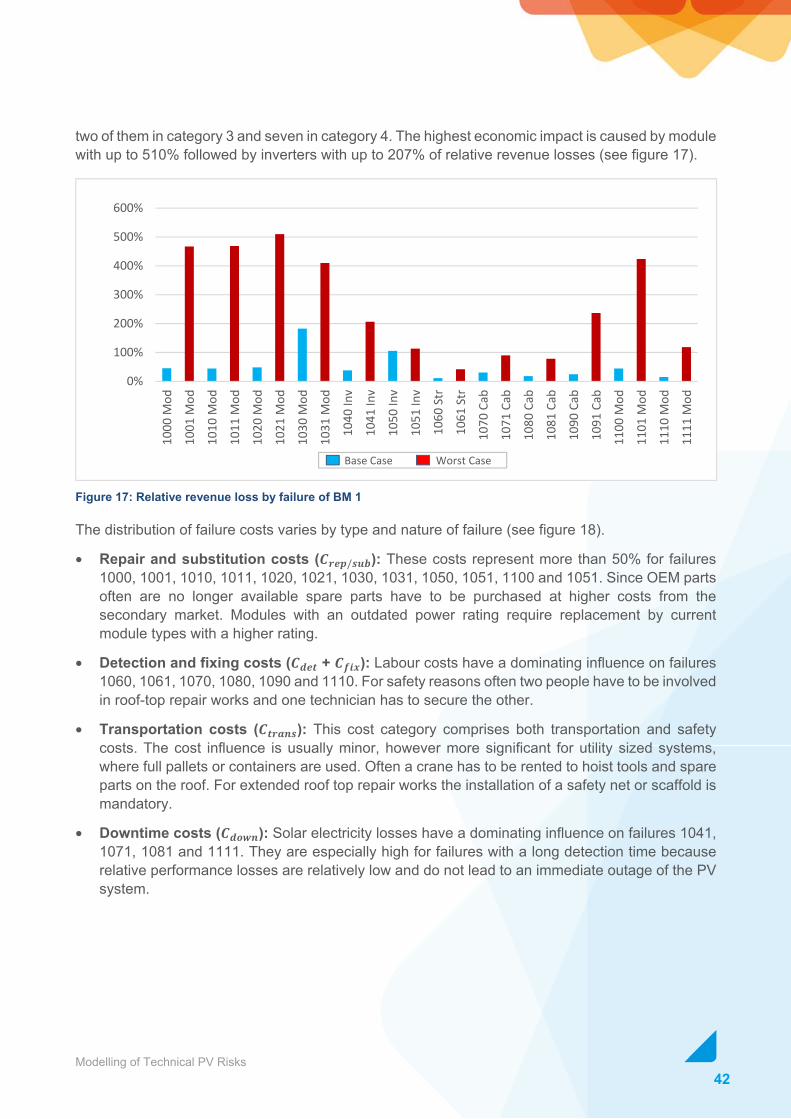
42Modelling of Technical PV Risks
two of them in category 3 and seven in category 4. The highest economic impact is caused by module with up to 510% followed by inverters with up to 207% of relative revenue losses (see figure 17).
Figure 17: Relative revenue loss by failure of BM 1
The distribution of failure costs varies by type and nature of failure (see figure 18).
• Repair and substitution costs ( / ): These costs represent more than 50% for failures 1000, 1001, 1010, 1011, 1020, 1021, 1030, 1031, 1050, 1051, 1100 and 1051. Since OEM parts often are no longer available spare parts have to be purchased at higher costs from the secondary market. Modules with an outdated power rating require replacement by current module types with a higher rating.
• Detection and fixing costs ( + ): Labour costs have a dominating influence on failures 1060, 1061, 1070, 1080, 1090 and 1110. For safety reasons often two people have to be involved in roof-top repair works and one technician has to secure the other.
• Transportation costs ( ): This cost category comprises both transportation and safety costs. The cost influence is usually minor, however more significant for utility sized systems, where full pallets or containers are used. Often a crane has to be rented to hoist tools and spare parts on the roof. For extended roof top repair works the installation of a safety net or scaffold is mandatory.
• Downtime costs ( ): Solar electricity losses have a dominating influence on failures 1041, 1071, 1081 and 1111. They are especially high for failures with a long detection time because relative performance losses are relatively low and do not lead to an immediate outage of the PV system.
0%
100%
200%
300%
400%
500%
600%
1000
Mod
1001
Mod
1010
Mod
1011
Mod
1020
Mod
1021
Mod
1030
Mod
1031
Mod
1040
Inv
1041
Inv
1050
Inv
1051
Inv
1060
Str
1061
Str
1070
Cab
1071
Cab
1080
Cab
1081
Cab
1090
Cab
1091
Cab
1100
Mod
1101
Mod
1110
Mod
1111
Mod
Base Case Worst Case
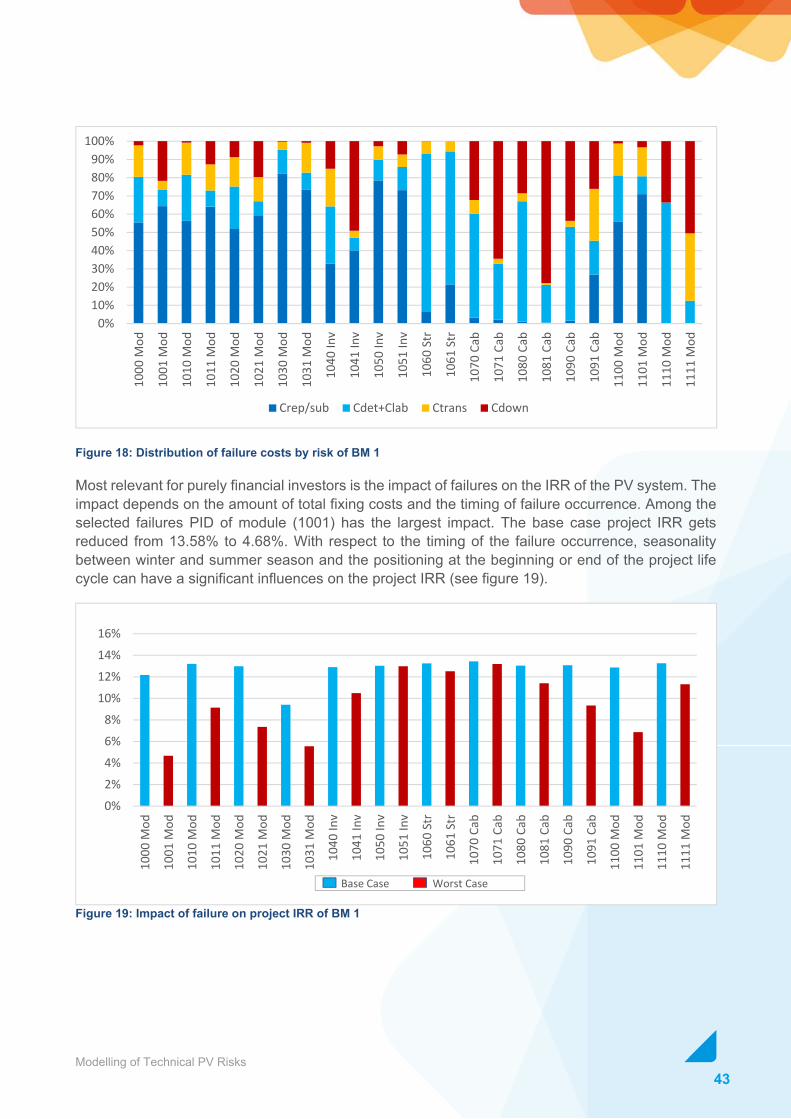
43Modelling of Technical PV Risks
Figure 18: Distribution of failure costs by risk of BM 1
Most relevant for purely financial investors is the impact of failures on the IRR of the PV system. The impact depends on the amount of total fixing costs and the timing of failure occurrence. Among the selected failures PID of module (1001) has the largest impact. The base case project IRR gets reduced from 13.58% to 4.68%. With respect to the timing of the failure occurrence, seasonality between winter and summer season and the positioning at the beginning or end of the project life cycle can have a significant influences on the project IRR (see figure 19).
Figure 19: Impact of failure on project IRR of BM 1
0%2%4%6%8%
10%12%14%16%
1000
Mod
1001
Mod
1010
Mod
1011
Mod
1020
Mod
1021
Mod
1030
Mod
1031
Mod
1040
Inv
1041
Inv
1050
Inv
1051
Inv
1060
Str
1061
Str
1070
Cab
1071
Cab
1080
Cab
1081
Cab
1090
Cab
1091
Cab
1100
Mod
1101
Mod
1110
Mod
1111
Mod
Base Case Worst Case
0%10%20%30%40%50%60%70%80%90%
100%10
00 M
od
1001
Mod
1010
Mod
1011
Mod
1020
Mod
1021
Mod
1030
Mod
1031
Mod
1040
Inv
1041
Inv
1050
Inv
1051
Inv
1060
Str
1061
Str
1070
Cab
1071
Cab
1080
Cab
1081
Cab
1090
Cab
1091
Cab
1100
Mod
1101
Mod
1110
Mod
1111
Mod
Crep/sub Cdet+Clab Ctrans Cdown

44Modelling of Technical PV Risks
4.2.2. Modelling of Technical Risk Scenario In section 3.3 the following four risks were introduced for the risk scenario modelling of business model 1, listed in table 9.
Table 9: Risk scenario of BM 1
Risk Risk number Risk name Start Date Case Phase Risk 1 1061 Mismatch of module clamps 01.01.2011 Worst Infant Risk 2 1111 Failure of bypass diode and junction box 01.03.2021 Worst Mid-life Risk 3 1041 Fan failure and overheating 01.08.2018 Worst Mid-life Risk 4 1100 Module breakage by hail 01.08.2026 Best Wear-out
• 1061 Mismatch of module clamps: The installer has used wrong module clamps not in line with the module installation manual. The failure is detected at the end of the EPC warranty period during an inspection of the PV system. All module clamps have to be replaced. The failure falls in category 1. The total fixing costs are relatively low, with little spare part and labour costs and no solar electricity losses. The owner can try to claim the failure costs from his EPC.
• 1111 Soiling of modules: The PV system is located in a rural area and dust is accumulating over time on the surface of modules. Despite a 30% performance loss the owner only became aware of the failure two years from its start. Cleaning of modules is carried out by a professional cleaning company. During the roof-top work a scaffold is used for safety reasons. The failure falls in category 3. Total fixing costs are dominated by the performance losses. The scaffold adds a considerable cost amount. Failure costs will have to be borne by the owner.
• 1041 Fan failure and overheating: The inverter is installed in a location with poor ventilation leading to frequent overheating and shutdown of the inverter especially during the summer season. In the second summer the failure is detected after a complete breakdown of the inverter fan. The more than seven year old inverter is replaced by a new one and installed in a location with proper ventilation. The failure falls in risk 4. Total fixing costs are dominated by performance losses and spare part costs. The owner can try to claim the failure costs from his EPC.
• 1100 Module breakage by hail: A summer thunderstorm with hail causes a complete destruction of two out of the twenty four modules of the PV system. The failure is detected immediately. The reordering of spare modules from the secondary market takes two weeks. During this time one out of two strings looses twenty percent of its performance. The failure falls in category 1. Total fixing costs are dominated by spare part costs. The owner can claim the failure costs from his insurer.
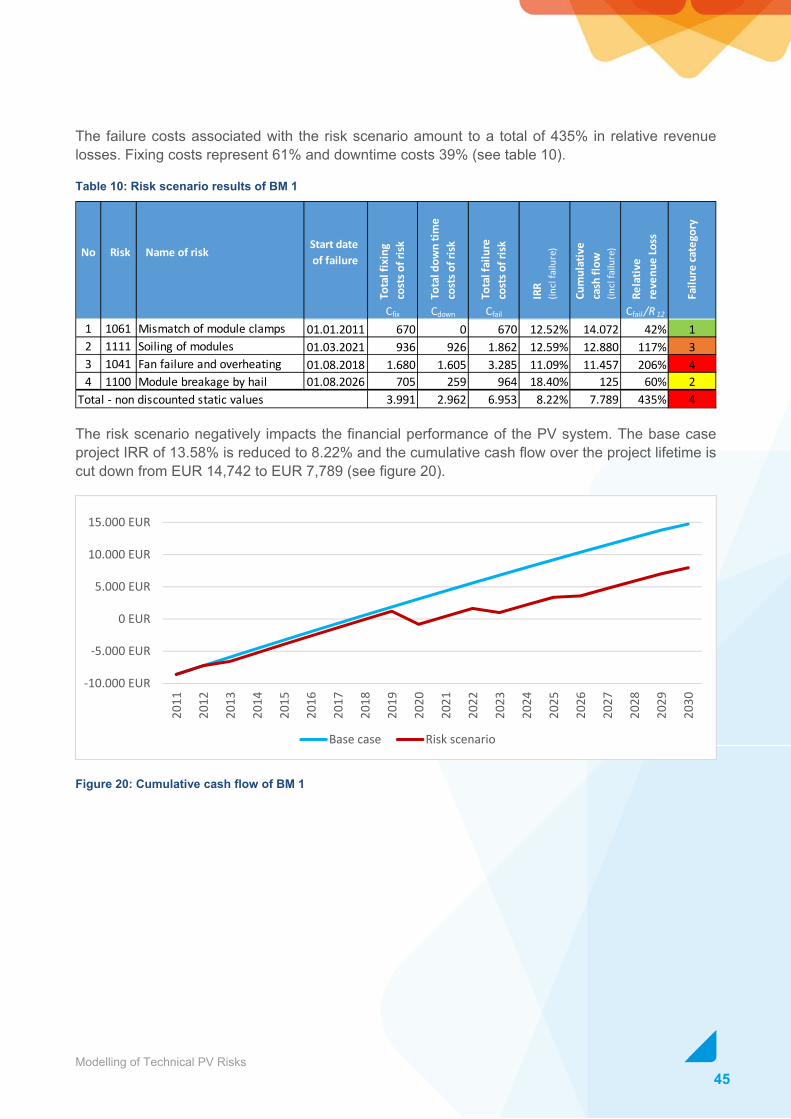
45Modelling of Technical PV Risks
The failure costs associated with the risk scenario amount to a total of 435% in relative revenue losses. Fixing costs represent 61% and downtime costs 39% (see table 10).
Table 10: Risk scenario results of BM 1
The risk scenario negatively impacts the financial performance of the PV system. The base case project IRR of 13.58% is reduced to 8.22% and the cumulative cash flow over the project lifetime is cut down from EUR 14,742 to EUR 7,789 (see figure 20).
Figure 20: Cumulative cash flow of BM 1
No Risk Name of risk Start date of failure
Tota
l fix
ing
cost
s of r
isk
Tota
l dow
n tim
e co
sts o
f risk
Tota
l fai
lure
co
sts o
f risk
IRR
(incl
failu
re)
Cum
ulat
ive
cash
flow
(in
cl fa
ilure
)
Rela
tive
reve
nue
Loss
Failu
re ca
tego
ry
Cfix Cdown Cfail Cfail /R 12
1 1061 Mismatch of module clamps 01.01.2011 670 0 670 12.52% 14.072 42% 12 1111 Soiling of modules 01.03.2021 936 926 1.862 12.59% 12.880 117% 33 1041 Fan failure and overheating 01.08.2018 1.680 1.605 3.285 11.09% 11.457 206% 44 1100 Module breakage by hail 01.08.2026 705 259 964 18.40% 125 60% 2
Total - non discounted static values 3.991 2.962 6.953 8.22% 7.789 435% 4
-10.000 EUR
-5.000 EUR
0 EUR
5.000 EUR
10.000 EUR
15.000 EUR
2011
2012
2013
2014
2015
2016
2017
2018
2019
2020
2021
2022
2023
2024
2025
2026
2027
2028
2029
2030
Base case Risk scenario
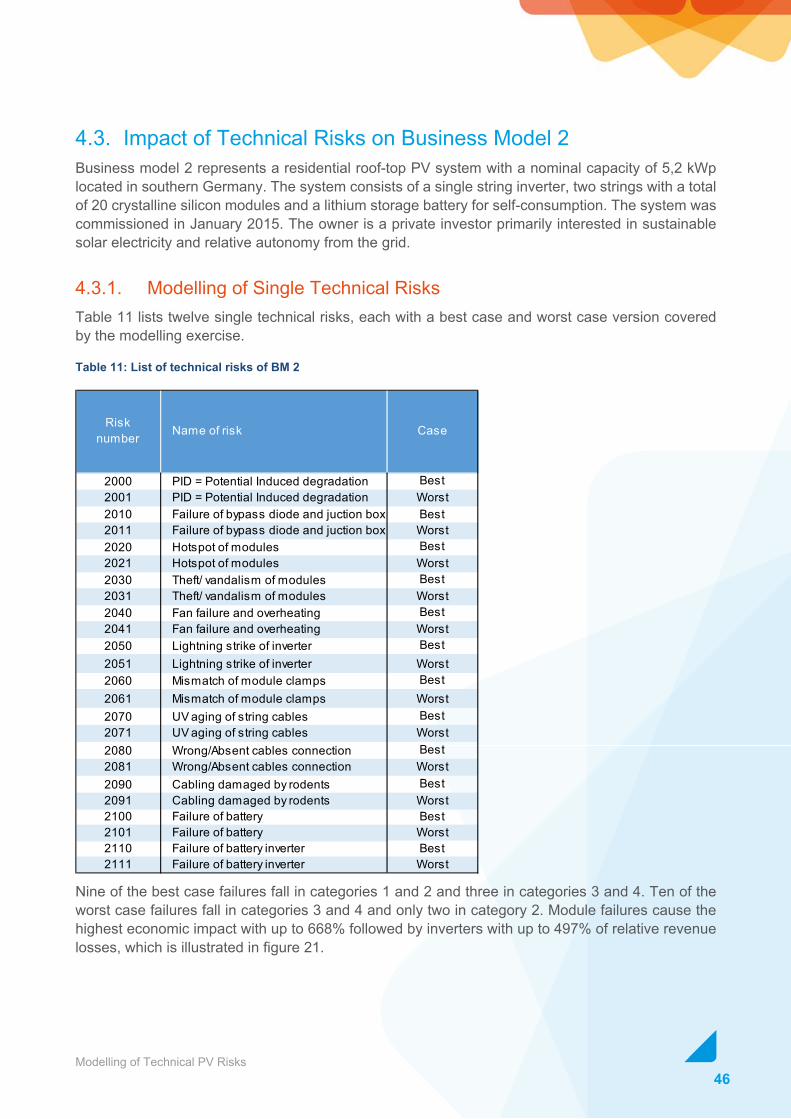
46Modelling of Technical PV Risks
4.3. Impact of Technical Risks on Business Model 2 Business model 2 represents a residential roof-top PV system with a nominal capacity of 5,2 kWp located in southern Germany. The system consists of a single string inverter, two strings with a total of 20 crystalline silicon modules and a lithium storage battery for self-consumption. The system was commissioned in January 2015. The owner is a private investor primarily interested in sustainable solar electricity and relative autonomy from the grid.
4.3.1. Modelling of Single Technical Risks Table 11 lists twelve single technical risks, each with a best case and worst case version covered by the modelling exercise.
Table 11: List of technical risks of BM 2
Nine of the best case failures fall in categories 1 and 2 and three in categories 3 and 4. Ten of the worst case failures fall in categories 3 and 4 and only two in category 2. Module failures cause the highest economic impact with up to 668% followed by inverters with up to 497% of relative revenue losses, which is illustrated in figure 21.
Risknumber Name of risk Case
2000 PID = Potential Induced degradation Best2001 PID = Potential Induced degradation Worst2010 Failure of bypass diode and juction box Best2011 Failure of bypass diode and juction box Worst2020 Hotspot of modules Best2021 Hotspot of modules Worst2030 Theft/ vandalism of modules Best2031 Theft/ vandalism of modules Worst2040 Fan failure and overheating Best2041 Fan failure and overheating Worst2050 Lightning strike of inverter Best2051 Lightning strike of inverter Worst2060 Mismatch of module clamps Best2061 Mismatch of module clamps Worst2070 UV aging of string cables Best2071 UV aging of string cables Worst2080 Wrong/Absent cables connection Best2081 Wrong/Absent cables connection Worst2090 Cabling damaged by rodents Best2091 Cabling damaged by rodents Worst2100 Failure of battery Best2101 Failure of battery Worst2110 Failure of battery inverter Best2111 Failure of battery inverter Worst

47Modelling of Technical PV Risks
Figure 21: Relative revenue loss by failure of BM 2
The distribution of failure costs as shown in figure 22 varies by type and nature of failure.
• Repair and substitution costs ( / ): These costs represent more than 50% for failures 2000, 2001, 2010, 2011, 2020, 2021, 2030, 2031, 2050, 2051, 2100 and 2101. The system design with high quality modules and inverters and storage inverter and battery storage is very capital intense, resulting in high repair and substitution costs for spare parts.
• Detection and fixing costs ( + ): Labour costs have a dominating influence on failures 2060, 2061, 2070, 2071, 2080, 2090 and 2110. For safety reasons often two people have to be involved in roof-top repair works and one technician has to secure the other.
• Transportation costs ( ): This cost category comprises both transportation and safety costs. The cost influence for most failures is minor, however more significant for utility sized systems where full pallets or containers can be used. Often a crane has to be rented to hoist tools and spare parts on the roof. For extended roof-top repair works the installation of a safety net or scaffold is mandatory.
• Downtime costs ( ): Solar electricity losses are significant for failures 2041, 2071 and 2111, reaching up to 44%. They are especially high for failures with a long detection time and failures related to the battery storage system resulting in a loss of self-consumption.
0%
100%
200%
300%
400%
500%
600%
700%20
00 M
od
2001
Mod
2010
Mod
2011
Mod
2020
Mod
2021
Mod
2030
Mod
2031
Mod
2040
Inv
2041
Inv
2050
Inv
2051
Inv
2060
Str
2061
Str
2070
Cab
2071
Cab
2080
Cab
2081
Cab
2090
Cab
2091
Cab
2100
Bat
2101
Bat
2110
B-In
v
2111
B-In
v
Base Case Worst Case

48Modelling of Technical PV Risks
Figure 22: Distribution of failure costs of BM 2
PV systems with battery storage are still almost twice as expensive than pure PV systems. Therefore the base case project IRR of 0.20% for business model 2 is very low. All failures lead to a negative IRR. Among the selected risks a failure of bypass diode and junction box (2011) has the most negative impact and reduces the project IRR to -8.94%. With higher self-consumption rates and rapidly falling battery prices, better IRR are expected for future PV systems with battery storage and self-consumption (see figure 23).
Important Note: In reality most PV systems with battery storage in Germany can take advantage of the KfW “Small Battery Program” which provides a low interest loan and repayment bonus to boost the financial performance. Since the modelling exercise only reflects pure equity funding, the advantages of the KfW program are not reflected in the cash flow analysis and the results of business model 2 cannot be generalized.
Figure 23: Impact of failure on project IRR of BM 2
-9%-8%-7%-6%-5%-4%-3%-2%-1%0%
2000
Mod
2001
Mod
2010
Mod
2011
Mod
2020
Mod
2021
Mod
2030
Mod
2031
Mod
2040
Inv
2041
Inv
2050
Inv
2051
Inv
2060
Str
2061
Str
2070
Cab
2071
Cab
2080
Cab
2081
Cab
2090
Cab
2091
Cab
2100
Bat
2101
Bat
2110
B-In
v
2111
B-In
v
Base Case Worst Case
0%10%20%30%40%50%60%70%80%90%
100%20
00 M
od
2001
Mod
2010
Mod
2011
Mod
2020
Mod
2021
Mod
2030
Mod
2031
Mod
2040
Inv
2041
Inv
2050
Inv
2051
Inv
2060
Str
2061
Str
2070
Cab
2071
Cab
2080
Cab
2081
Cab
2090
Cab
2091
Cab
2100
Bat
2101
Bat
2110
B-In
v
2111
B-In
v
Crep/sub Cdet+Clab Ctrans Cdown
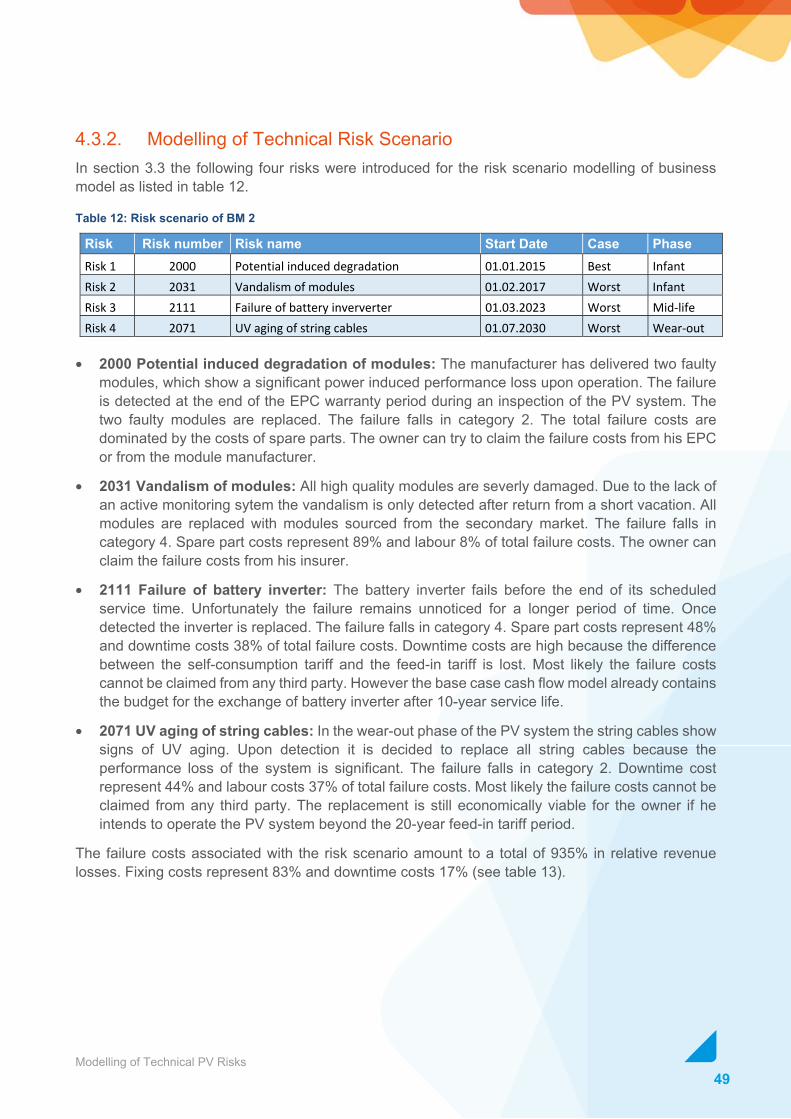
49Modelling of Technical PV Risks
4.3.2. Modelling of Technical Risk Scenario In section 3.3 the following four risks were introduced for the risk scenario modelling of business model as listed in table 12.
Table 12: Risk scenario of BM 2
Risk Risk number Risk name Start Date Case Phase Risk 1 2000 Potential induced degradation 01.01.2015 Best Infant Risk 2 2031 Vandalism of modules 01.02.2017 Worst Infant Risk 3 2111 Failure of battery inververter 01.03.2023 Worst Mid-life Risk 4 2071 UV aging of string cables 01.07.2030 Worst Wear-out
• 2000 Potential induced degradation of modules: The manufacturer has delivered two faulty modules, which show a significant power induced performance loss upon operation. The failure is detected at the end of the EPC warranty period during an inspection of the PV system. The two faulty modules are replaced. The failure falls in category 2. The total failure costs are dominated by the costs of spare parts. The owner can try to claim the failure costs from his EPC or from the module manufacturer.
• 2031 Vandalism of modules: All high quality modules are severly damaged. Due to the lack of an active monitoring sytem the vandalism is only detected after return from a short vacation. All modules are replaced with modules sourced from the secondary market. The failure falls in category 4. Spare part costs represent 89% and labour 8% of total failure costs. The owner can claim the failure costs from his insurer.
• 2111 Failure of battery inverter: The battery inverter fails before the end of its scheduled service time. Unfortunately the failure remains unnoticed for a longer period of time. Once detected the inverter is replaced. The failure falls in category 4. Spare part costs represent 48% and downtime costs 38% of total failure costs. Downtime costs are high because the difference between the self-consumption tariff and the feed-in tariff is lost. Most likely the failure costs cannot be claimed from any third party. However the base case cash flow model already contains the budget for the exchange of battery inverter after 10-year service life.
• 2071 UV aging of string cables: In the wear-out phase of the PV system the string cables show signs of UV aging. Upon detection it is decided to replace all string cables because the performance loss of the system is significant. The failure falls in category 2. Downtime cost represent 44% and labour costs 37% of total failure costs. Most likely the failure costs cannot be claimed from any third party. The replacement is still economically viable for the owner if he intends to operate the PV system beyond the 20-year feed-in tariff period.
The failure costs associated with the risk scenario amount to a total of 935% in relative revenue losses. Fixing costs represent 83% and downtime costs 17% (see table 13).

50Modelling of Technical PV Risks
The financial performance for the unleveraged base case of the PV system is very low. The base case project IRR of 0.20% is reduced to -7.65% and the cumulative cash flow over the project lifetime is cut down from EUR 242 to EUR 10,282. (see figure 24).
Figure 24: Cumulative cash flow of BM 2
No Risk Name of risk Start date of failure
Tota
l fix
ing
cost
s of r
isk
Tota
l dow
n tim
e co
sts o
f risk
Tota
l fai
lure
co
sts o
f risk
IRR
(incl
failu
re)
Cum
ulat
ive
cash
flow
(in
cl fa
ilure
)
Rela
tive
reve
nue
Loss
Failu
re ca
tego
ry
Cfix Cdown Cfail Cfail /R 12
1 2000 Potential ind. degradation 01.01.2015 825 8 833 -0,47% -596 74% 22 2031 Theft of modules 01.02.2017 5.865 26 5.891 -3.78% -5.670 523% 43 2071 UV aging of string cables 01.07.2030 484 375 859 -0.81% -893 76% 24 2111 Failure of battery inververter 01.07.2023 1.545 937 2.482 -1.77% -2.240 220% 4
Total - non discounted static values 8.719 1.805 10.524 -7.65% -10.282 935% 4
-19.000 EUR-17.000 EUR-15.000 EUR-13.000 EUR-11.000 EUR
-9.000 EUR-7.000 EUR-5.000 EUR-3.000 EUR-1.000 EUR
2015
2016
2017
2018
2019
2020
2021
2022
2023
2024
2025
2026
2027
2028
2029
2030
2031
2032
2033
2034
Base case Risk scenario
Table 13: Rist scenario results of BM 2
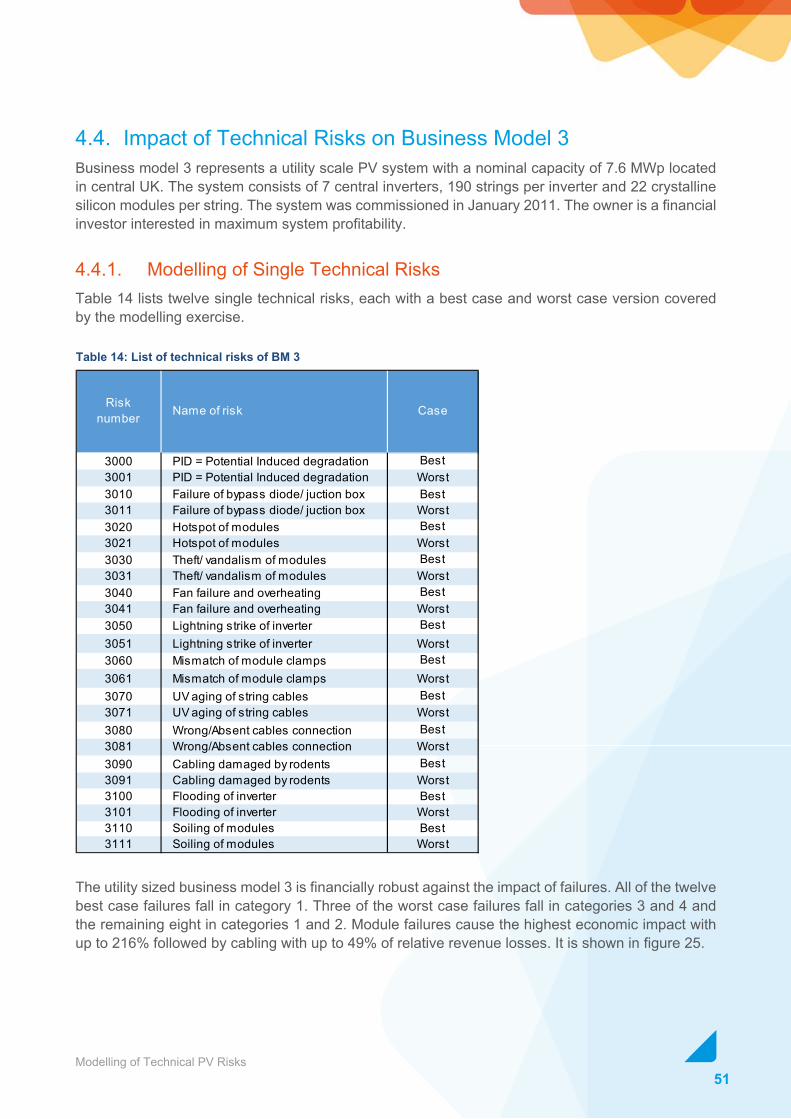
51Modelling of Technical PV Risks
4.4. Impact of Technical Risks on Business Model 3 Business model 3 represents a utility scale PV system with a nominal capacity of 7.6 MWp located in central UK. The system consists of 7 central inverters, 190 strings per inverter and 22 crystalline silicon modules per string. The system was commissioned in January 2011. The owner is a financial investor interested in maximum system profitability.
4.4.1. Modelling of Single Technical Risks Table 14 lists twelve single technical risks, each with a best case and worst case version covered by the modelling exercise.
The utility sized business model 3 is financially robust against the impact of failures. All of the twelve best case failures fall in category 1. Three of the worst case failures fall in categories 3 and 4 and the remaining eight in categories 1 and 2. Module failures cause the highest economic impact with up to 216% followed by cabling with up to 49% of relative revenue losses. It is shown in figure 25.
Risknumber Name of risk Case
3000 PID = Potential Induced degradation Best3001 PID = Potential Induced degradation Worst3010 Failure of bypass diode/ juction box Best3011 Failure of bypass diode/ juction box Worst3020 Hotspot of modules Best3021 Hotspot of modules Worst3030 Theft/ vandalism of modules Best3031 Theft/ vandalism of modules Worst3040 Fan failure and overheating Best3041 Fan failure and overheating Worst3050 Lightning strike of inverter Best3051 Lightning strike of inverter Worst3060 Mismatch of module clamps Best3061 Mismatch of module clamps Worst3070 UV aging of string cables Best3071 UV aging of string cables Worst3080 Wrong/Absent cables connection Best3081 Wrong/Absent cables connection Worst3090 Cabling damaged by rodents Best3091 Cabling damaged by rodents Worst3100 Flooding of inverter Best3101 Flooding of inverter Worst3110 Soiling of modules Best3111 Soiling of modules Worst
Table 14: List of technical risks of BM 3

52Modelling of Technical PV Risks
Figure 25: Relative revenue loss by failure of BM 3
The distribution of failure costs varies by type and nature of failure (see figure 26).
• Repair and substitution costs ( / ): These costs represent more than 50% for failures 3000, 3001, 3010, 3011, 3020, 3021, 3030, 3031, 3050, 3051, 3060, 3061, 3090, 3100 and 3101. In general spare part costs for a utility scale business model tend to be lower than for a residential system.
• Detection and fixing costs ( + ): Labour costs have a large influence on failures 3060, 3061, 3070 and 3080. Ground-mounted systems are more accessible and faster to repair than roof-top PV systems.
• Transportation costs ( ): The share of transportation costs are almost negligible for utility scale business models. For worst case failures often a forklift truck has to be rented to handle defective components and spare parts on site.
• Downtime costs ( ): Solar electricity losses are dominant for failures 3041, 3071, 3081, 3091, 3110 and 3111, reaching up to 98% in relative revenue losses. The system design is made out of rather large increments with seven central inverters and 22 modules per string. A failure of one component can therefore have an overproportional influence on the downtime costs, especially if the failure is not directly detected upon occurence.
0%
50%
100%
150%
200%
250%30
00 M
od
3001
Mod
3010
Mod
3011
Mod
3020
Mod
3021
Mod
3030
Mod
3031
Mod
3040
Inv
3041
Inv
3050
Inv
3051
Inv
3060
Str
3061
Str
3070
Cab
3071
Cab
3080
Cab
3081
Cab
3090
Cab
3091
Cab
3100
Inv
3101
Inv
3110
Mod
3111
Mod
Base Case Worst Case

53Modelling of Technical PV Risks
Figure 26: Distribution of failure costs of BM 3
Business model 3 offers a base case project IRR of 5.52%. Most failures belong to a rather low category with limited influence on the financial performance. The highest impact is caused by the worst case of power induced degradation of modules, which reduces the project IRR to 2.68% (see figure 27).
Figure 27: Impact of failure on project IRR of BM 3
0%10%20%30%40%50%60%70%80%90%
100%30
00 M
od
3001
Mod
3010
Mod
3011
Mod
3020
Mod
3021
Mod
3030
Mod
3031
Mod
3040
Inv
3041
Inv
3050
Inv
3051
Inv
3060
Str
3061
Str
3070
Cab
3071
Cab
3080
Cab
3081
Cab
3090
Cab
3091
Cab
3100
Inv
3101
Inv
3110
Mod
3111
Mod
Crep/sub Cdet+Clab Ctrans Cdown
0%
1%
2%
3%
4%
5%
6%
3000
Mod
3001
Mod
3010
Mod
3011
Mod
3020
Mod
3021
Mod
3030
Mod
3031
Mod
3040
Inv
3041
Inv
3050
Inv
3051
Inv
3060
Str
3061
Str
3070
Cab
3071
Cab
3080
Cab
3081
Cab
3090
Cab
3091
Cab
3100
Inv
3101
Inv
3110
Mod
3111
Mod
Base Case Worst Case

54Modelling of Technical PV Risks
4.4.2. Modelling of Technical Risk Scenario In section 3.3 the following four risks were introduced for the risk scenario modelling of business model 3 as listed in table 15:
Table 15: Risk scenario of BM 3
Risk Risk number Risk name Start Date Case Phase Risk 1 3020 Hotspot of modules 01.01.2012 Best Infant Risk 2 3101 Flooding of inverter 01.08.2017 Worst Mid-life Risk 3 3051 Lightning strike of inverter 01.06.2020 Worst Mid-life Risk 4 3011 Failure of bypass diode and junction box 01.10.2026 Worst Wear-out
• 3020 Hotspot of modules: During first year inspection thermography pictures revealed 5% of modules with a hotspot defect. The faulty modules are replaced. The failure falls in category 1. The total failure costs are dominated by the costs of spare parts. The owner can try to claim the failure costs from his EPC or from the module manufacturer.
• 3101 Flooding of inverters: During a heavy rain three out of the seven central inverters are flooded and need to be replaced. The failure falls in category 1. Spare parts costs represent 61% and downtime losses 35% of total failure costs. Downtime costs are negatively impacted by longer lead times for central than for string inverters. The insurer will check proper flooding zone protection before settling a potential claim.
• 3051 Lightning strike of inverter: Three central inverters get hit by an intense lightning strike during a thunderstrom. The failure falls in category 1. Spare part costs represent 61% and downtime losses 35% of total failure costs. The owner can claim the failure costs from the insurer.
• 3011 Failure of bypass diode and junction box: In the wear-out phase of the PV system the humidity is noticed in 30% of the junction boxes, due to a defect of the silicon sealant. All affected modules are replaced. The failure falls in category 3. Spare part costs represent 75% and downtime costs 18% of total failure costs. After more than 15 years of module service life claiming of failure costs from a third party is unlikely.
The failure costs associated with the risk scenario amount to a total of 268% in relative revenue losses. Fixing costs represent 82% and downtime costs 18% (see table 16).
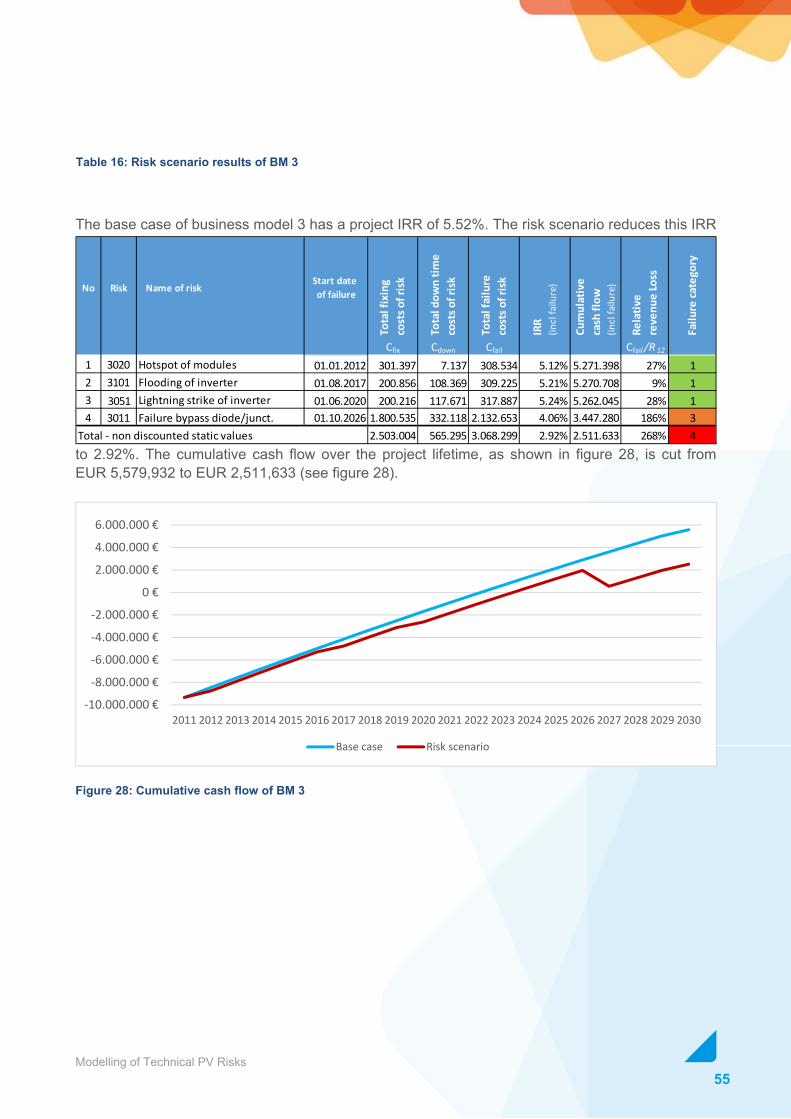
55Modelling of Technical PV Risks
The base case of business model 3 has a project IRR of 5.52%. The risk scenario reduces this IRR
to 2.92%. The cumulative cash flow over the project lifetime, as shown in figure 28, is cut from EUR 5,579,932 to EUR 2,511,633 (see figure 28).
Figure 28: Cumulative cash flow of BM 3
No Risk Name of riskStart date of failure
Tota
l fix
ing
cost
s of r
isk
Tota
l dow
n tim
e co
sts o
f risk
Tota
l fai
lure
co
sts o
f risk
IRR
(incl
failu
re)
Cum
ulat
ive
cash
flow
(in
cl fa
ilure
)
Rela
tive
reve
nue
Loss
Failu
re ca
tego
ry
Cfix Cdown Cfail Cfail /R 12
1 3020 Hotspot of modules 01.01.2012 301.397 7.137 308.534 5.12% 5.271.398 27% 12 3101 Flooding of inverter 01.08.2017 200.856 108.369 309.225 5.21% 5.270.708 9% 13 3051 Lightning strike of inverter 01.06.2020 200.216 117.671 317.887 5.24% 5.262.045 28% 14 3011 Failure bypass diode/junct. 01.10.2026 1.800.535 332.118 2.132.653 4.06% 3.447.280 186% 3
Total - non discounted static values 2.503.004 565.295 3.068.299 2.92% 2.511.633 268% 4
-10.000.000 €
-8.000.000 €
-6.000.000 €
-4.000.000 €
-2.000.000 €
0 €
2.000.000 €
4.000.000 €
6.000.000 €
2011 2012 2013 2014 2015 2016 2017 2018 2019 2020 2021 2022 2023 2024 2025 2026 2027 2028 2029 2030
Base case Risk scenario
Table 16: Risk scenario results of BM 3

56Modelling of Technical PV Risks
4.5. Impact of Technical Risks on Business Model 4 Business model 4 is a utility scale ground mounted PV system with a nominal capacity of 662.6 kWp located in northern Italy. The system is made of 75 string inverters with 12 strings per inverter and 10 CdTe thin-film modules per string. The system was commissioned in July 2010. The owner Is a strategic investor interested in financial returns and increase of his renewable electricity share.
4.5.1. Modelling of Single Technical Risks Table 17 lists twelve single technical risks, each with a best case and worst case version covered by the modelling exercise.
All ten best case failures fall in category 1. The worst case failures are spread across several categories, seven in category 1, two in category 2 and one in category 3. The highest economic impact is caused by modules with up to 120% of relative revenue losses, which can be seen in figure 29.
Risknumber Name of risk Case
4000 Low power/TCO corrosion of modules Best4001 Low power/TCO corrosion of modules Worst4010 Failure of bypass diode and juction box Best4011 Failure of bypass diode and juction box Worst4020 n.a. Best4021 n.a. Worst4030 Theft/ vandalism of modules Best4031 Theft/ vandalism of modules Worst4040 Fan failure and overheating Best4041 Fan failure and overheating Worst4050 Lightning strike of inverter Best4051 Lightning strike of inverter Worst4060 Mismatch of module clamps Best4061 Mismatch of module clamps Worst4070 UV aging of string cables Best4071 UV aging of string cables Worst4080 Wrong/Absent cables connection Best4081 Wrong/Absent cables connection Worst4090 Cabling damaged by rodents Best4091 Cabling damaged by rodents Worst4100 Glass breakage of module, frameless Best4101 Glass breakage of module, frameless Worst
Table 17: List of technical risks of BM 4
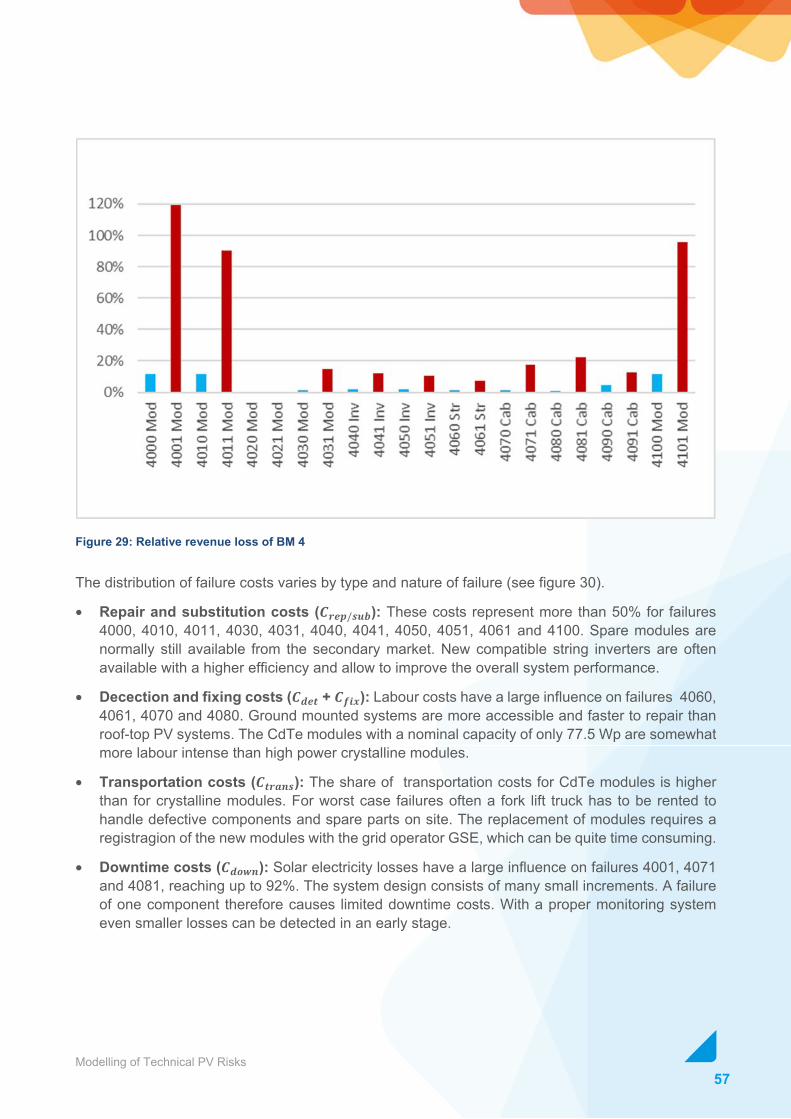
57Modelling of Technical PV Risks
Figure 29: Relative revenue loss of BM 4
The distribution of failure costs varies by type and nature of failure (see figure 30).
• Repair and substitution costs ( / ): These costs represent more than 50% for failures 4000, 4010, 4011, 4030, 4031, 4040, 4041, 4050, 4051, 4061 and 4100. Spare modules are normally still available from the secondary market. New compatible string inverters are often available with a higher efficiency and allow to improve the overall system performance.
• Decection and fixing costs ( + ): Labour costs have a large influence on failures 4060, 4061, 4070 and 4080. Ground mounted systems are more accessible and faster to repair than roof-top PV systems. The CdTe modules with a nominal capacity of only 77.5 Wp are somewhat more labour intense than high power crystalline modules.
• Transportation costs ( ): The share of transportation costs for CdTe modules is higher than for crystalline modules. For worst case failures often a fork lift truck has to be rented to handle defective components and spare parts on site. The replacement of modules requires a registragion of the new modules with the grid operator GSE, which can be quite time consuming.
• Downtime costs ( ): Solar electricity losses have a large influence on failures 4001, 4071 and 4081, reaching up to 92%. The system design consists of many small increments. A failure of one component therefore causes limited downtime costs. With a proper monitoring system even smaller losses can be detected in an early stage.
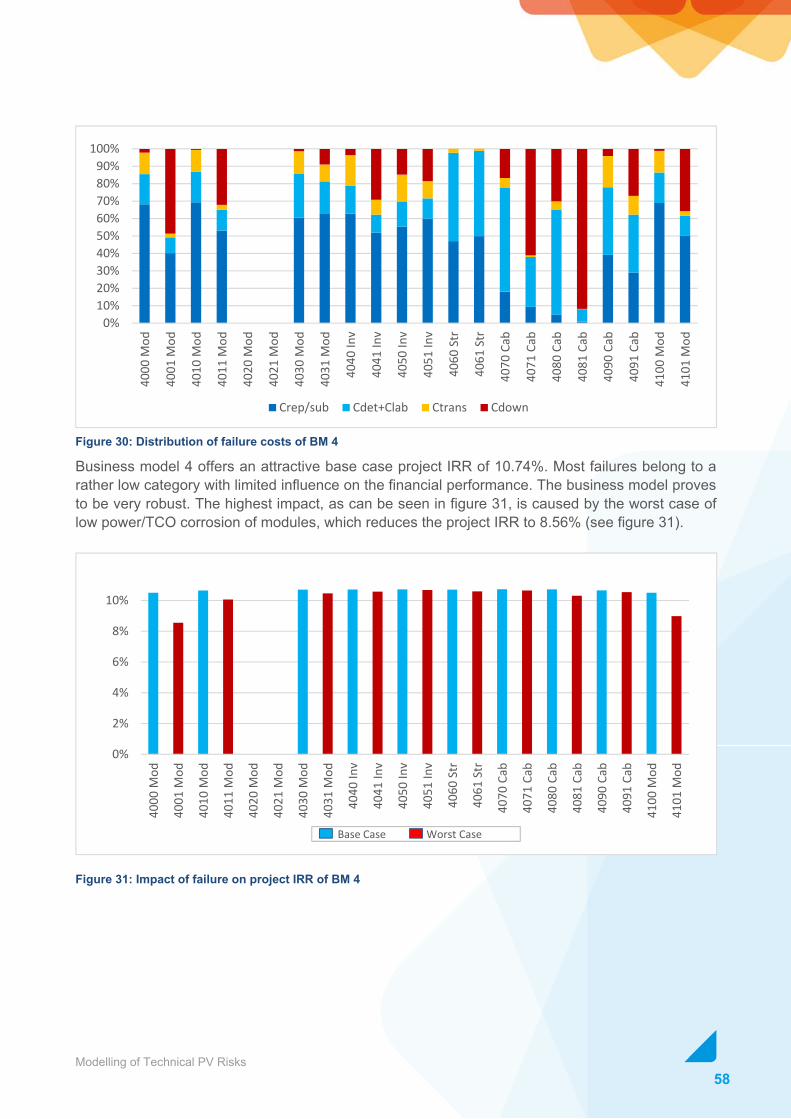
58Modelling of Technical PV Risks
Figure 30: Distribution of failure costs of BM 4
Business model 4 offers an attractive base case project IRR of 10.74%. Most failures belong to a rather low category with limited influence on the financial performance. The business model proves to be very robust. The highest impact, as can be seen in figure 31, is caused by the worst case of low power/TCO corrosion of modules, which reduces the project IRR to 8.56% (see figure 31).
Figure 31: Impact of failure on project IRR of BM 4
0%10%20%30%40%50%60%70%80%90%
100%40
00 M
od
4001
Mod
4010
Mod
4011
Mod
4020
Mod
4021
Mod
4030
Mod
4031
Mod
4040
Inv
4041
Inv
4050
Inv
4051
Inv
4060
Str
4061
Str
4070
Cab
4071
Cab
4080
Cab
4081
Cab
4090
Cab
4091
Cab
4100
Mod
4101
Mod
Crep/sub Cdet+Clab Ctrans Cdown
0%
2%
4%
6%
8%
10%
4000
Mod
4001
Mod
4010
Mod
4011
Mod
4020
Mod
4021
Mod
4030
Mod
4031
Mod
4040
Inv
4041
Inv
4050
Inv
4051
Inv
4060
Str
4061
Str
4070
Cab
4071
Cab
4080
Cab
4081
Cab
4090
Cab
4091
Cab
4100
Mod
4101
Mod
Base Case Worst Case
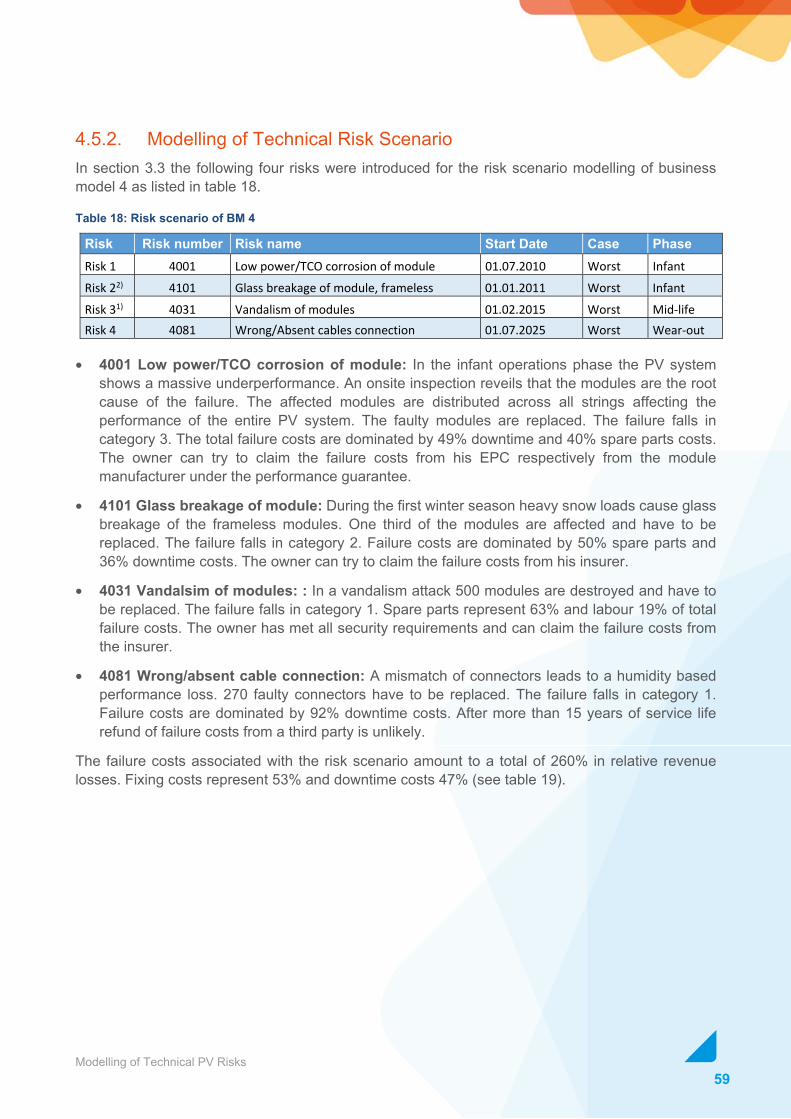
59Modelling of Technical PV Risks
4.5.2. Modelling of Technical Risk Scenario In section 3.3 the following four risks were introduced for the risk scenario modelling of business model 4 as listed in table 18.
Table 18: Risk scenario of BM 4
Risk Risk number Risk name Start Date Case Phase Risk 1 4001 Low power/TCO corrosion of module 01.07.2010 Worst Infant Risk 22) 4101 Glass breakage of module, frameless 01.01.2011 Worst Infant Risk 31) 4031 Vandalism of modules 01.02.2015 Worst Mid-life Risk 4 4081 Wrong/Absent cables connection 01.07.2025 Worst Wear-out
• 4001 Low power/TCO corrosion of module: In the infant operations phase the PV system shows a massive underperformance. An onsite inspection reveils that the modules are the root cause of the failure. The affected modules are distributed across all strings affecting the performance of the entire PV system. The faulty modules are replaced. The failure falls in category 3. The total failure costs are dominated by 49% downtime and 40% spare parts costs. The owner can try to claim the failure costs from his EPC respectively from the module manufacturer under the performance guarantee.
• 4101 Glass breakage of module: During the first winter season heavy snow loads cause glass breakage of the frameless modules. One third of the modules are affected and have to be replaced. The failure falls in category 2. Failure costs are dominated by 50% spare parts and 36% downtime costs. The owner can try to claim the failure costs from his insurer.
• 4031 Vandalsim of modules: : In a vandalism attack 500 modules are destroyed and have to be replaced. The failure falls in category 1. Spare parts represent 63% and labour 19% of total failure costs. The owner has met all security requirements and can claim the failure costs from the insurer.
• 4081 Wrong/absent cable connection: A mismatch of connectors leads to a humidity based performance loss. 270 faulty connectors have to be replaced. The failure falls in category 1. Failure costs are dominated by 92% downtime costs. After more than 15 years of service life refund of failure costs from a third party is unlikely.
The failure costs associated with the risk scenario amount to a total of 260% in relative revenue losses. Fixing costs represent 53% and downtime costs 47% (see table 19).
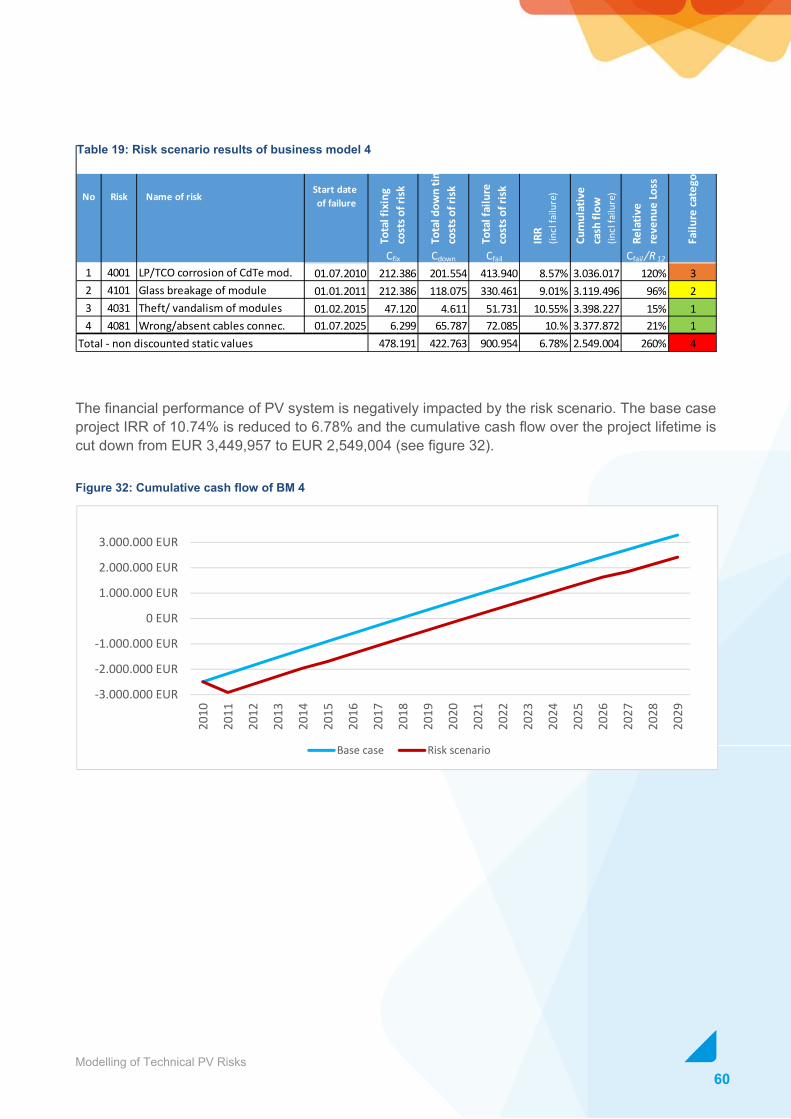
60Modelling of Technical PV Risks
The financial performance of PV system is negatively impacted by the risk scenario. The base case project IRR of 10.74% is reduced to 6.78% and the cumulative cash flow over the project lifetime is cut down from EUR 3,449,957 to EUR 2,549,004 (see figure 32).
Figure 32: Cumulative cash flow of BM 4
-3.000.000 EUR
-2.000.000 EUR
-1.000.000 EUR
0 EUR
1.000.000 EUR
2.000.000 EUR
3.000.000 EUR
2010
2011
2012
2013
2014
2015
2016
2017
2018
2019
2020
2021
2022
2023
2024
2025
2026
2027
2028
2029
Base case Risk scenario
No Risk Name of riskStart date of failure
Tota
l fix
ing
cost
s of r
isk
Tota
l dow
n tim
e co
sts o
f risk
Tota
l fai
lure
co
sts o
f risk
IRR
(incl
failu
re)
Cum
ulat
ive
cash
flow
(in
cl fa
ilure
)
Rela
tive
reve
nue
Loss
Failu
re ca
tego
ry
Cfix Cdown Cfail Cfail /R 12
1 4001 LP/TCO corrosion of CdTe mod. 01.07.2010 212.386 201.554 413.940 8.57% 3.036.017 120% 32 4101 Glass breakage of module 01.01.2011 212.386 118.075 330.461 9.01% 3.119.496 96% 23 4031 Theft/ vandalism of modules 01.02.2015 47.120 4.611 51.731 10.55% 3.398.227 15% 14 4081 Wrong/absent cables connec. 01.07.2025 6.299 65.787 72.085 10.% 3.377.872 21% 1
Total - non discounted static values 478.191 422.763 900.954 6.78% 2.549.004 260% 4
Table 19: Risk scenario results of business model 4

61Modelling of Technical PV Risks
4.6. Risk Mitigation measures The Solar Bankability report “Minimizing Technical Riks in Photovoltaik Projects” introduces a detailed description of all suitable risk mitigation measures [11] (see table 20). In a scenario analysis the reduction of total failure costs is described for different combinations of mitigation measures.
Table 20: List of most significant risk mitigation measures
Mitigation Measure Affected Parameter
Component testing – PV modules number of failures
Design review + construction monitoring number of failures
Qualification of EPC number of failures
Advanced monitoring system time to detection
Basic monitoring system time to detection
Advanced inspection time to detection
Visual inspection time to detection
Spare part management time to repair/substitution
• Component testing of important plant components such as PV modules or inverters. The testing can be carried out at the the production site, at a certified test laboratory or on-site at the PV plant.
• Design review and construction monitoring serves to identify issues caused by bad PV plant conception and poor installation workmanship.
• Qualification of EPC focuses on ensuring the competencies of the field workers, e.g., by requiring certain technical qualification prerequisites or regular training of field workers
• Advanced monitoring system serves for early detection and diagnosis of faults
• Basic monitoring system is used to monitor plant level alarms and notifications
• Advanced inspection to detect defects not usually visible with naked eyes, e.g., infrared or electroluminiscence camera
• Visual inspection to identify any visible changes in PV plant components
• Spare part management to minimize downtime and repair/substituion costs
The Solar Bankability report “Best Practice Guideline for PV Cost Calculation” introduces the concept of risk categorisation flash cards and further provides a sensitivity analysis on the impact of mitigation measures on CAPEX, OPEX and yield [12].
The general classification method for the impact of mitigation measures provided in the Solar Bankability report “Minimizing Technical Riks in Photovoltaik Projects” has been transferred to the risks of the four business models under consideration.

62Modelling of Technical PV Risks
The above table 21 describes the impact of theoretical risk mitigation measures. Under real terms the investor has to make an individual cost benefit analysis and define what budget they are prepared to invest in risk mititagion measures and how much of their base case profitability they are willing to “sacrifice” for the improved quality of the PV system and the enhanced stability of the cash flow model.
Risk Name of risk Com
pone
nt te
stin
g
Desi
gn re
view
+
cons
truct
ion
mon
itorin
g
Qua
lific
atio
n of
EPC
Adva
nced
mon
itorin
g sy
stem
Basi
c m
onito
ring
syst
em
Adva
nced
insp
ectio
n
Visu
al in
spec
tion
Spar
e pa
rt m
anag
emen
t
xx00 PID = Potential Induced degradation High - - - - Medium - Highxx01 PID = Potential Induced degradation High - - - - Medium - Highxx10 Failure of bypass diode and juction box High - - High Medium Medium Medium Highxx11 Failure of bypass diode and juction box High - - High Medium Medium Medium Highxx20 Hotspot of modules High - - - - Medium - Highxx21 Hotspot of modules High - - - - Medium - Highxx30 Theft/ vandalism of modules - - - High High Medium Medium Highxx31 Theft/ vandalism of modules - - - High High Medium Medium Highxx40 Fan failure and overheating - Medium Medium High Medium Medium Medium Highxx41 Fan failure and overheating - Medium Medium High Medium Medium Medium Highxx50 Lightning strike of inverter - - - High Medium Medium Medium Highxx51 Lightning strike of inverter - - - High Medium Medium Medium Highxx60 Mismatch of module clamps - High Medium - - Medium Medium -xx61 Mismatch of module clamps - High Medium - - Medium Medium -xx70 UV aging of string cables - High Medium - - Medium Medium Lowxx71 UV aging of string cables - High Medium - - Medium Medium Lowxx80 Wrong/Absent cables connection - HIgh Medium High Medium Medium Medium Lowxx81 Wrong/Absent cables connection - HIgh Medium High Medium Medium Medium Lowxx90 Cabling damaged by rodents - - - High Medium Medium Medium Lowxx91 Cabling damaged by rodents - - - High Medium Medium Medium Low1100 Module breakage by hail - - - High Medium Medium Medium High1101 Module breakage by hail - - - High Medium Medium Medium High1110 Soiling of modules - - - High Medium Medium Medium -1111 Soiling of modules - - - High Medium Medium Medium -2100 Failure of battery - - - High Medium Medium Medium High2101 Failure of battery - - - High Medium Medium Medium High2110 Failure of battery inververter - - - High Medium Medium Medium High2111 Failure of battery inververter - - - High Medium Medium Medium High3100 Flooding of inverter - High Medium High Medium Medium Medium High3101 Flooding of inverter - High Medium High Medium Medium Medium High3110 Soiling of modules - - - High Medium Medium Medium -3111 Soiling of modules - - - High Medium Medium Medium -4100 Glass breakage of module, frameless - - - High Medium Medium Medium High4111 Glass breakage of module, frameless - - - High Medium Medium Medium High
Table 21: Impact list of mitigation measures applied to single technical risks

63Modelling of Technical PV Risks
For the business models 1 to 4 the following risk mitigation measures are being covered by the base case of the cash flow model (table 22):
Table 22: Risk mitigation measures covered by base case cash flow model
Bus
ines
s
Mod
ell
Com
pone
nt
test
ing
Des
ign
revi
ew
+ co
nstr
uctio
n m
onito
ring
Qua
lific
atio
n of
EP
C
Adv
ance
d m
onito
ring
syst
em
Bas
ic
mon
itorin
g sy
stem
Adv
ance
d in
spec
tion
Visu
al
insp
ectio
n
Spar
e pa
rt
man
agem
ent
BM 1 covered covered covered - covered - covered - BM 2 - - - - covered - covered - BM 3 covered covered covered covered - covered covered - BM 4 covered covered covered covered - covered covered partially
Business model 1: The owner works for an EPC therefore he can take advantage of a couple of mitigation measures free of charge. He implements the basic monitoring and visual inspection himself at no extra cost. Besides an IRR of 13.58% the business model shows a good level of risk protection.
Business model 2: The owner is a private house owner without own technical knowledge. He has to rely on the component testing, design and installation qualification of his EPC. He implements the basic monitoring through a webportal and carries out regular visual inspections himself. The business model shows both a low IRR of 0.20% and a low level of risk protection
Business model 3: The owner is a financial investor. Given the size of the project he has obtained third party advice to take care of component testing, design and construction review. Advanced monitoring and inspections are covered by an ongoing operations and maintenance contract. The business model offers a good balance between an IRR of 5.52% and a professional risk protection.
Businss model 4: The owner is a strategic investor with sufficient inhouse knowledge for component testing, design and installation review and qualified EPC selection. Advanced monitoring and inspection are covered by an ongoing operations and maintenance contract. Some spare parts are kept in inventory to minimize potential downtime of central inverters. The business model offer an IRR of 10.47% together with a professional risk protection.

64Modelling of Technical PV Risks
In most cases utility scale PV systems are more likely to possess a professional level of risk protection. However owners of small residential and commercial systems often overestimate the “maintenance free investment” argument. In light of the findings from the Solar Bankability project it is recommended to critically question this statement and to design a customized portfolio of risk mitigation measures for each PV system with optimized time intervals and budgets. Besides regular visual inspections and/or ongoing monitoring by the owner the costs for a PV system check at commissioning, a check at the end of the EPC/module warranty and a midlife inspection should be budgeted as minimum risk protection. These measures, if well documented, can have a positive impact on the terms of the credit agreement or insurance contract. Figure 33 shows the minimum risk protection as well as the occurrence of risks for smaller PV systems against the background of the project lifecycle.
Figure 33: Minimum risk protection versus risk occurrence for smaller PV systems

65Modelling of Technical PV Risks
5. Impact of New Capital Market Regulations 5.1. Financial Crisis 2008 On September 15, 2008, the Investment Bank Lehman Brothers filed for bankruptcy. This largest bankruptcy in history triggered a credit crunch in the global capital markets. Central banks around the world adjusted their monetary policy immediately. At first they reduced their interest rates to almost zero to inject liquidity and later they introduced quantitative easing measures to stabilise the markets. In order to prevent a similar disruption in the future and to enhance transparency and stability in global capital markets, regulatory bodies started to develop a new capital market framework based on three pillars [13] as depicted in figure 34:
• Pillar I: Enhanced minimum capital and liquidity requirements,
• Pillar II: Enhanced supervisory review process for firm-wide risk management and capital planning,
• Pillar III: Enhanced risk disclosure and market discipline.
In the meantime, financial regulatory bodies on a global, European and national level have developed in a harmonised effort a set of regulations for each capital market sector:
• Banking (Basel III),
• Insurance (Solvency II),
• Investment Funds (UCITS V / AIFM).
Figure 34: Three pillar model on new capital markets regulations

66Modelling of Technical PV Risks
5.2. Impact of New Banking Regulations In December 2010 the Basel Committee on Banking Supervision published Basel III [14], a regulatory framework for more resilient banks and banking systems. A more comprehensive and detailed framework was published on Capital Rules in June 2011 [15], on Liquidity Coverage Ratio (LCR) and Liquidity Monitoring Tools in January 2013 [16], and on Net Stable Funding Ratio (NSFR) in October 2014 [17]. The European Union has converted this framework into a series of EU directives and regulations [18/19/20]. The phase-in arrangements schedule full implementation of this new regulatory framework on a national level by 2019.
The Liquidity Coverage Ratio is meant as a protection against short term liquidity disruptions. This ratio ensures that banks hold sufficient stock of “high quality liquid assets” to cover their liquidity needs for 30 calender days under a predefined stress scenario. Photovoltaic projects - typically funded through long-term project finance or special purpose vehicles - neither qualify as high quality liquid assets nor do they receive any preferential treatment on the undrawn portion of liquidity facilities. For undrawn liquidity, i.e. during the construction phase, a 100% coverage will be required. With the gradual phase-in of the LCR potentially the amount of capital available for financing renewable energy projects might be reduced and the interest rates involved might be increased [21].
The Net Stable Funding Ratio tries to limit an overreliance of banks on short-term funding. The NSFR ensures the availability of sufficient stable funding in relation to the liquidity risk profile over a one-year horizon under a predefined stress scenario. Renewable energy projects such as PV require a stable funding factor of 100%. It means that in order to finance a renewable energy project for over one year, banks are required to maintain stable funding for at least the same duration of time in order to back the loan. The stable funding requirements might potentially lead to either higher lending costs or to a shortening of lending terms from 10-18 years to 5 to 7 years requiring subsequent repayment or refinancing [21].
Banks will have two options to meet the enhanced requirements for risk assessment, management and disclosure. They can either enhance their own risk management system and build up an inhouse team specialised in PV risk assessment or they can access external rating services, which are being offered by specialised consulting firms or international rating agencies [22, 23].
In light of LCR and NSFR, banks might increasingly consider to offload long-term renewable energy debt from their balance sheet and to structure large PV projects or projet portfolios into individual bonds, i.e. under the voluntary Green Bond Principles [21], which can be sold to investors with a need for long-term stable cashflows such as pension funds or insurances.
5.3. Impact of New Insurance Regulations The Solvency II regulatory regime replaces 14 existing insurance directives and introduces for the first time a robust, harmonised framework for insurance firms in the EU [24]. This statutory frameworks is based on the individual risk profile of each insurance firm and aims at promoting transparency, comparability and competitiveness. The Solvency II directive was published in November 2009 [25] and later amended by the Omnibus II directive in April 2014 [26]. The entire Solvency II regime has become fully applicable in January 2016.

67Modelling of Technical PV Risks
Under pillar I the Solvency II regime establishes market-consistent rules for the valuation of assets and liabilities. It introduces the Minimum Capital Requirement (MCR) as measure for the minimum acceptable capital security level and the Solvency Capital Requirement (SCR) [27] as solvency security level for own funds over a one year period under a predefined stress scenario. Under these rules insurers were reluctant to invest in infrastrucure projects, hence these investments represented less than 0.3% of their total assets by 2015 [28, 29].
In September 2015 the European Union published the Capital Markets Union [30], an action plan to mobilise capital in Europe and channel it to long-term infrastructure and sustainable projects. A major source of these investments is supposed to come from large institutional investors such as insurers and pension funds. To facilitate such investments the Solvency II Delegated Regulations have been amended to better incentivise insurers to invest in infrastrucure projects, in particular by reducing the amount of capital which insurers must hold against the debt and equity of qualifying infrastructure projects. Infrastructure assets are defined as physical structures or facilities, systems and networks that provide or support essential public services.
From now on qualifying infrastructure investments will form a distinct asset category under Solvency II and will benefit from an appropriate risk calibration, lower than that which would otherwise apply (for example the calibration of the stress factor for such an investment in equity is lowered from 49% to 30%). This will ultimately lead to a lower capital charge.
Qualifying infrastructure investment must meet a number of criteria specified by the European Insurance and Occupational Pensions Authority (EIOPA) [31]. These criteria aim to provide a high degree of protection and security and predictable cash flows for investors. The insurer is required to implement thorough due diligence and an ongoing risk management procedures. For investments in bonds or loans, the insurer must also demonstrate that he is able to hold the investment to maturity. It is not necessary for an investment to be externally rated, but if not rated (or if the investment is in equities) additional criteria must be met. Rated infrastructure debt investments must be investment grade to receive a reduced capital charge.
Given the low exposure to infrastructure investments of less than 0.3% of total assets, insurers will have to develop a professional understanding of renewable energy projects in order to meet the risk management requirements set out under the Solvency II regime. While a few of the large insurance and reinsurance firms have decided to set-up specialised in-house PV teams, other insurance firms have opted to rely on the support of external PV rating and asset management services.
5.4. Impact of New Investment Funds Regulations The regulatory regime for investment funds which are managed or marketed in the European Union can be divided in the UCITS and the AIFM Directives. Whilst the UCITS IV Directive [32], published in January 2009, and the UCITS V Directive [33], published in July 2014, both address collective investments in transferable securities, the AIFM Directive (AIFMD), published in November 2010 [34], addresses alternative investments, i.e. in private equity, real estate, infrastructure or hedge funds.
The overarching objective of the AIFMD is to create - for the first time - a comprehensive and secure framework for the supervision and prudential oversight of AIFM in the EU [35]. Once the AIFMD enters into force, all AIFM are required to obtain authorisation and are liable to ongoing regulation and supervision. In this way, the AIFMD will:
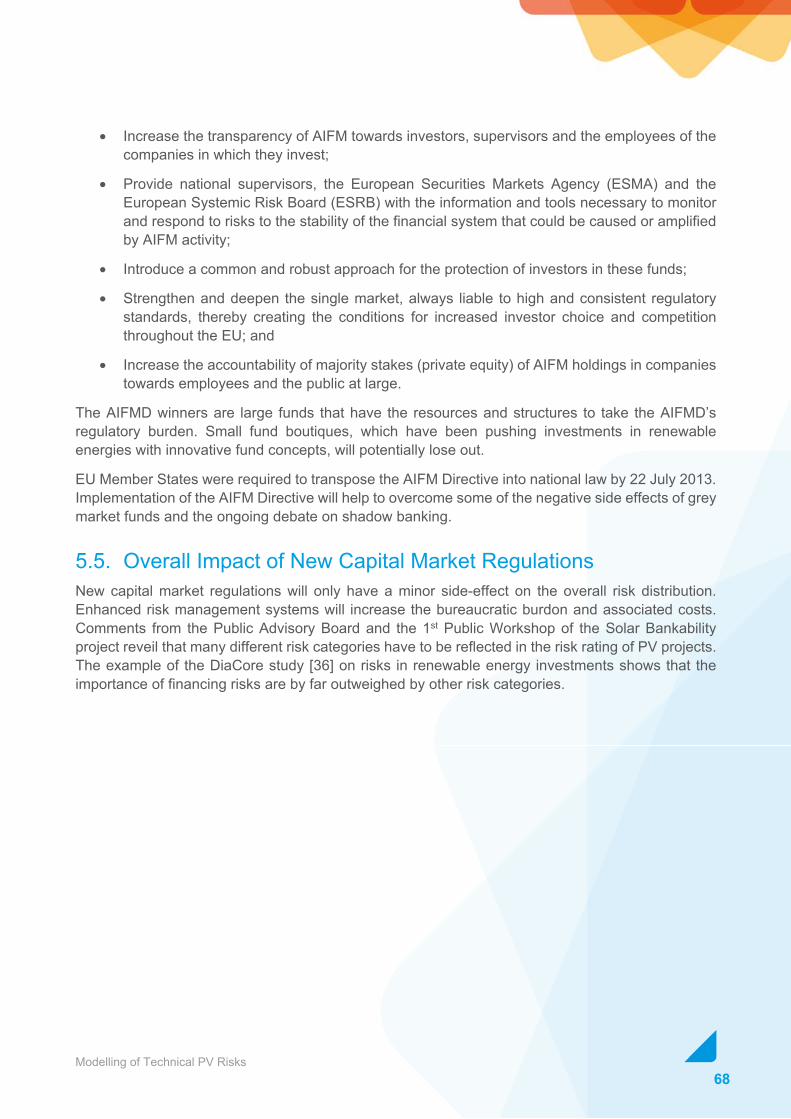
68Modelling of Technical PV Risks
• Increase the transparency of AIFM towards investors, supervisors and the employees of the companies in which they invest;
• Provide national supervisors, the European Securities Markets Agency (ESMA) and the European Systemic Risk Board (ESRB) with the information and tools necessary to monitor and respond to risks to the stability of the financial system that could be caused or amplified by AIFM activity;
• Introduce a common and robust approach for the protection of investors in these funds;
• Strengthen and deepen the single market, always liable to high and consistent regulatory standards, thereby creating the conditions for increased investor choice and competition throughout the EU; and
• Increase the accountability of majority stakes (private equity) of AIFM holdings in companies towards employees and the public at large.
The AIFMD winners are large funds that have the resources and structures to take the AIFMD’s regulatory burden. Small fund boutiques, which have been pushing investments in renewable energies with innovative fund concepts, will potentially lose out.
EU Member States were required to transpose the AIFM Directive into national law by 22 July 2013. Implementation of the AIFM Directive will help to overcome some of the negative side effects of grey market funds and the ongoing debate on shadow banking.
5.5. Overall Impact of New Capital Market Regulations New capital market regulations will only have a minor side-effect on the overall risk distribution. Enhanced risk management systems will increase the bureaucratic burdon and associated costs. Comments from the Public Advisory Board and the 1st Public Workshop of the Solar Bankability project reveil that many different risk categories have to be reflected in the risk rating of PV projects. The example of the DiaCore study [36] on risks in renewable energy investments shows that the importance of financing risks are by far outweighed by other risk categories.

69Modelling of Technical PV Risks
Figure 35: Average ranking of risks for on-shore wind across EU member states [36]
Other influencing factors have a far bigger impact on recent development trends in the European PV market:
• Due to rapid cost reductions accompanied by significant efficiency increases, PV system prices have come down by approximately 70% since 2008.
• PV investment climate has been adversely affected by reductions, discontinuation or retroactive cuts of incentive schemes in many national markets.
• Annual installation levels in Europe have peaked at 22.2 GWp in 2011 and have since then been on a massive decline reaching 8.2 GWp in 2015.
• With the introduction of new national tender schemes the LCOE of PV projects has dropped significantly. In the fourth tender in Germany in April 2014 the lowest bid reached down to 6.94 EUR cts/kWh.
• The PV installation capacity available under the tender scheme is limited and the size of projects has been capped at 10 MWp.
70Modelling of Technical PV Risks
• The PV lending rate has been on a continuous decline in line with the interbanking rate EURIBOR since 2008.
• The decrease in project size and cost along with the overall drop of returns from capital markets has led to a slowdown of debt financing and an increasing share of 100% equity financed PV projects.
European PV installations are expected to stagnate in 2016 at around 8 GWp. At an estimated investment volume of approximately EUR 10 bn this represents less than 4% of the EUR 255 bn total renewable energy investments reported in “Global Trend in Renewable Energy Investments 2016” [37]. In most cases individual project finance volumes will not exceed EUR 10 million. Given the low rate of economically viable PV projects the new capital market regulations impose little to no barrier to the realisation of PV projects in Europe.
However, in order to meet the NREAP targets in 2020 and to reach the global warming target of less than 2°C established during COP21 in Paris in December 2016, much higher PV installation and funding rates will be required for Europe.
Under such a new PV investment cycle, the professional risk assessment methodology developed during the Solar Bankability project will help to enhance the transparency of technical risks and to provide suitable risk mitigation measures for future PV investments. Technical risk assessment of PV plants will gain even more importance as LCOEs continue their decline and become increasingly competitive. While the CAPEX continously decreases the relative share of OPEX in the total life cycle costs increases over time due to the labour content and continuous wage increases.

71Modelling of Technical PV Risks
6. Closing Remarks The Solar Bankability project aims to establish a common practice for professional risk assessment which will serve to reduce the risks associated with investments in photovoltaic projects.
Since the start of the project several reports have already been published and can be downloaded free of charge from the project website www.solarbankability.eu :
• “PV Business Model Country Snapshots” provides an overview over existing and new PV business models and their roll-out in seven European countries.
• “Technical Risks in PV Projects” gives a comprehensive overview of technical risks of PV systems and introduces a systematic cost-based FMEA method to rank these risks using cost priority numbers.
• “Minimizing Technical Risks in Photovoltaik Projects” describes suitable risk mitigation measures and the impact of applied measures under different cost scenarios on the cost priority number.
• “Review and Gap Analysis of Technical Assumptions in PV Electricity Costs” introduces the concept of LCOE. The report summarises technical assumptions and provides a gap analysis influencing the calculation lifecycle costs including CAPEX, OPEX and Yield.
Till the end of the Solar Bankabiltiy project in February 2017 two more reports will be published and project result will be disseminated through a second public workshop early February 2017:
• “Best Practice Guidelines for PV Cost Calculation” explains how to account for technical risks in LCOE, CAPEX, OPEX and Yield calculations and how to minimize their impact for different PV business models.
• “Technical Bankability Guidelines” describes to stakeholders in PV investments, i.e. investors, banks, insurances, EPCs and component manufacturers how to identify potential technical risks, address risk liabilities, plan mititation measures and make tailored financial provisions.
The current report introduces a methodology to determine the financial impact of technical failures and presents a modelling tool to assess the impact of technical failures on the overall financial performance of four representative PV business models. A list of suitable risk mitigation measures for each business model is proposed. New financial market regulations and their impact on PV investments are introduced in a short overview.

72Modelling of Technical PV Risks
The top 10 takeaways of this report are summarized in table 23.
Table 23: Top 10 takeaways for PV stakeholders from risk modelling exercise
1. PV investments are considered as qualified infrastructure investment. Compared with other asset classes PV projects offers a favourable risk profile. Under Solvency II the corresponding equity stress factor has been lowered accordingly.
2. New capital market regulations require a thorough due diligence and ongoing risk management procedures. Banks and insurances are requested to either implement a qualified inhouse risk rating or to take advantage of external professional rating services.
3. Most rating schemes for PV projects are compost of several risk categories. One of them are technical risks which represent up to 20% of the total rating scheme.
4. The impact of technical failures cannot be generalized. It depends on the individual framework conditions of the underlying PV business model , i.e. system size and design, geographic location, climate, technology, financing, taxation, jurisdiction and national policies.
5. The financial impact of technical failures beyond those already reflected by regular O&M provisions can be classified in four failure categories. Only categories 1 and 2 are covered by regular operations and maintenance provisions and reserve accounts. Failures in category 3 and 4 are more common in smaller than in larger PV systems. The financial impact of failures often depends to a large extend on high spare parts costs for modules and inverters,high downtime costs due to long detection and repair/substituion times and higher yield losses especially during the summer season.
6. PV investments require an enhanced risk awareness and active risk management. Since the financial crisis in 2008 the profitability of PV systems has decreased along the decline of overall financial market returns. Increased competition and cost pressure in the PV industry are threatening quality standards. Manufacturer and EPC insolvencies have made product warranties and performance guarantees become void.
7. A professional risk management plan should become integral part for each PV investment. The budget for risk assessment and mitigation measures should be adjusted to size and investment volume of the PV project. Mitigation measures should reflect the “bathtub” like curve of risk occurance and important milestones of system design, commisioning, end of warranty and guarantee periods. Ongoing monitoring and maintenance checks will help to minimize the occurance of failures.
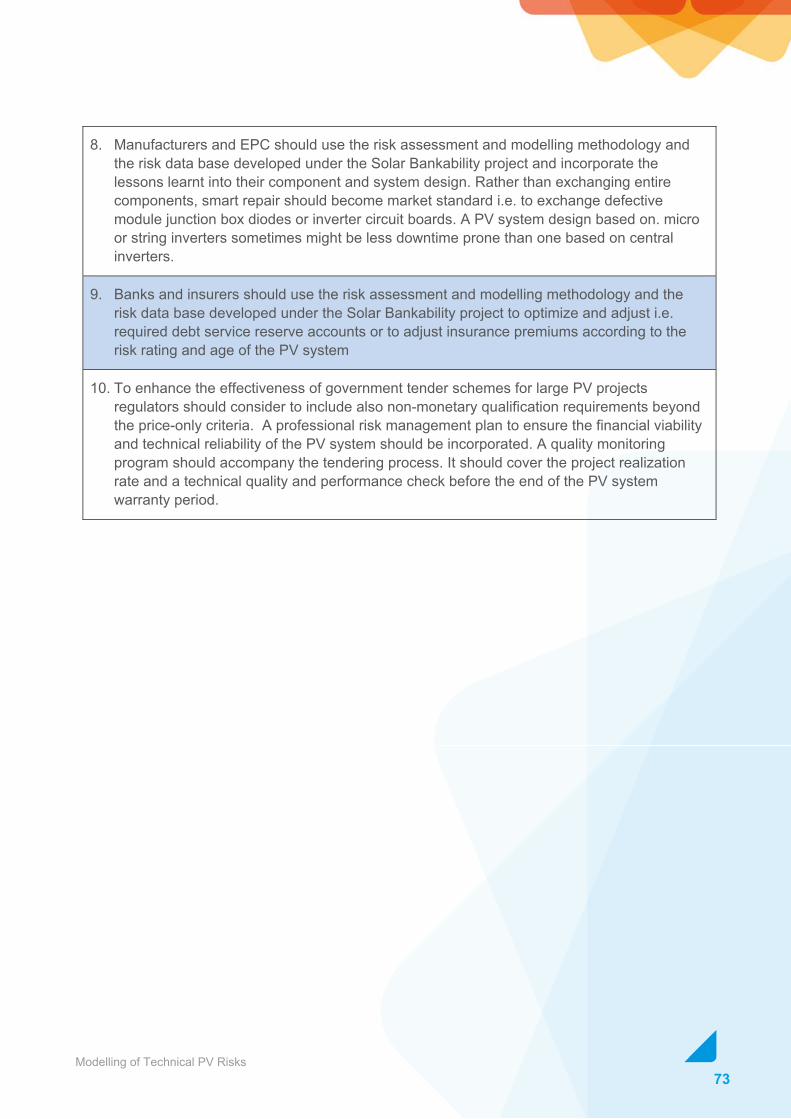
73Modelling of Technical PV Risks
8. Manufacturers and EPC should use the risk assessment and modelling methodology and the risk data base developed under the Solar Bankability project and incorporate the lessons learnt into their component and system design. Rather than exchanging entire components, smart repair should become market standard i.e. to exchange defective module junction box diodes or inverter circuit boards. A PV system design based on. micro or string inverters sometimes might be less downtime prone than one based on central inverters.
9. Banks and insurers should use the risk assessment and modelling methodology and the risk data base developed under the Solar Bankability project to optimize and adjust i.e. required debt service reserve accounts or to adjust insurance premiums according to the risk rating and age of the PV system
10. To enhance the effectiveness of government tender schemes for large PV projects regulators should consider to include also non-monetary qualification requirements beyond the price-only criteria. A professional risk management plan to ensure the financial viability and technical reliability of the PV system should be incorporated. A quality monitoring program should accompany the tendering process. It should cover the project realization rate and a technical quality and performance check before the end of the PV system warranty period.
74Modelling of Technical PV Risks
References [1] Tjengdrawira,C., Richter,M., e.a., "Review and Gap Analysis of Technical Assumptions inn
PV Electricity Cost", [Online] Available from: http://www.solarbankability.eu [Accessed: 19-Aug-2016]
[2] PVCalc, "The Return (ROI) Calculator for PV solar energy investments", [Online] Available from: http://www.pvcalc.org [Accessed: 27-Jul-2016]
[3] DGS Franken, "pv@now - Die Wirtschaftlichkeitssoftware für Photovoltaikanlagen", [Online] Available from: http://www.pv-now.de [Accessed: 27-Jul-2016]
[4] BSW Solar, "PV Power Invest", [Online] Available from: http://www.pvcalc.org [Accessed: 27-Jul-2016]
[5] Valentin-Software, "PV*SOL® - Dynamisches Simulationsprogramm zur Auslegung und Optimierung von Photovoltaikanlagen", [Online] Available from: http://www.valentin-software.com [Accessed: 27-Jul-2016]
[6] PVsyst, "Photovoltaic Software", [Online] Available from: http://www.pvsyst.com [Accessed: 27-Jul-2016]
[7] SMA, "Sunny Design Web - PV-Anlagen konfigurieren", [Online] Available from: http://www.sma.de/produkte/planungssoftware/sunny-design-web.html [Accessed: 27-Jul-2016]
[8] Moser,D., Del Buono, M., e.a., "Technical risks in PV projects", [Online] Available from: http://www.solarbankability.eu [Accessed: 19-Aug-2016], pp73
[9] Armansperg, M., Oechslin, D., Schweneke, M., “PV Business Model Country Snapshots”, [Online] Available from: http://www.solarbankability.eu [Accessed: 19-Aug-2016]
[10] EC Joint Research Center, “Photovoltaic Calculator for Europe”, [Online] Available from: http://photovoltaic-software.com/pvgis.php [Accessed: 01-Jun-2016]
[11] Jahn,U., Moser,D., e.a., "Minimizing Technical Risks in Photovoltaic Projects", [Online] Available from: http://www.solarbankability.eu [Accessed: 01-Sep-2016]
[12] Tjengdrawira, C., Richter, M., “Best Practice Guide for PV Cost Calculation”, [Online] Available from: http://www.solarbankability.eu [Publishing date 31-Oct-2016]
75Modelling of Technical PV Risks
[13] Basel Committee on Banking Supervision, "Basel III Summary Table," [Online] Available from: http://www.bis.org/bcbs/basel3/b3summarytable.pdf [Accessed: 22 July 2016]
[14] Basel Committee on Banking Supervision, "Basel III: A global regulatory framework for more resilient banks and banking systems," Basel, Bank for International Settlement, 2010
[15] Basel Committee on Banking Supervision, "Basel III: A global regulatory framework for more resilient banks and banking systems," Basel, Bank for International Settlement, 2010 (rev June 2011)
[16] Basel Committee on Banking Supervision, "Basel III: The Liquidity Coverage Ratio and liquidity risk monitoring tools," Basel, Bank for International Settlement, 2013
[17] Basel Committee on Banking Supervision, "Basel III: The Net Stable Funding Ratio," Basel, Bank for International Settlement, 2014
[18] EC Fact Sheet, "Capital Requirements - CRD IV/CRR - Frequently Asked Questions," Brussels, European Commission, 2013, Memo/13/690
[19] Official Journal of the European Union, "Directive 2013/36/EU of the European Parliament and of the Council", Brussels, European Union, 2013
[20] Official Journal of the European Union, "Regulation (EU) No 575/2013 of the European Parliament and of the Council", Brussels, European Union, 2013
[21] Narbel, P., "The likely impact of Basel III on bank's appetite for renewable energy financing", Bergen, Norwegion School of Economics, 2013
[22] Donner,R., Berckmann C., Sabatelle A., "Rating Methodoloty - Power Generation Projects", New York, Moody's Investors Service, 2012
[23] Beauchemin, E., Widemann, K., "Methodology - Rating Solar Power Projects," Toronto, DBRS, 2012
[24] EC Fact Sheet, "Solveny II Overview - Frequently Asked Questions," Brussels, European Commission, 2015, Memo/15/3120
[25] Official Journal of the European Union, "Directive 2009/138/EC of the European Parliament and of the Council", Brussels, European Union, 2009
[26] Official Journal of the European Union, "Directive 2014/51/EU of the European Parliament and of the Council", Brussels, European Union, 2014
76Modelling of Technical PV Risks
[27] European Insurance and Occuational Pensions Authority, "The underlying assumptions in the standard formula for the Solvency Capital Requirement calculation," Frankfurt, EIOPA, 2014
[28] EC Fact Sheet, "New EU rules to promote investments in infrastructure projects," Brussels, European Commission, 2015, Memo/15/5734
[29] Nelson, D., Pierpont, B., "The Challenge of Institutional Investment in Renewable Energy", San Francisco, Climate Policy Initiative, 2013
[30] EC Communication, "Action Plan on Building a Capital Markets Union", Brussels, European Commission, 2015, COM (2015) 468 final
[31] European Insurance and Occuational Pensions Authority, "Final Report on Consultation Paper no. 15/004 on the Call for Advice from the EC on the identificationn and calibration of infrastructure investment categories," Frankfurt, EIOPA, 2015
[32] Official Journal of the European Union, "Directive 2009/65/EU of the European Parliament and of the Council", Brussels, European Union, 2009
[33] Official Journal of the European Union, "Directive 2014/91/EU of the European Parliament and of the Council", Brussels, European Union, 2014
[34] Official Journal of the European Union, "Directive 2011/61/EU of the European Parliament and of the Council", Brussels, European Union, 2011
[35] EC Memo, "Directive on Alternative Investment Fund Managers ('AIFMD)': FAQs," Brussels, European Commission, 2010, Memo/10/572
[36] Noothout,P., de Jager, D., Tesniere, L., e.a., "The impact of risks in renewable energy investmetns and the role of smart policies, Freiburg, Fraunhofer ISI, 2016, (DiaCore Project)
[37] Frankfurt School-UNEP Centre/BNEF, “Global Trends in Renewable Energy Investments 2016”, [Online] Available from: http://fs-unep-centre.org/publications/global-trends-renewable-energy-investment-2016 [Accessed: 29-Sep-2016]
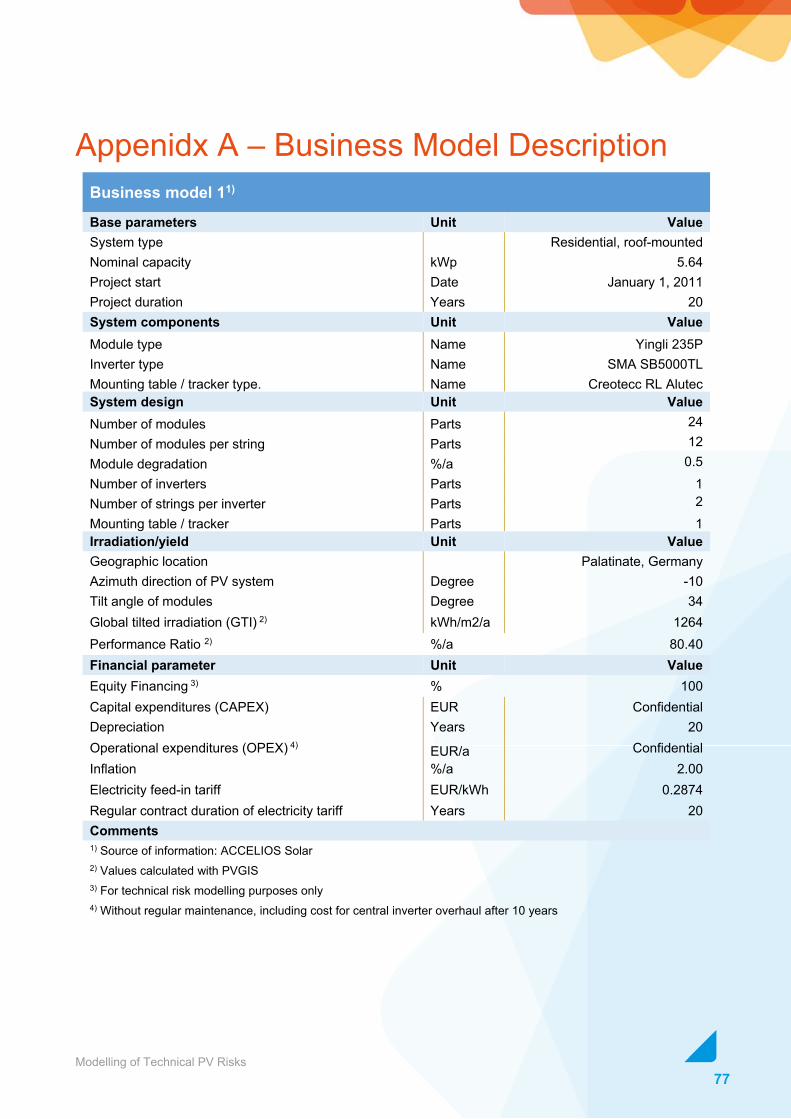
77Modelling of Technical PV Risks
Appenidx A – Business Model Description Business model 11) Base parameters Unit ValueSystem type Residential, roof-mountedNominal capacity kWp 5.64Project start Date January 1, 2011Project duration Years 20System components Unit ValueModule type Name Yingli 235PInverter type Name SMA SB5000TLMounting table / tracker type. Name Creotecc RL AlutecSystem design Unit ValueNumber of modules Parts 24Number of modules per string Parts 12Module degradation %/a 0.5Number of inverters Parts 1Number of strings per inverter Parts 2Mounting table / tracker Parts 1Irradiation/yield Unit ValueGeographic location Palatinate, GermanyAzimuth direction of PV system Degree -10Tilt angle of modules Degree 34Global tilted irradiation (GTI) 2) kWh/m2/a 1264Performance Ratio 2) %/a 80.40Financial parameter Unit ValueEquity Financing 3) % 100Capital expenditures (CAPEX) EUR ConfidentialDepreciation Years 20Operational expenditures (OPEX) 4) EUR/a ConfidentialInflation %/a 2.00Electricity feed-in tariff EUR/kWh 0.2874Regular contract duration of electricity tariff Years 20Comments 1) Source of information: ACCELIOS Solar 2) Values calculated with PVGIS 3) For technical risk modelling purposes only 4) Without regular maintenance, including cost for central inverter overhaul after 10 years

78Modelling of Technical PV Risks
Business model 21) Base parameters Unit ValueSystem type Residential, roof-mountedNominal capacity kWp 5.2Project start Date January 1, 2015Project duration Years 20System components Unit ValueModule type Name Aleo S79 L260Inverter type Name SMA SB2.5 1VL40Mounting table / tracker type. Name K2Battery Inverter Name SMA SB Storage 2.5Storage Battery Name IBC Solstore 2.5System design Unit ValueNumber of modules Parts 20Number of modules per string Parts 10Module degradation %/a 0.5Number of inverters Parts 1Number of strings per inverter Parts 2Irradiation/yield Unit ValueGeographic location Bavaria, GermanyAzimuth direction of PV system Degree 0Tilt angle of modules Degree 24Global tilted irradiation (GTI) 2) kWh/m2/a 1260Performance Ratio 2) % 80.40Financial parameter Unit ValueEquity Financing 3) % 100Capital expenditures (CAPEX) EUR ConfidentialDepreciation Years 20Operational expenditures (OPEX) 4) EUR/a ConfidentialInflation %/a 2.00Electricity feed-in tariff EUR/kWh 0.1231Regular contract duration of electricity tariff Years 20Self-consumption tariff EUR/kWh 0.2792Share of self-consumption % 58.10Comments 1) Source of information: DGS Franken 2) Values calculated with PVGIS 3) For technical risk modelling purposes only 4) Including annual maintenance and inverter exchange and battery overhaul after 10 years

79Modelling of Technical PV Risks
Business model 31) Base parameters Unit ValueSystem type Utility, ground mountedNominal capacity kWp 7619Project start Date January 1, 2011Project duration Years 20System components Unit ValueModule type Name Q CELLS Q.Pro-G3 260Inverter type Name SMA SC800CP-XTMounting table / tracker type. Name CWFSystem design Unit ValueNumber of modules Parts 29304Number of modules per string Parts 22Module degradation %/a 0.5Number of inverters Parts 7Number of strings per inverter Parts 190Mounting table / tracker Parts 333Irradiation/yield Unit ValueGeographic location Nottinghamshire, UKAzimuth direction of PV system Degree 0Tilt angle of modules Degree 25Global tilted irradiation (GTI) 2) kWh/m2/a 1195Performance Ratio 2) % 80.78Financial parameter Unit ValueEquity Financing 3) % 100Capital expenditures (CAPEX) EUR ConfidentialDepreciation Years 20Operational expenditures (OPEX) 4) EUR/a ConfidentialInflation %/a 2.00Electricity feed-in tariff 5) EUR/kWh 0.560Regular contract duration of electricity tariff Years 20Exchange rate GBP/EUR 1.27807Comments 1) Source of Information: Solarcentury 2) Values calculated with PVGIS 3) For technical risk modelling purposes only 4) Including cost for central inverter overhaul after 10 years 5) Feed-in tariff based on ROCs
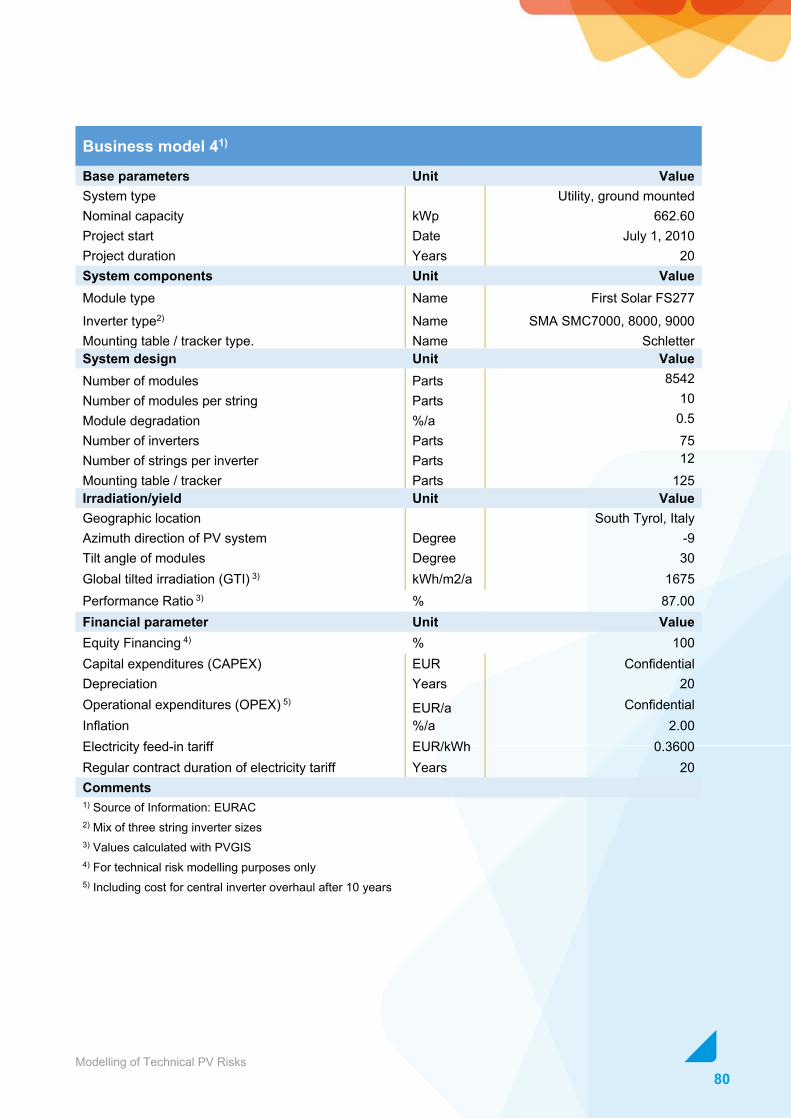
80Modelling of Technical PV Risks
Business model 41) Base parameters Unit ValueSystem type Utility, ground mountedNominal capacity kWp 662.60Project start Date July 1, 2010Project duration Years 20System components Unit ValueModule type Name First Solar FS277
Inverter type2) Name SMA SMC7000, 8000, 9000Mounting table / tracker type. Name SchletterSystem design Unit ValueNumber of modules Parts 8542Number of modules per string Parts 10Module degradation %/a 0.5Number of inverters Parts 75Number of strings per inverter Parts 12Mounting table / tracker Parts 125Irradiation/yield Unit ValueGeographic location South Tyrol, ItalyAzimuth direction of PV system Degree -9Tilt angle of modules Degree 30Global tilted irradiation (GTI) 3) kWh/m2/a 1675Performance Ratio 3) % 87.00Financial parameter Unit ValueEquity Financing 4) % 100Capital expenditures (CAPEX) EUR ConfidentialDepreciation Years 20Operational expenditures (OPEX) 5) EUR/a ConfidentialInflation %/a 2.00Electricity feed-in tariff EUR/kWh 0.3600Regular contract duration of electricity tariff Years 20Comments 1) Source of Information: EURAC 2) Mix of three string inverter sizes 3) Values calculated with PVGIS 4) For technical risk modelling purposes only 5) Including cost for central inverter overhaul after 10 years
81Modelling of Technical PV Risks
APPENDIX B – Risk Database
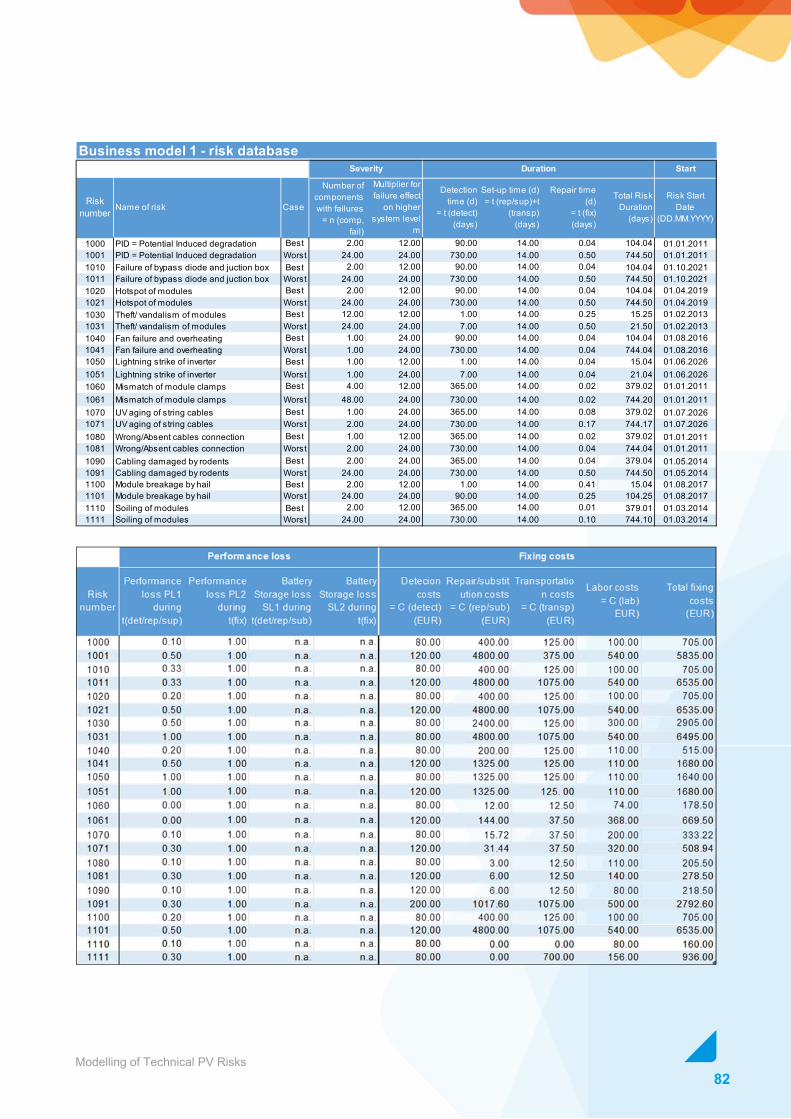
82Modelling of Technical PV Risks
Business model 1 - risk databaseStart
Risknumber
Name of risk Case
Number ofcomponents with failures
= n (comp, fail)
Multiplier for failure effect
on higher system level
m
Detection time (d)
= t (detect)(days)
Set-up time (d) = t (rep/sup)+t
(transp)(days)
Repair time (d)
= t (fix)(days)
Total Risk Duration
(days)
Risk Start Date
(DD.MM.YYYY)
1000 PID = Potential Induced degradation Best 2.00 12.00 90.00 14.00 0.04 104.04 01.01.20111001 PID = Potential Induced degradation Worst 24.00 24.00 730.00 14.00 0.50 744.50 01.01.20111010 Failure of bypass diode and juction box Best 2.00 12.00 90.00 14.00 0.04 104.04 01.10.20211011 Failure of bypass diode and juction box Worst 24.00 24.00 730.00 14.00 0.50 744.50 01.10.20211020 Hotspot of modules Best 2.00 12.00 90.00 14.00 0.04 104.04 01.04.20191021 Hotspot of modules Worst 24.00 24.00 730.00 14.00 0.50 744.50 01.04.20191030 Theft/ vandalism of modules Best 12.00 12.00 1.00 14.00 0.25 15.25 01.02.20131031 Theft/ vandalism of modules Worst 24.00 24.00 7.00 14.00 0.50 21.50 01.02.20131040 Fan failure and overheating Best 1.00 24.00 90.00 14.00 0.04 104.04 01.08.20161041 Fan failure and overheating Worst 1.00 24.00 730.00 14.00 0.04 744.04 01.08.20161050 Lightning strike of inverter Best 1.00 12.00 1.00 14.00 0.04 15.04 01.06.20261051 Lightning strike of inverter Worst 1.00 24.00 7.00 14.00 0.04 21.04 01.06.20261060 Mismatch of module clamps Best 4.00 12.00 365.00 14.00 0.02 379.02 01.01.20111061 Mismatch of module clamps Worst 48.00 24.00 730.00 14.00 0.02 744.20 01.01.20111070 UV aging of string cables Best 1.00 24.00 365.00 14.00 0.08 379.02 01.07.20261071 UV aging of string cables Worst 2.00 24.00 730.00 14.00 0.17 744.17 01.07.20261080 Wrong/Absent cables connection Best 1.00 12.00 365.00 14.00 0.02 379.02 01.01.20111081 Wrong/Absent cables connection Worst 2.00 24.00 730.00 14.00 0.04 744.04 01.01.20111090 Cabling damaged by rodents Best 2.00 24.00 365.00 14.00 0.04 379.04 01.05.20141091 Cabling damaged by rodents Worst 24.00 24.00 730.00 14.00 0.50 744.50 01.05.20141100 Module breakage by hail Best 2.00 12.00 1.00 14.00 0.41 15.04 01.08.20171101 Module breakage by hail Worst 24.00 24.00 90.00 14.00 0.25 104.25 01.08.20171110 Soiling of modules Best 2.00 12.00 365.00 14.00 0.01 379.01 01.03.20141111 Soiling of modules Worst 24.00 24.00 730.00 14.00 0.10 744.10 01.03.2014
Severity Duration
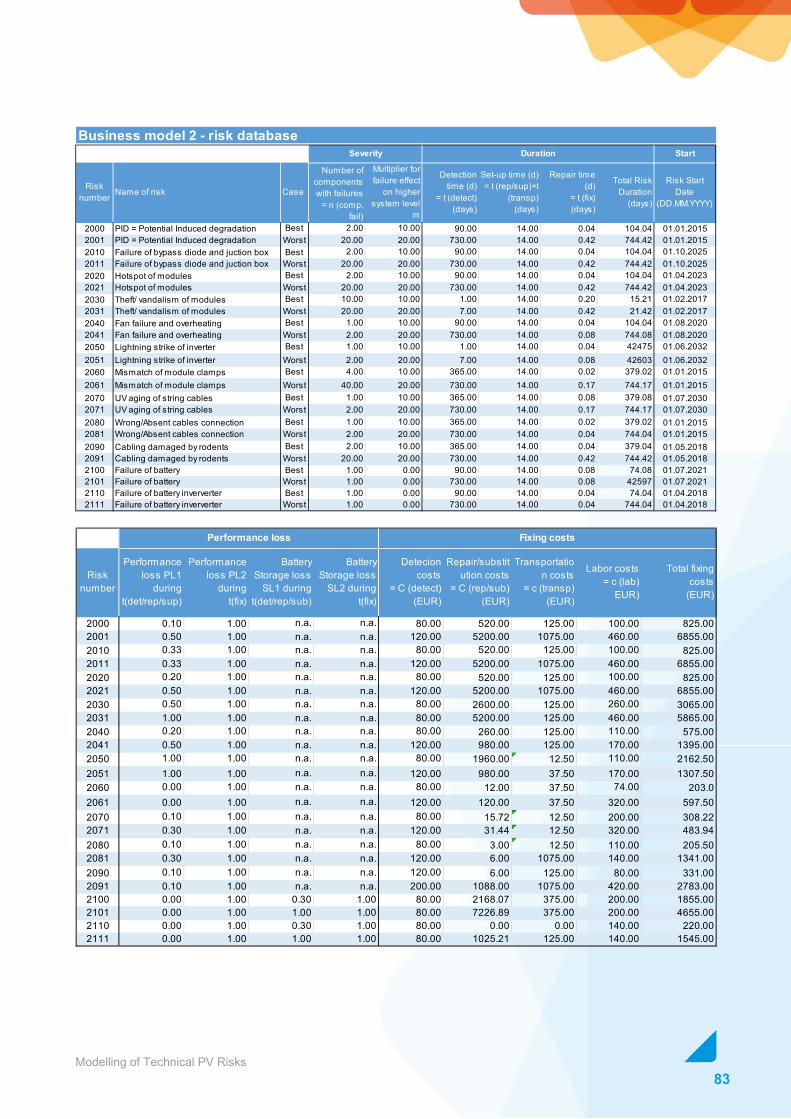
83Modelling of Technical PV Risks
Business model 2 - risk databaseStart
Risknumber Name of risk Case
Number ofcomponents with failures
= n (comp, fail)
Multiplier for failure effect
on higher system level
m
Detection time (d)
= t (detect)(days)
Set-up time (d) = t (rep/sup)+t
(transp)(days)
Repair time (d)
= t (fix)(days)
Total Risk Duration
(days)
Risk Start Date
(DD.MM.YYYY)
2000 PID = Potential Induced degradation Best 2.00 10.00 90.00 14.00 0.04 104.04 01.01.20152001 PID = Potential Induced degradation Worst 20.00 20.00 730.00 14.00 0.42 744.42 01.01.20152010 Failure of bypass diode and juction box Best 2.00 10.00 90.00 14.00 0.04 104.04 01.10.20252011 Failure of bypass diode and juction box Worst 20.00 20.00 730.00 14.00 0.42 744.42 01.10.20252020 Hotspot of modules Best 2.00 10.00 90.00 14.00 0.04 104.04 01.04.20232021 Hotspot of modules Worst 20.00 20.00 730.00 14.00 0.42 744.42 01.04.20232030 Theft/ vandalism of modules Best 10.00 10.00 1.00 14.00 0.20 15.21 01.02.20172031 Theft/ vandalism of modules Worst 20.00 20.00 7.00 14.00 0.42 21.42 01.02.20172040 Fan failure and overheating Best 1.00 10.00 90.00 14.00 0.04 104.04 01.08.20202041 Fan failure and overheating Worst 2.00 20.00 730.00 14.00 0.08 744.08 01.08.20202050 Lightning strike of inverter Best 1.00 10.00 1.00 14.00 0.04 42475 01.06.20322051 Lightning strike of inverter Worst 2.00 20.00 7.00 14.00 0.08 42603 01.06.20322060 Mismatch of module clamps Best 4.00 10.00 365.00 14.00 0.02 379.02 01.01.20152061 Mismatch of module clamps Worst 40.00 20.00 730.00 14.00 0.17 744.17 01.01.20152070 UV aging of string cables Best 1.00 10.00 365.00 14.00 0.08 379.08 01.07.20302071 UV aging of string cables Worst 2.00 20.00 730.00 14.00 0.17 744.17 01.07.20302080 Wrong/Absent cables connection Best 1.00 10.00 365.00 14.00 0.02 379.02 01.01.20152081 Wrong/Absent cables connection Worst 2.00 20.00 730.00 14.00 0.04 744.04 01.01.20152090 Cabling damaged by rodents Best 2.00 10.00 365.00 14.00 0.04 379.04 01.05.20182091 Cabling damaged by rodents Worst 20.00 20.00 730.00 14.00 0.42 744.42 01.05.20182100 Failure of battery Best 1.00 0.00 90.00 14.00 0.08 74.08 01.07.20212101 Failure of battery Worst 1.00 0.00 730.00 14.00 0.08 42597 01.07.20212110 Failure of battery inververter Best 1.00 0.00 90.00 14.00 0.04 74.04 01.04.20182111 Failure of battery inververter Worst 1.00 0.00 730.00 14.00 0.04 744.04 01.04.2018
Severity Duration
Risknumber
Performance loss PL1
duringt(det/rep/sup)
Performance loss PL2
duringt(fix)
Battery Storage loss
SL1 during t(det/rep/sub)
Battery Storage loss
SL2 during t(fix)
Detecion costs
= C (detect)(EUR)
Repair/substitution costs
= C (rep/sub)(EUR)
Transportation costs
= c (transp)(EUR)
Labor costs= c (lab)
EUR)
Total fixing costs
(EUR)
2000 0.10 1.00 n.a. n.a. 80.00 520.00 125.00 100.00 825.002001 0.50 1.00 n.a. n.a. 120.00 5200.00 1075.00 460.00 6855.002010 0.33 1.00 n.a. n.a. 80.00 520.00 125.00 100.00 825.002011 0.33 1.00 n.a. n.a. 120.00 5200.00 1075.00 460.00 6855.002020 0.20 1.00 n.a. n.a. 80.00 520.00 125.00 100.00 825.002021 0.50 1.00 n.a. n.a. 120.00 5200.00 1075.00 460.00 6855.002030 0.50 1.00 n.a. n.a. 80.00 2600.00 125.00 260.00 3065.002031 1.00 1.00 n.a. n.a. 80.00 5200.00 125.00 460.00 5865.002040 0.20 1.00 n.a. n.a. 80.00 260.00 125.00 110.00 575.002041 0.50 1.00 n.a. n.a. 120.00 980.00 125.00 170.00 1395.002050 1.00 1.00 n.a. n.a. 80.00 1960.00 12.50 110.00 2162.502051 1.00 1.00 n.a. n.a. 120.00 980.00 37.50 170.00 1307.502060 0.00 1.00 n.a. n.a. 80.00 12.00 37.50 74.00 203.02061 0.00 1.00 n.a. n.a. 120.00 120.00 37.50 320.00 597.502070 0.10 1.00 n.a. n.a. 80.00 15.72 12.50 200.00 308.222071 0.30 1.00 n.a. n.a. 120.00 31.44 12.50 320.00 483.942080 0.10 1.00 n.a. n.a. 80.00 3.00 12.50 110.00 205.502081 0.30 1.00 n.a. n.a. 120.00 6.00 1075.00 140.00 1341.002090 0.10 1.00 n.a. n.a. 120.00 6.00 125.00 80.00 331.002091 0.10 1.00 n.a. n.a. 200.00 1088.00 1075.00 420.00 2783.002100 0.00 1.00 0.30 1.00 80.00 2168.07 375.00 200.00 1855.002101 0.00 1.00 1.00 1.00 80.00 7226.89 375.00 200.00 4655.002110 0.00 1.00 0.30 1.00 80.00 0.00 0.00 140.00 220.002111 0.00 1.00 1.00 1.00 80.00 1025.21 125.00 140.00 1545.00
Performance loss Fixing costs
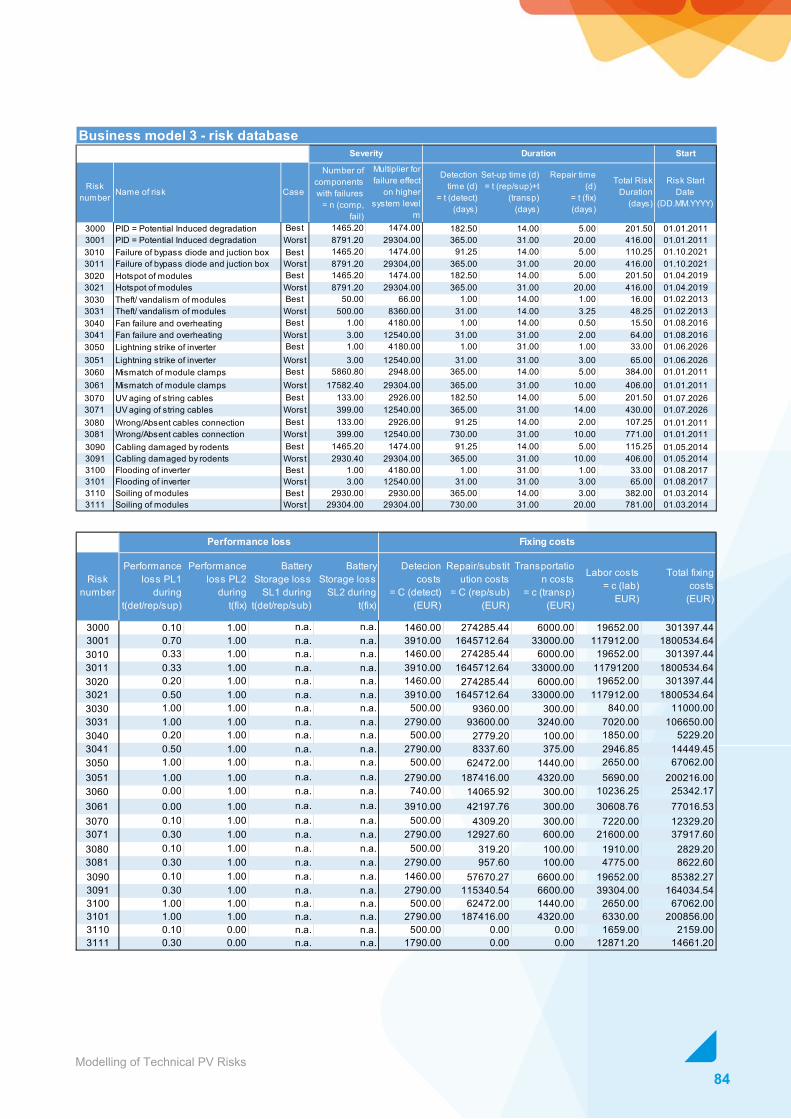
84Modelling of Technical PV Risks
Business model 3 - risk databaseStart
Risknumber Name of risk Case
Number ofcomponents with failures
= n (comp, fail)
Multiplier for failure effect
on higher system level
m
Detection time (d)
= t (detect)(days)
Set-up time (d) = t (rep/sup)+t
(transp)(days)
Repair time (d)
= t (fix)(days)
Total Risk Duration
(days)
Risk Start Date
(DD.MM.YYYY)
3000 PID = Potential Induced degradation Best 1465.20 1474.00 182.50 14.00 5.00 201.50 01.01.20113001 PID = Potential Induced degradation Worst 8791.20 29304.00 365.00 31.00 20.00 416.00 01.01.20113010 Failure of bypass diode and juction box Best 1465.20 1474.00 91.25 14.00 5.00 110.25 01.10.20213011 Failure of bypass diode and juction box Worst 8791.20 29304,00 365.00 31.00 20.00 416.00 01.10.20213020 Hotspot of modules Best 1465.20 1474.00 182.50 14.00 5.00 201.50 01.04.20193021 Hotspot of modules Worst 8791.20 29304.00 365.00 31.00 20.00 416.00 01.04.20193030 Theft/ vandalism of modules Best 50.00 66.00 1.00 14.00 1.00 16.00 01.02.20133031 Theft/ vandalism of modules Worst 500.00 8360.00 31.00 14.00 3.25 48.25 01.02.20133040 Fan failure and overheating Best 1.00 4180.00 1.00 14.00 0.50 15.50 01.08.20163041 Fan failure and overheating Worst 3.00 12540.00 31.00 31.00 2.00 64.00 01.08.20163050 Lightning strike of inverter Best 1.00 4180.00 1.00 31.00 1.00 33.00 01.06.20263051 Lightning strike of inverter Worst 3.00 12540.00 31.00 31.00 3.00 65.00 01.06.20263060 Mismatch of module clamps Best 5860.80 2948.00 365.00 14.00 5.00 384.00 01.01.20113061 Mismatch of module clamps Worst 17582.40 29304.00 365.00 31.00 10.00 406.00 01.01.20113070 UV aging of string cables Best 133.00 2926.00 182.50 14.00 5.00 201.50 01.07.20263071 UV aging of string cables Worst 399.00 12540.00 365.00 31.00 14.00 430.00 01.07.20263080 Wrong/Absent cables connection Best 133.00 2926.00 91.25 14.00 2.00 107.25 01.01.20113081 Wrong/Absent cables connection Worst 399.00 12540.00 730.00 31.00 10.00 771.00 01.01.20113090 Cabling damaged by rodents Best 1465.20 1474.00 91.25 14.00 5.00 115.25 01.05.20143091 Cabling damaged by rodents Worst 2930.40 29304.00 365.00 31.00 10.00 406.00 01.05.20143100 Flooding of inverter Best 1.00 4180.00 1.00 31.00 1.00 33.00 01.08.20173101 Flooding of inverter Worst 3.00 12540.00 31.00 31.00 3.00 65.00 01.08.20173110 Soiling of modules Best 2930.00 2930.00 365.00 14.00 3.00 382.00 01.03.20143111 Soiling of modules Worst 29304.00 29304.00 730.00 31.00 20.00 781.00 01.03.2014
Severity Duration
Risknumber
Performance loss PL1
duringt(det/rep/sup)
Performance loss PL2
duringt(fix)
Battery Storage loss
SL1 during t(det/rep/sub)
Battery Storage loss
SL2 during t(fix)
Detecion costs
= C (detect)(EUR)
Repair/substitution costs
= C (rep/sub)(EUR)
Transportation costs
= c (transp)(EUR)
Labor costs= c (lab)
EUR)
Total fixing costs
(EUR)
3000 0.10 1.00 n.a. n.a. 1460.00 274285.44 6000.00 19652.00 301397.443001 0.70 1.00 n.a. n.a. 3910.00 1645712.64 33000.00 117912.00 1800534.643010 0.33 1.00 n.a. n.a. 1460.00 274285.44 6000.00 19652.00 301397.443011 0.33 1.00 n.a. n.a. 3910.00 1645712.64 33000.00 11791200 1800534.643020 0.20 1.00 n.a. n.a. 1460.00 274285.44 6000.00 19652.00 301397.443021 0.50 1.00 n.a. n.a. 3910.00 1645712.64 33000.00 117912.00 1800534.643030 1.00 1.00 n.a. n.a. 500.00 9360.00 300.00 840.00 11000.003031 1.00 1.00 n.a. n.a. 2790.00 93600.00 3240.00 7020.00 106650.003040 0.20 1.00 n.a. n.a. 500.00 2779.20 100.00 1850.00 5229.203041 0.50 1.00 n.a. n.a. 2790.00 8337.60 375.00 2946.85 14449.453050 1.00 1.00 n.a. n.a. 500.00 62472.00 1440.00 2650.00 67062.003051 1.00 1.00 n.a. n.a. 2790.00 187416.00 4320.00 5690.00 200216.003060 0.00 1.00 n.a. n.a. 740.00 14065.92 300.00 10236.25 25342.173061 0.00 1.00 n.a. n.a. 3910.00 42197.76 300.00 30608.76 77016.533070 0.10 1.00 n.a. n.a. 500.00 4309.20 300.00 7220.00 12329.203071 0.30 1.00 n.a. n.a. 2790.00 12927.60 600.00 21600.00 37917.603080 0.10 1.00 n.a. n.a. 500.00 319.20 100.00 1910.00 2829.203081 0.30 1.00 n.a. n.a. 2790.00 957.60 100.00 4775.00 8622.603090 0.10 1.00 n.a. n.a. 1460.00 57670.27 6600.00 19652.00 85382.273091 0.30 1.00 n.a. n.a. 2790.00 115340.54 6600.00 39304.00 164034.543100 1.00 1.00 n.a. n.a. 500.00 62472.00 1440.00 2650.00 67062.003101 1.00 1.00 n.a. n.a. 2790.00 187416.00 4320.00 6330.00 200856.003110 0.10 0.00 n.a. n.a. 500.00 0.00 0.00 1659.00 2159.003111 0.30 0.00 n.a. n.a. 1790.00 0.00 0.00 12871.20 14661.20
Performance loss Fixing costs
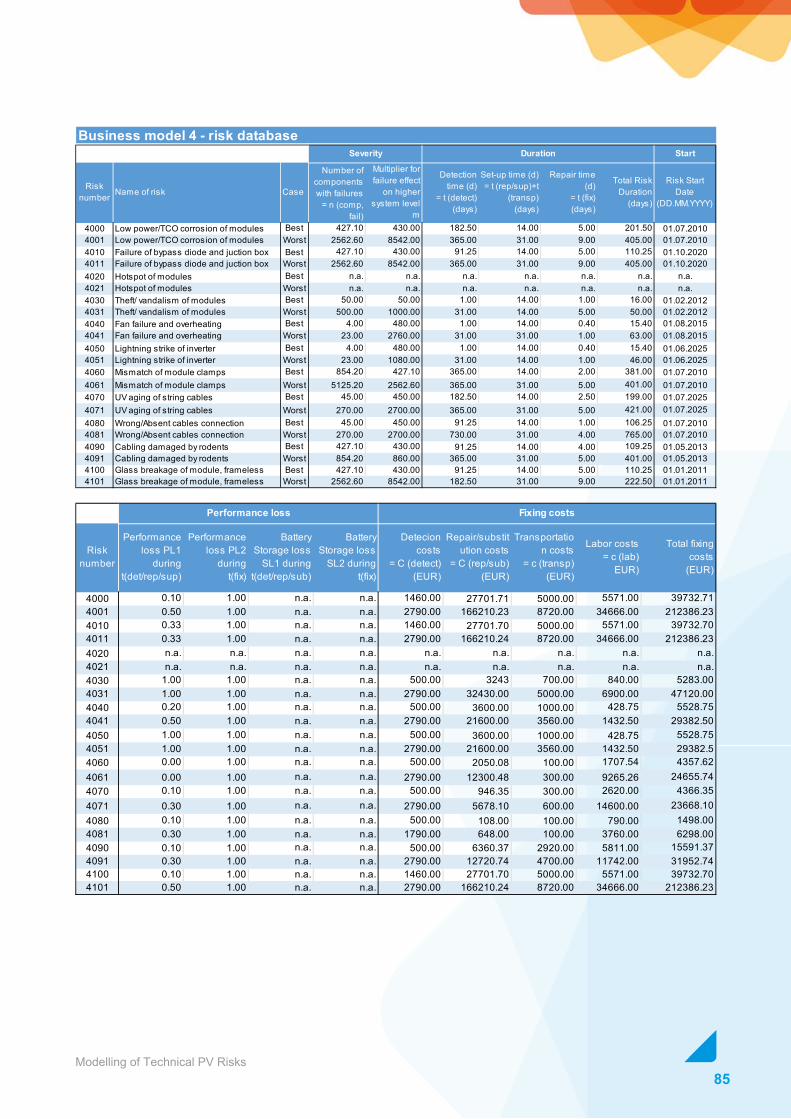
85Modelling of Technical PV Risks
Business model 4 - risk databaseStart
Risknumber Name of risk Case
Number ofcomponents with failures
= n (comp, fail)
Multiplier for failure effect
on higher system level
m
Detection time (d)
= t (detect)(days)
Set-up time (d) = t (rep/sup)+t
(transp)(days)
Repair time (d)
= t (fix)(days)
Total Risk Duration
(days)
Risk Start Date
(DD.MM.YYYY)
4000 Low power/TCO corrosion of modules Best 427.10 430.00 182.50 14.00 5.00 201.50 01.07.20104001 Low power/TCO corrosion of modules Worst 2562.60 8542.00 365.00 31.00 9.00 405.00 01.07.20104010 Failure of bypass diode and juction box Best 427.10 430.00 91.25 14.00 5.00 110.25 01.10.20204011 Failure of bypass diode and juction box Worst 2562.60 8542.00 365.00 31.00 9.00 405.00 01.10.20204020 Hotspot of modules Best n.a. n.a. n.a. n.a. n.a. n.a. n.a.4021 Hotspot of modules Worst n.a. n.a. n.a. n.a. n.a. n.a. n.a.4030 Theft/ vandalism of modules Best 50.00 50.00 1.00 14.00 1.00 16.00 01.02.20124031 Theft/ vandalism of modules Worst 500.00 1000.00 31.00 14.00 5.00 50.00 01.02.20124040 Fan failure and overheating Best 4.00 480.00 1.00 14.00 0.40 15.40 01.08.20154041 Fan failure and overheating Worst 23.00 2760.00 31.00 31.00 1.00 63.00 01.08.20154050 Lightning strike of inverter Best 4.00 480.00 1.00 14.00 0.40 15.40 01.06.20254051 Lightning strike of inverter Worst 23.00 1080.00 31.00 14.00 1.00 46.00 01.06.20254060 Mismatch of module clamps Best 854.20 427.10 365.00 14.00 2.00 381.00 01.07.20104061 Mismatch of module clamps Worst 5125.20 2562.60 365.00 31.00 5.00 401.00 01.07.20104070 UV aging of string cables Best 45.00 450.00 182.50 14.00 2.50 199.00 01.07.20254071 UV aging of string cables Worst 270.00 2700.00 365.00 31.00 5.00 421.00 01.07.20254080 Wrong/Absent cables connection Best 45.00 450.00 91.25 14.00 1.00 106.25 01.07.20104081 Wrong/Absent cables connection Worst 270.00 2700.00 730.00 31.00 4.00 765.00 01.07.20104090 Cabling damaged by rodents Best 427.10 430.00 91.25 14.00 4.00 109.25 01.05.20134091 Cabling damaged by rodents Worst 854.20 860.00 365.00 31.00 5.00 401.00 01.05.20134100 Glass breakage of module, frameless Best 427.10 430.00 91.25 14.00 5.00 110.25 01.01.20114101 Glass breakage of module, frameless Worst 2562.60 8542.00 182.50 31.00 9.00 222.50 01.01.2011
Severity Duration
Risknumber
Performance loss PL1
duringt(det/rep/sup)
Performance loss PL2
duringt(fix)
Battery Storage loss
SL1 during t(det/rep/sub)
Battery Storage loss
SL2 during t(fix)
Detecion costs
= C (detect)(EUR)
Repair/substitution costs
= C (rep/sub)(EUR)
Transportation costs
= c (transp)(EUR)
Labor costs= c (lab)
EUR)
Total fixing costs
(EUR)
4000 0.10 1.00 n.a. n.a. 1460.00 27701.71 5000.00 5571.00 39732.714001 0.50 1.00 n.a. n.a. 2790.00 166210.23 8720.00 34666.00 212386.234010 0.33 1.00 n.a. n.a. 1460.00 27701.70 5000.00 5571.00 39732.704011 0.33 1.00 n.a. n.a. 2790.00 166210.24 8720.00 34666.00 212386.234020 n.a. n.a. n.a. n.a. n.a. n.a. n.a. n.a. n.a.4021 n.a. n.a. n.a. n.a. n.a. n.a. n.a. n.a. n.a.4030 1.00 1.00 n.a. n.a. 500.00 3243 700.00 840.00 5283.004031 1.00 1.00 n.a. n.a. 2790.00 32430.00 5000.00 6900.00 47120.004040 0.20 1.00 n.a. n.a. 500.00 3600.00 1000.00 428.75 5528.754041 0.50 1.00 n.a. n.a. 2790.00 21600.00 3560.00 1432.50 29382.504050 1.00 1.00 n.a. n.a. 500.00 3600.00 1000.00 428.75 5528.754051 1.00 1.00 n.a. n.a. 2790.00 21600.00 3560.00 1432.50 29382.54060 0.00 1.00 n.a. n.a. 500.00 2050.08 100.00 1707.54 4357.624061 0.00 1.00 n.a. n.a. 2790.00 12300.48 300.00 9265.26 24655.744070 0.10 1.00 n.a. n.a. 500.00 946.35 300.00 2620.00 4366.354071 0.30 1.00 n.a. n.a. 2790.00 5678.10 600.00 14600.00 23668.104080 0.10 1.00 n.a. n.a. 500.00 108.00 100.00 790.00 1498.004081 0.30 1.00 n.a. n.a. 1790.00 648.00 100.00 3760.00 6298.004090 0.10 1.00 n.a. n.a. 500.00 6360.37 2920.00 5811.00 15591.374091 0.30 1.00 n.a. n.a. 2790.00 12720.74 4700.00 11742.00 31952.744100 0.10 1.00 n.a. n.a. 1460.00 27701.70 5000.00 5571.00 39732.704101 0.50 1.00 n.a. n.a. 2790.00 166210.24 8720.00 34666.00 212386.23
Performance loss Fixing costs
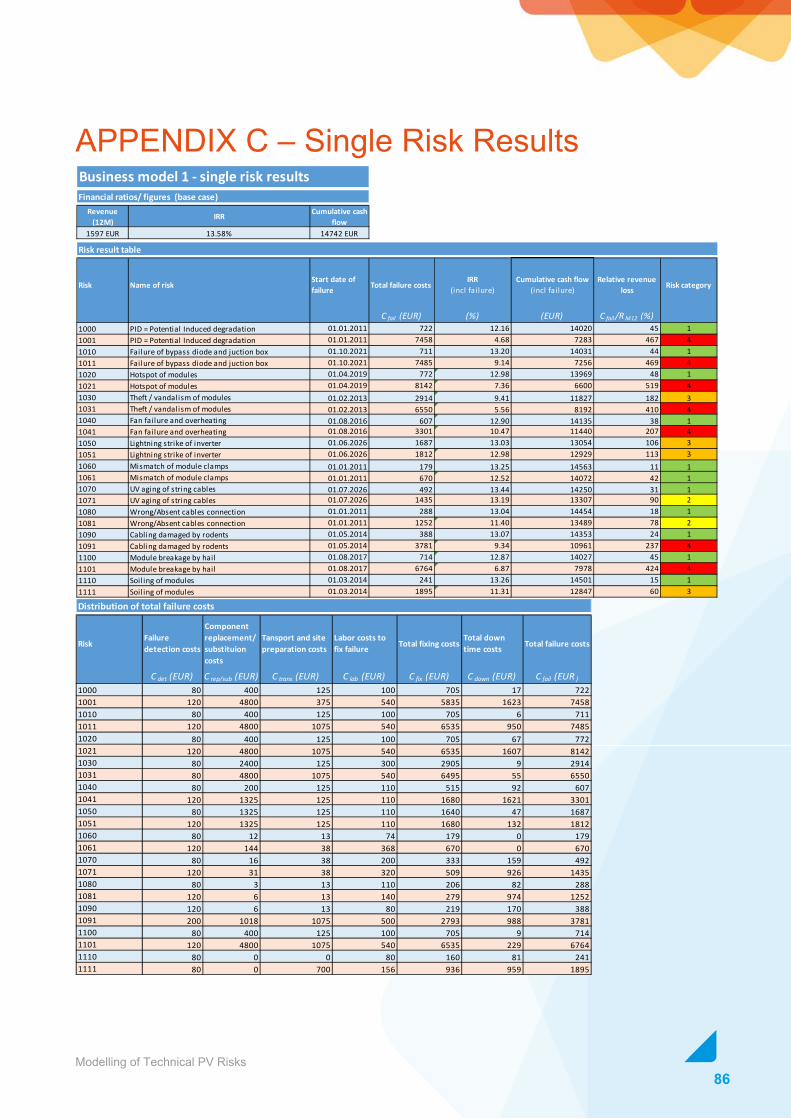
86Modelling of Technical PV Risks
APPENDIX C – Single Risk Results
Distribution of total failure costs
RiskFailure detection costs
Component replacement/substituion costs
Tansport and site preparation costs
Labor costs to fix failure Total fixing costs
Total down time costs Total failure costs
C det (EUR) C rep/sub (EUR) C trans (EUR) C lab (EUR) C fix (EUR) C down (EUR) C fail (EUR )
1000 80 400 125 100 705 17 7221001 120 4800 375 540 5835 1623 74581010 80 400 125 100 705 6 7111011 120 4800 1075 540 6535 950 74851020 80 400 125 100 705 67 7721021 120 4800 1075 540 6535 1607 81421030 80 2400 125 300 2905 9 29141031 80 4800 1075 540 6495 55 65501040 80 200 125 110 515 92 6071041 120 1325 125 110 1680 1621 33011050 80 1325 125 110 1640 47 16871051 120 1325 125 110 1680 132 18121060 80 12 13 74 179 0 1791061 120 144 38 368 670 0 6701070 80 16 38 200 333 159 4921071 120 31 38 320 509 926 14351080 80 3 13 110 206 82 2881081 120 6 13 140 279 974 12521090 120 6 13 80 219 170 3881091 200 1018 1075 500 2793 988 37811100 80 400 125 100 705 9 7141101 120 4800 1075 540 6535 229 67641110 80 0 0 80 160 81 2411111 80 0 700 156 936 959 1895
Business model 1 - single risk resultsFinancial ratios/ figures (base case)
Revenue (12M)
IRR Cumulative cash flow
1597 EUR 13.58% 14742 EUR
Risk result table
Risk Name of riskStart date of failure Total failure costs
IRR (incl failure)
Cumulative cash flow (incl failure)
Relative revenue loss Risk category
C fail (EUR) (%) (EUR) C fail /R M12 (%)1000 PID = Potential Induced degradation 01.01.2011 722 12.16 14020 45 11001 PID = Potential Induced degradation 01.01.2011 7458 4.68 7283 467 41010 Failure of bypass diode and juction box 01.10.2021 711 13.20 14031 44 11011 Failure of bypass diode and juction box 01.10.2021 7485 9.14 7256 469 41020 Hotspot of modules 01.04.2019 772 12.98 13969 48 11021 Hotspot of modules 01.04.2019 8142 7.36 6600 519 41030 Theft / vandalism of modules 01.02.2013 2914 9.41 11827 182 31031 Theft / vandalism of modules 01.02.2013 6550 5.56 8192 410 41040 Fan failure and overheating 01.08.2016 607 12.90 14135 38 11041 Fan failure and overheating 01.08.2016 3301 10.47 11440 207 41050 Lightning strike of inverter 01.06.2026 1687 13.03 13054 106 31051 Lightning strike of inverter 01.06.2026 1812 12.98 12929 113 31060 Mismatch of module clamps 01.01.2011 179 13.25 14563 11 11061 Mismatch of module clamps 01.01.2011 670 12.52 14072 42 11070 UV aging of string cables 01.07.2026 492 13.44 14250 31 11071 UV aging of string cables 01.07.2026 1435 13.19 13307 90 21080 Wrong/Absent cables connection 01.01.2011 288 13.04 14454 18 11081 Wrong/Absent cables connection 01.01.2011 1252 11.40 13489 78 21090 Cabling damaged by rodents 01.05.2014 388 13.07 14353 24 11091 Cabling damaged by rodents 01.05.2014 3781 9.34 10961 237 41100 Module breakage by hail 01.08.2017 714 12.87 14027 45 11101 Module breakage by hail 01.08.2017 6764 6.87 7978 424 41110 Soiling of modules 01.03.2014 241 13.26 14501 15 11111 Soiling of modules 01.03.2014 1895 11.31 12847 60 3

87Modelling of Technical PV Risks

88Modelling of Technical PV Risks
Distribution of total failure costs
RiskFailure detection costs
Component replacement/substituion costs
Tansport and site preparation costs
Labor costs to fix failure Total fixing costs
Total down time costs Total failure costs
C det (EUR) C rep/sub (EUR) C trans (EUR) C lab (EUR) C fix (EUR) C down (EUR) C fail (EUR )
2000 80 520 125 100 825 8 8332001 120 5200 1075 460 6855 661 75162010 80 520 125 100 825 3 8282011 120 5200 1075 460 6855 385 72402020 80 520 125 100 825 26 8512021 120 5200 1075 460 6855 651 75062030 80 2600 125 260 3065 5 30702031 80 5200 125 460 5865 26 58912040 80 260 125 110 575 18 5932041 120 980 125 170 1395 656 20512050 80 1960 13 110 2163 18 21812051 120 980 38 170 1308 51 13582060 80 12 38 74 204 0 2042061 120 120 38 320 598 0 5982070 80 16 13 200 308 32 3402071 120 31 13 320 484 375 8592080 80 3 13 110 206 34 2392081 120 6 1075 140 1341 397 17382090 120 6 125 80 331 34 3652091 200 1088 1075 420 2783 133 29162100 80 1200 375 200 1855 37 18922101 80 4000 375 200 4655 945 56002110 80 0 0 140 220 38 2582111 80 1200 125 140 1545 961 2506
Business model 2 - single risk resultsFinancial ratios/ figures (base case)
Revenue (12M) IRR
Cumulative cash flow
1126 EUR 0.20% 242 EUR
Risk result table
Risk Name of riskStart date of failure Total failure costs
IRR (incl failure)
Cumulative cash flow (incl failure)
Relative revenue loss Risk category
C fail (EUR) (%) (EUR) C fail /R M12 (%)2000 PID = Potential Induced degradation 01.01.2015 833 -0.47 -596 74 22001 PID = Potential Induced degradation 01.01.2015 7516 -4.81 -7763 668 42010 Failure of bypass diode and juction box 01.10.2025 828 -0.50 -588 4 22011 Failure of bypass diode and juction box 01.10.2025 7240 -8.94 -7277 643 42020 Hotspot of modules 01.04.2023 851 -0.52 -625 76 22021 Hotspot of modules 01.04.2023 7506 -7.62 -7739 667 42030 Theft / vandalism of modules 01.02.2017 3070 -2.07 -2831 273 42031 Theft / vandalism of modules 01.02.2017 5891 -3.78 -5670 523 42040 Fan failure and overheating 01.08.2020 593 -0.30 -365 53 22041 Fan failure and overheating 01.08.2020 2051 -1.87 -2293 82 32050 Lightning strike of inverter 01.06.2030 2181 -2.00 -1949 194 32051 Lightning strike of inverter 01.06.2030 1358 -1.07 -1147 121 32060 Mismatch of module clamps 01.01.2015 204 -0.03 39 18 12061 Mismatch of module clamps 01.01.2015 598 -0.28 -355 53 22070 UV aging of string cables 01.07.2030 340 -0.10 -122 30 12071 UV aging of string cables 01.07.2030 859 -0.81 -893 76 22080 Wrong/Absent cables connection 01.01.2015 239 -0.02 -22 21 12081 Wrong/Absent cables connection 01.01.2015 1738 -1.35 -1789 154 32090 Cabling damaged by rodents 01.05.2018 365 -0.12 -148 32 12091 Cabling damaged by rodents 01.05.2018 2916 -2.16 -2772 259 42100 Failure of battery 01.07.2021 1892 -1.33 -1650 168 32101 Failure of battery 01.07.2021 5600 -4.53 -5358 497 42110 Failure of battery inververter 01.07.2018 258 -0.01 -16 23 12111 Failure of battery inververter 01.07.2018 2506 -1.79 -2264 223 4

89Modelling of Technical PV Risks
Financial ratios/ figures (base case)Revenue
(12M)IRR Cumulative cash
flow
1147022 EUR 5.52% 5579932 EUR
Risk result table
Risk Name of riskStart date of failure Total failure costs
IRR (incl failure)
Cumulative cash flow (incl failure)
Relative revenue loss Risk category
C fail (EUR) (%) (EUR) C fail /R M12 (%)3000 PID = Potential Induced degradation 01.01.2011 304994 5.10 5274938 27 13001 PID = Potential Induced degradation 01.01.2011 2434717 2.68 3145215 212 43010 Failure of bypass diode and juction box 01.10.2021 306053 5.27 5273879 27 13011 Failure of bypass diode and juction box 01.10.2021 2198632 3.63 3381300 192 33020 Hotspot of modules 01.04.2019 309495 5.24 5270437 27 13021 Hotspot of modules 01.04.2019 2476620 3.21 3103312 216 43030 Theft / vandalism of modules 01.02.2013 11078 5.51 5568854 1 13031 Theft / vandalism of modules 01.02.2013 136179 5.35 5443753 12 13040 Fan failure and overheating 01.08.2016 7104 5.51 5572828 1 13041 Fan failure and overheating 01.08.2016 68559 5.45 5511373 6 13050 Lightning strike of inverter 01.06.2026 87295 5.47 5492637 8 13051 Lightning strike of inverter 01.06.2026 314401 5.32 5265531 27 13060 Mismatch of module clamps 01.01.2011 25342 5.49 5554589 2 13061 Mismatch of module clamps 01.01.2011 77017 5.42 5502903 7 13070 UV aging of string cables 01.07.2026 17686 5.51 5562246 2 13071 UV aging of string cables 01.07.2026 199085 5.40 5380847 17 13080 Wrong/Absent cables connection 01.01.2011 5633 5.52 5574299 1 13081 Wrong/Absent cables connection 01.01.2011 316505 5.10 5263427 28 13090 Cabling damaged by rodents 01.05.2014 87821 5.42 5492112 8 13091 Cabling damaged by rodents 01.05.2014 565975 4.87 5013957 49 13100 Flooding of inverter 01.08.2017 86296 5.43 5493636 8 13101 Flooding of inverter 01.08.2017 309225 5.21 5270708 27 13110 Soiling of modules 01.03.2014 13920 5.51 5566013 1 13111 Soiling of modules 01.03.2014 752928 4.67 4827005 65 2
Business model 3 - single risk results
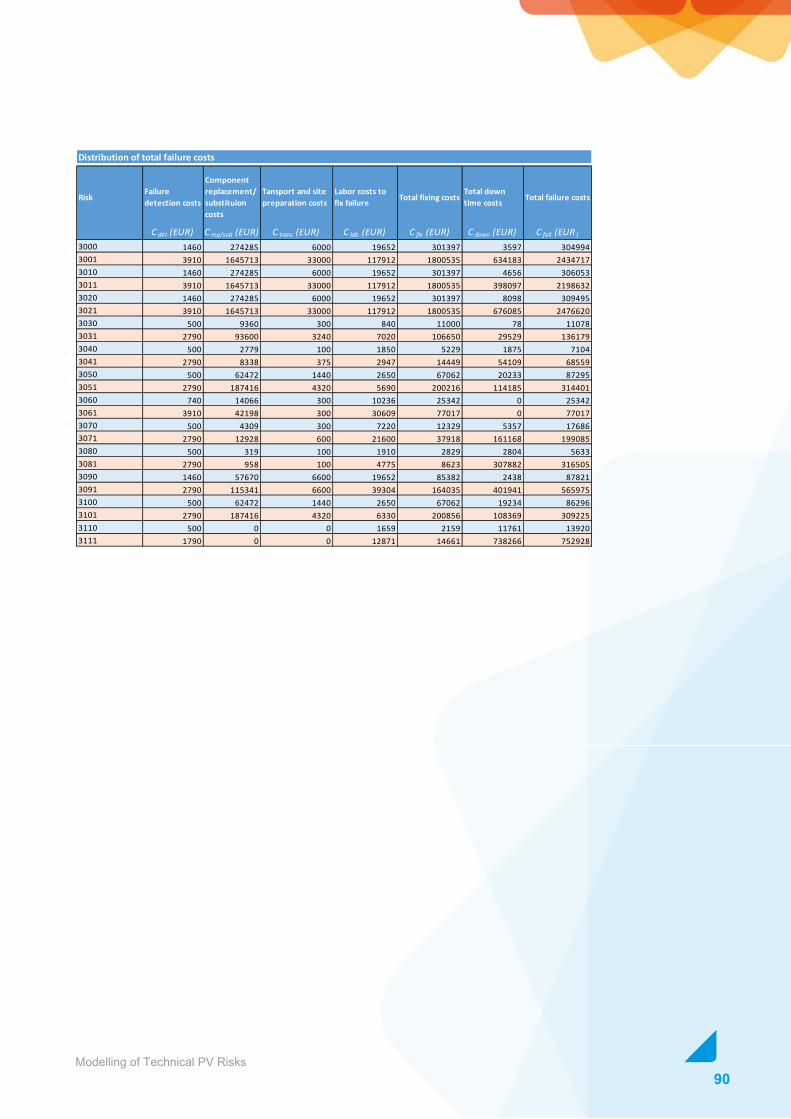
90Modelling of Technical PV Risks
Distribution of total failure costs
RiskFailure detection costs
Component replacement/substituion costs
Tansport and site preparation costs
Labor costs to fix failure Total fixing costs
Total down time costs Total failure costs
C det (EUR) C rep/sub (EUR) C trans (EUR) C lab (EUR) C fix (EUR) C down (EUR) C fail (EUR )
3000 1460 274285 6000 19652 301397 3597 3049943001 3910 1645713 33000 117912 1800535 634183 24347173010 1460 274285 6000 19652 301397 4656 3060533011 3910 1645713 33000 117912 1800535 398097 21986323020 1460 274285 6000 19652 301397 8098 3094953021 3910 1645713 33000 117912 1800535 676085 24766203030 500 9360 300 840 11000 78 110783031 2790 93600 3240 7020 106650 29529 1361793040 500 2779 100 1850 5229 1875 71043041 2790 8338 375 2947 14449 54109 685593050 500 62472 1440 2650 67062 20233 872953051 2790 187416 4320 5690 200216 114185 3144013060 740 14066 300 10236 25342 0 253423061 3910 42198 300 30609 77017 0 770173070 500 4309 300 7220 12329 5357 176863071 2790 12928 600 21600 37918 161168 1990853080 500 319 100 1910 2829 2804 56333081 2790 958 100 4775 8623 307882 3165053090 1460 57670 6600 19652 85382 2438 878213091 2790 115341 6600 39304 164035 401941 5659753100 500 62472 1440 2650 67062 19234 862963101 2790 187416 4320 6330 200856 108369 3092253110 500 0 0 1659 2159 11761 139203111 1790 0 0 12871 14661 738266 752928

91Modelling of Technical PV Risks
Financial ratios/ figures (base case)
Revenue (12M)
IRR Cumulative cash flow
346027 EUR 10.74% 3449957 EUR
Risk result table
Risk Name of riskStart date of failure Total failure costs
IRR (incl failure)
Cumulative cash flow (incl failure)
Relative revenue loss Risk category
C fail (EUR) (%) (EUR) C fail /R M12 (%)4000 Low performance/ TCO corrosion of CdTe modules 01.07.2010 40650 10.50 3377665 12 14001 Low performance/ TCO corrosion of CdTe modules 01.07.2010 413940 8.56 3004376 119 34010 Failure of bypass diode and juction box 01.10.2020 39990 10.65 3378325 12 14011 Failure of bypass diode and juction box 01.10.2020 313025 10.07 3105291 90 24020 Hotspot of modules n.a.4021 Hotspot of modules n.a.4030 Theft / vandalism of modules 01.02.2012 5358 10.70 3412958 2 14031 Theft / vandalism of modules 01.02.2012 51801 10.47 3366515 15 14040 Fan failure and overheating 01.08.2015 5735 10.71 3412580 2 14041 Fan failure and overheating 01.08.2015 41527 10.57 3376788 12 14050 Lightning strike of inverter 01.06.2025 6493 10.72 3411823 2 14051 Lightning strike of inverter 01.06.2025 36081 10.68 3382234 10 14060 Mismatch of module clamps 01.07.2010 4358 10.70 3413958 1 14061 Mismatch of module clamps 01.07.2010 24656 10.59 3393659 7 14070 UV aging of string cables 01.07.2025 5245 10.72 3413070 2 14071 UV aging of string cables 01.07.2025 60884 10.65 3357432 18 14080 Wrong/Absent cables connection 01.07.2010 2145 10.71 3416170 1 14081 Wrong/Absent cables connection 01.07.2010 77222 10.30 3341093 22 14090 Cabling damaged by rodents 01.05.2013 16264 10.65 3402052 5 14091 Cabling damaged by rodents 01.05.2013 43780 10.54 3374535 13 14100 Glass breakage of module, frameless 01.01.2011 40225 10.50 3378091 12 14101 Glass breakage of module, frameless 01.01.2011 330461 8.99 3087854 96 2
Business model 4 - single risk results
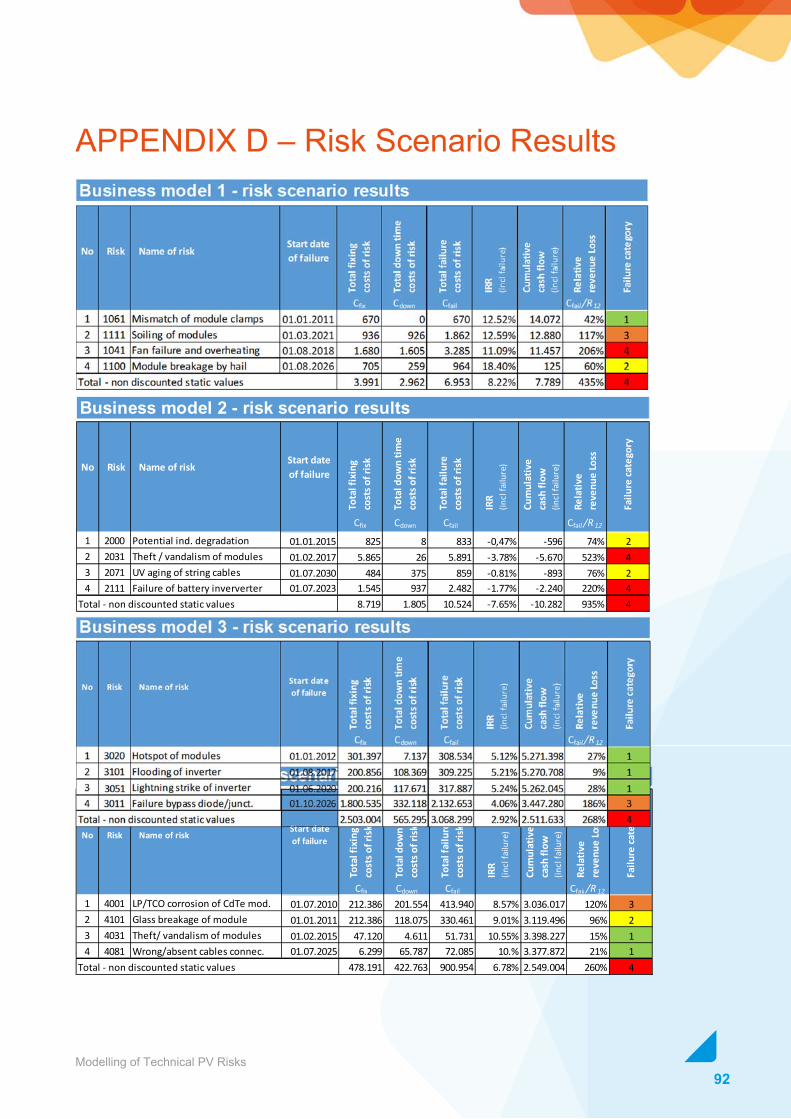
92Modelling of Technical PV Risks
APPENDIX D – Risk Scenario Results
No Risk Name of riskStart date of failure
Tota
l fix
ing
cost
s of r
isk
Tota
l dow
n tim
e co
sts o
f risk
Tota
l fai
lure
co
sts o
f risk
IRR
(incl
failu
re)
Cum
ulat
ive
cash
flow
(in
cl fa
ilure
)
Rela
tive
reve
nue
Loss
Failu
re ca
tego
ry
Cfix Cdown Cfail Cfail /R 12
1 4001 LP/TCO corrosion of CdTe mod. 01.07.2010 212.386 201.554 413.940 8.57% 3.036.017 120% 32 4101 Glass breakage of module 01.01.2011 212.386 118.075 330.461 9.01% 3.119.496 96% 23 4031 Theft/ vandalism of modules 01.02.2015 47.120 4.611 51.731 10.55% 3.398.227 15% 14 4081 Wrong/absent cables connec. 01.07.2025 6.299 65.787 72.085 10.% 3.377.872 21% 1
Total - non discounted static values 478.191 422.763 900.954 6.78% 2.549.004 260% 4
Business model 4 - risk scenario results
No Risk Name of risk Start date of failure
Tota
l fix
ing
cost
s of r
isk
Tota
l dow
n tim
e co
sts o
f risk
Tota
l fai
lure
co
sts o
f risk
IRR
(incl
failu
re)
Cum
ulat
ive
cash
flow
(in
cl fa
ilure
)
Rela
tive
reve
nue
Loss
Failu
re ca
tego
ry
Cfix Cdown Cfail Cfail /R 12
1 2000 Potential ind. degradation 01.01.2015 825 8 833 -0,47% -596 74% 22 2031 Theft / vandalism of modules 01.02.2017 5.865 26 5.891 -3.78% -5.670 523% 43 2071 UV aging of string cables 01.07.2030 484 375 859 -0.81% -893 76% 24 2111 Failure of battery inververter 01.07.2023 1.545 937 2.482 -1.77% -2.240 220% 4
Total - non discounted static values 8.719 1.805 10.524 -7.65% -10.282 935% 4
Business model 2 - risk scenario results

93Modelling of Technical PV Risks

94Modelling of Technical PV Risks
Funded by the Horizon 2020 Framework Programme of the European Union