Strategic Plan 2010-2020: A design for the future of Kansas City's ...

Ordinary Meeting of Council 09 May 2018
Page 1
5.2 FINANCIAL MANAGEMENT REPORT - MARCH 2018
Ward: (All Wards) (Financial Services and Rates)
Disclosure of Interest: Nil
Authorised Officer: (Executive Manager Stakeholder Relations)
KEY ISSUES
• This report provides Council with the suite of financial management reports in order for Council to monitor the financial performance and position of the City.
• A summary page has been developed that includes high level financial information, commentary and graphical representation from the various statements and schedules included in the report.
• Statements included are Financial Activity, Rate Setting, Cash Flow, Comprehensive Income, Financial Position, Changes in Equity, Capital Jobs, Cash and Investments and Net Current Funding.
• A Debtors Schedule has been included that lists the top 10 non-rate debtors (in value). For privacy purposes the names of the debtors are not included, however the report provides insight into the management of the aged debtors.
It is recommended that Council resolve to note the monthly financial management reports for the period ended 31 March 2018.
BACKGROUND
Section 6.4 of the Local Government Act 1995 requires an annual financial report to be prepared as well as such other financial reports as prescribed.
Regulation 34(1) of the Local Government (Financial Management) Regulations 1996 (the Regulations) requires a local government to prepare each month a statement of financial activity reporting on the income and expenditure, as set out in the annual budget. The statement of financial activity is to be supported by such information as is considered relevant by the local government.
A statement of financial activity and any accompanying documents are to be presented at the next ordinary council meeting following the end of the month to which the statement relates, or to the next ordinary council meeting after that meeting.
In addition under regulation 34(5) of the Regulations each financial year, local government is to adopt a percentage or value, calculated in accordance with Australian Accounting Standards to be used in the statement of financial activity for reporting material variances.

Ordinary Meeting of Council 09 May 2018
Page 2
The City of Swan Financial Management Reports use a materiality threshold to measure, monitor and report on financial performance and position of the City. The materiality threshold adopted by Council, together with the Annual Budget for 2017/2018 is variances greater than 10% of the original adopted budget and a value greater than $10,000.
DETAILS
The financial management report for the period ended 31 March 2018 is included as an attachment to this report.
As the information contained in the Statement of Financial Activity is repeated in the Statement of Comprehensive Income and Financial Position, the analysis of the information is included below.
1. Statement of Comprehensive Income
Actual Revenue from ordinary activities for the year to date is $168.1m, this is below budget by $806k.
Expenditure form ordinary activities for the year to date is $107.4m, this is less than budget by $11.3m.
The net result is $79.4m surplus compared to $70.5m budgeted year to date.
2. Statement of Financial Position
Current Assets have decreased by $9.6m compared to February. This is mainly due to a reduction in Rates Debtors as the fourth instalment and interims were due in March.
Property, Plant and Equipment has increased by $985k in March resulting from capital expenditure, mainly on road infrastructure projects reflected in Work In Progress.
Current Liabilities has decreased by $4.6m as a result of a reduction in Trade in Other Payables compared to February.
3. Statement of Cash Flows
The Report shows Cash and Cash Equivalents at the end of March 2018 with a balance of $185.7m. Cash and Cash Equivalents at the end of March 2017 reflected a balance of $164.9m.
CONSULTATION
Not applicable
ATTACHMENTS
Financial Report for the period ending 31 March 2018.

Ordinary Meeting of Council 09 May 2018
Page 3
STRATEGIC IMPLICATIONS
Consistent with the City's Strategic Community Plan 2017-2027 Key Result Area - Governance
Objectives: G1.1 - Provide accountable and transparent leadership, and G2.1 - Improve capability and capacity.
Monitoring performance by comparison of budget and actual is an essential management tool to ensure financial performance within acceptable pre determined limits.
STATUTORY IMPLICATIONS
Section 6.4 of the Local Government Act 1995 and regulation 34(1) of the Local Government (Financial Management) Regulations 1996
FINANCIAL IMPLICATIONS
Compares financial activity with budget as detailed in this report.
VOTING REQUIREMENTS
Simple majority
RECOMMENDATION
That the Council resolve to:
1) Note the financial statements and report for the month ended 31 March 2018 in accordance with regulation 34(1) of the Local Government (Financial Management) Regulations 1996.
CARRIED

Financial Report
for the Period Ending
31st March 2018

Contents
1.0 Financial Summary 1.0
2.0 Statements of Comprehensive Income 2.1 By Nature & Type 2.2
By Program 2.3
3.0 Statements of Financial Position & Equity 3.1 Statement of Financial Position 3.2 Statement of Changes in Equity 3.3 4.0 Capital Payment 4.1 Capital Works Schedules 4.2 - 4.8 5.0 Cash and Investments 5.1 Investment Report 5.2 - 5.4 6.0 Debtors Rates Debtors 6.1 Sundry Debtors 6.2 7.0 Statement of Financial Activity 7.1 - 7.3
(With Variance Analysis Commentary) Statement of Financial Activity 7.4 Net Current Funding Position 7.5
Liquidity Over Three Years 7.5
8.0 Other Statutory Reports 8.1 Statement of Cash Flow 8.2
Rate Setting Statement 8.3
1.0
City of Swan - Financial Management SummaryReport for the period ended 31st March 2018
2.0 Statement of Comprehensive Income (Performance)
Year to 31st March 2018 Annual AnnualBudget Bgt Var
$000's %
Revenue 168,146 168,952 0% 175,984 96%
Expenses (107,438) (118,769) -11% (159,045) 68%
Profit/Loss 60,708 50,183 17% 16,939 358%
Non-operating 18,738 20,280 -8% 50,681 37%
Net Result 79,446 70,463 11% 67,620 117%
3.0 Statement of Financial Position2017 2018 2018June February March$000's $000's $000's
Current
Assets 158,756 224,692 215,086
Liabilities 39,521 29,485 24,870
Non Current
Assets 1,566,565 1,575,423 1,576,396
Liabilities 44,996 46,739 46,362
Net Assets 1,640,804 1,723,891 1,720,250
4.0 Capital PaymentsYear to 31st March 2018 Annual Annual
March Actual/Comm Budget Var Budget Bgt Var
$000's $000's % $000's %
Buildings 7,418 14,990 49% 19,987 37%Drainage 3,646 3,506 104% 4,674 78%
Footpaths 678 851 80% 1,135 60%Parks 6,948 9,410 74% 12,547 55%
Roads 20,168 33,473 60% 44,630 45%P&E, Other 12,559 19,324 65% 25,765 49%
Total 51,417 81,554 63% 108,738 47%
5.0 Cash and InvestmentsVolume Held
February March Ave Interest$000's $000's %
Cash 18,537 17,881 1.2%Term Deposits 162,300 167,800 2.6%
Total 180,837 185,681 2.0%
6.0 Debtors February March Change
$000's $000's %Trade Debtors
Current 822 567 -31%> 30 Days 62 636 926%> 60 Days 64 34 -47%> 90 Days 689 728 6%
Total Trade 1,637 1,965 20%Rates Debtors
Rates Debtors 29,897 17,254 -42%Other Debtors 3,811 1,806 -53%
Total Debtors 35,345 21,025 -41%
Actual '$000's Budget '$000's Variance
%
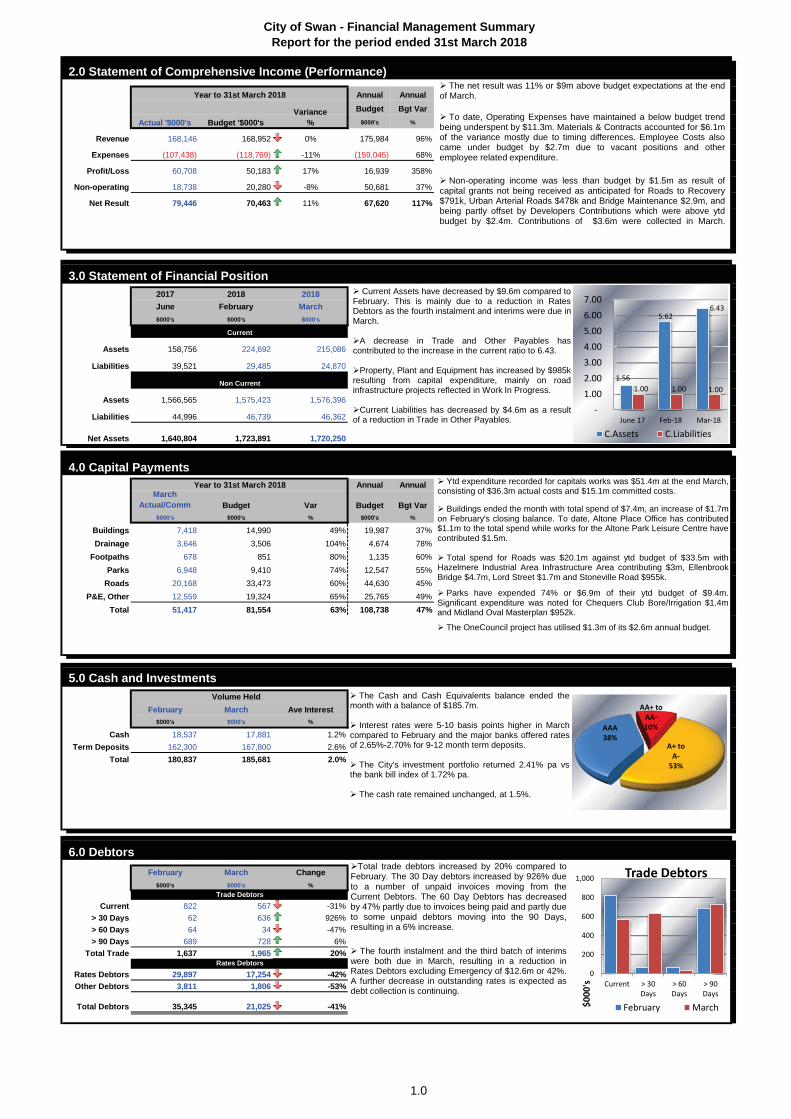
The net result was 11% or $9m above budget expectations at the endof March.
To date, Operating Expenses have maintained a below budget trendbeing underspent by $11.3m. Materials & Contracts accounted for $6.1mof the variance mostly due to timing differences. Employee Costs alsocame under budget by $2.7m due to vacant positions and otheremployee related expenditure.
Non-operating income was less than budget by $1.5m as result ofcapital grants not being received as anticipated for Roads to Recovery$791k, Urban Arterial Roads $478k and Bridge Maintenance $2.9m, andbeing partly offset by Developers Contributions which were above ytdbudget by $2.4m. Contributions of $3.6m were collected in March.
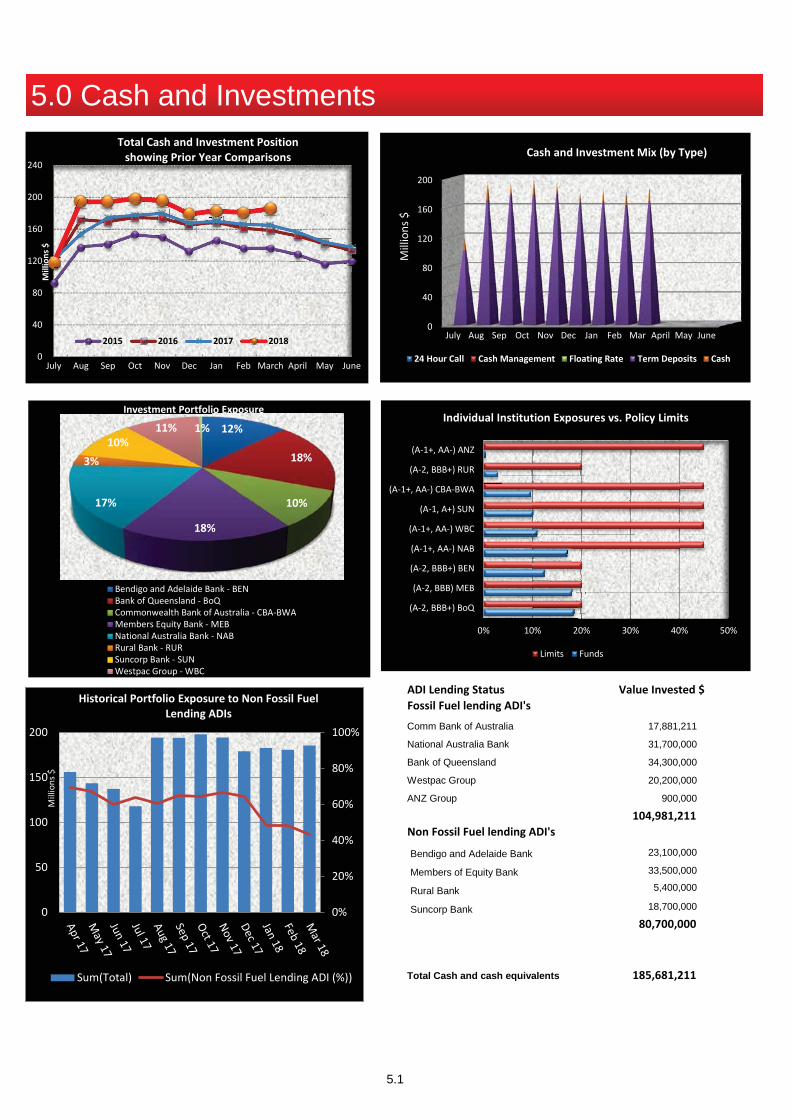
The Cash and Cash Equivalents balance ended themonth with a balance of $185.7m.
Interest rates were 5-10 basis points higher in Marchcompared to February and the major banks offered ratesof 2.65%-2.70% for 9-12 month term deposits.
The City's investment portfolio returned 2.41% pa vsthe bank bill index of 1.72% pa.
The cash rate remained unchanged, at 1.5%.
Current Assets have decreased by $9.6m compared toFebruary. This is mainly due to a reduction in RatesDebtors as the fourth instalment and interims were due inMarch.
A decrease in Trade and Other Payables hascontributed to the increase in the current ratio to 6.43.
Property, Plant and Equipment has increased by $985kresulting from capital expenditure, mainly on roadinfrastructure projects reflected in Work In Progress.
Current Liabilities has decreased by $4.6m as a resultof a reduction in Trade in Other Payables.
1.56
5.62 6.43
1.00 1.00 1.00
- 1.00 2.00 3.00 4.00 5.00 6.00 7.00
June 17 Feb-18 Mar-18
C.Assets C.Liabilities
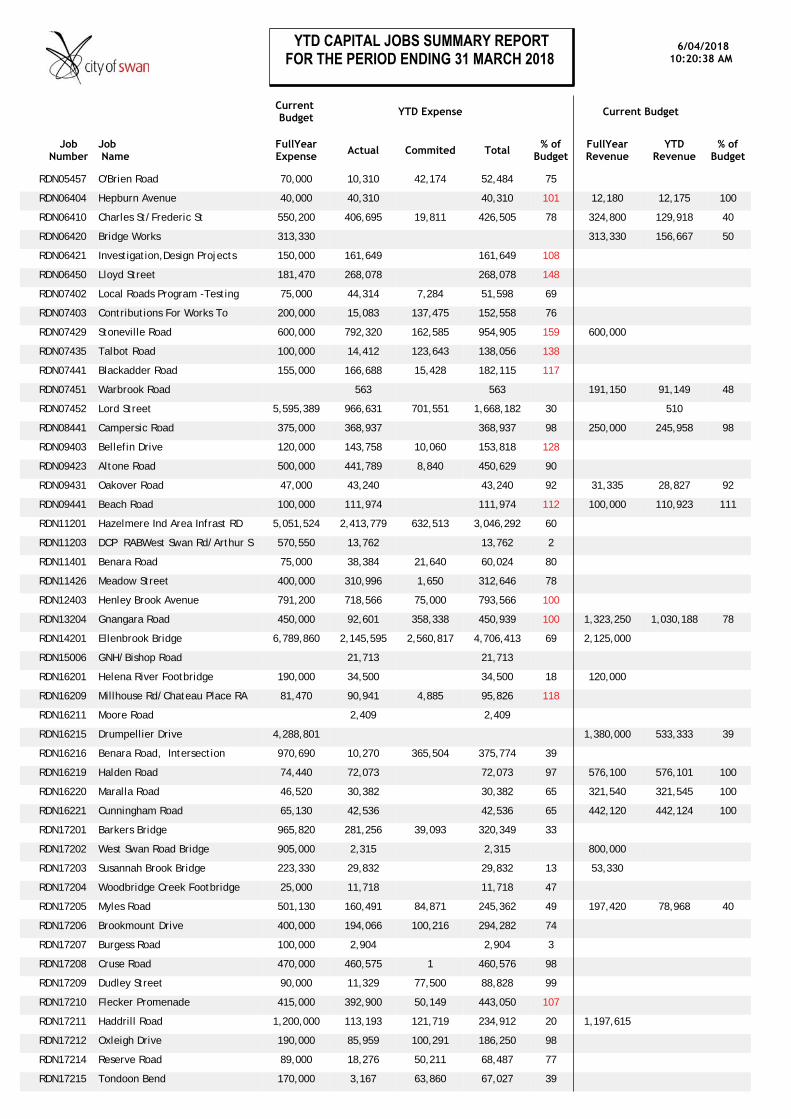
Ytd expenditure recorded for capitals works was $51.4m at the end March,consisting of $36.3m actual costs and $15.1m committed costs.
Buildings ended the month with total spend of $7.4m, an increase of $1.7mon February's closing balance. To date, Altone Place Office has contributed$1.1m to the total spend while works for the Altone Park Leisure Centre havecontributed $1.5m.
Total spend for Roads was $20.1m against ytd budget of $33.5m with Hazelmere Industrial Area Infrastructure Area contributing $3m, EllenbrookBridge $4.7m, Lord Street $1.7m and Stoneville Road $955k.
Parks have expended 74% or $6.9m of their ytd budget of $9.4m.Significant expenditure was noted for Chequers Club Bore/Irrigation $1.4mand Midland Oval Masterplan $952k.
The OneCouncil project has utilised $1.3m of its $2.6m annual budget.
0
200
400
600
800
1,000
Current > 30Days
> 60Days
> 90Days
$000
's
Trade Debtors
February March
AAA 38%
AA+ to AA- 10%
A+ to A-
53%
Total trade debtors increased by 20% compared toFebruary. The 30 Day debtors increased by 926% dueto a number of unpaid invoices moving from theCurrent Debtors. The 60 Day Debtors has decreasedby 47% partly due to invoices being paid and partly dueto some unpaid debtors moving into the 90 Days,resulting in a 6% increase.
The fourth instalment and the third batch of interimswere both due in March, resulting in a reduction inRates Debtors excluding Emergency of $12.6m or 42%.A further decrease in outstanding rates is expected asdebt collection is continuing.
2.1
AASB 101.8 requires a financial report to include a "Statement of Comprehensive Income". The definition of "IncomeStatement" at Financial Management Regulation 3 is "income statement (or equivalent) that meets therequirements of Australian Accounting Standards for income statements". By virtue of the changes to terminology inAASB101, we now refer to the "income statement" as the "statement of comprehensive income" as that is the"equivalent" in the context of the Australian Accounting Standards.
The Statements of Comprehensive Income summarise the operating revenue and expenditure for a particular periodof a financial year. The principle aim of these financial statements are to report on the performance of the City inmeeting the approved budgets in both revenue and expenditure terms. An important aspect of The Statements ofComprehensive Income is the exclusion of capital and infrastructure project expenditure. There are two versionsthat are prepared with each presenting information in two distinct forms.
The first Statement of Comprehensive Income is by Nature & Type as prescribed by the Financial ManagementRegulations Schedule 1 Part 2 that ensures compliance with statutory requirements. The report categorisesrevenues and expenses into easy to understand types based on the nature of the individual revenue or expense. Forexample employee costs are made up of not only salaries and wages but also casual labour, labour hire, staffrecruitment, staff training etc.
The second Statement of Comprehensive Income is by Program. Since the withdrawal of AAS 27, AASB 1052.11(b)now governs the disclosure requirements relating to income and expenditure by program (function / activity). Thereport aims to give the reader information on what activity within the community revenue is generated from andwhere money is spent. For example the General Purpose Funding program is where most revenue is generated fromrates, the main source of local government funds. In regards to expenditure the program titled Recreation & Cultureoften has the greatest outlay. This program includes costs associated with operating Libraries, Leisure Centres,Street Lighting, maintaining Parks & Reserves and City owned Buildings.
Both reports calculate variances based on the Current Revised Budget. The actual figures for the year to date arecompared to the year to date current revised budget to present a monetary variance as well as a the variance shownas a percentage of the budget.
The following report on significant variances refers to those variances in the Statement of Comprehensive Income byNature and Type.
2.0 Statements of Comprehensive Income2.0 Statements of Comprehensive Income

2.2
Original Budget
2017/18
Revised Budget
2017/18
YTD CURRENTREVISED BUDGET
@ 31 MARCH 2018
YTD ACTUAL@ 31 MARCH 2018
$ VarianceVAR
NOTE
% VAR / CURRENT BUDGET
Revenue from Ordinary Activities122,963,766 122,963,766 Rates Revenue 122,767,566 121,367,091 (1,400,475)
1,212,300 1,212,300 Service Charges 1,212,300 1,228,095 15,79537,490,460 37,748,180 Fees & Charges 34,093,944 34,476,916 382,97210,069,900 7,511,050 Operating Grants, Subsidies & Contributions 5,592,110 5,698,059 105,949
5,364,050 5,364,050 Interest Earnings 4,340,546 4,493,923 153,376923,340 1,184,610 Other Revenue 945,370 882,113 (63,257)
178,023,816 175,983,956 Sub-Total Ordinary Revenue 168,951,837 168,146,197 (805,640)
Expenses from Ordinary Activities(76,251,490) (76,629,510) Employee Costs (56,890,363) (54,184,943) 2,705,420(36,884,430) (35,899,870) Materials & Contracts (26,791,019) (20,669,123) 6,121,896 F 23%
(6,985,990) (7,125,990) Utility Charges (5,265,833) (4,477,180) 788,652 F 15%(34,877,410) (34,761,080) Depreciation on Non-Current Assets (26,041,728) (25,380,313) 661,414
(2,202,850) (2,050,500) Interest Expenses (1,499,787) (1,250,556) 249,231 F 17%(604,260) (607,710) Insurance Expenses (767,190) (96,505) 670,685 F 87%
(1,970,172) (1,970,262) Other Expenses (1,512,594) (1,379,667) 132,927
(159,776,602) (159,044,922) Sub-Total Ordinary Expenses (118,768,514) (107,438,289) 11,330,225
18,247,214 16,939,034 Ordinary Activities 50,183,323 60,707,908 10,524,585
Add Non-Ordinary Activities8,954,380 15,202,380 Non-Operating Grants, Subsidies & Contributions 13,561,450 9,527,753 (4,033,697) U 30%
18,250,000 18,250,000 Non-Operating Gifted Assets from Developers: Other - - -7,689,610 7,689,610 Developer Contribution Plans: Cash 5,767,208 8,086,883 2,319,675 F (40%)4,878,730 4,878,730 Developer Contribution Plans: In Kind - - -
(1,606,700) (1,606,700) Land Ceded to the Crown - - -1,262,960 1,262,960 Profit / (Loss) on Disposal of Assets 947,220 1,119,568 172,348 F (18%)
- 4,000 Profit / (Loss) on Impairment of Investments 4,000 3,939 (61)5,000,000 5,000,000 Unrealised Gain from Other Financial Assets: EMRC - - -
62,676,194 67,620,014 Net Result 70,463,203 79,446,052 8,982,85562,676,194 67,620,014 Total Comprehensive Income 70,463,203 79,446,052 8,982,855
Financial Ratios 2015 2016 2017 Current Month
OPERATING SURPLUS RATIO 22.00% 23.00% 26.00%
DEBT SERVICE COVER RATIO 13.73 8.93 9.93
OWN SOURCE REVENUE COVERAGE RATIO 1.10 1.15 1.16
The Operating Surplus Ratio highlights the extent of the operating surplus (deficit) relative to the revenues of the Council. This is an indicator of the extent to which revenue raised cover operational expenses and is available for capital funding purposes. The higher the ratio the more financial capacity to deal with asset renewal before reliance on external sources of revenue. A ratio above 15% is considered low risk - an indication that own source income is available to fund capital expenditure initiatives over and above depreciation. A ratio below 0% is considered high risk. The year to date ratios will vary considerably from year end results.
STATEMENT OF COMPREHENSIVE INCOME BY NATURE OR TYPE CITY OF SWAN
FOR THE PERIOD 1 JULY 2017 to 31 MARCH 2018
The Own Source Revenue Coverage Ratio measures the local government's ability to cover operating expenses from own source revenue. The higher the ratio, the more self reliant the City will be. This allows greater flexibility as less external funds are required for operational purposes. A ratio above 0.90 is considered low risk and less than 0.60 high risk.
The Debt Service Cover Ratio measures the ability to service debt. Also known as 'debt coverage ratio', this is the ratio of cash available for debt servicing to interest, principal and lease payments from the operations of the City. A ratio below 2.00 should be monitored carefully. A ratio above 5.00 is considered low risk. The higher the ratio, the better the City's financial capacity to meet the debt servicing commitments.
37.87%
14.84
1.51

2.3
Original Budget
2017/18
Revised Budget
2017/18
YTD CURRENTREVISED BUDGET
@ 31 MARCH 2018
YTD ACTUAL@ 31 MARCH 2018
$ VarianceVAR
NOTE
% VAR / CURRENT BUDGET
Revenues from Ordinary Activities133,778,476 131,260,876 General Purpose Funding 128,704,845 128,156,640 (548,205)
159,710 353,710 Governance 305,377 284,693 (20,684)2,330,330 2,330,330 Law Order & Public Safety 2,119,385 1,962,300 (157,085)
267,000 294,000 Health 227,250 309,551 82,301 F (36%)4,329,660 4,385,660 Education & Welfare 3,806,942 3,394,131 (412,812) U 11%
60,000 60,000 Housing 45,000 46,258 1,25823,444,130 23,444,130 Community Amenities 23,106,655 23,745,729 639,074
7,105,090 7,299,030 Recreation & Culture 5,537,067 5,482,698 (54,370)1,894,300 1,831,100 Transport 1,487,975 1,490,180 2,2051,660,000 1,700,000 Economic Services 1,335,000 1,353,592 18,5922,995,120 3,025,120 Other Property & Services 2,276,340 1,920,426 (355,914) U 16%
178,023,816 175,983,956 Sub-Total Revenue 168,951,837 168,146,197 (805,640)
Expenses from Ordinary Activities Excluding Borrowing Costs
(2,624,696) (2,622,466) General Purpose Funding (1,830,291) (1,721,149) 109,142(13,001,821) (13,547,551) Governance (10,148,908) (7,912,464) 2,236,444 F 22%
(6,242,648) (6,163,358) Law Order & Public Safety (4,604,451) (4,429,429) 175,022(1,847,676) (1,852,216) Health (1,390,297) (1,325,044) 65,253(9,761,478) (9,846,728) Education & Welfare (7,441,233) (6,639,327) 801,906 F 11%
(109,399) (109,399) Housing (82,049) (68,346) 13,704 F 17%(26,227,492) (26,121,562) Community Amenities (19,554,187) (17,245,422) 2,308,765 F 12%(54,220,840) (55,685,200) Recreation & Culture (42,233,296) (38,746,395) 3,486,900(33,722,432) (31,672,762) Transport (23,064,653) (20,627,453) 2,437,200 F 11%
(6,357,420) (6,365,140) Economic Services (4,775,785) (3,990,266) 785,519 F 16%(3,457,850) (3,008,040) Other Property & Services (2,143,577) (3,482,439) (1,338,862) U (62%)
(157,573,752) (156,994,422) Sub-Total Non-Borrowing Expense (117,268,726) (106,187,732) 11,080,993
Borrowing Costs Expense(533,280) (543,480) Governance (410,160) (319,484) 90,676 F 22%(802,680) (688,460) Recreation & Culture (487,790) (415,193) 72,597 F 15%(434,420) (391,310) Transport (282,705) (254,186) 28,519 F 10%
(14,500) (9,280) Economic Services (5,655) - 5,655 F 100%(417,970) (417,970) Other Property & Services (313,477) (261,693) 51,784 F 17%
(2,202,850) (2,050,500) Sub-Total Borrowing Costs (1,499,787) (1,250,557) 249,231
18,247,214 16,939,034 Net Operating Result 50,183,323 60,707,908 10,524,586
Non-Operating Grants, Subsidies & Contributions12,568,340 12,568,340 Governance 5,767,208 8,086,883 2,319,675 F 40%
677,630 168,810 Law Order & Public Safety (597) 30,000 30,597 F (5121%)267,300 267,300 Education & Welfare 200,475 100,419 (100,056) U (50%)
1,537,500 4,440,570 Recreation & Culture 3,118,695 3,145,726 27,03124,721,950 28,575,700 Transport 10,242,877 6,251,608 (3,991,270) U (39%)39,772,720 46,020,720 19,328,658 17,614,635 (1,714,022)
Land Ceded to the Crown(236,237) (236,237) Recreation & Culture - - -
(1,370,463) (1,370,463) Transport - - -(1,606,700) (1,606,700) - - -
Profit/(Loss) on Disposal of Assets1,047,700 1,047,700 Recreation & Culture 785,775 693,987 (91,788) U (12%)
215,260 215,260 Transport 161,445 425,444 263,999 F 164%1,262,960 1,262,960 947,220 1,119,568 172,348
Profit/(Loss) on Impairment of Investments- 4,000 General Purpose Funding 4,000 3,939 (61)
Unrealised Gain from Other Financial Assets: EMRC5,000,000 5,000,000 General Purpose Funding - - -
62,676,194 67,620,014 Net Result 70,463,203 79,446,052 8,982,85562,676,194 67,620,014 Total Comprehensive Income 70,463,203 79,446,052 8,982,855
FOR THE PERIOD 1 JULY 2017 to 31 MARCH 2018
STATEMENT OF COMPREHENSIVE INCOME BY PROGRAM CITY OF SWAN

3.1
Description
2. Statement of Change in Equity
Financial Ratios 2015 2016 2017 Current MonthCURRENT RATIO 1.67 1.34 1.74 6.43
QUICK RATIO 1.67 1.34 1.73 6.41
UNTIED CASH TO TOTAL CREDITORS 5.50 2.72 3.07 20.95
1. Statement of Financial Position
AASB 101 requires all Councils to prepare a Statement of Financial Position, which discloses the assets, liabilities and equity ofthe Council as at the reporting date. The ratepayer equity in the Council can be calculated by deducting total liabilities from totalassets.
The purpose of the Statement of Financial Position is to provide a "snap - shot" of the overall financial position of the Council asat a particular date. An entity shall present current and non-current assets, and current and non-current liabilities, as separateclassifications on the face of its balance sheet and on the basis of liquidity. Subject to special requirements for revaluation ofvarious classes of assets, accepted accounting practice includes well defined accounting principles. This convention dictates thatan asset represents the value of an investment acquired to provide future economic benefit to an entity. The future economicbenefits may be in the form of cash or cash equivalents or in the case of not-for-profit (including public sector) entities, theeconomic benefits are derived from meeting the entities objectives of providing goods and services.
Councils are required by AASB 101 to prepare a Statement of Changes in Equity and include it in the Financial Statements. TheStatement of Changes in Equity reconciles the opening and closing balances of each class of the local government's equity overthe reporting period. It provides a summary of causes of the changes in equity and identifies specifically the changes incomposition of the local government's equity.
A Quick Ratio measures the short - term debt paying ability and the liquid position of the City of the Swan and the ability to pay its immediate debts with restricted assets and inventories removed from the calculation. The ratio should be greater than 1.00 (100%).
This ratio assesses the City's ability to meet immediate commitments from readily available cash. Trade creditors include orders for goods and services that have been received but not paid and any amount owing for GST. The higher the ratio the better placed Council is to pay its Creditors. This ratio is always at its lowest point at the end of the financial year and the beginning of the new financial year as much of the cash reserves of the City has been expended by this time and collection of rates revenue is yet to accelerate. This ratio has improved over the last couple of years with an improvement in net funds available at the end of the year.
A Current Ratio shows short - term paying ability with restricted assets removed from the current assets. It relates to the immediate financial sustainability of Council. A ratio greater than 1.00 (100%) indicates Council has more current assets than current liabilities. If less than 1.00 (100%), current liabilities are greater than current assets and there may be a short term funding issue.
3.0 Statement of Financial Position & Equity

3.2
ACTUAL @31 MARCH 2018
ACTUAL @30 JUNE 2017
Current AssetsCash and cash equivalents 185,681,211 137,263,976Trade and other receivables 21,025,296 12,020,193Assets held for sale 7,847,019 7,847,019Inventories 282,332 263,351Other Assets 249,820 1,361,018
Total: Current Assets 215,085,678 158,755,558
Non Current AssetsTrade and other receivables 2,874,993 2,557,676Other Financial Assets 123,809 123,809Property, plant and equipment 1,506,322,970 1,496,808,837Interest in Joint Venture 67,074,404 67,074,404
Total: Non Current Assets 1,576,396,177 1,566,564,726
Total Assets 1,791,481,855 1,725,320,284
Current LiabilitiesShort term borrowings 1,673,318 6,306,981Trade and other payables 7,273,603 19,709,420Income in advance 2,194,724 -Provisions 13,728,656 13,504,458
Total: Current Liabilities 24,870,300 39,520,859
Non Current LiabilitiesLong term borrowings 40,678,507 40,678,507Trade and other payables 3,680,057 2,763,739Provisions 2,003,344 1,553,590
Total: Non Current Liabilities 46,361,907 44,995,836
Total Liabilities 71,232,209 84,516,695
NET ASSETS 1,720,249,644 1,640,803,589
Equity AccountsAccumulated Surplus 1,026,882,611 962,366,880Asset Revaluation Reserves 579,235,039 579,235,039Cash Backed Reserves 114,131,994 99,201,670
TOTAL EQUITY 1,720,249,644 1,640,803,589
CITY OF SWANSTATEMENT OF FINANCIAL POSITION
AS AT 31 MARCH 2018

3.3
RETAINEDSURPLUS
ASSET REVALUATION RESERVES
RESERVES CASH / INVESTMENT BACKED
TOTALEQUITY
Balance as at 30 JUNE 2015 801,837,255 448,062,744 83,920,394 1,333,820,394
Net Result 106,487,074 - - 106,487,074
Transfer from Retained Surplus to Revaluation Surplus (13,060,059) 13,060,059 - -
Total Other Comprehensive Income - 2,153,738 - 2,153,738
Transfer from/(to) Reserves (13,278,185) - 13,278,185 -
Balance as at 30 JUNE 2016 881,986,085 463,276,541 97,198,580 1,442,461,207
Net Result 82,383,885 - - 82,383,885
Total Other Comprehensive Income - 115,958,498 - 115,958,498
Transfer from/(to) Reserves (2,003,091) - 2,003,091 -
Balance as at 30 JUNE 2017 962,366,880 579,235,039 99,201,670 1,640,803,589
Net Result 79,446,052 - - 79,446,052
Total Other Comprehensive Income - - - -
Transfer from/(to) Reserves (14,930,326) - 14,930,326 -
Balance as at 31 MARCH 2018 1,026,882,611 579,235,039 114,131,993 1,720,249,644
ADDITIONAL DISCLOSURE ON CASH HOLDINGS, INVESTMENTS, RESERVES & MUNICIPAL FUNDS31-Mar-18 30-Jun-17
Cash / Investment Backed Reserves
Aged Services Asset Replacement 421,124 282,837
City Asset Replacement 10,257,944 8,413,172
Ellenbrook Community Facilities 71,516 271,377
Aveley Community 1,776,517 1,679,857
General Insurance 500,000 500,000
Gravel Pit Rehabilitation 528,080 410,870
Hazelmere/Guildford Drainage 1,177,598 929,841
Midland District Drainage Development 3,263,960 3,898,174
Plant & Equipment Reserve 10,207,411 6,208,660
Waste Management 10,921,122 7,406,909
Employee Entitlements - LSL 9,741,802 7,713,071
Hazelmere Industrial Area Infrastructure - Stage 2 6,213,821 4,053,893
Ellenbrook Bridge 2,014,122 1,955,533
Strategic Development 525,644 3,365,822
Urban Growth Corridor Sub-Regional Contributions
- Brabham (Albion) 18,742,689 16,411,604
- Caversham 6,659,170 7,266,845
- Dayton (West Swan East) 23,615,127 23,420,087
- West Swan West 3,511,762 -
Other Restricted Assets
- Drainage 69,584 69,584
- Footpath 242,258 242,258
- Malaga Parking 278,250 197,000
- Midland Parking 35,000 35,000
- Ellenbrook Parking 121,535 64,784
- Roadwork 2,764,225 2,530,518 - Unspent Specific Grants - 1,135,987
- Public Art 471,729 737,987
Sub total Cash / Investment Backed Reserves 114,131,993 99,201,672Add: other restricted cash / investment assets (i.e Bonds) 3,680,057 4,109,931Total of restricted cash / investment assets 117,812,050 103,311,605Add: Unrestricted cash / investment assets (i.e. MUNI funds) 67,869,161 33,952,372TOTAL CASH AND CASH EQUIVALENTS / INVESTMENTS 185,681,211 137,263,976
Consisting of: Cash and Cash Equivalents 185,681,211 137,263,976
185,681,211 137,263,976
FOR THE PERIOD 1 JULY 2017 to 31 MARCH 2018
CITY OF SWANSTATEMENT OF CHANGES IN EQUITY

4.1
Comments Swan Park Recreation Centre recorded costs of $349k in March, realising 64% or $439k of its $686k annual budget. The
project is still at design stage with construction works anticipated to commence in 2018/19.
Expenditure for Lord street is $1.7m compared to its annual budget of $5.6m. The scope of works includes construction of Daviot Road extension between Patricia Street and Benara Road. Drainage works commenced in January and are progressing, but majority of works will be carried forward into 2018/19.
Construction works have commenced for the Altone Place office which recorded total expenditure of $1.1m in March, resulting in ytd spend of $1.1m against annual budget of $2.2m. Scope of works includes alterations and additions of the Atlone Park Leisure Centre to amalgamate it with the existing Library and Place office into one 'Place Hub'. Works are progressing well and completion is expected in September 2018.
To date, Ellenbrook Bridge has recognised $4.7m of its $6.8m annual budget. Construction of the bridge and the Railway Parade is developing well. The beams were installed in March and installation of the sub base for the Railway Parade has been finalised. Works are expected to be finished in June 2018.
Hazelmere Road has total spend of $3m compared to annual budget of $5.6m at the end of the reporting period. The construction of Lloyd Street between Stirling Crescent and Lakes Road has been completed. However, construction between Stirling Crescent and Lakes Road which was scheduled for the current financial year has been delayed and will be carried forward into 2018/19. This is due to a pending decision by Main Roads WA which will impact on construction works for this section of the road.
4.0 Capital
0
20
40
60
80
100
120
July Aug Sep Oct Nov Dec Jan Feb March April May June
Mill
ions
$
Capital Expenditure - Actual v Budget with Prior Year comparison
Actual 17/18 Budget 17/18
Prior Year Actual Prior Year Budget
0
5
10
15
20
25
30
35
40
Buildings Drainage Footpaths Parks Roads P&E, Other
Mill
ions
$
YTD Capital Works expenditure Actual & CommittedBudget

Current Budget YTD Expense Current Budget
JobNumber
JobName
FullYearExpense Actual Commited Total % of
BudgetFullYearRevenue
YTDRevenue
% ofBudget
BCW04134 Administration Building 500,000 10,129 73,606 83,735 17
BCW05104 Altone Park Library 185,340 70,909 3,405 74,315 40
BCW05106 Community Facilities 200,000 76,923 102,448 179,371 90
BCW05110 Midland Town Hall Build Imp 360,000 376,926 7,000 383,926 107
BCW05114 Minor Capital Building Projec 125,000 74,536 10,402 84,937 68
BCW05120 Extension to Hamersley House 47,000
BCW05122 Swan Caring Aged Care Facilit 12,730 13,486 13,486 106 11,070 10,066 91
BCW05130 Midland Library 38,000 32,966 32,966 87
BCW05131 Midland Lotteries 141,620 142,272 10,146 152,418 108
BCW05137 Altone Park Leisure Centre 1,460,500 1,411,021 77,365 1,488,385 102 13,500
BCW06110 Ballajura Aquatic Centre 137,860 84,709 24,222 108,931 79
BCW06121 Toilet Building Renewal 26,000 6,028 6,028 23
BCW07103 West Swan Home Supp 30,000
BCW07106 Bellevue Hall 47,000 5,704 5,704 12
BCW07108 Swan Park Recreation Centre 686,163 78,495 360,200 438,695 64
BCW07115 Roof Safety Access Systems 39,740 559 559 1
BCW07116 Airconditioner Renewal Progra 84,800 44,054 6,914 50,968 60
BCW07117 Lock & Key Replacement Progra 354,000 5,141 218 5,359 2
BCW07122 South Ballajura Com Centre 37,500 38,567 38,567 103
BCW07124 Midland Sports Complex 37,260 2,599 2,599 7 40,000
BCW08109 Bullsbrook Waste Transfer Sta 200,000 21,622 21,622 11
BCW08114 Alice Daveron Centre 60,000 6,771 52,992 59,763 100
BCW08115 Ballajura Library 50,000
BCW08118 Guildford Library 2,420 2,740 610 3,350 138
BCW08120 Midland Youth Services Hub 284,889 247,120 1,170 248,290 87 1,675,000 1,675,000 100
BCW09102 Bus Shelters 140,000 11,082 11,082 8 37,500
BCW09104 Bin Compounds 23,000 16,213 16,213 70
BCW09105 Energy Conservation Measures 142,000 2,731 8,258 10,989 8 10,000
BCW09106 Switchboards Renewal 2,000 834 834 42
BCW10101 Asbestos Management Program 132,500 139,611 2,830 142,441 108
BCW10102 Integrated Systems Program 1,184,774 263,402 109,194 372,596 31
BCW10106 Equipment Fire System Safety 16,000 5,652 5,652 35
BCW10110 Guildford Mechanics Institute 47,000
BCW11106 Ellenbrook Leisure Centre 649,000 92,800 146,056 238,856 37
BCW11107 Ellenbrook Resource Centre 50,000 20,270 19,656 39,926 80
BCW11109 Building Disposal 90,000 74,812 15,544 90,356 100
BCW11112 Malvern Springs Community Cen 115,000 115,000 115,000 100
BCW12102 Ethel Warren Bullsbrook CC 559,000 112,392 66,561 178,953 32 500,000 500,000 100
BCW13101 Ballajura Place Office 1,611,830 84,985 114,758 199,743 12
BCW13107 Old Mechanical Workshop 109,000
BCW14101 Altone Place Office 2,210,200 58,818 1,064,314 1,123,132 51
BCW14103 DCP-Brabham Community Centre 33,750 33,750
BCW14104 Dayton Community Centre 327,020 11,473 11,473 4
BCW14109 Operations Centre 4,424,197 24,714 193,660 218,374 5
BCW14110 Midland/Guildford Cricket Clu 42,000 8,420 65,894 74,313 177
BCW15001 Hazelmere Hall 690,000 117,123 183,820 300,943 44 100,000 100,000 100
BCW15002 Koongamia Pavilion 139,500
YTD CAPITAL JOBS SUMMARY REPORT FOR THE PERIOD ENDING 31 MARCH 2018
6/04/2018 10:20:38 AM

Current Budget YTD Expense Current Budget
JobNumber
JobName
FullYearExpense Actual Commited Total % of
BudgetFullYearRevenue
YTDRevenue
% ofBudget
BCW15003 Lowery Park Pavilion 227,000 56,371 48,303 104,674 46
BCW15004 East Gidge Fire Station 303,751 304,440 1,487 305,927 101
BCW15005 District Park Active- Buildin 306,000 13,478 72,191 85,669 28
BCW16101 Stafford Court Training Room 25,000 21,098 21,098 84
BCW16104 Malaga Transfer Station 20,000 288 288 1
BCW16106 PA Midland Youth Hub 64,245 16,675 34,704 51,379 80
BCW16108 Waterhall Park 20,000 807 807 4
BCW16109 PA Bullsbrook Community Centr 33,030
BCW16110 Depot Chemical Shed 110,000 2,484 94,436 96,920 88
BCW17101 Altone Community Hub 50,000 28,060 28,060 56 50,000
BCW17102 Chequers Golf Club 30,000
BCW17103 West Gidgegannup Fire Station 50,000 2,039 5,971 8,009 16
BCW17104 Lilac Hill Public Toilets 274,000 1,192 1,192
BCW17105 Ron Jose Park Pavilion 120,000
BCW17106 SV & Eastern Visitor Centre 25,000
BCW17107 West Swan Hall 47,000 9,757 21,336 31,093 66
BCW17108 Guildford Potters 47,000
BCW17109 West Bullsbrook Hall 30,000 8,515 1,200 9,715 32
BCW17110 Recycling Facility Jack Willi 30,000
BCW17112 PA Altone Place Hub 98,000
BCW17113 PA Percy Cullen Pavilion 35,000 858 4,000 4,858 14
BCW17114 Interim Ellenbrook Youth Cent 190,000
BCW Building Capital Works 19,986,869 4,311,799 3,106,491 7,418,289 37 2,373,570 2,348,566 99
DRN04213 Midland Drainage 100,000 119,125 12,671 131,796 132
DRN07209 Morrison Road/Poynton Ave 185,000 319,177 319,177 173
DRN08203 Hazelmere/Guildford Drainage 140,000 53,613 1,650 55,263 39
DRN13203 Ewart Street Midland 1,355 1,355
DRN13209 Other Drainage Upgrades 430,000 247,370 4,013 251,383 58
DRN14202 Beverley Terrace Loader Way 430,000 440,970 28,416 469,386 109
DRN14203 Elvire Street 132 132
DRN15005 First Avenue 125,000 120,319 120,319 96
DRN15012 Bushby Street 776,400 708,481 74,871 783,352 101
DRN15014 Bellevue Heritage Railway 100,000 12,057 20,540 32,597 33
DRN16203 Byers Road 55,000 75,938 75,938 138
DRN16208 William Street 260,000 286,647 3,953 290,600 112
DRN16209 Burgess Street 100,000 99,379 3,409 102,788 103
DRN17201 Albert Street 561,000 35,189 29,240 64,428 11
DRN17202 Alice Street 363,000
DRN17203 Hackett Street 264,000 601,746 39,761 641,508 243
DRN17204 Kensington Street 133,100
DRN17205 Mount Street 177,100
DRN17206 Sophia Street 94,600 56 56
DRN17210 Sanderling Grove 180,000 73,652 30,304 103,956 58
DRN17211 Spring Park Road 200,000 201,858 201,858 101
DRN Drainage 4,674,200 3,397,063 248,828 3,645,892 78 0 0 0
FTP06502 Footpaths New 170,000 133,783 5,867 139,651 82
YTD CAPITAL JOBS SUMMARY REPORT FOR THE PERIOD ENDING 31 MARCH 2018
6/04/2018 10:20:38 AM

Current Budget YTD Expense Current Budget
JobNumber
JobName
FullYearExpense Actual Commited Total % of
BudgetFullYearRevenue
YTDRevenue
% ofBudget
FTP06505 Footpath Replacements 265,000 78,954 78,954 30
FTP09501 Swan Cycle Planning Project 416,850 399,777 8,906 408,683 98 200,000 80,000 40
FTP10101 Universal Access - Footpath 34,000 25,293 1,295 26,588 78 4,000 4,000 100
FTP13501 Farrall Road Footpath 40,000
FTP16501 Cranleigh Street 162,320
FTP16502 DCP - Suffolk Street 46,900 2,540 21,199 23,740 51
FTP Footpaths 1,135,070 640,348 37,267 677,616 60 204,000 84,000 41
GRP04100 Gravel Pit 20,000 48,273 910 49,183 246 155,726
GRP Gravel Pit 20,000 48,273 910 49,183 246 0 155,726
PEQ07100 Internal Build P & E 44,000 12,421 6,820 19,241 44
PEQ08104 CCTV - Safer Suburbs 1,138,090 138,810
PEQ10104 Website Development - SVC 82,210 27,405 54,810 82,215 100
PEQ13102 COS Website Maintenance 64,000 12,500 12,500 20
PEQ14103 User Generated Content System 30,000
PEQ14104 Herne Hill - Telecomunication 677,270 243,627 408,460 652,088 96
PEQ15000 Fire Fighting Assets 40,000 19,692 5,909 25,601 64
PEQ15003 One Council Implementation 2,561,820 973,934 354,978 1,328,913 52
PEQ16101 DCP Software 72,000 26,950 100 27,050 38
PEQ16102 Leisure System Replacement 396,000 22,823 74,119 96,942 24
PEQ16103 Midland Town Hall Sound Syste 300,000 37,352 37,352 12
PEQ16104 Radio Frequency ID Equipment 62,400 65,952 65,952 106
PEQ16105 Sea Containers 96,200 76,941 20,086 97,027 101
PEQ16108 People Counter 5,000 200 200 4
PEQ16111 Waste Management Systems 60,000 40,400 40,400 67
PEQ17101 Library Services - Futures La 56,490 32,204 5,600 37,804 67
PEQ17102 Brigade Equipment Upgrade 30,000 30,000 30,000 100
PEQ Plant & Equipment 5,715,480 1,555,048 968,234 2,523,285 44 168,810 30,000 18
PRK04313 Percy Cullen Oval 50,000 15,958 1,144 17,102 34 50,000
PRK04324 Residential Street Trees 60,000 30,615 30,615 51
PRK04326 Minor Park Furniture 20,000 18,149 1,615 19,764 99
PRK04328 Rural Street Trees 20,000 4,724 11,691 16,416 82
PRK05304 Parks & Streetscapes Minor 202,000 185,030 1,190 186,220 92
PRK05307 Swan Regional Riverside Park 110,000 2,486 2,486 2 10,000 10,000 100
PRK05309 Tourism Signage 125,000 15,279 31,946 47,225 38 50,000 24,568 49
PRK05311 Emu Lake Restoration 374,000 21,202 31,012 52,214 14
PRK05317 Playgrounds - Ellenbrook 40,250
PRK05329 Ron Jose Oval 470,000 74 993 1,067 350,000 350,000 100
PRK06309 Baskerville Oval 362,000
PRK06318 Playgrounds - Aveley 692,300
PRK07309 Kings Meadow 100,000 53,823 10,863 64,687 65
PRK08302 Bellevue Landscape Upgrade 250,000 246,485 246,485 99
PRK08307 Bushland Fencing 328,000 33,516 27,401 60,917 19 2,000 1,998 100
PRK08308 Gazebo Replacement 206,500 40,287 51,185 91,472 44
PRK08318 Public Art 90,830 27,176 3,408 30,583 34
PRK09302 Chequers Club Bore/Irrigation 1,407,000 1,164,922 217,574 1,382,496 98
YTD CAPITAL JOBS SUMMARY REPORT FOR THE PERIOD ENDING 31 MARCH 2018
6/04/2018 10:20:38 AM

Current Budget YTD Expense Current Budget
JobNumber
JobName
FullYearExpense Actual Commited Total % of
BudgetFullYearRevenue
YTDRevenue
% ofBudget
PRK09305 City Gateways Project 330,000 282,102 2,280 284,382 86
PRK10102 Playspace Replacemet Pgm 475,000 134,467 128,492 262,960 55 255,000 255,000 100
PRK11101 Regional Open Space - Whitema 40,400 33,161 33,161 82
PRK11102 Reticulation/Hydrozoning 372,000 142,178 100,996 243,173 65
PRK11108 Swan View Oval 146,500 14,206 2,209 16,415 11 100,000 100,000 100
PRK13309 Sports Oval Lighting 110,000 41,204 37,496 78,700 72
PRK13311 John Stone Park 10,000 4,860 31,845 36,705 367
PRK14304 Bennett Springs Park 300,000 278,562 278,562 93 43,436
PRK14307 District Park Active 650,000 207,156 242,308 449,464 69
PRK14308 Foreshore Restoration (5,774)
PRK14310 Midland Oval Master Plan 1,000,000 681,757 270,706 952,463 95
PRK14311 Parks Electrical Infrastructu 217,000 220,560 19 220,580 102
PRK14315 Annies Landing Playgrounds 46,000
PRK15006 Dayton Local Park - Passive 350,000 10,191 46,718 56,909 16
PRK15007 Caversham Oval - DCP 200,000 789,345 7,340 796,685 398
PRK16302 Dayton Neighbourhood Park 1,500,000 8,572 8,572 1
PRK16303 Aveley Outdoor Fitness Equip. 172,500
PRK16305 Koongamia Oval Bore Replaceme 150,000
PRK16308 Sherlock Park 235,000 44,582 44,582 19
PRK16309 PA Ellenbrook DOS South 115,290 89,146 2,910 92,056 80
PRK16310 PA Waterhall Park Playspace 70,000 47,654 6 47,660 68
PRK17301 City of Swan Signage Impmts 50,000
PRK17302 Electronic Bushfire Signs Gid 65,000 64,817 64,817 100
PRK17303 Foreshore Restrn-Woodbridge P 128,000 360,844 7,560 368,404 288
PRK17304 Foreshore Restrn-Loder Way 75,000 13,895 13,895 19
PRK17305 Foreshore Restrn-Lilac Hill 138,000 103,415 61,661 165,076 120
PRK17306 Foreshore Restrn-Wangalla Brk 65,000 11,985 12,069 24,053 37
PRK17309 Foreshore Restrn-Middle Swan 192,000 69,102 69,102 36
PRK17310 Foreshore Restrn-St Equestria 70,000 40,804 6,637 47,441 68
PRK17311 Foreshore Restrn-Eveline Rd 7,000 6,611 6,611 94
PRK17312 Central Park Toilets 120,000
PRK17313 Lassen Park 96,000
PRK17314 Gidgegannup Basketball Crt 15,000 10,638 10,638 71
PRK17315 PA Ellenbrook UrbanMur PP Tab 19,000 6,725 6,725 35
PRK17316 PA Stirling Square Light Hors 100,000 13,201 5,000 18,201 18
PRK17317 PA Swan Valley Art Trail 10,000
PRK Parks 12,547,570 5,314,364 1,633,374 6,947,741 55 817,000 779,227 95
RDN04403 The Promenade 850,000 447,143 447,143 53
RDN04426 Chittering Road 195,000 92,631 65,211 157,842 81 163,330 25,333 16
RDN04433 Lord Street 1,000,000
RDN04446 West Swan Rd/ Millhouse Rd 1,518,600 39,551 12,417 51,967 3 826,400 826,400 100
RDN04447 West Swan Road 742,000 79,317 87,743 167,060 23 503,000 200,000 40
RDN04480 Robert Street 540,000 794,712 116,337 911,050 169
RDN05401 Midland Parking 50,000 985 6,576 7,561 15
RDN05402 Street Lighting Upgrades 412,600 233,290 233,287 100
RDN05405 Traffic Safety Minor Projects 50,000 19,881 19,881 40
RDN05423 Local Road Prog - City Wide 1,599,500
YTD CAPITAL JOBS SUMMARY REPORT FOR THE PERIOD ENDING 31 MARCH 2018
6/04/2018 10:20:38 AM
Current Budget YTD Expense Current Budget
JobNumber
JobName
FullYearExpense Actual Commited Total % of
BudgetFullYearRevenue
YTDRevenue
% ofBudget
RDN05457 O'Brien Road 70,000 10,310 42,174 52,484 75
RDN06404 Hepburn Avenue 40,000 40,310 40,310 101 12,180 12,175 100
RDN06410 Charles St/Frederic St 550,200 406,695 19,811 426,505 78 324,800 129,918 40
RDN06420 Bridge Works 313,330 313,330 156,667 50
RDN06421 Investigation,Design Projects 150,000 161,649 161,649 108
RDN06450 Lloyd Street 181,470 268,078 268,078 148
RDN07402 Local Roads Program -Testing 75,000 44,314 7,284 51,598 69
RDN07403 Contributions For Works To 200,000 15,083 137,475 152,558 76
RDN07429 Stoneville Road 600,000 792,320 162,585 954,905 159 600,000
RDN07435 Talbot Road 100,000 14,412 123,643 138,056 138
RDN07441 Blackadder Road 155,000 166,688 15,428 182,115 117
RDN07451 Warbrook Road 563 563 191,150 91,149 48
RDN07452 Lord Street 5,595,389 966,631 701,551 1,668,182 30 510
RDN08441 Campersic Road 375,000 368,937 368,937 98 250,000 245,958 98
RDN09403 Bellefin Drive 120,000 143,758 10,060 153,818 128
RDN09423 Altone Road 500,000 441,789 8,840 450,629 90
RDN09431 Oakover Road 47,000 43,240 43,240 92 31,335 28,827 92
RDN09441 Beach Road 100,000 111,974 111,974 112 100,000 110,923 111
RDN11201 Hazelmere Ind Area Infrast RD 5,051,524 2,413,779 632,513 3,046,292 60
RDN11203 DCP RABWest Swan Rd/Arthur S 570,550 13,762 13,762 2
RDN11401 Benara Road 75,000 38,384 21,640 60,024 80
RDN11426 Meadow Street 400,000 310,996 1,650 312,646 78
RDN12403 Henley Brook Avenue 791,200 718,566 75,000 793,566 100
RDN13204 Gnangara Road 450,000 92,601 358,338 450,939 100 1,323,250 1,030,188 78
RDN14201 Ellenbrook Bridge 6,789,860 2,145,595 2,560,817 4,706,413 69 2,125,000
RDN15006 GNH/Bishop Road 21,713 21,713
RDN16201 Helena River Footbridge 190,000 34,500 34,500 18 120,000
RDN16209 Millhouse Rd/Chateau Place RA 81,470 90,941 4,885 95,826 118
RDN16211 Moore Road 2,409 2,409
RDN16215 Drumpellier Drive 4,288,801 1,380,000 533,333 39
RDN16216 Benara Road, Intersection 970,690 10,270 365,504 375,774 39
RDN16219 Halden Road 74,440 72,073 72,073 97 576,100 576,101 100
RDN16220 Maralla Road 46,520 30,382 30,382 65 321,540 321,545 100
RDN16221 Cunningham Road 65,130 42,536 42,536 65 442,120 442,124 100
RDN17201 Barkers Bridge 965,820 281,256 39,093 320,349 33
RDN17202 West Swan Road Bridge 905,000 2,315 2,315 800,000
RDN17203 Susannah Brook Bridge 223,330 29,832 29,832 13 53,330
RDN17204 Woodbridge Creek Footbridge 25,000 11,718 11,718 47
RDN17205 Myles Road 501,130 160,491 84,871 245,362 49 197,420 78,968 40
RDN17206 Brookmount Drive 400,000 194,066 100,216 294,282 74
RDN17207 Burgess Road 100,000 2,904 2,904 3
RDN17208 Cruse Road 470,000 460,575 1 460,576 98
RDN17209 Dudley Street 90,000 11,329 77,500 88,828 99
RDN17210 Flecker Promenade 415,000 392,900 50,149 443,050 107
RDN17211 Haddrill Road 1,200,000 113,193 121,719 234,912 20 1,197,615
RDN17212 Oxleigh Drive 190,000 85,959 100,291 186,250 98
RDN17214 Reserve Road 89,000 18,276 50,211 68,487 77
RDN17215 Tondoon Bend 170,000 3,167 63,860 67,027 39
YTD CAPITAL JOBS SUMMARY REPORT FOR THE PERIOD ENDING 31 MARCH 2018
6/04/2018 10:20:38 AM

Current Budget YTD Expense Current Budget
JobNumber
JobName
FullYearExpense Actual Commited Total % of
BudgetFullYearRevenue
YTDRevenue
% ofBudget
RDN17216 Wilkins Street 100,000 13,261 18,110 31,371 31
RDN17218 Charlton Way/Papago Loop 20,000
RDN17219 The Broadway 125,000 90,459 12,930 103,389 83
RDN17220 Stock West Road 150,000 25,435 25,435 17
RDN17223 Marshall Road 809,300
RDN17224 Brigadoon Tennis Crts Car Par 30,000
RDN17225 Guildford Parking Infrastruct 25,000 3,823 3,823 15
RDN17226 Swan Park Leisure Ctr Car Par 330,000
RDN17227 Bennett Springs Oval Car Park 200,000 124,066 44,746 168,813 84
RDN17228 Car Park - Cnr Atley/Beringar 60,000
RDN17229 Narloo Street Car Park 120,000
RDN17230 Rowe Street Car Park 60,000 71,465 33,755 105,220 175
RDN17231 Parking Technology 75,000 1,944 1,944 3
RDN17232 Parklet Malaga 25,000
RDN17233 Infrastructure The Avenue 2,000,000
RDN17234 Truganina Road 50,000 68,223 267 68,490 137
RDN17235 Wilson Road 66,000 3,558 36,455 40,013 61
RDN17236 Chittering Road Bridge 63,180 63,176 63,176 100
RDN17237 Fredrick Street Bridge 21,000
RDN17238 West Swan Fire Station Asphal 180,000 53,314 53,314 30
RDN Roads 44,629,534 13,742,872 6,424,970 20,167,840 45 12,085,190 6,642,905 55
CAPITAL JOBS TOTAL 88,708,723 29,009,767 12,420,074 41,429,846 47 15,648,570 10,040,424 64
Current Budget
YTD Expense Current Budget
FullYearExpense
Actual Commited Total % ofBudget
FullYearRevenue
YTDRevenue
% ofBudget
1603 Purchase of Assets Land 9,077,750 2,261,950 2,261,950 25
1608 Purchase of Assets Buildings
1609 Purchase of Assets Comm Bus P 944,700 944,771 944,771 100
1613 Purchase of Asset Office F & 570,250 196,517 58,147 254,664 45
1618 Purchase of Assets P & E 6,673,470 1,905,332 2,184,623 4,089,955 61
1623 Purchase of Assets Computer 797,280 296,801 91,588 388,389 49
1628 Purchase of Assets Vehicle 1,965,530 1,522,305 363,136 1,885,441 96
1634 Purchase of Asset Other Rd In 81,362 81,362
1648 Purchase of Assets Other Infr 80,233 80,233
CAPITAL ASSETS TOTAL 20,028,980 7,289,272 2,697,494 9,986,766 50 0 0 0
GRAND TOTAL 108,737,703 36,299,039 15,117,569 51,416,608 47 15,648,570 10,040,424 64
YTD CAPITAL JOBS SUMMARY REPORT FOR THE PERIOD ENDING 31 MARCH 2018
6/04/2018 10:20:38 AM
5.1
4.0 DInvestments
ADI Lending Status Value Invested $Fossil Fuel lending ADI's
Comm Bank of Australia 17,881,211
National Australia Bank 31,700,000
Bank of Queensland 34,300,000
Westpac Group 20,200,000
ANZ Group 900,000
104,981,211 Non Fossil Fuel lending ADI's
23,100,000
33,500,000
5,400,000
18,700,000
80,700,000
Total Cash and cash equivalents 185,681,211
0
40
80
120
160
200
240
July Aug Sep Oct Nov Dec Jan Feb March April May June
Mill
ions
$
Total Cash and Investment Position showing Prior Year Comparisons
2015 2016 2017 20180
40
80
120
160
200
July Aug Sep Oct Nov Dec Jan Feb Mar April May June
Mill
ions
$
Cash and Investment Mix (by Type)
24 Hour Call Cash Management Floating Rate Term Deposits Cash
5.0 Cash and Investments
12%
18%
10%
18%
17%
3% 10%
11% 1% Investment Portfolio Exposure
Bendigo and Adelaide Bank - BENBank of Queensland - BoQCommonwealth Bank of Australia - CBA-BWAMembers Equity Bank - MEBNational Australia Bank - NABRural Bank - RURSuncorp Bank - SUNWestpac Group - WBC
(A-2, BBB+) BoQ
(A-2, BBB) MEB
(A-2, BBB+) BEN
(A-1+, AA-) NAB
(A-1+, AA-) WBC
(A-1, A+) SUN
(A-1+, AA-) CBA-BWA
(A-2, BBB+) RUR
(A-1+, AA-) ANZ
0% 10% 20% 30% 40% 50%
Individual Institution Exposures vs. Policy Limits
Limits Funds
0%
20%
40%
60%
80%
100%
0
50
100
150
200
Historical Portfolio Exposure to Non Fossil Fuel Lending ADIs
Sum(Total) Sum(Non Fossil Fuel Lending ADI (%))
Bendigo and Adelaide Bank
Members of Equity Bank
Rural Bank
Suncorp Bank
Mill
ions
$
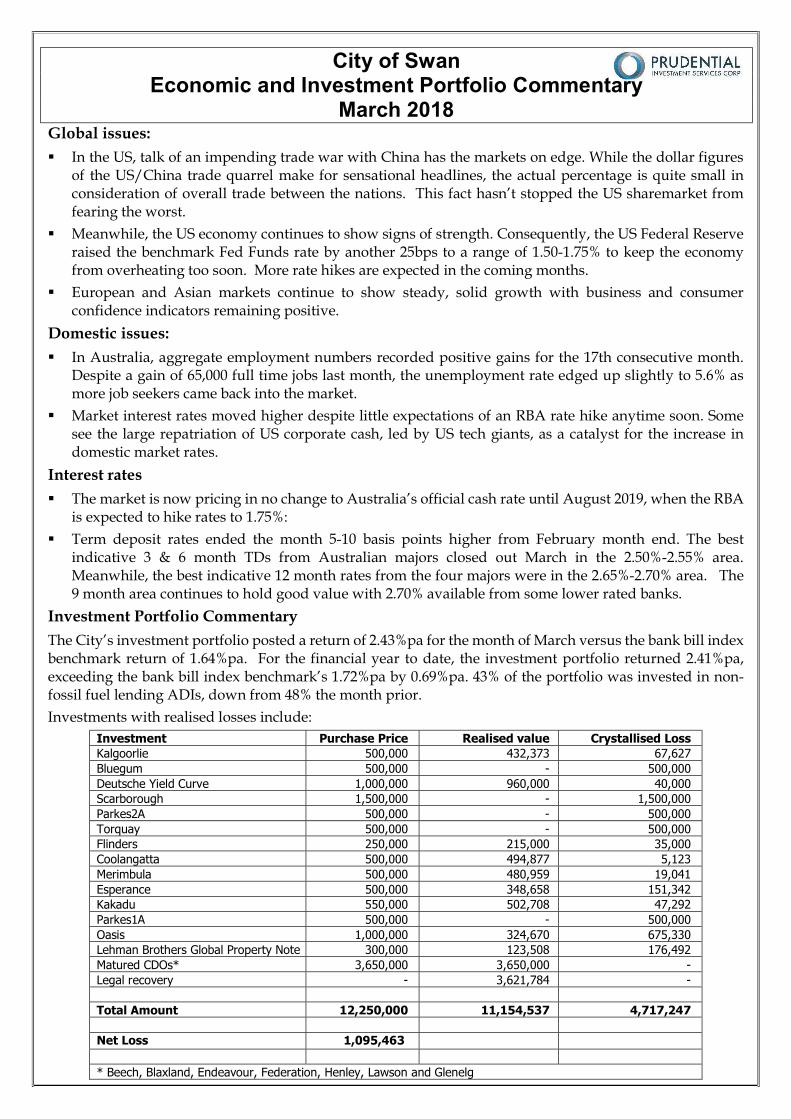
City of Swan Economic and Investment Portfolio Commentary
March 2018 Global issues: In the US, talk of an impending trade war with China has the markets on edge. While the dollar figures
of the US/China trade quarrel make for sensational headlines, the actual percentage is quite small in consideration of overall trade between the nations. This fact hasn’t stopped the US sharemarket from fearing the worst.
Meanwhile, the US economy continues to show signs of strength. Consequently, the US Federal Reserve raised the benchmark Fed Funds rate by another 25bps to a range of 1.50-1.75% to keep the economy from overheating too soon. More rate hikes are expected in the coming months.
European and Asian markets continue to show steady, solid growth with business and consumer confidence indicators remaining positive.
Domestic issues: In Australia, aggregate employment numbers recorded positive gains for the 17th consecutive month.
Despite a gain of 65,000 full time jobs last month, the unemployment rate edged up slightly to 5.6% as more job seekers came back into the market.
Market interest rates moved higher despite little expectations of an RBA rate hike anytime soon. Some see the large repatriation of US corporate cash, led by US tech giants, as a catalyst for the increase in domestic market rates.
Interest rates The market is now pricing in no change to Australia’s official cash rate until August 2019, when the RBA
is expected to hike rates to 1.75%: Term deposit rates ended the month 5-10 basis points higher from February month end. The best
indicative 3 & 6 month TDs from Australian majors closed out March in the 2.50%-2.55% area. Meanwhile, the best indicative 12 month rates from the four majors were in the 2.65%-2.70% area. The 9 month area continues to hold good value with 2.70% available from some lower rated banks.
Investment Portfolio Commentary The City’s investment portfolio posted a return of 2.43%pa for the month of March versus the bank bill index benchmark return of 1.64%pa. For the financial year to date, the investment portfolio returned 2.41%pa, exceeding the bank bill index benchmark’s 1.72%pa by 0.69%pa. 43% of the portfolio was invested in non-fossil fuel lending ADIs, down from 48% the month prior. Investments with realised losses include:
Investment Purchase Price Realised value Crystallised Loss Kalgoorlie 500,000 432,373 67,627 Bluegum 500,000 - 500,000 Deutsche Yield Curve 1,000,000 960,000 40,000 Scarborough 1,500,000 - 1,500,000 Parkes2A 500,000 - 500,000 Torquay 500,000 - 500,000 Flinders 250,000 215,000 35,000 Coolangatta 500,000 494,877 5,123 Merimbula 500,000 480,959 19,041 Esperance 500,000 348,658 151,342 Kakadu 550,000 502,708 47,292 Parkes1A 500,000 - 500,000 Oasis 1,000,000 324,670 675,330 Lehman Brothers Global Property Note 300,000 123,508 176,492 Matured CDOs* 3,650,000 3,650,000 - Legal recovery - 3,621,784 - Total Amount 12,250,000 11,154,537 4,717,247 Net Loss 1,095,463 * Beech, Blaxland, Endeavour, Federation, Henley, Lawson and Glenelg
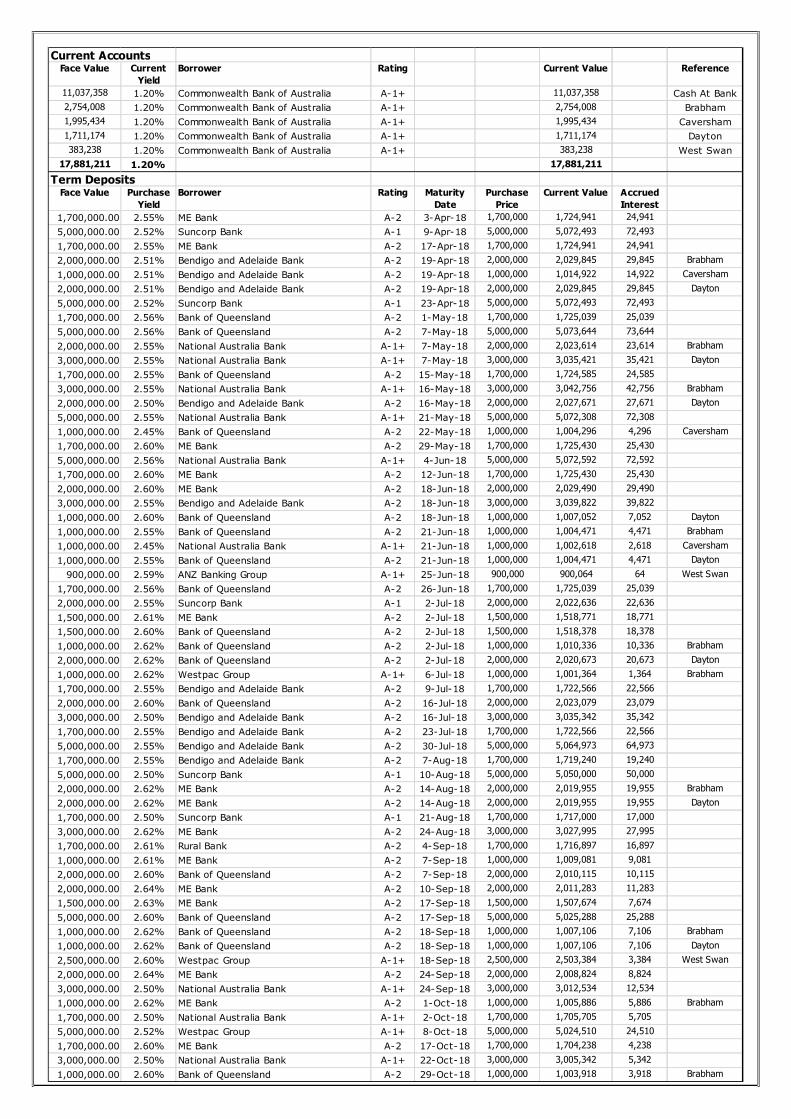
Current AccountsFace Value Current
YieldBorrower Rating Current Value Reference
11,037,358 1.20% Commonwealth Bank of Australia A-1+ 11,037,358 Cash At Bank2,754,008 1.20% Commonwealth Bank of Australia A-1+ 2,754,008 Brabham1,995,434 1.20% Commonwealth Bank of Australia A-1+ 1,995,434 Caversham1,711,174 1.20% Commonwealth Bank of Australia A-1+ 1,711,174 Dayton383,238 1.20% Commonwealth Bank of Australia A-1+ 383,238 West Swan
17,881,211 1.20% 17,881,211Term Deposits
Face Value Purchase Yield
Borrower Rating Maturity Date
Purchase Price
Current Value Accrued Interest
1,700,000.00 2.55% ME Bank A-2 3-Apr-18 1,700,000 1,724,941 24,9415,000,000.00 2.52% Suncorp Bank A-1 9-Apr-18 5,000,000 5,072,493 72,4931,700,000.00 2.55% ME Bank A-2 17-Apr-18 1,700,000 1,724,941 24,9412,000,000.00 2.51% Bendigo and Adelaide Bank A-2 19-Apr-18 2,000,000 2,029,845 29,845 Brabham1,000,000.00 2.51% Bendigo and Adelaide Bank A-2 19-Apr-18 1,000,000 1,014,922 14,922 Caversham2,000,000.00 2.51% Bendigo and Adelaide Bank A-2 19-Apr-18 2,000,000 2,029,845 29,845 Dayton5,000,000.00 2.52% Suncorp Bank A-1 23-Apr-18 5,000,000 5,072,493 72,4931,700,000.00 2.56% Bank of Queensland A-2 1-May-18 1,700,000 1,725,039 25,0395,000,000.00 2.56% Bank of Queensland A-2 7-May-18 5,000,000 5,073,644 73,6442,000,000.00 2.55% National Australia Bank A-1+ 7-May-18 2,000,000 2,023,614 23,614 Brabham3,000,000.00 2.55% National Australia Bank A-1+ 7-May-18 3,000,000 3,035,421 35,421 Dayton1,700,000.00 2.55% Bank of Queensland A-2 15-May-18 1,700,000 1,724,585 24,5853,000,000.00 2.55% National Australia Bank A-1+ 16-May-18 3,000,000 3,042,756 42,756 Brabham2,000,000.00 2.50% Bendigo and Adelaide Bank A-2 16-May-18 2,000,000 2,027,671 27,671 Dayton5,000,000.00 2.55% National Australia Bank A-1+ 21-May-18 5,000,000 5,072,308 72,3081,000,000.00 2.45% Bank of Queensland A-2 22-May-18 1,000,000 1,004,296 4,296 Caversham1,700,000.00 2.60% ME Bank A-2 29-May-18 1,700,000 1,725,430 25,4305,000,000.00 2.56% National Australia Bank A-1+ 4-Jun-18 5,000,000 5,072,592 72,5921,700,000.00 2.60% ME Bank A-2 12-Jun-18 1,700,000 1,725,430 25,4302,000,000.00 2.60% ME Bank A-2 18-Jun-18 2,000,000 2,029,490 29,4903,000,000.00 2.55% Bendigo and Adelaide Bank A-2 18-Jun-18 3,000,000 3,039,822 39,8221,000,000.00 2.60% Bank of Queensland A-2 18-Jun-18 1,000,000 1,007,052 7,052 Dayton1,000,000.00 2.55% Bank of Queensland A-2 21-Jun-18 1,000,000 1,004,471 4,471 Brabham1,000,000.00 2.45% National Australia Bank A-1+ 21-Jun-18 1,000,000 1,002,618 2,618 Caversham1,000,000.00 2.55% Bank of Queensland A-2 21-Jun-18 1,000,000 1,004,471 4,471 Dayton
900,000.00 2.59% ANZ Banking Group A-1+ 25-Jun-18 900,000 900,064 64 West Swan1,700,000.00 2.56% Bank of Queensland A-2 26-Jun-18 1,700,000 1,725,039 25,0392,000,000.00 2.55% Suncorp Bank A-1 2-Jul-18 2,000,000 2,022,636 22,6361,500,000.00 2.61% ME Bank A-2 2-Jul-18 1,500,000 1,518,771 18,7711,500,000.00 2.60% Bank of Queensland A-2 2-Jul-18 1,500,000 1,518,378 18,3781,000,000.00 2.62% Bank of Queensland A-2 2-Jul-18 1,000,000 1,010,336 10,336 Brabham2,000,000.00 2.62% Bank of Queensland A-2 2-Jul-18 2,000,000 2,020,673 20,673 Dayton1,000,000.00 2.62% Westpac Group A-1+ 6-Jul-18 1,000,000 1,001,364 1,364 Brabham1,700,000.00 2.55% Bendigo and Adelaide Bank A-2 9-Jul-18 1,700,000 1,722,566 22,5662,000,000.00 2.60% Bank of Queensland A-2 16-Jul-18 2,000,000 2,023,079 23,0793,000,000.00 2.50% Bendigo and Adelaide Bank A-2 16-Jul-18 3,000,000 3,035,342 35,3421,700,000.00 2.55% Bendigo and Adelaide Bank A-2 23-Jul-18 1,700,000 1,722,566 22,5665,000,000.00 2.55% Bendigo and Adelaide Bank A-2 30-Jul-18 5,000,000 5,064,973 64,9731,700,000.00 2.55% Bendigo and Adelaide Bank A-2 7-Aug-18 1,700,000 1,719,240 19,2405,000,000.00 2.50% Suncorp Bank A-1 10-Aug-18 5,000,000 5,050,000 50,0002,000,000.00 2.62% ME Bank A-2 14-Aug-18 2,000,000 2,019,955 19,955 Brabham2,000,000.00 2.62% ME Bank A-2 14-Aug-18 2,000,000 2,019,955 19,955 Dayton1,700,000.00 2.50% Suncorp Bank A-1 21-Aug-18 1,700,000 1,717,000 17,0003,000,000.00 2.62% ME Bank A-2 24-Aug-18 3,000,000 3,027,995 27,9951,700,000.00 2.61% Rural Bank A-2 4-Sep-18 1,700,000 1,716,897 16,8971,000,000.00 2.61% ME Bank A-2 7-Sep-18 1,000,000 1,009,081 9,0812,000,000.00 2.60% Bank of Queensland A-2 7-Sep-18 2,000,000 2,010,115 10,1152,000,000.00 2.64% ME Bank A-2 10-Sep-18 2,000,000 2,011,283 11,2831,500,000.00 2.63% ME Bank A-2 17-Sep-18 1,500,000 1,507,674 7,6745,000,000.00 2.60% Bank of Queensland A-2 17-Sep-18 5,000,000 5,025,288 25,2881,000,000.00 2.62% Bank of Queensland A-2 18-Sep-18 1,000,000 1,007,106 7,106 Brabham1,000,000.00 2.62% Bank of Queensland A-2 18-Sep-18 1,000,000 1,007,106 7,106 Dayton2,500,000.00 2.60% Westpac Group A-1+ 18-Sep-18 2,500,000 2,503,384 3,384 West Swan2,000,000.00 2.64% ME Bank A-2 24-Sep-18 2,000,000 2,008,824 8,8243,000,000.00 2.50% National Australia Bank A-1+ 24-Sep-18 3,000,000 3,012,534 12,5341,000,000.00 2.62% ME Bank A-2 1-Oct-18 1,000,000 1,005,886 5,886 Brabham1,700,000.00 2.50% National Australia Bank A-1+ 2-Oct-18 1,700,000 1,705,705 5,7055,000,000.00 2.52% Westpac Group A-1+ 8-Oct-18 5,000,000 5,024,510 24,5101,700,000.00 2.60% ME Bank A-2 17-Oct-18 1,700,000 1,704,238 4,2383,000,000.00 2.50% National Australia Bank A-1+ 22-Oct-18 3,000,000 3,005,342 5,3421,000,000.00 2.60% Bank of Queensland A-2 29-Oct-18 1,000,000 1,003,918 3,918 Brabham

Disclaimer: The statements and opinions contained in this report are based on currently prevailing conditions in financial markets and are so contained in good faith and in the belief that such statements and opinion are not false or misleading. In preparing this report, Prudential Investment Services Corp has relied upon information which it believes to be reliable and accurate. Prudential Investment Services Corp believes that this report and the opinions expressed in this report are accurate, but no warranty of accuracy or reliability is given. Prudential Investment Services Corp does not warrant that its investigation has revealed all of the matters which a more extensive examination might disclose. This report may not be reproduced, transmitted, or made available either in part or in whole to any third party without the prior written consent of Prudential Investment Services Corp. AFS Licence No. 468145.
Term Deposits (continued...)Face Value Purchase
YieldBorrower Rating Maturity
DatePurchase
PriceCurrent Value Accrued
Interest2,000,000.00 2.60% Bank of Queensland A-2 29-Oct-18 2,000,000 2,007,836 7,836 Dayton1,700,000.00 2.63% Westpac Group A-1+ 30-Oct-18 1,700,000 1,701,347 1,3475,000,000.00 2.50% National Australia Bank A-1+ 5-Nov-18 5,000,000 5,014,726 14,7261,700,000.00 2.65% Bank of Queensland A-2 13-Nov-18 1,700,000 1,700,987 9875,000,000.00 2.63% Westpac Group A-1+ 19-Nov-18 5,000,000 5,003,963 3,9631,700,000.00 2.65% Rural Bank A-2 26-Nov-18 1,700,000 1,715,181 15,1811,000,000.00 2.60% ME Bank A-2 26-Nov-18 1,000,000 1,002,778 2,778 Brabham2,000,000.00 2.65% Rural Bank A-2 26-Nov-18 2,000,000 2,017,860 17,860 Dayton5,000,000.00 2.58% ME Bank A-2 3-Dec-18 5,000,000 5,000,353 3532,000,000.00 2.62% Westpac Group A-1+ 13-Dec-18 2,000,000 2,002,728 2,728 Caversham1,000,000.00 2.60% ME Bank A-2 13-Dec-18 1,000,000 1,002,778 2,778 Dayton3,000,000.00 2.62% Westpac Group A-1+ 2-Jan-19 3,000,000 3,004,092 4,092 Dayton167,800,000 2.57% 167,800,000 169,293,644 1,493,644
167,800,000 169,293,64417,881,211 17,881,211
185,681,211 187,174,855Total Face ValueCash Face Value
Investment Face Value Investment Current ValueCash Current ValueTotal Current Value
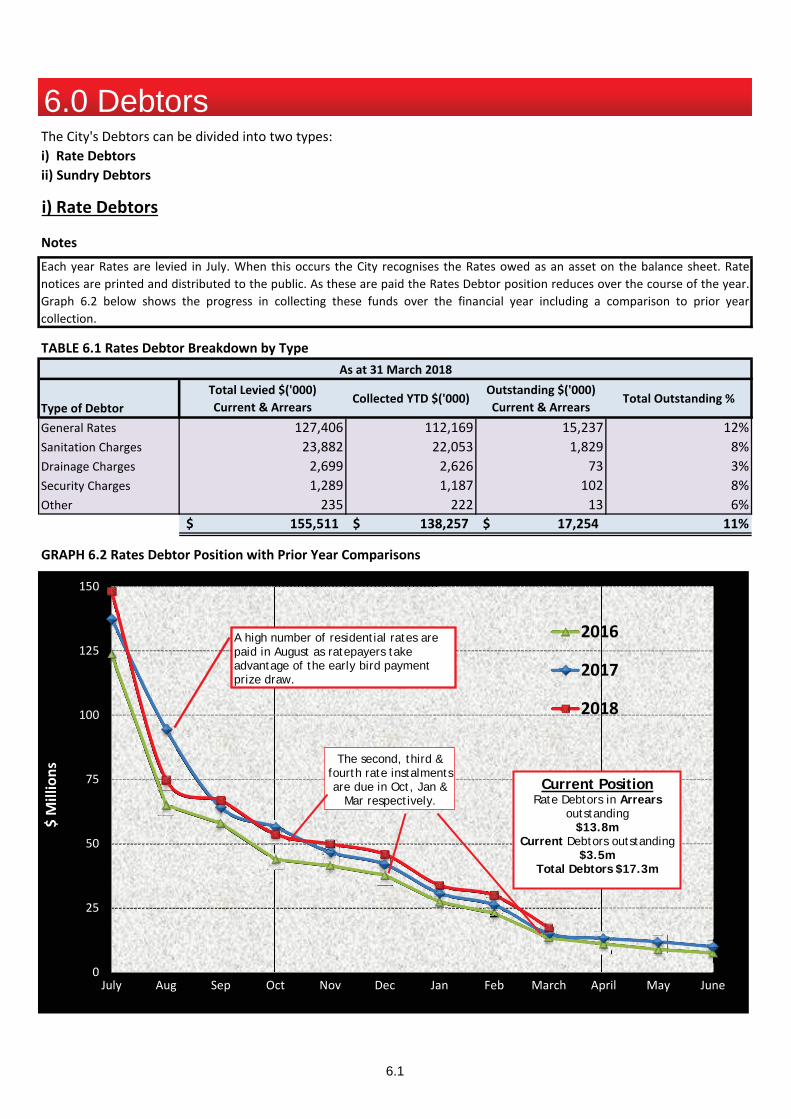
6.1
5.0 Debtors
i) Rate Debtors ii) Sundry Debtors
i) Rate Debtors
Notes
TABLE 6.1 Rates Debtor Breakdown by Type
Type of DebtorTotal Levied $('000)Current & Arrears
Collected YTD $('000)Outstanding $('000)Current & Arrears
Total Outstanding %
General Rates 127,406 112,169 15,237 12%Sanitation Charges 23,882 22,053 1,829 8%Drainage Charges 2,699 2,626 73 3%Security Charges 1,289 1,187 102 8%Other 235 222 13 6%
155,511$ 138,257$ 17,254$ 11%
GRAPH 6.2 Rates Debtor Position with Prior Year Comparisons
??? Prior year debtors
The City's Debtors can be divided into two types:
As at 31 March 2018
Each year Rates are levied in July. When this occurs the City recognises the Rates owed as an asset on the balance sheet. Ratenotices are printed and distributed to the public. As these are paid the Rates Debtor position reduces over the course of the year.Graph 6.2 below shows the progress in collecting these funds over the financial year including a comparison to prior yearcollection.
0
25
50
75
100
125
150
July Aug Sep Oct Nov Dec Jan Feb March April May June
$ M
illio
ns
2016
2017
2018
A high number of residential rates are paid in August as ratepayers take advantage of the early bird payment prize draw.
Current PositionRate Debtors in Arrears
outstanding $13.8m
Current Debtors outstanding$3.5m
Total Debtors $17.3m
6.0 Debtors
The second, third & fourth rate instalments are due in Oct, Jan &
Mar respectively.
6.2
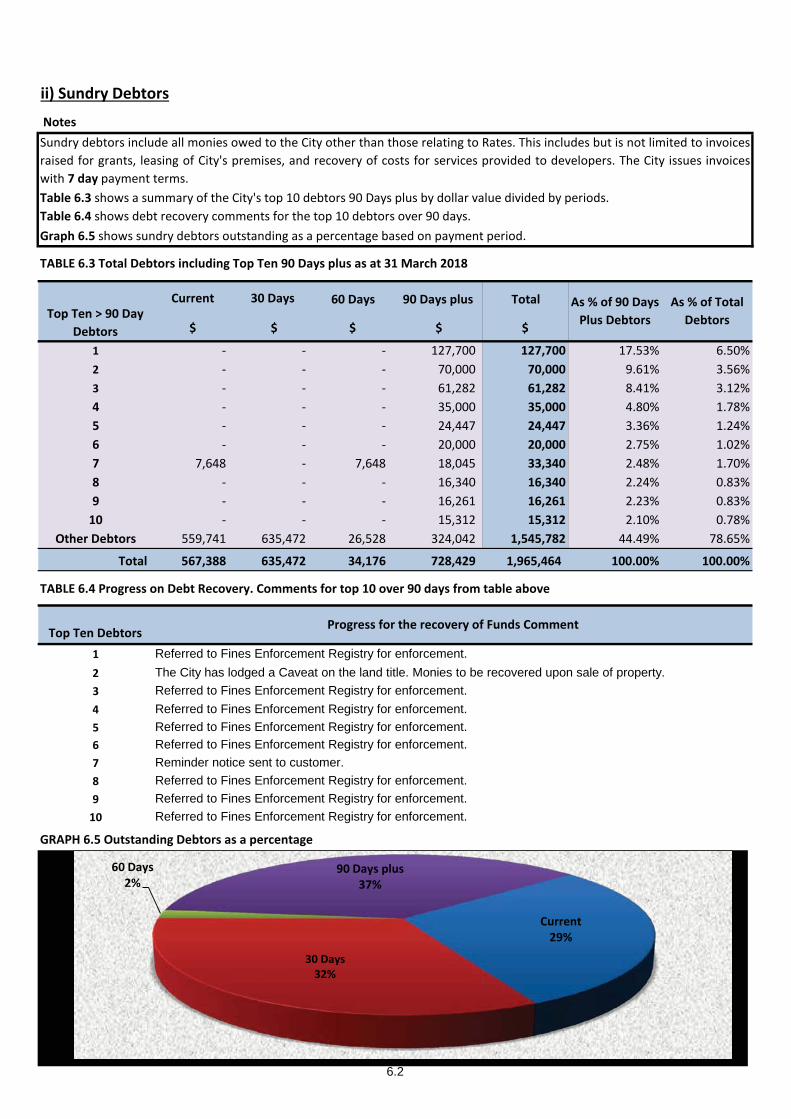
ii) Sundry Debtors
Notes
Table 6.3 shows a summary of the City's top 10 debtors 90 Days plus by dollar value divided by periods. Table 6.4 shows debt recovery comments for the top 10 debtors over 90 days. Graph 6.5 shows sundry debtors outstanding as a percentage based on payment period.
TABLE 6.3 Total Debtors including Top Ten 90 Days plus as at 31 March 2018
Current 30 Days 60 Days 90 Days plus Total
$ $ $ $ $
1 - - - 127,700 127,700 17.53% 6.50%2 - - - 70,000 70,000 9.61% 3.56%3 - - - 61,282 61,282 8.41% 3.12%4 - - - 35,000 35,000 4.80% 1.78%5 - - - 24,447 24,447 3.36% 1.24%6 - - - 20,000 20,000 2.75% 1.02%7 7,648 - 7,648 18,045 33,340 2.48% 1.70%8 - - - 16,340 16,340 2.24% 0.83%9 - - - 16,261 16,261 2.23% 0.83%
10 - - - 15,312 15,312 2.10% 0.78%Other Debtors 559,741 635,472 26,528 324,042 1,545,782 44.49% 78.65%
Total 567,388 635,472 34,176 728,429 1,965,464 100.00% 100.00%
TABLE 6.4 Progress on Debt Recovery. Comments for top 10 over 90 days from table above
Top Ten Debtors123456789
10
GRAPH 6.5 Outstanding Debtors as a percentage
Sundry debtors include all monies owed to the City other than those relating to Rates. This includes but is not limited to invoicesraised for grants, leasing of City's premises, and recovery of costs for services provided to developers. The City issues invoiceswith 7 day payment terms.
Referred to Fines Enforcement Registry for enforcement.Referred to Fines Enforcement Registry for enforcement.
Reminder notice sent to customer.
Referred to Fines Enforcement Registry for enforcement.Referred to Fines Enforcement Registry for enforcement.
Referred to Fines Enforcement Registry for enforcement.
Referred to Fines Enforcement Registry for enforcement.
As % of 90 Days Plus Debtors
As % of Total DebtorsTop Ten > 90 Day
Debtors
Referred to Fines Enforcement Registry for enforcement.
Progress for the recovery of Funds Comment
The City has lodged a Caveat on the land title. Monies to be recovered upon sale of property.
Referred to Fines Enforcement Registry for enforcement.
Current 29%
30 Days 32%
60 Days 2%
90 Days plus 37%
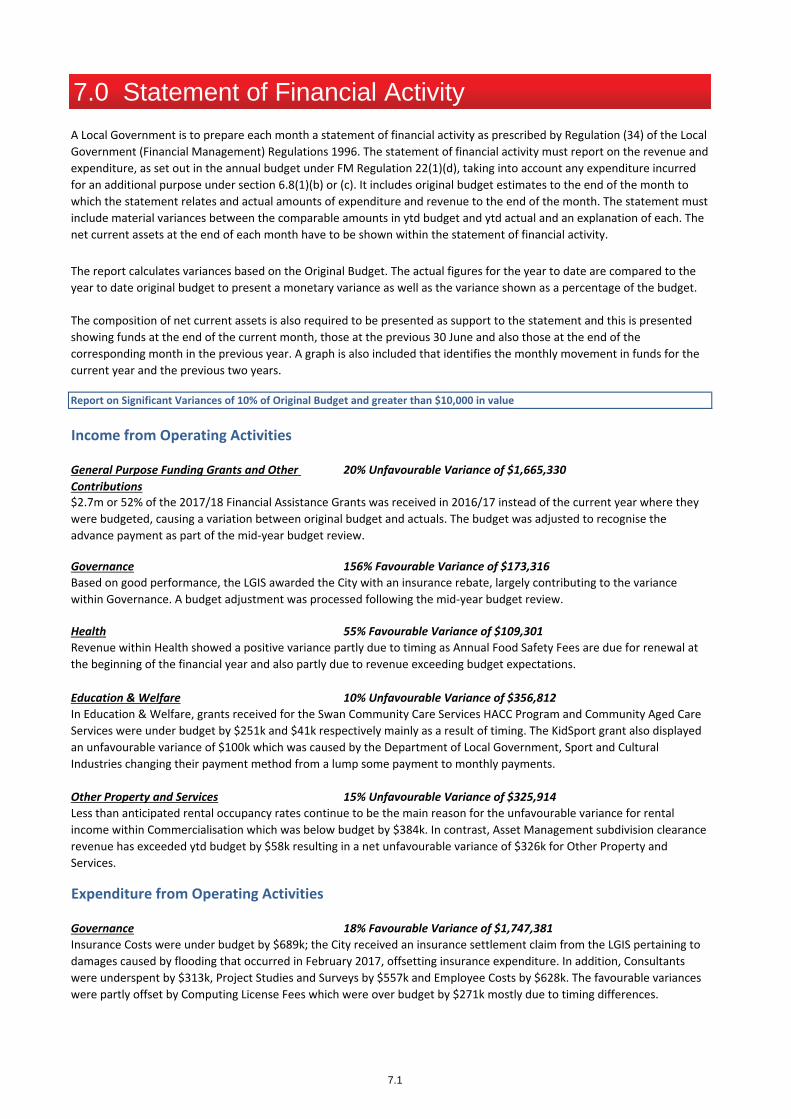
7.1
Income from Operating Activities
General Purpose Funding Grants and Other Contributions
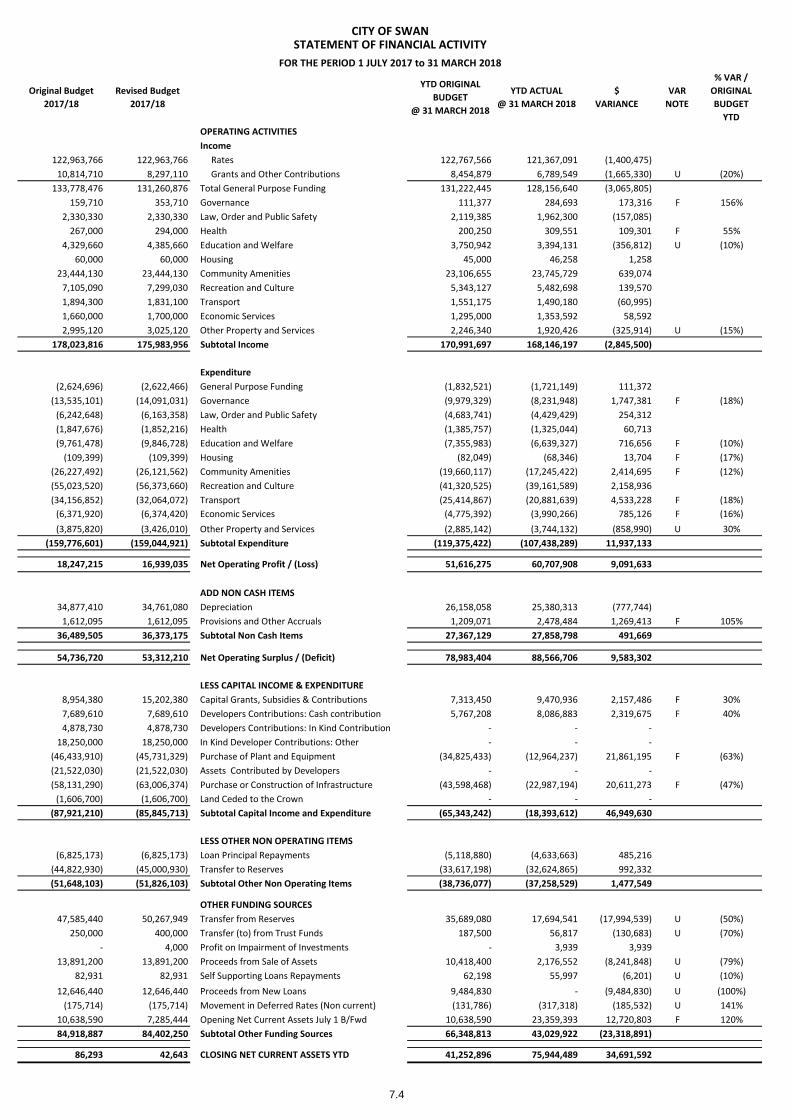
20% Unfavourable Variance of $1,665,330
Governance 156% Favourable Variance of $173,316
Health 55% Favourable Variance of $109,301
Education & Welfare 10% Unfavourable Variance of $356,812
Other Property and Services 15% Unfavourable Variance of $325,914
Expenditure from Operating Activities
Governance 18% Favourable Variance of $1,747,381
A Local Government is to prepare each month a statement of financial activity as prescribed by Regulation (34) of the Local Government (Financial Management) Regulations 1996. The statement of financial activity must report on the revenue and expenditure, as set out in the annual budget under FM Regulation 22(1)(d), taking into account any expenditure incurred for an additional purpose under section 6.8(1)(b) or (c). It includes original budget estimates to the end of the month to which the statement relates and actual amounts of expenditure and revenue to the end of the month. The statement must include material variances between the comparable amounts in ytd budget and ytd actual and an explanation of each. The net current assets at the end of each month have to be shown within the statement of financial activity.
The report calculates variances based on the Original Budget. The actual figures for the year to date are compared to the year to date original budget to present a monetary variance as well as the variance shown as a percentage of the budget.
The composition of net current assets is also required to be presented as support to the statement and this is presented showing funds at the end of the current month, those at the previous 30 June and also those at the end of the corresponding month in the previous year. A graph is also included that identifies the monthly movement in funds for the current year and the previous two years.
Report on Significant Variances of 10% of Original Budget and greater than $10,000 in value
$2.7m or 52% of the 2017/18 Financial Assistance Grants was received in 2016/17 instead of the current year where they were budgeted, causing a variation between original budget and actuals. The budget was adjusted to recognise the advance payment as part of the mid-year budget review.
Less than anticipated rental occupancy rates continue to be the main reason for the unfavourable variance for rental income within Commercialisation which was below budget by $384k. In contrast, Asset Management subdivision clearance revenue has exceeded ytd budget by $58k resulting in a net unfavourable variance of $326k for Other Property and Services.
Insurance Costs were under budget by $689k; the City received an insurance settlement claim from the LGIS pertaining to damages caused by flooding that occurred in February 2017, offsetting insurance expenditure. In addition, Consultants were underspent by $313k, Project Studies and Surveys by $557k and Employee Costs by $628k. The favourable variances were partly offset by Computing License Fees which were over budget by $271k mostly due to timing differences.
Based on good performance, the LGIS awarded the City with an insurance rebate, largely contributing to the variance within Governance. A budget adjustment was processed following the mid-year budget review.
Revenue within Health showed a positive variance partly due to timing as Annual Food Safety Fees are due for renewal at the beginning of the financial year and also partly due to revenue exceeding budget expectations.
In Education & Welfare, grants received for the Swan Community Care Services HACC Program and Community Aged Care Services were under budget by $251k and $41k respectively mainly as a result of timing. The KidSport grant also displayed an unfavourable variance of $100k which was caused by the Department of Local Government, Sport and Cultural Industries changing their payment method from a lump some payment to monthly payments.
1.0 Income Statement 7.0 Statement of Financial Activity

7.2
Education & Welfare 10% Favourable Variance of $716,656
Housing 17% Favourable Variance of $13,704
Community Amenities 12% Favourable Variance of $2,414,695
Transport 18% Favourable Variance of $4,533,288
Economic Services 16% Favourable Variance of $785,126
Other Property and Services 30% Unfavourable Variance of $858,990
Non Cash Items
Provisions and Other Accruals 105% Favourable Variance of $1,269,413
Capital Income & Expenditure
Capital Grants, Subsidies & Contributions 30% Favourable Variance of $2,157,486
Developer Contributions Plans: Cash Contribution 40% Favourable Variance of $2,319,675
Purchase of Plant and Equipment 63% Favourable Variance of $21,861,195
Fleet running costs were below budget expectations by $635k; this variance will be addressed by a budget adjustment to reserves. Similarly, Electricity Costs were less than budget $181k, Employee Costs $243k, Contracts $632k and Depreciation $1.2m plus other numerous accounts with smaller variances.
Operating projects within Economic Services were underspent by $378k, in particular the following projects; Urban Design/Heritage Working Paper $25k, Midland Parking $37.5k, Midland Implementation Plan 2010-2017 $45k and Transport Strategy $46k. Employee Costs were also under budget by $175k mostly due to vacant positions.
Project Management Costs Recovery which is directly linked to capital works expenditure displayed an unfavourable variance of $2.3m. The variance was partly offset by underspending in the following areas Employee Costs $363k, Projects, Studies & Surveys $199k, Depreciation $481k and Consultants $143k.
Vacant positions as well as staff leave taken over the Christmas holiday resulted in Employee Costs coming under budget by $448k while timing issues resulted in Projects Studies & Surveys being below budget by $239k.
Consultants and Contracts Costs displayed timing differences of $7k and $6k respectively. It is anticipated that the variances will reduce as the year progresses.
Waste Services Contract Costs were underspent by $902k. It is anticipated that the expenditure for refuse and verge collections will align to budget by year end. A pending bond refund of $958k also impacted on the variance within Community Amenities. The refund is scheduled for payment in April 2018.
This favourable variance is attributable to a timing difference and actual results are expected to align to budget by the end of the financial year.
The following grants were received in the current year instead of the prior year where they were budgeted: Midland Youth Services Hub $1.6m, Ethel Warren Bullsbrook Community Centre $500k, Halden Road $502k, Maralla Road $275k and Cunningham Road $377k. Grants that were not originally budgeted were received for the Ron Jose Oval $350k and for the Playspace Replacement Program $255k, adding to the variance. Following the mid-year budget review, budget adjustments have been processed to take these grants into account. In contrast, the Roads to Recovery Grant was below budget by $791k due to timing, partly offsetting the variance.
Total contributions collected in March were $3.6m, comprising $463k for Brabham, $583k for Dayton and $2.6m for West Swan West. Due to the unpredicted nature of Developers Contributions, variations between budget and actuals are not unusual.
Building construction works contributed $11m to the variance as a result of the following works with significant annual budgets not expending as anticipated: Ethel Warren Bullsbrook Community Centre $1.1m, Altone Place Office $1.3m, Ballajura Place Office $1.2m and Operations Centre $3.2m. Significant variances were also noted for Land Purchases which were below budget by $4.5m, Plant & Equipment by $3.1m and Computing Purchases by $3.1m.

7.3
Purchase or Construction of Infrastructure 20% Favourable Variance of $20,611,273
Other Funding Sources
Transfer from Reserves 50% Unfavourable Variance of $17,994,539
Transfer (to) from Trust Funds 70% Unfavourable Variance of $130,683
Proceeds from Sale of Assets 79% Unfavourable Variance of $8,241,848
Proceeds from New Loans 100% Unfavourable Variance of $9,484,830
Movement in Deferred Rates (Non-Current) 141% Unfavourable Variance of $185,532
Opening Net Current Assets July 1 B/Fwd 120% Favourable Variance of $12,720,803
As the financial year progresses, there is typically an increase in Reserve funded expenditure. Based on historical trends, Reserve funded expenditure is expected to increase and align closer to budget in the later half of the financial year.
As the financial year end draws closer, it is anticipated that there will be an increase in expenditure on Trust funded capital jobs resulting in transfers from Trust, reducing the unfavourable variance.
Road constructions works accounted for most of the variance within Purchase or Construction of infrastructure, being $18.1m below ytd original budget. The variance mainly consists of the following projects: Lord Street $4.8, Ellenbrook Bridge $2.3m, Drumpellier Drive $1.6m, Hazelmere Industrial Area Infrastructure Road $1.5m, West Swan Road/Millhouse Road $1.1m, Haddrill Road $787k and Barkers Bridge $506k. Several other projects with smaller budgets were also underspent, adding to the variance. Various projects that have not progressed as anticipated and works are being carried over into 2018/19, in particular Hazelmere Industrial Area Infrastructure Road and Lord Street.
The unfavourable variance is a result of timing. As payments are received in the coming months, the unfavourable variance is likely to decrease and align to budget.
The majority of this favourable variance relates to carry forwards for capital works and the advance receipt of a portion of the Financial Assistance Grant for 2017/18. The balance of the variance relates to operating revenue being greater than budget and operating expenditure being lower than budget.
Expected disposals are yet to occur. As proceeds are realised, this variance will decrease.
Budgeted loans will be drawn down when the anticipated underlying capital expenditure increases. Capital expenditure is expected to increase towards the end of the financial year.
7.4
Original Budget 2017/18
Revised Budget 2017/18
YTD ORIGINALBUDGET
@ 31 MARCH 2018
YTD ACTUAL@ 31 MARCH 2018
$VARIANCE
VAR NOTE
% VAR /ORIGINAL BUDGET
YTDOPERATING ACTIVITIESIncome
122,963,766 122,963,766 Rates 122,767,566 121,367,091 (1,400,475)10,814,710 8,297,110 Grants and Other Contributions 8,454,879 6,789,549 (1,665,330) U (20%)
133,778,476 131,260,876 Total General Purpose Funding 131,222,445 128,156,640 (3,065,805)159,710 353,710 Governance 111,377 284,693 173,316 F 156%
2,330,330 2,330,330 Law, Order and Public Safety 2,119,385 1,962,300 (157,085)267,000 294,000 Health 200,250 309,551 109,301 F 55%
4,329,660 4,385,660 Education and Welfare 3,750,942 3,394,131 (356,812) U (10%)60,000 60,000 Housing 45,000 46,258 1,258
23,444,130 23,444,130 Community Amenities 23,106,655 23,745,729 639,0747,105,090 7,299,030 Recreation and Culture 5,343,127 5,482,698 139,5701,894,300 1,831,100 Transport 1,551,175 1,490,180 (60,995)1,660,000 1,700,000 Economic Services 1,295,000 1,353,592 58,5922,995,120 3,025,120 Other Property and Services 2,246,340 1,920,426 (325,914) U (15%)
178,023,816 175,983,956 Subtotal Income 170,991,697 168,146,197 (2,845,500)
Expenditure(2,624,696) (2,622,466) General Purpose Funding (1,832,521) (1,721,149) 111,372
(13,535,101) (14,091,031) Governance (9,979,329) (8,231,948) 1,747,381 F (18%)(6,242,648) (6,163,358) Law, Order and Public Safety (4,683,741) (4,429,429) 254,312(1,847,676) (1,852,216) Health (1,385,757) (1,325,044) 60,713(9,761,478) (9,846,728) Education and Welfare (7,355,983) (6,639,327) 716,656 F (10%)
(109,399) (109,399) Housing (82,049) (68,346) 13,704 F (17%)(26,227,492) (26,121,562) Community Amenities (19,660,117) (17,245,422) 2,414,695 F (12%)(55,023,520) (56,373,660) Recreation and Culture (41,320,525) (39,161,589) 2,158,936(34,156,852) (32,064,072) Transport (25,414,867) (20,881,639) 4,533,228 F (18%)
(6,371,920) (6,374,420) Economic Services (4,775,392) (3,990,266) 785,126 F (16%)(3,875,820) (3,426,010) Other Property and Services (2,885,142) (3,744,132) (858,990) U 30%
(159,776,601) (159,044,921) Subtotal Expenditure (119,375,422) (107,438,289) 11,937,133
18,247,215 16,939,035 Net Operating Profit / (Loss) 51,616,275 60,707,908 9,091,633
ADD NON CASH ITEMS34,877,410 34,761,080 Depreciation 26,158,058 25,380,313 (777,744)
1,612,095 1,612,095 Provisions and Other Accruals 1,209,071 2,478,484 1,269,413 F 105%36,489,505 36,373,175 Subtotal Non Cash Items 27,367,129 27,858,798 491,669
54,736,720 53,312,210 Net Operating Surplus / (Deficit) 78,983,404 88,566,706 9,583,302
LESS CAPITAL INCOME & EXPENDITURE8,954,380 15,202,380 Capital Grants, Subsidies & Contributions 7,313,450 9,470,936 2,157,486 F 30%7,689,610 7,689,610 Developers Contributions: Cash contribution 5,767,208 8,086,883 2,319,675 F 40%4,878,730 4,878,730 Developers Contributions: In Kind Contribution - - -
18,250,000 18,250,000 In Kind Developer Contributions: Other - - -(46,433,910) (45,731,329) Purchase of Plant and Equipment (34,825,433) (12,964,237) 21,861,195 F (63%)(21,522,030) (21,522,030) Assets Contributed by Developers - - -(58,131,290) (63,006,374) Purchase or Construction of Infrastructure (43,598,468) (22,987,194) 20,611,273 F (47%)
(1,606,700) (1,606,700) Land Ceded to the Crown - - -(87,921,210) (85,845,713) Subtotal Capital Income and Expenditure (65,343,242) (18,393,612) 46,949,630
LESS OTHER NON OPERATING ITEMS(6,825,173) (6,825,173) Loan Principal Repayments (5,118,880) (4,633,663) 485,216
(44,822,930) (45,000,930) Transfer to Reserves (33,617,198) (32,624,865) 992,332(51,648,103) (51,826,103) Subtotal Other Non Operating Items (38,736,077) (37,258,529) 1,477,549
OTHER FUNDING SOURCES47,585,440 50,267,949 Transfer from Reserves 35,689,080 17,694,541 (17,994,539) U (50%)
250,000 400,000 Transfer (to) from Trust Funds 187,500 56,817 (130,683) U (70%)- 4,000 Profit on Impairment of Investments - 3,939 3,939
13,891,200 13,891,200 Proceeds from Sale of Assets 10,418,400 2,176,552 (8,241,848) U (79%)82,931 82,931 Self Supporting Loans Repayments 62,198 55,997 (6,201) U (10%)
12,646,440 12,646,440 Proceeds from New Loans 9,484,830 - (9,484,830) U (100%)(175,714) (175,714) Movement in Deferred Rates (Non current) (131,786) (317,318) (185,532) U 141%
10,638,590 7,285,444 Opening Net Current Assets July 1 B/Fwd 10,638,590 23,359,393 12,720,803 F 120%84,918,887 84,402,250 Subtotal Other Funding Sources 66,348,813 43,029,922 (23,318,891)
86,293 42,643 CLOSING NET CURRENT ASSETS YTD 41,252,896 75,944,489 34,691,592
CITY OF SWAN STATEMENT OF FINANCIAL ACTIVITY
FOR THE PERIOD 1 JULY 2017 to 31 MARCH 2018

7.5
ACTUAL @MARCH 2018
ACTUAL @JUNE 2017
ACTUAL @MARCH 2017
Current AssetsUnrestricted Cash, Cash Equivalents & Investments 67,869,161 33,952,372 60,099,920 Restricted Cash, Cash Equivalents & Investments 117,812,050 103,311,605 104,793,717 Assets Held For Sale 7,847,019 7,847,019 - Rates Debtors Current 17,496,054 9,334,749 15,303,300 Trade and Other Receivables 3,529,242 2,685,444 3,089,753 Prepayments 249,820 1,361,018 240,255 Inventory 282,332 263,351 363,195 Total Current Assets 215,085,674 158,755,558 183,890,140
Less Current LiabilitiesIncome in Advance (2,194,724) - (1,677,404) Accounts Payable (7,273,603) (19,709,420) (10,399,913) Provisions - Employee Entitlements (13,728,656) (13,504,458) (13,033,431) Loan Repayments (1,673,318) (6,306,981) (1,579,096) Total Current Liabilities (24,870,300) (39,520,859) (26,689,844)
Net Current Assets 190,215,374 119,234,699 157,200,295
Add Back Restricted LiabilitiesLSL Reserve 9,741,802 7,713,071 7,081,206 Loan Repayments 1,673,318 6,306,981 1,579,096 Self Supporting Loan Contributions (26,935) (82,931) (35,778)
Adjusted Net Assets 201,603,559 133,171,820 165,824,819
Less Restricted Cash, Cash Equivalents & InvestmentsReserves: Cash Backed (114,131,994) (99,201,670) (101,707,454) Bond monies (3,680,057) (2,763,739) (3,086,263) Assets held for sale (7,847,019) (7,847,019) -
Closing Funds 75,944,489 23,359,393 61,031,103
* Changed to reflect Local Government of Western Australia Guideline - Number 8 - June 2013.
CITY OF SWANNET CURRENT FUNDING POSITION
AS AT 31 MARCH 2018
10
30
50
70
90
110
130
150
170
Jul Aug Sep Oct Nov Dec Jan Feb Mar Apr May Jun
Mill
ion
$
Liquidity Over Three Years
2015/162016/172017/18

8.1
1. STATEMENT OF CASH FLOW
2. RATE SETTING STATEMENT
Cash flow information provides users of financial reports with a basis to assess the ability of an entity to generatecash and cash equivalents and the needs of the entity to utilize those cash flows. The cash flow statement shallreport flows during the period classified by operating, investing and financing activities. The key objective of a cashflow forecast is to predict the period in which cash inflows and outflows will occur.
It is essential that local governments have meaningful and accurate financial information on which to base decisions.The starting point for sound financial management is the preparation of the Rate Setting Statement. This statementis a crucial component of the budget process and shows how much rates are required to pay for the localgovernment's operations. The Rate Setting Statement is a statutory requirement and is unique to local governmentin that it contains values of opening funds and closing funds. Opening funds refer to 'net current assets less restrictedfunds and committed cash and amounts already reflected in the current year budget'. The opening fund forms partof the calculation of the amount of the deficiency to be raised from rates as referred to in s 6.2(2)(C) of the LocalGovernment Act.
8.0 Other Statutory Reports8.0 Other Statutory Reports
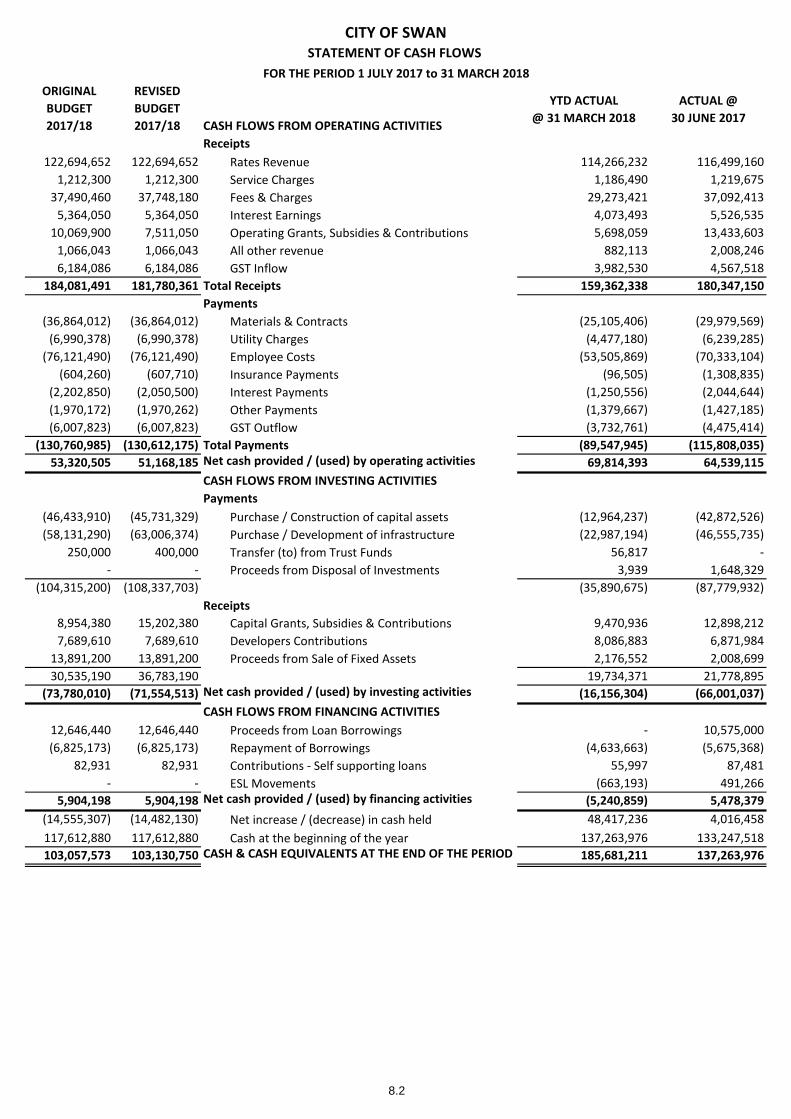
8.2
ORIGINALBUDGET2017/18
REVISEDBUDGET2017/18 CASH FLOWS FROM OPERATING ACTIVITIES
YTD ACTUAL@ 31 MARCH 2018
ACTUAL @30 JUNE 2017
Receipts122,694,652 122,694,652 Rates Revenue 114,266,232 116,499,160
1,212,300 1,212,300 Service Charges 1,186,490 1,219,67537,490,460 37,748,180 Fees & Charges 29,273,421 37,092,413
5,364,050 5,364,050 Interest Earnings 4,073,493 5,526,53510,069,900 7,511,050 Operating Grants, Subsidies & Contributions 5,698,059 13,433,603
1,066,043 1,066,043 All other revenue 882,113 2,008,2466,184,086 6,184,086 GST Inflow 3,982,530 4,567,518
184,081,491 181,780,361 Total Receipts 159,362,338 180,347,150Payments
(36,864,012) (36,864,012) Materials & Contracts (25,105,406) (29,979,569)(6,990,378) (6,990,378) Utility Charges (4,477,180) (6,239,285)
(76,121,490) (76,121,490) Employee Costs (53,505,869) (70,333,104)(604,260) (607,710) Insurance Payments (96,505) (1,308,835)
(2,202,850) (2,050,500) Interest Payments (1,250,556) (2,044,644)(1,970,172) (1,970,262) Other Payments (1,379,667) (1,427,185)(6,007,823) (6,007,823) GST Outflow (3,732,761) (4,475,414)
(130,760,985) (130,612,175) Total Payments (89,547,945) (115,808,035)53,320,505 51,168,185 Net cash provided / (used) by operating activities 69,814,393 64,539,115
CASH FLOWS FROM INVESTING ACTIVITIES Payments
(46,433,910) (45,731,329) Purchase / Construction of capital assets (12,964,237) (42,872,526)(58,131,290) (63,006,374) Purchase / Development of infrastructure (22,987,194) (46,555,735)
250,000 400,000 Transfer (to) from Trust Funds 56,817 -- - Proceeds from Disposal of Investments 3,939 1,648,329
(104,315,200) (108,337,703) (35,890,675) (87,779,932)Receipts
8,954,380 15,202,380 Capital Grants, Subsidies & Contributions 9,470,936 12,898,2127,689,610 7,689,610 Developers Contributions 8,086,883 6,871,984
13,891,200 13,891,200 Proceeds from Sale of Fixed Assets 2,176,552 2,008,69930,535,190 36,783,190 19,734,371 21,778,895
(73,780,010) (71,554,513) Net cash provided / (used) by investing activities (16,156,304) (66,001,037)CASH FLOWS FROM FINANCING ACTIVITIES
12,646,440 12,646,440 Proceeds from Loan Borrowings - 10,575,000(6,825,173) (6,825,173) Repayment of Borrowings (4,633,663) (5,675,368)
82,931 82,931 Contributions - Self supporting loans 55,997 87,481- - ESL Movements (663,193) 491,266
5,904,198 5,904,198 Net cash provided / (used) by financing activities (5,240,859) 5,478,379(14,555,307) (14,482,130) Net increase / (decrease) in cash held 48,417,236 4,016,458117,612,880 117,612,880 Cash at the beginning of the year 137,263,976 133,247,518103,057,573 103,130,750 CASH & CASH EQUIVALENTS AT THE END OF THE PERIOD 185,681,211 137,263,976
CITY OF SWANSTATEMENT OF CASH FLOWS
FOR THE PERIOD 1 JULY 2017 to 31 MARCH 2018
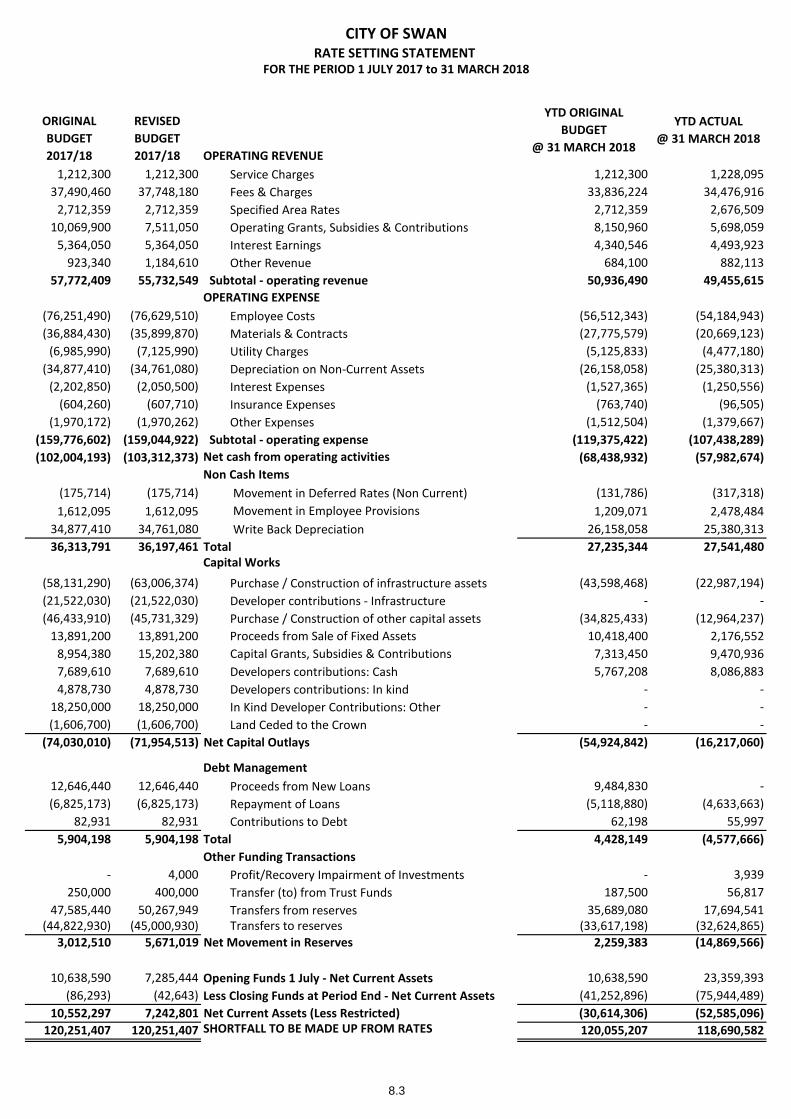
8.3
ORIGINALBUDGET2017/18
REVISEDBUDGET2017/18 OPERATING REVENUE
YTD ORIGINALBUDGET
@ 31 MARCH 2018
YTD ACTUAL@ 31 MARCH 2018
1,212,300 1,212,300 Service Charges 1,212,300 1,228,09537,490,460 37,748,180 Fees & Charges 33,836,224 34,476,916
2,712,359 2,712,359 Specified Area Rates 2,712,359 2,676,50910,069,900 7,511,050 Operating Grants, Subsidies & Contributions 8,150,960 5,698,059
5,364,050 5,364,050 Interest Earnings 4,340,546 4,493,923923,340 1,184,610 Other Revenue 684,100 882,113
57,772,409 55,732,549 Subtotal - operating revenue 50,936,490 49,455,615OPERATING EXPENSE
(76,251,490) (76,629,510) Employee Costs (56,512,343) (54,184,943)(36,884,430) (35,899,870) Materials & Contracts (27,775,579) (20,669,123)
(6,985,990) (7,125,990) Utility Charges (5,125,833) (4,477,180)(34,877,410) (34,761,080) Depreciation on Non-Current Assets (26,158,058) (25,380,313)
(2,202,850) (2,050,500) Interest Expenses (1,527,365) (1,250,556)(604,260) (607,710) Insurance Expenses (763,740) (96,505)
(1,970,172) (1,970,262) Other Expenses (1,512,504) (1,379,667)(159,776,602) (159,044,922) Subtotal - operating expense (119,375,422) (107,438,289)(102,004,193) (103,312,373) Net cash from operating activities (68,438,932) (57,982,674)
Non Cash Items(175,714) (175,714) Movement in Deferred Rates (Non Current) (131,786) (317,318)1,612,095 1,612,095 Movement in Employee Provisions 1,209,071 2,478,484
34,877,410 34,761,080 Write Back Depreciation 26,158,058 25,380,31336,313,791 36,197,461 Total 27,235,344 27,541,480
Capital Works(58,131,290) (63,006,374) Purchase / Construction of infrastructure assets (43,598,468) (22,987,194)(21,522,030) (21,522,030) Developer contributions - Infrastructure - -(46,433,910) (45,731,329) Purchase / Construction of other capital assets (34,825,433) (12,964,237)
13,891,200 13,891,200 Proceeds from Sale of Fixed Assets 10,418,400 2,176,5528,954,380 15,202,380 Capital Grants, Subsidies & Contributions 7,313,450 9,470,9367,689,610 7,689,610 Developers contributions: Cash 5,767,208 8,086,8834,878,730 4,878,730 Developers contributions: In kind - -
18,250,000 18,250,000 In Kind Developer Contributions: Other - -(1,606,700) (1,606,700) Land Ceded to the Crown - -
(74,030,010) (71,954,513) Net Capital Outlays (54,924,842) (16,217,060)
Debt Management12,646,440 12,646,440 Proceeds from New Loans 9,484,830 -(6,825,173) (6,825,173) Repayment of Loans (5,118,880) (4,633,663)
82,931 82,931 Contributions to Debt 62,198 55,9975,904,198 5,904,198 Total 4,428,149 (4,577,666)
Other Funding Transactions- 4,000 Profit/Recovery Impairment of Investments - 3,939
250,000 400,000 Transfer (to) from Trust Funds 187,500 56,81747,585,440 50,267,949 Transfers from reserves 35,689,080 17,694,541
(44,822,930) (45,000,930) Transfers to reserves (33,617,198) (32,624,865)3,012,510 5,671,019 Net Movement in Reserves 2,259,383 (14,869,566)
10,638,590 7,285,444 Opening Funds 1 July - Net Current Assets 10,638,590 23,359,393(86,293) (42,643) Less Closing Funds at Period End - Net Current Assets (41,252,896) (75,944,489)
10,552,297 7,242,801 Net Current Assets (Less Restricted) (30,614,306) (52,585,096)120,251,407 120,251,407 SHORTFALL TO BE MADE UP FROM RATES 120,055,207 118,690,582
FOR THE PERIOD 1 JULY 2017 to 31 MARCH 2018
CITY OF SWANRATE SETTING STATEMENT