Financial Literacy And Retirement Planning In Kenya
24
Researchjournali’s Journal of Finance Vol. 5 | No. 4 October | 2017 ISSN 2348-0963 1 www.researchjournali.com Asenath Maobe Faculty member, Deparment of Accounting and Finance, School of Business and Economics, Kisii University, P.o. Box 408- 40200, Kisii, Kenya Financial Literacy And Retirement Planning In Kenya
Transcript of Financial Literacy And Retirement Planning In Kenya
Researchjournali’s Journal of Finance
Vol. 5 | No. 4 October | 2017 ISSN 2348-0963 1
www.researchjournali.com
Asenath Maobe
Faculty member, Deparment of Accounting and
Finance, School of Business and Economics, Kisii
University, P.o. Box 408- 40200, Kisii, Kenya
Financial Literacy
And Retirement
Planning In Kenya

Researchjournali’s Journal of Finance
Vol. 5 | No. 4 October | 2017 ISSN 2348-0963 2
www.researchjournali.com
ABSTRACT
At least 90 pc of Kenyans are not planning for retirement and the trend if un-reversed is worrisome. Retirement
a period following immediately after exiting from active employment and a major transition in a worker’s life
requires appropriate financial planning. Conventionally, in Africa, the risks arising from old age and retirement
have been shared by family and the community; however, this practice is on the decline due to present economic
conditions in Africa where the family safety nets are low. This is compounded by the nature of the Kenya’s
economy which is largely depended on traditional agriculture. The study focused on workers in the informal
sector in Kenya commonly known as ‘Jua Kali’. Given that they are not subject to government’ compulsory
contributions towards retirement, then a homegrown model needed to be formulated through establishing their
level of financial literacy and how it influences retirement planning. And which platform can facilitate their
attitudes towards saving for retirement. Results showed that financial literacy levels remain low, and yet they
positively impact on retirement planning. The Mpesa mobile network was also considered by the planners as a
convenient medium to send their savings to pension firms.
Keywords: Retirement Planning, Jua Kali, informal workers, Financial Literacy
1. INTRODUCTION
1.1 BACKGROUND
A report by Alexander Forbes shows that at least 90 pc of Kenyans are not planning for retirement (Okoth,
2016). This statistics points to the reality that majority of these workers are from the informal sector given that
from the Economic Review (2011), 80 pc of the total workforce in Kenya are informal workers. The trend is
likely to lead to financial anxiety for Kenyans who would be sleep-walking to their sunset years without a
sufficient retirement package. As Kee- Lee and Chow (2005) aptly posit, retirement a period following
immediately after exiting from active employment and a major transition in a worker’s life, requires appropriate
financial planning.
Knowing that the informal sector plays a crucial role in world economies (World Bank, 2006), then the attention
of policy makers and planners needs to be drawn to this sector. As it stands in Kenya, the informal sector
workers are not enjoying any government retirement incentives as their counterparts. This paper sought to
develop a home-grown model of integrating the informal workers into a retirement system, as to secure their
financial future.
Conventionally the risks arising from old age and retirement have been shared by family and the community;
however, this practice is on the decline due to present economic conditions where the family economic safety
nets are low in Kenya. This is compounded by the nature of the country’s economy which is largely depended

Researchjournali’s Journal of Finance
Vol. 5 | No. 4 October | 2017 ISSN 2348-0963 3
www.researchjournali.com
on unpredictable traditional agriculture (Mugenda, 2014).This state requires that each individual plan well
toward their retirement.
In an effort to involve individuals’ participation in their pension plans, there have been reforms across the world
with the disappearance of “Defined Benefit (DB) and the introduction of “Defined Contribution” (DC). DB is
a retirement plan where the employee receives a certain amount of money from the employer which is secured
by the government and based on their years of service and remuneration. On the other hand, with DCplans,
employees are required to be actively involved in the process of selecting their investment portfolios. The
portfolios are not fixed but rather subject to losses, expenses, and gains (OECD, 2005).Although the defined
contribution seems insecure, it grants individuals an opportunity to take charge of their retirement plans by
determining the amount of money they will actually need during retirement and this definitely necessitates the
possession of some financial skills.
Despite the global efforts aimed at reforming retirement systems, the RBA (2007) report indicates that only
10% of Kenyans have made financial plans for retirement. Why? Given that retirement planning is significantly
influenced by financial acumen, financial literacy has been cited as the reason behind the low uptake of pension
plans. This has then become a top agenda for policy makers, researchers, national regulators, pension firms,
international organizations such as world banks and private financial institutions (Miller et al. 2014).
Certainly, in many countries, the results of financial illiteracy are considered to be horrendous as evidenced by
Schwab (2008) who believes that the financial crisis of 2008 in the United States was largely triggered by low
financial literacy levels among other factors. A large number of individuals entered the mortgage industry with
a little understanding of its operations and cost implications. Schwab (2008) acknowledge that many Americans
are not able to access the vibrant economic opportunities due to lack of basic financial skills such as budgeting,
or saving towards retirement.
Similarly, empirical studies by Klapper et al. (2012) link the subprime housing crisis in the USA to a lack of
financial literacy among the consumers. Besides that, there is compelling evidence by Lusardi and
Mitchell(2012) from across the world that people have challenges in grasping the basic economic concepts
which would translate to poor personal financial planning.
Despite the low levels of financial literacy from the foregoing, and in an effort to get the Jua Kali workers
covered for retirement, Kenya set up a specific pension known as MBAO plan in June/2011. The plan has
unique features targeting the workers to save for retirement. A report by RBA (2012) however, shows that the
uptake of this plan has been dismal with only 15pc of the population participating. This then raises the question
on ‘why are Kenyans not saving for retirement’? The paper aimed at establishing whether financial literacy is
a contributing factor towards retirement planning.

Researchjournali’s Journal of Finance
Vol. 5 | No. 4 October | 2017 ISSN 2348-0963 4
www.researchjournali.com
Towards this end, a number of research have been undertaken that link financial literacy to increased savings,
diversification, debt and credit management, mortgage performance, and investment in shares (Behrman et al.
2012; Akin et al. 2012; Van- Rooij et al. 2011; Gerardi et al. 2010; Ding et al,2008; Lursardi and Mitchel, 2011;
2007; Quercia and Spader, 2008; Bucher-Koenen and Lusardi, 2011).
However, not many evidence- based inquiries have been carried out to study the impact of financial literacy on
retirement planning in developing countries. Most empirical studies on financial literacy are done in the US and
Europe (Dijk, 2012; Klapper et al. 2011; Berhman et al. 2012; Klapper, 2012; Miller et al. 2014; Zia et al. 2012;
Akin et al. 2012; Van- Rooij et al. 2011;Ding et al,2008; Lursardi and Mitchel, 2011; 2007; Quercia and Spader,
2008; Bucher-Koenen and Lursadi, 2011). In Africa for instance, the financial literacy surveys that have been
carried out by Finscope have focused on financial deepening and inclusion and failed to study the level of
financial capabilities of the populace (Sayinzoga et al. 2013). Whilst all these studies show the importance of
financial literacy, there is no known study that relates financial literacy and demographic factors on retirement
planning in the Jua Kali sector in the western part of Kenya.
1.2 OBJECTIVES OF THE STUDY
1.2.1 GENERAL OBJECTIVE
To study the relationship between financial literacy and retirement planning
1.2.2 SPECIFIC OBJECTIVES
To establish the levels of financial literacy and retirement planning among the Jua Kali workers
To ascertain any differences between the workers’ demographic factors and its influence on financial
literacy and retirement planning
To determine whether financial literacy, demographic factors, and modes of funds remittance are
correlated to retirement planning
1.3 HYPOTHESIS
Ho: There are no significant differences in demographic factors on retirement planning
Ho: There are no significant differences in demographic factors on financial literacy
H0: Financial literacy is not positively correlated to retirement planning
H0: Demographic factors are not positively correlated to retirement planning
H0: Modes of fund remittance are not positively correlated to retirement planning
H0: Demographic factors are not positively correlated to financial literacy
1.4 SIGNIFICANCE OF THE STUDY
This study will sensitize the workers on their retirement preparedness. Further, the study is expected to prepare
policy briefs for the policy makers to design financial literacy programs meant to address retirement planning
in the informal sector.

Researchjournali’s Journal of Finance
Vol. 5 | No. 4 October | 2017 ISSN 2348-0963 5
www.researchjournali.com
1.5 PAPER OUTLINE
The paper is organized into five sections. Section one is the introduction. The next section provides a review of
existing empirical literature on financial literacy and retirement planning. Sections three and four describe study
methodology and data analysis/interpretation respectively. Finally, section five present discussions and policy
recommendations.
2. REVIEW OF RELATED LITERATURE
The review of literature is arranged using a thematic approach. To start with, the concept of retirement planning
and its measurement was discussed, which is the dependent variable. Subsequently, the independent variables
(financial literacy, demographic factors, and modes of fund remittance) that are linked to retirement planning
were also discussed. The discussion of these variables with the theoretical model supports the hypothesized
relations in the conceptual framework.
2.1 OVERVIEW OF RETIREMENT SYSTEMS AND PLANNING
Retirement planning by governments arose from the need to improve the economic well-being of workers and
at the same time reduce inequality in society. The movement commonly known as Social Security (SS) started
in German and was referred to as Bismarckian SS targeting full-time industrial workers in the 19th century
(Overbye, 2006). The US also implemented their SS through an Act of 1935 while the UK enacted theirs in
1942. In Africa, retirement systems were initiated by the colonialists, while other systems were born on the
strength of the International Labour Organization (Justino, 2003).
In Kenya, retirement programs were brought about by the British colonial regime.Since then there has not been
a harmonized policy in the pension system. Currently, the structure comprises of the Civil Service Pension
Schemes, the National Social Security Fund (NSSF) and the Private Occupational Schemes both of which
operate under different Acts of Parliament.
During the British colonial regime, the retirement age was 55 years in a bid to manage the unsustainable public
service manpower after a proposal by the International Monetary Fund and the World Bank (World Bank,
2006). However, the current retirement age was reviewed to 60 years through an amendment to the constitution
in 2010. This was done for the reason that public servants at 55 years still had considerable capacities to continue
working.
After the colonial period and to streamline retirement schemes in Kenya, a Retirement Benefits Authority
(RBA) was formed. This body was formed as a response to the widespread inefficiencies facing retirement
schemes as: scams and lack of legal frameworks. RBA was created to protect all workers contributing to
National Social Security Fund (NSSF) (RBA, 2007). Despite the existence of RBA which is tasked with the

Researchjournali’s Journal of Finance
Vol. 5 | No. 4 October | 2017 ISSN 2348-0963 6
www.researchjournali.com
protection of the worker’s pension contributions, Okoth (2016) reports that the uptake of pension plans by
Kenyans is only at 10%.
The uptake of retirement plans by individuals is low because not many Kenyans have warmed up to the idea of
saving for the future (Njuguna and Otsola 2011). Even with the introduction of MBAO plan, which targets the
informal sector workers, enrollment for the plan is dismalRBA (2011). This indicates that the government needs
to encourage its workforce to start saving for the future by initiating friendly retirement models.
2.1.1 MEASURING RETIREMENT PLANNING
The main interest of this study was to establish the variables that affect retirement planning. Given that
retirement planning is the dependent variable, then understanding its measurement is invaluable. Questions as
for how much one thinks of retirement are useful in measuring retirement planning. Lusardi and Mitchell (2007)
confirm that thinking about retirement is positively related to the amount of accumulated wealth by the
respondents. Those people who are concerned about their retirement have not only thought about it but also put
in place schemes to use in their old age. This is in anticipation of a retirement lifestyle that is similar or better
than their present one. Other indicators used include awareness of pension plans, having a plan in place,
knowing how much is needed for retirement (OECD, 2005) in addition, other variables as preparing a budget
and ability to monitor the budget and seeking financial expertise when planning one’ finances were included.
2.2 FINANCIAL LITERACY
Financial literacy concept has not earned one standard definition. Houston (2011) notes that from 71 types of
research, different definitions of financial literacy have been used. Other closely related terms to financial
literacy are; financial knowledge, financial education, financial awareness, good financial behavior or financial
experiences. Despite the lack of consensus on the definition of the term, many studies focus on the ability to
make financial decisions, the knowledge one has and the outcome in form of a well-informed financial/
investment decision. It is for this reason that this study emphasized financial literacy alongside two dimensions:
the understanding of its knowledge and its application in the lives of the informal sector workers.
2.2.1 MEASURING FINANCIAL LITERACY
Since financial literacy does not have a standard definition, it has received different opinions on how it should
be measured. Besides a lack of standardized definition, the measures that have been applied do not integrate
both financial knowledge and its application. Additionally, there has not been a clear guide to determining who
is financially literate or illiterate (Houston, 2011).
The other challenges in measuring financial literacy are the lack of sufficient information to determine the level
of literacy. This is because, a majority of studies focus on a particular group of people, mostly retirees which
makes it hard to validate the results of the study to other groups (Hung et al. 2009).
Researchjournali’s Journal of Finance
Vol. 5 | No. 4 October | 2017 ISSN 2348-0963 7
www.researchjournali.com
Despite these indications of no standard measurement of financial literacy, other researchers disagree and argue
that measuring of three pertinent questions among respondents has been generally accepted as the standard way
of measuring financial literacy (Lusardi et al. 2005, 2007, Van Rooij et al. 2011). Indeed, the availability of
different financial products in different countries also complicates the effort of having a standardized tool to
measure financial literacy.
2.3 FINANCIAL LITERACY AND RETIREMENT PLANNING
There is interest from policymakers and other stakeholders on understanding the role of financial literacy in
retirement planning. According to Rooij (2011) individuals with high levels of financial literacy are more likely
to participate in pension schemes/ plans. Similarly, Lusardi and Mitchell (2011) show that once a person is able
to calculate their saving needs after retirement, then they are keen to follow through that program. The ability
to calculate no doubt requires numerical acumen and so low levels of financial knowledge, negatively impacts
on retirement planning. This is because of lack of confidence to make pension plans.
Sayinzoga et al. (2013) note that most research on financial literacy and retirement planning across the world
show low levels of financial literacy (Lursadi, 2007,2008, Xu and Zia 2012, Rooij, 2011, Lursadi and Mitchell,
2011). Whereas in Africa, literature on financial literacy are few, with other countries having none. This study
then aimed at contributing to the existing literature on retirement planning from the informal sector in Kenya.
On students, Djik (2012)studies the relationship between financial literacy and retirement planning among the
Dutch students. The findings indicate that the less illiterate tend to have under-diversified investments. This is
attributed to a lack of basic financial knowledge on risk transfers, diversification and the construction of optimal
investment. In Kenya, despite the greater saving potential of university students, their expenditure is higher
compared to their savings (Kinoti, 2012). This mismatch would be attributed to a lack of knowledge on critical
aspects of financial management, such as interest rates and risk diversification.
Gonzalez (2014) shows a lack of knowledge in financial matters and retirement planning among the
respondents. The report shows that respondents do prepare budgets; however, the budgets never cover all
expenses. When asked how long they can maintain themselves after an abrupt stop to their source of income,
the answer was only three months. This implies that individuals do not save nor invest for the future and
therefore they cannot absorb shocks such as employment termination or any other abrupt disruptions.
Berhman et al (2012) contribute to existing literature on financial literacy and retirement planning by
developing a more comprehensive set of questions on financial literacy. The findings indicate that financial
literacy is significantly related to household wealth accumulation, retirement planning being one aspect of it.
To stress the importance of financial literacy, Ben Bernanke the Chairman of the Federal Reserve in 2010 noted
that; helping people to understand the basic economics of borrowing and investing wisely is central to economic

Researchjournali’s Journal of Finance
Vol. 5 | No. 4 October | 2017 ISSN 2348-0963 8
www.researchjournali.com
growth in the general economy. The discourse implies that both authors agree that financial literacy is primary
in retirement planning.
Elsewhere, Klapper et al. (2012) study the relationship between financial literacy and retirement planning. The
results indicate that higher financial literacy levels are significantly related to greater savings and spending.
Given that financial crises are real, individuals require the financial acumen to navigate through the shocks that
may result during the crisis.
Besides that, Miller et al. (2014) in a meta- analysis study posit that financial literacy can have a positive effect
on the individuals’ savings and proper financial recording. What is more, to effectively measure financial
knowledge or literacy, it should not only be focused on an individual's ability for numeracy skills but should
also have a healthy combination of awareness and altitudinal questions (Zia et al. 2011). This then calls for the
formulation of financial literacy programs that are useful in impacting on the individuals’ financial behaviors.
To build on Zia et al. (2011), Houston (2011) posit that extant literature on financial literacy has been studied
mainly on three approaches: measuring individuals' levels of financial understanding; assessing their perception
on financial literacy and using objective or tests to identify their levels of financial literacy. In both approaches,
the most studied groups are employees, bank clients, financial professionals, students, the young, the old and
baby boomers. It is also notable that in all the studies there is not one agreed definition of financial literacy;
Houston (2011), then recommends for a common definition of financial literacy that incorporates all the
variables that influence it.
Indeed, issues regarding retirement planning and pension investment have been in existence for many years,
however as Lursadi and Mitchell (2007) note, even in countries with pension systems in existence for so long
still, its populace is under- informed of its benefits. For instance, in Chile, the pension system has been in place
for over 30 years and yet the Chileans are not well informed about saving for pensions. Lursadi and Mitchell
(2007) reveal that many households arrive close to retirement without enough savings for retirement to cushion
them against the shocks of retirement. One variable that is attributed to less saving is the lack of financial
literacy. Since financial illiteracy is widespread, individuals do not possess the basic skills required to plan for
retirement, mortgages and other forms of investments.
In a similar study, Lursadi and Mitchell (2006) state that financial illiteracy is widespread among people aged
50+ and majority of Americans are not able to answer questions on the interest rate, inflation, risk diversification
nor able to prepare a budget or a retirement plan since the calculations seem difficult and incomprehensible.
After all, only one-fifth of the respondents were able to prepare a successful retirement planning. From the
foregoing, it is clear that financial literacy is a key issue that requires the attention of policy makers to design
literacy programs to address the issue.

Researchjournali’s Journal of Finance
Vol. 5 | No. 4 October | 2017 ISSN 2348-0963 9
www.researchjournali.com
In Kenya, the level of financial literacy is worrisome. Njuguna and Otsola(2011) note lack of understanding of
pension fund matters hinders the participation in pension investment decisions by investors. There is the need
for a pension literacy program that is geared toward pension laws, investments design, and computation of
retirement benefits while financial literacy programs to focus on investment 3and debt management. The key
challenge to effective uptake of both pension and financial literacy programs is attributed to a lack of finances,
access to courses, heavy work-load and the feeling that those programs are not useful.
2.4 DEMOGRAPHIC FACTORS AND RETIREMENT PLANNING
Demographic factors such as age, education, gender, and income are related to retirement planning (Lursadi and
Mitchell, 2007; Lusardi et al. 2010). According to Bucher- Koenen et al. (2016) women show low levels of
financial acumen than men. This is in both basic financial and economic concepts. It is argued that women
generally have a longer lifespan compared to men, for this reason, they require financial literacy skills such as
retirement planning. Hsu (2011) observes that normally if households segregate tasks and a husband is always
charged with the management of finances, they will become specialists in financial management above their
spouses.
Hsu (2011) further reveals that women are more likely to state that they do not understand the answers to
financial literacy questions, unlike men. These results indicate gender disparities on financial literacy are real
and educational programs should be tailored towards different demographics, life stages and different learning
styles. These findings are in line with Lusardi and Mitchell (2007). It is evident that as much as a lot of gender
inequalities with regard to financial literacy are linked to the costs of information acquisitions, socio- economic
dispensation of men and women, a large difference still remains unanswered.
2.5 INFRASTRUCTURE AND RETIREMENT PLANNING
Given that the informal sector workers operate in unstructured environments and comprise of workers in
different business types, targeting them for retirement can be difficult. For this reason, governments need to
use ingenious approaches to reach them (Hu, and Stewart 2009). The use of existing infrastructures as Mobile
phone network- Mpesa can be a good point of contact, because most people in Kenya own mobile phones. In
fact mobile phones possession is so high that one would theorize that they be used as a mode of convenient
voting technology in the coming general election, August/2017.
2.6. THEORETICAL FOUNDATIONS OF THE STUDY
2.6.1 LIFE CYCLE MODEL (LCM)
This study was guided by the LCM model by Modigliani and Brumberg (1954) and Friedman (1957) who posit
consumers' savings and consumption trend is a reflection of their need to sustain a particular level of living in
the course of their lives. Since the future is uncertain, people will save for later years such as retirement and

Researchjournali’s Journal of Finance
Vol. 5 | No. 4 October | 2017 ISSN 2348-0963 10
www.researchjournali.com
unemployment. This model makes assumptions that consumers are rational, forward-looking thinkers, planners
and that retirement is a normative lifecycle.
The model, however, is also subject to limitations. It does not, for instance, explain why some people with
higher levels of incomes are saving less or do not save for retirement. Secondly, there are consumers who do
not have enough money to even afford the basic needs leave alone save. Thirdly, there are people who generally
do not believe in the culture of saving for the future. Fourthly, some people lack the basic financial skills
required to make decisions. Finally, in contrary to what the model suggest, it not all older people who save to
utilize over their old age, some of them continue saving up for their future in an effort to bequest their families
(Mitchell, 1996; Korczyk, 1998; Lusardi and Mitchel, 2007; Hurd,1990; Weil, 1994; Goetting andMartin,
2000).
Furthermore, it is worth noting that whilst the model has limitations, it provides invaluable insights to retirement
and how different consumers plan for it. In another two- period model study by Jappelli and Padual (2011) they
show that financial literacy is strongly correlated to the accumulation of wealth over people's life cycle, with
both increasing until retirement and falling thereafter. It was for this reasons that the variables in this model
were used in this study to show how financial literacy and different demographic factors influence retirement
planning.
3. RESEARCH METHODOLOGY
3.1 RESEARCH APPROACH AND DESIGN
The study used a quantitative approach. Creswell (2005) posit that a quantitative research is appropriate where
a research problem requires a description of trends or an explanation of the relationships among the variables
under study. Given that the nature of this study seeks to establish relationships between financial literacy and
retirement planning among the informal sector workers, then a quantitative approach was the most appropriate.
The study employed descriptive correlation research design. Descriptive studies generally use surveys or other
methods of data collections that rely on existing records. According to Polit and Hungler (1993), a survey
obtains information from the respondents in form of a series of questions generated by the investigator that they
need to answer. Information from respondents was collected through self-administered questionnaires by the
researcher.
3.2 RESEARCH SETTING
The study was drawn from individuals working in a cosmopolitan town-Eldoret in the Rift Valley Province of
Kenya. This place was picked due to a large number of informal sector workers residing in this town after
Nairobi (RBA, 2007).

Researchjournali’s Journal of Finance
Vol. 5 | No. 4 October | 2017 ISSN 2348-0963 11
www.researchjournali.com
3.3 THE STUDY POPULATION AND SAMPLE
The study included informal sector workers specializing in vegetables, fruits, second-hand clothes/ shoes, small
shops, commonly known as kiosks, motorbike transport- Boda Boda, saloon/barber shops, Petty trading,
welding, handicraft and wood work. As Verma (1999s) notes the informal sector surveys have been carried out
in different countries with different research designs. This is because the sector comprises of workers who are
scattered small-scale populations and there are no updated statistics that would be used as a sampling frame.
For that reason, this study used stratified sampling because the population is heterogeneous but members of
each subgroup are homogeneous.
According to the Jua Kali Sector Association report by Litu(2016) the approximate total population of the town
is 4,000 workers. Stratified sampling was used to cluster the different units within the informal sector.
Stratification was then done on the basis of the industry specialization of the workers. This design was chosen
because it is superior to random sampling for it reduces the sampling error and boosts greater levels of
representation.
3.3.1 SAMPLE SIZE
The sample size of the study was arrived at using normal distribution; the optimum sample size from a
population of 4,000 workers was 351 at a confidence level of 95%.
3.4 DATA COLLECTION
3.4.1 DATA COLLECTION INSTRUMENT
The study used a questionnaire as data instrument to obtain information from the subjects of the research.
Questions assessing knowledge and levels on financial literacy, assessment of and modes of saving for
retirement planning were asked. The questions were close ended to achieve precision in answering by the
respondents. To collect data, a variation of instruments by (Lursadi &Mitchell, 2005; Rooij, 2012 and OECD,
2011) whose Cronbach alpha was over 0.76 for both and with a good reliability test was used. Out of 351
questionnaires given out, 253 were filled up and returned- a return rate of 72.1%.
3.5 DATA ANALYSIS
Given that the questionnaire had closed- ended questions, Statistical Package for Social Sciences (SPSS) was
employed. Descriptive statistics, T-test, One- way ANOVA and Bivariate Correlation analysis were used to
analyze data.
3.6 ETHICAL CONSIDERATIONS
The study upheld honest and integrity. This was achieved by observing the anonymity, confidentiality and the
informed consent of the respondents. For the purposes of attaining confidentiality, there was no information
contained in the questionnaire that would be identifying in nature and questionnaires were only numbered after
data was collected.

Researchjournali’s Journal of Finance
Vol. 5 | No. 4 October | 2017 ISSN 2348-0963 12
www.researchjournali.com
4. DATA ANALYSES AND FINDINGS
4.1 DEMOGRAPHIC STATISTICS
Demographic factors were studied in regard to their association to financial literacy and retirement planning.
The study emphasized on socio-economic demographics such as age, gender, education, income, work status,
the number of children in a household and the business specialty among the informal sector workers.
Gender: The males constituted 61%, while 39 % were females. More men are into the Jua Kali sector and this
would be attributed to the nature of jobs- labor-intensive. Since the women in Africa are generally expected to
be homemakers, they stay back as the men go to work.
Age: On average over 54% of the respondents were below 40 years confirming that majority of the informal
workers are the youth and literacy programs would be just for them.
Education Levels: Amongst the respondents, 9% possess a university degree, those with tertiary college
qualifications accounted for 36%, those with high school grade were 27.3% while those with elementary
qualification were 26.9%. Close to half of the workers have attained tertiary education levels. This confirms the
inability of the formal sector to absorb all formally trained people.
Occupation: Almost 65%, of the respondents, own their own business while the rest are employed as casuals
or permanent staff. This indicates a majority of the workers own businesses. Given that most businesses are
small scale, the workers’ ability to access capital is curtailed.
Income: Only less than 25 pc of the workers earn more than Kshs. 50,000 which is an equivalent of £396 per
month. Apparently, a majority (75pc) earn well less than Kshs. 25,000 per month- a meager amount compared
to the escalating cost of living in Kenya.
Number of children: The results show that 67% of the workers have children while 65% of them have more
than four children. Family size among the informal sector workers tends to be large despite the resource
constraints that are faced by them.
Marital status: Of the workers, 37% were married, 27% single, 15% divorced while 8% and 4% were separated
and widowed respectively. Workers were spread out across all types of business because the study used
stratified random sampling.
4.2 LEVELS OF FINANCIAL LITERACY
4.2.1 DESCRIPTIVE STATISTICS ON LEVELS OF FINANCIAL LITERACY
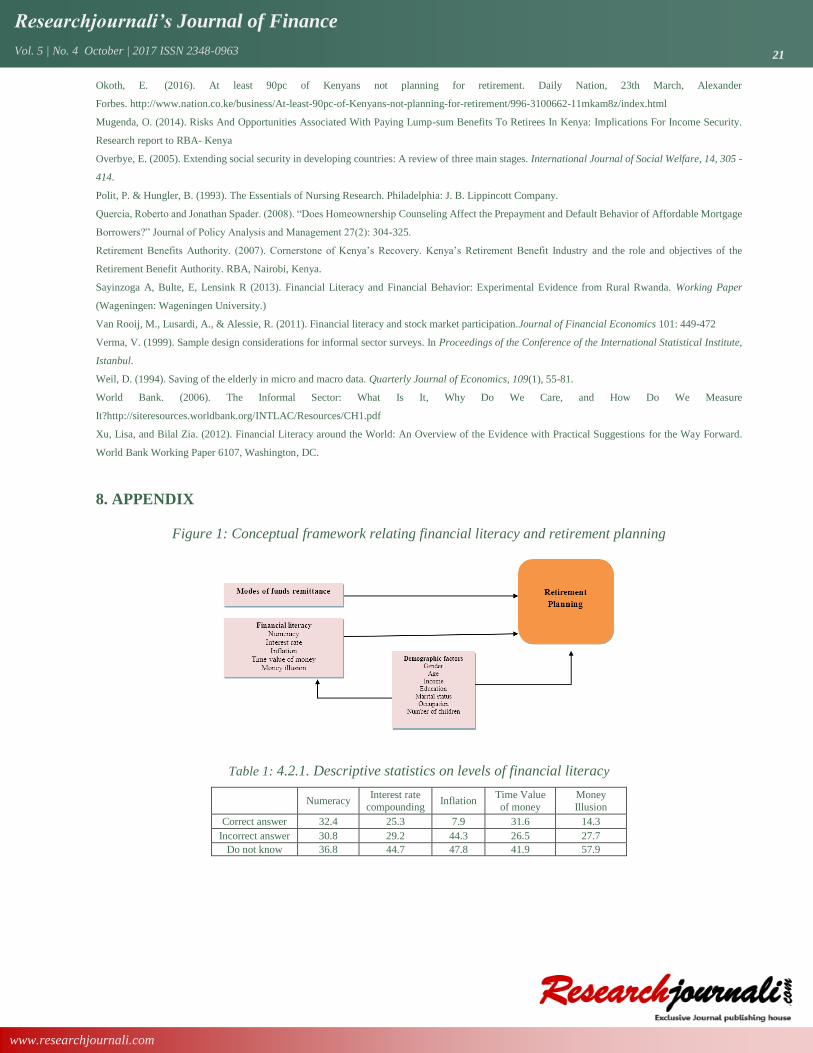
The statistics show (appendix table 1) that on average only 30% of the workers were able to answer basic
questions on simple calculations, interest rate compounding and the time value of money. Overall, not more
than 11% of the respondents gave correct answers on the concept of inflation and money illusion. Moreover,
results show that the respondents gave incorrect answers to questions on numeracy (30.8%), interest rate

Researchjournali’s Journal of Finance
Vol. 5 | No. 4 October | 2017 ISSN 2348-0963 13
www.researchjournali.com
compounding (29.2%), inflation (44.3%), and time value (26.5%) and money illusion (27.7%).It is also notable
that, over 50% workers indicated they did not know answers to all the basic financial questions. These results
mean that the financial levels of a larger population of the workers are low. These findings are in line with
(Moorthy et al. 2012; Miller et al. 2014; Gallery et al. 2011; Van Rooij 2012; Lursadi and Mitchell 2007) who
also report low financial literacy levels in their sample sizes.
4.2.2 DESCRIPTIVE STATISTICS ON THE FINANCIAL PRODUCTS HELD BY THE JUA KALI WORKERS
The results confirm (appendix table 2) that mobile phone payment (Mpesa) is the most preferredand held
financial product amongst the workers (60.9%), followed by pension funds (13%), bank savings
account(12.6%), loans (8.7%) and stocks/shares barely at 4%. It is evident that the informal workers are largely
unbanked. This means that financial products that are linked to the mobile phone would be more appealing to
them.
4.3 LEVELS OF RETIREMENT PLANNING AMONGST THE WORKERS
4.3.1 PROPORTION OF PLANNERS AND NONPLANNERS
Fig. 1
Only 36% of the workers save towards retirement- the planners. A majority of the people do not save for
retirement. These results confirm the findings of (RBA 2007; Okoth, 2016 Njuguna and Otislo 2011) that
retirement planning in Kenya is low, a situation that is believed to be compounded by low levels of financial
literacy.
4.3.2 SOURCES OF INFORMATION FOR THE PLANNERS
From the findings, a majority of the workers saving for retirement (see table 3) were motivated by their own
experiences (58.2%). The newspapers and financial advisers also influenced the planners (22%, 11%)
respectively. This implies that the workers are realizing through their own encounters that the traditional roles
where families took care of the retired and old are no longer tenable thus the need to save for their own
retirements.
0%
10%
20%
30%
40%
50%
60%
70%
Save for retirement Do not save for retirement
Retirement Planning

Researchjournali’s Journal of Finance
Vol. 5 | No. 4 October | 2017 ISSN 2348-0963 14
www.researchjournali.com
4.3.3 RETIREMENT SAVING SCHEMES HELD
A majority (68.1%) of the planners (table 4) save with MBAO pension plan. A few save at the NSSF and the
individual retirement schemes. This indicates that MBAO scheme is popular among the informal workers.
What is needed is the creation of awareness for more workers to save.
4.3.4 PREFERRED MODE OF REMITTING FUNDS
From a list of: Mpesa, Bank, Airtel Money, YU cash,, Saccos, and other money transfer channels, Mpesa was
the most preferred (89.9%) , while the rest of the channels did not receive any preference except the bank that
scored a paltry (10.1%) (See table 5 in the appendix). This is an indication that Mpesa mobile money transfer
is the most preferred channel of sending money to the retirement schemes. This is attributed to its cheaper
transactions costs 71.6%, and convenient locations (See table 6 in the appendix).
4.4 COMPARATIVE DIFFERENCES
4.4.1 T-TEST BETWEEN GENDER AND CHILDREN ON RETIREMENT PLANNING
Since gender and having children has only two groups, (see appendix table 7) then T- test was used. The results
indicate significant differences between male and female with regard to retirement planning. The Sig. (2-
Tailed) values are less than .05 in the majority of the measures of retirement planning. The differences imply
that men save more than women. The findings are similar to (Lursadi et al. 2008; Hsu, 2011).
Further results show no significant differences between workers with or without children on retirement
planning. This means that to have children or not, does not significantly influence one’ decision to plan for
retirement.
4.4.2 ONE-WAY ANOVA DEMOGRAPHIC FACTORS AND RETIREMENT PLANNING
Given that the other demographic factors have more than two groups or levels, ANOVA was used. As
determined (see table 8) by one-way ANOVA (F (4,248) =7.438, p= .000) there was a statistically significant
difference between the age groups in relation to the budget preparation and willingness to save (F(4,248) =
4.233, p= .002. To establish the age group that is significantly different a Tukey post hoc test was done. Those
aged 31-40 were confirmed to prepare budgets and save more. This would be attributed to a realization of the
need to save occasioned by their mid-life phase.
Whereas there is no significant difference between workers with or without children on retirement planning,
there is a statistically significant difference between the number of children one has and their thinking about
retirement planning (p=.003) and the need to seek financial expertise (p=.000). The post hoc results show
families of four seem to have started thinking more about retirement compared to others. Those workers with
more than 5 children had not thought about budgeting or saving. This would be due to the assurance that their
children will take care of them at old age.

Researchjournali’s Journal of Finance
Vol. 5 | No. 4 October | 2017 ISSN 2348-0963 15
www.researchjournali.com
Workers who are divorced (p= .016) and those who are single (p=.016) have started to think about their
retirement as revealed by the Tukey post hoc test. Which means the marital status of the respondents influenced
their retirement planning. These findings concur with Miller et al. (2014) that people who are married tend to
feel comfortable in the knowledge that their spouses would take care of their retirement needs.
A statistically significant difference was also recorded between income levels and retirement planning (p=.000).
indeed, those workers with higher income levels warmed up to retirement planning whereas those with minimal
revenues preferred to meet their basic needs before considering saving for retirement.
Those workers with university and tertiary level education indicated higher scores on retirement planning than
their counterparts (Post hoc p values of .016, .001, .000, .000, .013 on all indicators of retirement planning).
These multiple analysis results indicate that higher education levels positively influence retirement planning.
4.4.3 ONE-WAY ANOVA DEMOGRAPHIC FACTORS AND FINANCIAL LITERACY
Significant differences (see table 9) between numeracy levels (p=.001), interest rate compounding (p=.000),
time value of money (p=.000) and money illusion (p=.000) were reported in relation to age. Workers aged 31-
40 answered correctly to the financial literacy questions when compared with the rest. These results are similar
toLusardi and Mitchell (2007) that the young possess higher financial literacy levels than the old people.
Moreover, workers with relatively higher income levels tended to grasp the meaning of time value of money
unlike their counterparts (p=.002) while those who are single or divorced seemed to also have higher financial
literacy levels compared to the married people (p=.000). Finally, those workers with a higher education level
tended to understand the time value of money concept. This can be attributed to their basic financial skills
acquired whilst in college. Interestingly the same group had a hard time understanding the concept of interest
rate compounding and inflation respectively (p=.798 and p=.461)
Ho: There are no significant differences in demographic factors on retirement planning
Ho: There are no significant differences in demographic factors on financial literacy
Test results: Both of these hypotheses were rejected.
4.5 CORRELATIONS
4.5.1 CORRELATION BETWEEN FINANCIAL LITERACY AND RETIREMENT PLANNING
A significant correlation (see appendix table 10) exists between the workers’ numeracy levels and thinking
about retirement (r= .422**),and awareness of available pension plans (r=.222**)and possession of budgets
(r=340**). The results indicate a positive relationship between financial literacy and retirement planning.
To understand the relationship between understanding the concept of interest rate compounding and thinking
about retirement, budgeting and the use of finance experts on money management (r=.140*, r=.153*,
r=.257**respectively) a slight association was reported on one hand. On the other hand, the workers'

Researchjournali’s Journal of Finance
Vol. 5 | No. 4 October | 2017 ISSN 2348-0963 16
www.researchjournali.com
understanding of inflation concept seemed to have a weak association with retirement planning (r=.083). This
would be linked to a low-level understanding of inflation among the Jua Kali workers.
Time value of money has a slight relationship with thinking about retirement, and moderate association with
budgeting preparation (r=.312**) and monitoring (r=.450**). Money illusion also has a significant association
with retirement planning (r=.329**, p= .000). These findings are in line with other studies which link financial
literacy to retirement planning (Berhman et al. 2012; Akin et al. 2013; Allesse at al. 2011; Lusardi and Mitchell,
2007). A study by OECD (2005) also reported international evidence that financial levels across the world are
low citing Australia, New Zealand, German, Japan, UK, and Korea with worrisome statistics. In reality, people
who are financially literate plan their finances including saving towards their retirement. Therefore the null
hypothesis:
Ho= Financial literacy is not related to retirement planning was rejected.
4.5.2 THE RELATIONSHIP BETWEEN DEMOGRAPHIC FACTORS AND RETIREMENT PLANNING
There is a significant correlation between gender and retirement planning (r=.354**,) (r=.168*, p= .007) (r=.142*,
p=.024) (r= .313**, p= .000) (r= .139*, p= .027) and (r=.160*, p= .011) in all the six aspects of planning for
retirement-See appendix table 11. These results agree with earlier comparative analysis on men saving more
than women towards retirement.
Besides that, a slight relationship was reported between workers’ education levels and their abilities to prepare
and monitor budgets (r=.142* and r=.135*). This means those workers with higher levels of education plan their
finances well compared to others. The results are in synch with (Lusardi and Mitchell, 2007; OECD, 2005;
Miller et al. 2014)’ findings. Further, workers with higher levels of income also seek financial expertise
(r=.247**) indicative that higher income workers are willing to spare some of the money towards sustaining
their future. The null hypothesis:
Ho= Demographic factors are not significantly related to retirement planning- was rejected.
4.5.3 RELATIONSHIP BETWEEN INFRASTRUCTURE AND RETIREMENT PLANNING
For planning to take place, access to information play a key role, the results show (see table 12) a significant
correlation between information channels and retirement planning (p= .000) and a strength of association of
r=.370**. Similarly, the modes of remitting funds to retirement schemes were correlated to retirementplanning
(r= .207**) while Mpesa was the most preferred mode of remitting funds (r=.536**) by the planners. Earlier
statistics pointed to Mpesa being affordable, and easily available to many Jua Kali retirement planners. This
being the case, a retirement model based on the mobile network operator is likely to be a success in the informal
sector. Consequently the hypothesis:
H0: Modes of fund remittance are not positively correlated to retirement planning- was rejected.

Researchjournali’s Journal of Finance
Vol. 5 | No. 4 October | 2017 ISSN 2348-0963 17
www.researchjournali.com
4.5.4 CORRELATION BETWEEN DEMOGRAPHIC FACTORS AND FINANCIAL LITERACY
Gender, income, the number of children and the business type (see appendix table 13) one is engaged in
(r=.347** r= .148* r= .141* and r=.141*) respectively are significantly related to numerical literacy. Gender,
age and the level of education (.195** .267** .154* ) are also significantly related to the understanding of interest
rates compounding., while the understanding of time value of money is also related to the level of one’ education
and income levels (.159* .219**). These findings indicate that demographic factors are significantly correlated
with financial literacy and high levels of education and incomes are positively related to higher levels of
financial literacy which translates to retirement planning.
Ho= Demographic factors are not significantly related to financial literacy- was rejected.
5. DISCUSSIONS AND POLICY RECOMMENDATIONS
The informal workers generally have low incomes, the majority are self-employed, while the rest work on a
part-time basis. Unlike the formal workers, the Jua Kali workers are not subject to any compulsory modern
pension systems. And as the results indicate, their understanding of financial products and pension plans are
limited, this complicates their access to retirement schemes. However, homegrown options are explored to have
the workers plan for retirement.
5.1 SOCIAL ASSISTANCE
The findings show even as we talk of retirement planning, there is a group of workers whose main challenge is
the ability to cover their living costs. To this group, the thought about retirement planning is far fetched. The
government should then adopt an approach, through means testing to bring these groups of workers to join a
formal pension scheme on a non- contributory basis. This program is in place in South Africa, where informal
sector workers are covered by the government in an old- age social plan while Kenya’s zero pillar program is
largely in its infancy.
5.2 MOTIVATE VOLUNTARY CONTRIBUTION
The findings indicate that some informal workers especially those with higher incomes are able to save towards
their retirement. Given the existence of MBAO plan targeting informal workers, its low uptake would be
improved by including flexible terms in the plan. Most workers would prefer a scheme that allows irregular
contributions, for the reason that their incomes also vary, while allowing for withdrawals during extreme
financial difficulties such as; illness on an assessment basis. These flexible arrangements would encourage
saving for retirement.
5.3 FINANCIAL LITERACY PROGRAMS
As the Bible says “my people perish for lack of knowledge” (Hosea 4:6) one other reason why people do not
join pension programs is for lack of understanding matters financial. As noted by Hu and Stewart (2009) pension
Researchjournali’s Journal of Finance
Vol. 5 | No. 4 October | 2017 ISSN 2348-0963 18
www.researchjournali.com
benefits in Chinalie unclaimed, the UK – GBP 6 billion, largely due to lack of awareness. In Kenya, financial
literacy programs can be undertaken in the informal sector through a number of avenues:
Road shows- Some Jua Kali workers work under shades by the road, this would be an appropriate learning
center without taking them off their work.
Seminars and workshops- there should be concerted efforts by the government to reach out the informal
workers by organizing financial training workshops and follow-up on implementation.
Through church- Kenya is largely a Christian country and church attendance is common. Since the church
plays a key role in society in shaping behavior, financial education can be undertaken through the clergies
as part of the sermons or by way of announcements. This can also be done at the Mosques and temples.
Through ‘Mary go rounds’- Kenyans are generally social and communalistic, and for this reason, they
create informal financial groups to take care of their welfare. In some of these groups, they contribute
monies to a kitty and borrow it out at an interest rate. These activities bring them closer socially and
economically and can be used as channels of disseminating financial literacy and retirement planning
concepts amongst them.
5.4 COMPULSORY CONTRIBUTIONS
In Kenya, there have been aspects of compulsory contributions towards retirement by employers in the informal
sector. For instance, an employer with more than five workersis bound to make a Kenya Shillings.200, as
monthly contributions toward their retirement. However, from the findings, the majority of the informal workers
are self- employed and do not save for retirement. Given this state, the government should consider making
retirement contributions compulsory. This is not the optimal policy, but it is a better option where informal
workers consider saving for retirement as the least priority especially those with higher level incomes.
5.5 USE EXISTING INFRASTRUCTURE TO ENCOURAGE RETIREMENT PLANNING
The majority of Kenyans own a mobile phone and the use of Mpesa – a mobile money transfer network is
common. Most people use Mpesa to save money, send money to relatives, friends and family. Earlier results
show that the planners use prefer to use Mpesa to remit the funds to the MBAO pension plan. This is for the
reason that it is cheap and easily available to them. The government of Kenya should partner with Safaricom-
which is the Mpesa operator network to roll out retirement awareness programs aimed at the informal workers.
Certainly, some of these programs would include financial literacy text messages, retirement planning alerts,
and reminders on the importance of planning for retirement.
Given that Mpesa transactions are cheap and easily available to the Jua Kali workers, sending money to
retirement schemes would be fast and convenient. The presence of Mpesa has made business dealing in Kenya
efficient and the government should take advantage of the existing infrastructure to reach to as many informal

Researchjournali’s Journal of Finance
Vol. 5 | No. 4 October | 2017 ISSN 2348-0963 19
www.researchjournali.com
workers as possible to save for retirement. Besides Mpesa, the informal workers would also use nearby post
offices, microfinance institutions and banks to remit funds to retirement schemes.
5.6 MATCHING CONTRIBUTION MODEL
One other way is to encourage the Jua Kali workers to participate in pension schemes and the government to
match their contributions. Whenever a worker saves for retirement, the government matches the worker’
contributions by a particular percentage, this would excite the workers to want to save. Saving for retirement
can be foreign, for the reasons that people do not see the future and tend to live for now. For the government to
break this inertia, they will need to adopt models that make it attractive for the workers to save towards
retirement.
6. CONCLUSION
Planning for retirement can never be gainsaid; retirement which is an important phase of life when workers
retreat from active employment requires elaborate financial planning. Nevertheless, It is worrisome that
majority of the workers are not planning for retirement, a situation that is compounded by low levels of financial
literacy, demographic factors, and infrastructural models. Given that the informal sector plays a crucial role in
world economies, then policymakers need to design demographic based financial literacy programs to sensitize
workers on retirement planning. Traditionally, families in Kenya take care of old age risks of retirees, however,
this is untenable in the face of falling safety nets. With the advent of retirement reforms across the world, there
have been shifts from Defined Benefits to Defined Contributions in an effort to encourage individuals to
participate in their own process of retirement planning. And amid findings showing low financial literacy, lack
of retirement planning, and preferred modes of saving by the workers, the government should then initiate
home-grown programs as social assistance, compulsory contributions, matching model and the use of Mpesa
platform to encourage saving for retirement among the Jua Kali workers. Despite new efforts to create a model
to boost financial literacy and retirement planning among the informal workers, more research is needed to
develop models that will ensure implementation and sustainability of financial literacy programs and awareness
on retirement planning.
7. REFERENCES
Akin, G., Ahmet F., A., Serap O., & Levent, Y. (2013). Credit Card Satisfaction and Financial Literacy: Evidence from an Emerging Market
Economy. Emerging Markets Finance & Trade 48(5): 103-115.
Behrman, R., Olivia S., Cindy K, & David (2012). The Effects of Financial Education and Financial Literacy: How Financial Literacy Affects Household
Wealth Accumulation. American Economic Review: Papers & Proceedings 102(3): 300-304.
Bucher-Koenen, T. & Annamaria, L. (2011). Financial literacy and retirement planning in Germany. Journal of Pension Economics and Finance 10(4):
565-584.
Creswell, J. W. (2005). Educational research: Planning, conducting, and evaluating quantitative and qualitative research. Upper Saddle River, N.J:
Merrill.

Researchjournali’s Journal of Finance
Vol. 5 | No. 4 October | 2017 ISSN 2348-0963 20
www.researchjournali.com
Dijk, N. V. (2012). The effect of financial literacy on retirement planning among Dutch students. University of Amsterdam.
Jappelli, J., & Padula, M. (2010). Cognitive abilities and portfolio choice. European Economic Review, 54, 18-39.
Friedman, E. & Havinghurst, R. (1954). The Meaning of Work and Retirement. Chicago, University of Chicago Press.
Gerardi, G. & Stephan M. ( 2010). Financial Literacy and Subprime Mortgage Delinquency: Evidence from a Survey Matched to Administrative
Data. Federal Reserve Bank of Atlanta Working Paper Series 2010-10.
Goetting, M., Martin, P., & Johnson, C. (2000). Older adults and financial bequests. International Journal of Aging and Human Development, 50(3),
227-244.
González, K. (2014). Financial literacy and retirement planning: Evidence from Puerto Rico, Global Journal of Business Research, 8(1), 87-98. doi:
10.4148/jft.v3i2.1806
Hu, Y. and F. Stewart (2009). Pension Coverage and Informal Sector Workers: International Experiences. OECD Working Papers on Insurance and
PrivatePensions, No. 31, OECD publishing, © OECD. doi:10.1787/227432837078.
Huston, S. (2010). Measuring Financial Literacy. The Journal of Consumer Affairs, 44 (2), pp. 296-316.
Hung, A., Parker, A. &Yoong, J. (2009). Defining and Measuring Financial Literacy. RAND Working Paper, WR-708.
Hurd, M.D. (1990). Research on the elderly: Economic status, retirement, and consumption and saving. Journal of Economic Literature, 28(2), 565-637.
International Labour Organization (ILO). (2005). Social protection and social policy. Commission of Employment and Social Policy, Geneva
Jappelli, T. (2010). Economic Literacy: An International Comparison. The Economic Journal,120, pp. 429-451.
Justino, P. (2003). Social security in developing countries: Myth or necessity? Evidence from India. Prus Working Paper, 20, 1 -35.
Kee-Lee, C., & Chow, N. S. (2005). To Retire or Not to Retire: Is There an Option for Older Workers in Hong Kong? Social Policy & Administration,
39(3), 233-246.
Kinoti M. K., (2012). Financial Management Literacy and application among university students as a contingency against unemployment in Kenya.
Unpublished thesis in Kabarak University.
Korczyk, S.M. (1998). How Americans Save. Washington, DC: AARP.
Litu. (2016, October 24). Interview with the chairman of jua kali association (Kamukunji). Retrieved February 19, 2017, from
https://litualex.wordpress.com/2016/10/24/interview-with-the-chairman-of-jua-kali-association-kamukunji/
Lusardi, A., and Mitchell, O.S. (2005). Financial Literacy and Planning: Implications for Retirement Wellbeing. Working paper, Pension Research
Council, Wharton School, University of Pennsylvania.
Lusardi, A., & Olivia, M. (2007). Financial Literacy and Retirement Planning: New Evidence from the Rand American Life Panel. Michigan Retirement
Research Center Research Paper No. WP 2007-157.
Lusardi, A., & Olivia M. (2009). How Ordinary Consumers Make Complex Economic Decisions: Financial Literacy and Retirement Readiness. National
Bureau of Economic Research, Working Paper No. 15350.
Lusardi, A., Mitchell, S., & Curto, V. (2010). Financial Literacy among the Young: Evidence and Implications for Consumer Policy. NBER Working
Paper, No. 15352.
Lusardi, A., & Olivia M. (2011). Financial Literacy around the World: An Overview. National Bureau of Economic Research Working
Paper No. 17107.
Lusardi, A., & Olivia M. (2013). The Economic Importance of Financial Literacy: Theory and Evidence. National Bureau of Economic Research Working
Paper 18952
Lusardi, A., Daniel S., &Peter, T. (2011). “Financially Fragile Households: Evidence and Implications.” Brookings Papers on Economic Activity, Spring
2011: 83-150
Miller et al. (2014). Title: can you help someone become financially capable? World Bank policy working research. Global Financial Report
Modigliani, F. & Brumberg, R. (1954). Utility analysis and the consumption function: An interpretation of cross-section data. In K. Kurihara (Ed.), Post
Keynesian Economics (pp. 388-436). New Brunswick, NJ: Rutgers University Press.
Njuguna, A.,& Otsola, J. (2011) Predictors of Pension Finance Literacy: A Survey of Members of Occupational Pension Schemes in Kenya. International
Journal of Business and Management Vol. 6, No. 9; September 2011. Available online: www.ccsenet.org/ijbm No. 26, OECD publishing, ©
OECD.doi:10.1787/238013082545
OECD. (2005). OECD pensions at a glance 2005: Public policies across OECD countries. OECD Publishing.
OECD INFE (2011). Measuring Financial Literacy: Core Questionnaire in Measuring Financial Literacy: Questionnaire and Guidance Notes for
conducting an Internationally Comparable Survey of Financial literacy. Paris: OECD.
Researchjournali’s Journal of Finance
Vol. 5 | No. 4 October | 2017 ISSN 2348-0963 21
www.researchjournali.com
Okoth, E. (2016). At least 90pc of Kenyans not planning for retirement. Daily Nation, 23th March, Alexander
Forbes. http://www.nation.co.ke/business/At-least-90pc-of-Kenyans-not-planning-for-retirement/996-3100662-11mkam8z/index.html
Mugenda, O. (2014). Risks And Opportunities Associated With Paying Lump-sum Benefits To Retirees In Kenya: Implications For Income Security.
Research report to RBA- Kenya
Overbye, E. (2005). Extending social security in developing countries: A review of three main stages. International Journal of Social Welfare, 14, 305 -
414.
Polit, P. & Hungler, B. (1993). The Essentials of Nursing Research. Philadelphia: J. B. Lippincott Company.
Quercia, Roberto and Jonathan Spader. (2008). “Does Homeownership Counseling Affect the Prepayment and Default Behavior of Affordable Mortgage
Borrowers?” Journal of Policy Analysis and Management 27(2): 304-325.
Retirement Benefits Authority. (2007). Cornerstone of Kenya’s Recovery. Kenya’s Retirement Benefit Industry and the role and objectives of the
Retirement Benefit Authority. RBA, Nairobi, Kenya.
Sayinzoga A, Bulte, E, Lensink R (2013). Financial Literacy and Financial Behavior: Experimental Evidence from Rural Rwanda. Working Paper
(Wageningen: Wageningen University.)
Van Rooij, M., Lusardi, A., & Alessie, R. (2011). Financial literacy and stock market participation.Journal of Financial Economics 101: 449-472
Verma, V. (1999). Sample design considerations for informal sector surveys. In Proceedings of the Conference of the International Statistical Institute,
Istanbul.
Weil, D. (1994). Saving of the elderly in micro and macro data. Quarterly Journal of Economics, 109(1), 55-81.
World Bank. (2006). The Informal Sector: What Is It, Why Do We Care, and How Do We Measure
It?http://siteresources.worldbank.org/INTLAC/Resources/CH1.pdf
Xu, Lisa, and Bilal Zia. (2012). Financial Literacy around the World: An Overview of the Evidence with Practical Suggestions for the Way Forward.
World Bank Working Paper 6107, Washington, DC.
8. APPENDIX
Figure 1: Conceptual framework relating financial literacy and retirement planning
Table 1: 4.2.1. Descriptive statistics on levels of financial literacy
Numeracy Interest rate
compounding Inflation
Time Value
of money
Money
Illusion
Correct answer 32.4 25.3 7.9 31.6 14.3
Incorrect answer 30.8 29.2 44.3 26.5 27.7
Do not know 36.8 44.7 47.8 41.9 57.9

Researchjournali’s Journal of Finance
Vol. 5 | No. 4 October | 2017 ISSN 2348-0963 22
www.researchjournali.com
Table 2: 4.2.2. Financial products most heard and held by the Jua Kali workers
Frequency Percent Valid Percent-
Popular product
Financial
product held
Valid
pension fund 33 12.9 13.0 12.8
bank loan 22 8.6 8.7 5.1
savings account 32 12.5 12.6 12.1
stocks/shares 1 .4 .4 .2
Mobile phone payment account 154 60.4 60.9 59.5
none of the above 11 4.3 4.3 10.3
Total 253 99.2 100.0
Missing System 2 .8
Total 255 100.0
Table 3: Sources of information for the planners
Frequency Percent Valid Percent Cumulative Percent
Valid
financial advisers/brokers 10 4.0 11.0 11.0
newspaper articles 20 7.9 22.0 33.0
my own experience 53 20.9 58.2 91.2
other sources 8 3.2 8.8 100.0
Total 91 36.0 100.0
Missing System 162 64.0
Total 253 100.0
Table 4: 4.3.3. Retirement saving schemes held
Frequency Percent Valid Percent Cumulative Percent
Valid
NSSF 11 4.3 12.1 12.1
MBAO Plan 62 24.5 68.1 80.2
Individual Retirement Planning 18 7.1 19.8 100.0
Total 91 36.0 100.0
Missing System 162 64.0
Total 253 100.0
Table 5: 4.3.4. Preferred mode of remitting funds
Frequency Percent Valid Percent Cumulative Percent
Valid
Mpesa 80 31.6 89.9 89.9
Bank 9 3.6 10.1 100.0
Total 89 35.2 100.0
Missing System 164 64.8
Total 253 100.0
Table 6: .3.4.1. Why it is preferred
Frequency Percent Valid Percent Cumulative Percent
Valid
cheaper transaction costs 63 24.9 71.6 71.6
friendly customer service 1 .4 1.1 72.7
easily available 21 8.3 23.9 96.6
easy to use 3 1.2 3.4 100.0
Total 88 34.8 100.0
Missing System 165 65.2
Total 253 100.0
Table 7: T-test on gender and children on retirement planning
Thinking
about
retirement
Awareness of
pension
schemes
Amounts
needed for
retirement
Preparation
of budgets
I monitor
budget
Seeking
Financial
expertise
I live for
now
No need
to save
Sig. Sig. Sig. Sig. Sig. Sig. Sig. Sig.
Gender .000 .004 .021 .000 .028 .007 .388 .070
Have children .023 .012 .091 .029 .006 .622 .580 .0260

Researchjournali’s Journal of Finance
Vol. 5 | No. 4 October | 2017 ISSN 2348-0963 23
www.researchjournali.com
Table 8: 4.4.2. ONE-WAY ANOVA Demographic factors and Retirement planning
Sig. Sig. Sig. Sig. Sig. Sig. Sig.
Age Number of
children Income
Work status
Marital status
Education levels
Business specialization
Thinking about retirement .081 .003 .000 .226 .012 .000 .020
Awareness of pension schemes .097 .070 .000 .075 .009 .000 .000
Amounts needed for retirement .028 .233 .059 .431 .012 .018 .031
Preparation of budgets .000 .445 .000 .050 .608 .000 .001
Monitoring .099 .832 .000 .087 .184 .000 .000
Seeking Financial expertise .096 .000 .634 .281 .193 .090 .381
I live for now .055 .089 .077 .288 .031 .000 .014
No need to save .002 .076 .000 .201 .152 .000 .000
Table 9: 4.4.3. ONE-WAY ANOVA Demographic factors and Financial Literacy
Age Number of
children
Income Work
status
Marital
status
Education
levels
Business
specialization
Planners/ Non
planners
Sig. Sig. Sig. Sig. Sig. Sig. Sig. Sig.
Numeracy .001 .543 .089 .100 .152 .022 .000 .001
Interest rate compounding .000 .077 .365 .866 .627 .037 .798 .205
Inflation .944 .679 .426 .420 .630 .102 .461 .836
Time value of money .000 .146 .002 .002 .000 .000 .000 .000
Money illusion .000 .087 .027 .501 .007 .000 .000 .002
Table 10: 4.5.1. Correlation between Financial Literacy and Retirement Planning
Thinking
about
retirement
Awareness
on pension
plans
Amount
needed for
retirement
Budgeting Monitoring
budget
Use of
Financial
experts
Do not care
about the
future
Spending is
preferred to
saving
Numeracy
Pearson
Correlation .422** .222** .024 .340** .277** .081 .012 .016
Sig. (2-tailed) .000 .000 .699 .000 .000 .200 .847 .799
N 253 253 253 253 253 253 253 253
Interest rate
compounding
Pearson Correlation
.140* .080 -.092 .153* .079 .257** .069 .084
Sig. (2-tailed) .026 .207 .144 .015 .208 .000 .273 .180
N 253 253 253 253 253 253 253 253
Inflation
Pearson
Correlation -.109 -.072 -.088 -.100 -.070 .047 .083 .102
Sig. (2-tailed) .083 .254 .162 .114 .269 .453 .191 .106
N 253 253 253 253 253 253 253 253
Time value of money
Pearson Correlation
.272** -.087 .014 .312** .450** .054 .001 .151*
Sig. (2-tailed) .000 .170 .830 .000 .000 .389 .984 .016
N 253 253 253 253 253 253 253 253
Money illusion
Pearson
Correlation .329** .287** -.035 .233** .173** .032 .060 .129*
Sig. (2-tailed) .000 .000 .577 .000 .006 .610 .343 .040
N 253 253 253 253 253 253 253 253
**. Correlation is significant at the 0.01 level (2-tailed).
*. Correlation is significant at the 0.05 level (2-tailed).
Table 11:4.5.2. The relationship between Demographic factors and retirement planning
I have started
thinking
about my
retirement
I am aware
of the
MBAO
pension plan
in Kenya
understands
how much I
will need for
my retirement
Have a
budget on
saving and
spending
Monitoring the
budget to meet
the financial
needs
I seek the help of
financial experts
in planning my
finances
I live for
now and
tomorrow
will take care
of itself
its more
satisfying to
spend now
than save for
the long-term
What is your
gender
Pearson
Correlation .354** .168** .142* .313** .139* .160* .050 .100
Sig. (2-
tailed) .000 .007 .024 .000 .027 .011 .430 .111
N 253 253 253 253 253 253 253 253
What is you
age range
Pearson
Correlation -.030 .127* .074 .035 .029 -.006 .071 .121
Sig. (2-
tailed) .638 .044 .240 .582 .646 .926 .262 .055
N 253 253 253 253 253 253 253 253
Pearson
Correlation -.070 .019 .091 .142* .135* -.105 -.060 -.093

Researchjournali’s Journal of Finance
Vol. 5 | No. 4 October | 2017 ISSN 2348-0963 24
www.researchjournali.com
What is your
highest level
of education
Sig. (2-
tailed) .264 .766 .151 .024 .031 .095 .339 .138
N 253 253 253 253 253 253 253 253
How much
money do
you make in
a month
Pearson
Correlation .116 .109 -.018 .100 .062 . 247** .045 .028
Sig. (2-
tailed) .065 .084 .779 .112 .328 .000 .474 .659
N 253 253 253 253 253 253 253 253
Do you have
children
Pearson
Correlation -.048 .095 .022 .049 .062 -.060 -.030 -.087
Sig. (2-
tailed) .451 .134 .726 .438 .333 .345 .636 .173
N 249 249 249 249 249 249 249 249
How many
children
Pearson
Correlation -.002 .070 .044 .115 .065 .080 .014 .005
Sig. (2-
tailed) .982 .334 .544 .111 .371 .269 .845 .942
N 194 194 194 194 194 194 194 194
Which is
your current
marital status
Pearson
Correlation -.077 .031 .115 .061 .026 .132* -.108 -.116
Sig. (2-
tailed) .222 .626 .068 .333 .677 .035 .086 .065
N 253 253 253 253 253 253 253 253
which is
your work
status
Pearson
Correlation .104 .097 .003 .163** .023 -.111 -.023 .001
Sig. (2-
tailed) .098 .126 .958 .010 .720 .079 .721 .985
N 252 252 252 252 252 252 252 252
which is
your
business type
Pearson
Correlation .041 -080 -.059 -.102 .146* .002 -.022 .100
Sig. (2-
tailed) .519 .205 .353 .105 .020 .972 .730 .114
N 253 253 253 253 253 253 253 253
**. Correlation is significant at the 0.01 level (2-tailed).
*. Correlation is significant at the 0.05 level (2-tailed).
Table 12: 4.5.3. Relationship between infrastructure and retirement planning
I have started
thinking about
my retirement
I am aware of the
MBAO pension
plan in Kenya
understands how
much I will need
for my retirement
Have a
budget on
saving and
spending
Monitoring the
budget to meet
the financial
needs
I seek the help of
financial experts in
planning my finances
I live for now and
tomorrow will
take care of itself
its more satisfying
to spend now than
save for the long-
term
information channel that
influenced you to save for
retirement
Pearson
Correlation .370** .294** .093 .246* .304** .258* .095 .167
Sig. (2-tailed) .000 .005 .379 .019 .003 .013 .372 .114
N 91 91 91 91 91 91 91 91
which scheme do you
save in
Pearson
Correlation .162 .207* .146 .072 .040 .110 .202 .185
Sig. (2-tailed) .124 .049 .168 .498 .708 .298 .054 .079
N 91 91 91 91 91 91 91 91
preferred mode of
remitting funds
Pearson
Correlation .510** .536** .027 .220* .309** .017 .133 .199
Sig. (2-tailed) .000 .000 .804 .038 .003 .876 .215 .062
N 89 89 89 89 89 89 89 89
why it is preferred
Pearson
Correlation .014 .044 .176 .325** .407** .289** .313** .212*
Sig. (2-tailed) .894 .683 .101 .002 .000 .006 .003 .047
N 88 88 88 88 88 88 88 88
**. Correlation is significant at the 0.01 level (2-tailed).
*. Correlation is significant at the 0.05 level (2-tailed).
Table 13: 4.5.4. Correlation between Demographic factors and Financial Literacy
What is your
gender
What is you
age range
What is your
highest level of
education
How much money
do you make in a
month
How many
children
Which is your
current marital
status
which is your
work status
which is your
business type
Numeracy
Pearson Correlation .347** .079 .026 .148* .141* .087 .109 .141*
Sig. (2-tailed) .000 .213 .682 .018 .049 .169 .083 .025
N 253 253 253 253 194 253 252 253
Interest rate
compounding
Pearson Correlation .195** .267** .154* .102 .085 .062 .058 .081
Sig. (2-tailed) .002 .000 .014 .106 .239 .328 .358 .199
N 253 253 253 253 194 253 252 253
Inflation
Pearson Correlation .077 .002 .019 -.063 .094 .082 .111 .015
Sig. (2-tailed) .225 .981 .767 .318 .195 .194 .077 .816
N 253 253 253 253 194 253 252 253
Time value of
money
Pearson Correlation .023 .122 .159* .163** .219** .126* .139* .144*
Sig. (2-tailed) .715 .053 .011 .010 .002 .045 .028 .022
N 253 253 253 253 194 253 252 253
Money illusion
Pearson Correlation .292** .177** .105 .015 .215** .217** .052 .115
Sig. (2-tailed) .000 .005 .094 .807 .003 .001 .410 .069
N 253 253 253 253 194 253 252 253
**. Correlation is significant at the 0.01 level (2-tailed).
*. Correlation is significant at the 0.05 level (2-tailed).


![Literacy and Numeracy within the - Concordia University€¦ · Literacy and Numeracy within the Learning Toolkit+: Teacher Guide [Kenya 3rd Edition] ... § Kenya - Lesson Plan: ELM](https://static.fdocuments.us/doc/165x107/5eab815c36ef061ede2594cc/literacy-and-numeracy-within-the-concordia-university-literacy-and-numeracy-within.jpg)