
Financial Literacy among the Young - Michigan Retirement
35
Working Paper WP 2008-191 MR RC Project #: UM08-12 Financial Literacy among the Young Annamaria Lusardi, Olivia S. Mitchell and Vilsa Curto Michigan University of Research Retirement Center
Transcript of Financial Literacy among the Young - Michigan Retirement
Working Paper
WP 2008-191
M RR C
Project #: UM08-12
Financial Literacy among the Young Annamaria Lusardi, Olivia S. Mitchell and Vilsa Curto
MichiganUniversity of
ResearchRetirementCenter

Financial Literacy among the Young
Annamaria Lusardi Dartmouth College
Olivia S. Mitchell The Wharton School
Vilsa Curto
Harvard University
August 2009
Michigan Retirement Research Center University of Michigan
P.O. Box 1248 Ann Arbor, MI 48104
http://www.mrrc.isr.umich.edu/ (734) 615-0422
Acknowledgements This work was supported by a grant from the Social Security Administration through the Michigan Retirement Research Center (Grant # 10-P-98362-5-04). The findings and conclusions expressed are solely those of the author and do not represent the views of the Social Security Administration, any agency of the Federal government, or the Michigan Retirement Research Center. Regents of the University of Michigan Julia Donovan Darrow, Ann Arbor; Laurence B. Deitch, Bingham Farms; Olivia P. Maynard, Goodrich; Rebecca McGowan, Ann Arbor; Andrea Fischer Newman, Ann Arbor; Andrew C. Richner, Grosse Pointe Park; S. Martin Taylor, Gross Pointe Farms; Katherine E. White, Ann Arbor; Mary Sue Coleman, ex officio

Financial Literacy among the Young
Annamaria Lusardi, Olivia S. Mitchell and Vilsa Curto
Abstract
We examined financial literacy among the young using data from the 1997 National Longitudinal Survey of Youth. We showed that financial literacy is low among the young; fewer than one-third of young adults possess basic knowledge of interest rates, inflation, and risk diversification. Financial literacy is strongly related to sociodemographic characteristics and family financial sophistication. Specifically, a college-educated male whose parents had stocks and retirement savings is about 50 percentage points more likely to know about risk diversification than a female with less than a high school education whose parents were not wealthy. These findings have implications for consumer policy.
Authors’ Acknowledgements
The research reported herein was conducted pursuant to a grant from the U.S. Social Security Administration (SSA) to the Michigan Retirement Research Center, funded as part of the Retirement Research Consortium. Additional support was provided by the Pension Research Council and Boettner Center at the Wharton School of the University of Pennsylvania, and FINRA Investor Education Foundation. We would like to thank Brenda Cude, four anonymous referees, Dan Black, and participants in the conference “Improving Financial Literacy and Reshaping Financial Behavior” at the Networks Financial Institute at Indiana State University, Indianapolis, IN, the symposium on “Improving the Effectiveness of Financial Education in the Classroom” at the Take Charge America Institute at the University of Arizona, Tucson, AZ, and the University of Michigan Retirement Research Center research workshop, Ann Arbor, MI, for many helpful suggestions and comments. Hiroaki Matsuura provided excellent research assistance. Opinions and errors are solely those of the authors and not of the institutions with which the authors are affiliated.
Financial Literacy among the Young: Evidence and Implications for Consumer Policy
Consumers must confront complicated financial decisions at a young age in today’s
demanding financial environment, and financial mistakes made early in life can be costly. Young
people often find themselves carrying high amounts of student loans or credit card debt, and such
early entanglements can hinder young people’s ability to accumulate wealth. In order to aid
younger consumers, it is critical for researchers to explore how financially knowledgeable young
adults are. Understanding the factors that contribute to or detract from the acquisition of financial
knowledge can help policymakers design effective interventions targeted at the young
population.
In order to examine how well equipped young people are to make financial decisions, we
analyzed financial literacy questions newly added to the National Longitudinal Survey of Youth
fielded in 2007-2008. We used this rich dataset to study the relationship between financial
literacy and respondents’ sociodemographic characteristics, family characteristics, and peer
characteristics. Our aim was to examine three key research questions: 1) How well equipped are
young people to make financial decisions? 2) What are the determinants of financial literacy
among young people? 3) How can this information aid policymakers seeking to devise
interventions aimed at young consumers?
We found that most young adults are not well equipped to make financial decisions: only
27% of young people in our sample possessed knowledge of basic financial concepts including
inflation and risk diversification and could do simple interest rate calculations. Financial
illiteracy is not only widespread but is particularly acute among specific groups, such as women,
Blacks, Hispanics, and those with low educational attainment. Additionally, we linked financial
1
literacy to cognitive ability, time preferences, teachers’ interest in students, parental background,
and peer characteristics.
We found that both educational attainment and cognitive ability are important
determinants of financial literacy, but they are not the sole determinants. In fact, many variables
continued to be important predictors of financial literacy, even after accounting for education and
cognitive ability. Moreover, education and cognitive ability alone fail to account for the wide
variation in financial knowledge among the young. For this reason, researchers and policymakers
alike would benefit from gathering information on financial literacy; often-used indicators
thought to proxy for financial literacy, such as education, do a poor job of measuring
respondents’ financial knowledge. We also found that financial knowledge among the young is
strongly influenced by family background. Respondents whose mothers had a college education
were more likely to understand inflation. Moreover, young respondents whose parents had stocks
or retirement savings when they were teenagers were more likely to know about risk
diversification. Thus, financial knowledge can be passed on from parents to children. According
to our estimates, a college-educated male whose parents had stocks and retirement savings is
about 50 percentage points more likely to know about risk diversification than a female with less
than a high school education whose parents were not wealthy (did not own stocks or retirement
savings).
These results should be of interest to policymakers concerned with financial well-being
and the balance between personal and institutional responsibility. First, financial knowledge
should not be taken for granted, even among the young. Second, financial illiteracy is
particularly severe among specific groups such as minorities and women. Young women are now
more likely to have a college degree than men and participate actively in the labor market, yet
2
their level of financial literacy remains very low. Targeting financial education programs to the
groups that need them most could increase their effectiveness. Third, given the influence of
parents in shaping financial literacy, initiatives such as financial literacy courses in school may
be particularly helpful for those who do not have college-educated parents or whose parents do
not have experience investing in stocks and other complex assets. Information on factors that
influence the accumulation of financial knowledge reported in this paper can aid policymakers
trying to help younger consumers navigate today’s increasingly complex financial marketplace.
LITERATURE REVIEW
The financial situation of today’s young people is characterized increasingly by high
levels of debt. Between 1997 and 2007, average undergraduate student loan debt rose from
$9,250 to $19,200—a 58% increase after accounting for inflation. Average debt for college
students graduating with loans rose six percent in just one year between 2006 and 2007, from
$18,976 to $20,098 (Reed 2008). Additionally, median credit card debt among college students
grew from $946 in 2004 to $1,645 in 2009 (both figures in 2004 dollars), a 74% increase (Sallie
Mae 2009).
Recent survey results also suggest that these debt loads are causing anxiety among young
people and influencing major labor decisions: a 2006 USA Today/National Endowment for
Financial Education (NEFE) poll of young adults ages 22 to 29 found that, of those with debt,
30% said they worried about it frequently; 29% had put off or decided against furthering their
education because of debt; and 22% had taken a job they would not have taken otherwise
because of debt. There are other potentially costly consequences of accumulating high levels of
debt early on, such as bankruptcy (Roberts and Jones 2001). For instance, the U.S. Senate
Committee on Banking, Housing and Urban Affairs reported in 2002 that the fastest-growing
3
group of bankruptcy filers was those age 25 and younger. These high levels of debt may also
prevent young workers from taking advantage of employer-provided pensions, tax-favored
assets, or building up a buffer to insure against shocks: 55% of young adults report they are not
saving in either an individual retirement account (IRA) or a 401(k) account, and 40% do not
have a savings account that they contribute to regularly (USA Today/NEFE 2006).
These debt loads are of particular concern given recent evidence that young people may
lack sufficient knowledge to successfully navigate their financial decisions: for instance, a
National Council on Economic Education study of high school students and working-age adults
showed widespread lack of knowledge among respondents regarding fundamental economic
concepts (NCEE 2005), confirming evidence provided by the Jump$tart Coalition for Personal
Financial Literacy (Mandell 2004). Policymakers have become so concerned about young
people’s finances that the Credit Card Accountability, Responsibility, and Disclosure (CARD)
Act of 2009 included several provisions specifically targeted at protecting younger credit card
consumers. For instance, credit cards will no longer be issued to young people under the age of
21 unless they have an adult co-signer or can show proof that they have the means to repay the
debt; college students will be required to receive permission from parents or guardians in order
to increase credit limits on joint accounts; and those under 21 will be protected from pre-
screened credit card offers unless they specifically opt in for the offers.
Previous research has found that financial literacy can have important implications for
financial behavior: people with low financial literacy are more likely to have problems with debt
(Lusardi and Tufano 2009), less likely to participate in the stock market (van Rooij, Lusardi, and
Alessie 2007), less likely to choose mutual funds with lower fees (Hastings and Tejeda-Ashton
2008), less likely to accumulate wealth and manage wealth effectively (Stango and Zinman
4
2007; Hilgert, Hogarth, and Beverly 2003), and less likely to plan for retirement (Lusardi and
Mitchell 2006, 2007a, 2009). Financial literacy is an important component of sound financial
decision-making, and many young people wish they had more financial knowledge: 84% of
college students said they needed more education on financial management topics, 64% would
have liked to receive information about financial management topics in high school, and 40%
would have liked to receive such information as college freshmen (Sallie Mae 2009).
Understanding financial literacy among young people is thus of critical importance for
policymakers in several arenas: it can aid those who wish to devise effective financial education
programs targeted at young people, and it can also aid those who wish to devise legislation to
protect younger consumers.
Our study contributes to the literature in three important ways. First, we analyzed levels
of financial literacy among the young using a new nationally representative dataset: the latest
wave of the NLSY97. Second, we used this dataset to examine how levels of financial literacy
differed across a wide range of sociodemographic characteristics, family characteristics, and peer
characteristics. Third, we used multivariate analysis to identify several key determinants of
financial literacy among young people. In what follows, we describe our study of financial
literacy in a nationally representative sample of young people.
DATASET
The NLSY97 is a nationally representative sample of the U.S. youth population aged 12–
17 in 1997. The survey was designed to document young adults’ transition from school to work
and to identify defining characteristics of that transition. Consequently, the survey reports
extensive information on respondent labor market behavior, educational experience, and family
and community characteristics. In addition to the youth interview, the NLSY97 includes a
5

separate interview with each youth’s parent, designed to provide detailed parental characteristics
as well as information about the home environment. We were able to include a small set of
financial literacy questions in Wave 11 of the survey, fielded in 2007-2008 when respondents
were 23-28 years old. To construct the final sample, we deleted observations with missing data
for some of the variables included in our analysis (specifically on smoking, teachers’ interest in
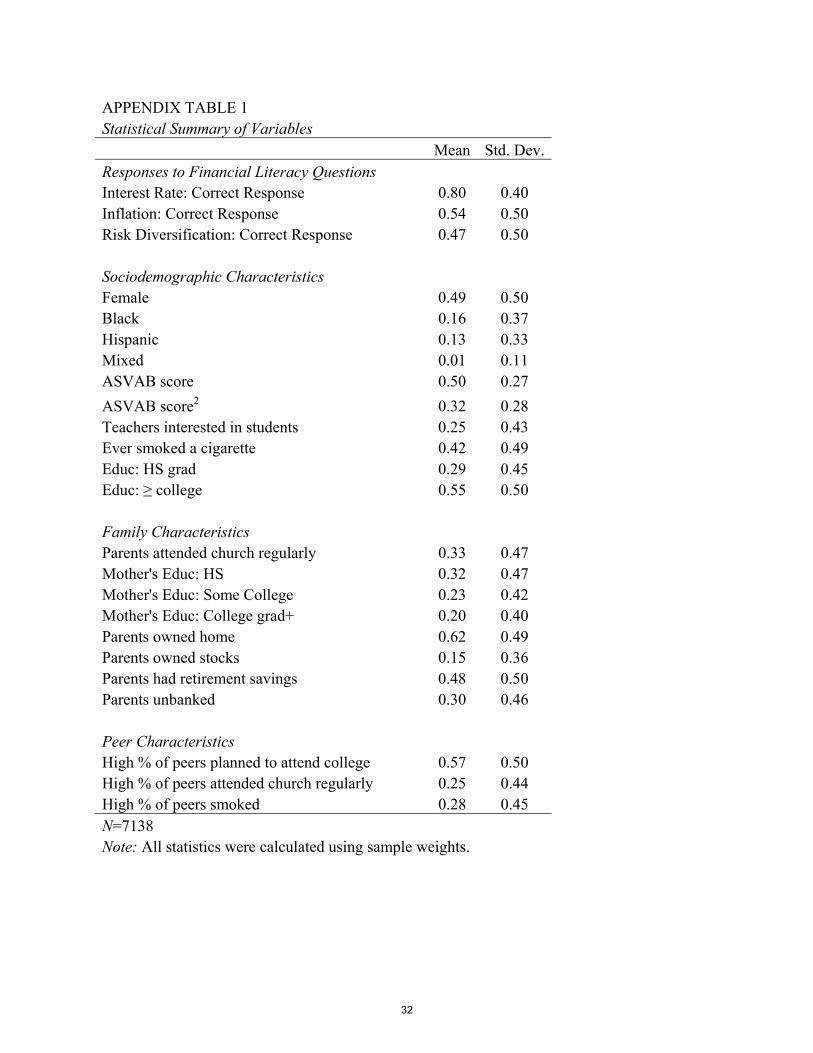
students, and peer characteristics). Our final sample included 7,138 respondents. As sample
weights for Wave 11 are currently unavailable, the statistics and findings below refer only to data
using the weights in the original 1997 sample. In what follows, we used both the nationally
representative sample of youths as well as the Black and Hispanic oversample. Summary
statistics for the variables employed are reported in Appendix Table 1.
METHODOLOGY
The three financial literacy questions included in wave 11 of the NLSY were the
questions that Lusardi and Mitchell (2006, 2008) originally designed for the 2004 HRS and that
have been added to many surveys in the United States and abroad. The wording of the questions
was as follows:
• Suppose you had $100 in a savings account and the interest rate was 2% per
year. After 5 years, how much do you think you would have in the account if you
left the money to grow: more than $102, exactly $102, or less than $102? {Do not
know; refuse to answer}
• Imagine that the interest rate on your savings account was 1% per year and
inflation was 2% per year. After 1 year, would you be able to buy more than,
exactly the same as, or less than today with the money in this account? {Do not
know; refuse to answer}
6

• Do you think that the following statement is true or false? “Buying a single
company stock usually provides a safer return than a stock mutual fund.” {Do not
know; refuse to answer}
These questions tested the knowledge of basic but fundamental financial concepts. The
first two questions, which we refer to as the “interest rate” and “inflation” questions, tested
whether respondents were knowledgeable about inflation and possessed basic financial
numeracy. The third question, on “risk diversification,” evaluated respondents’ knowledge of
risk diversification, a crucial element of an informed investment decision. These questions have
been shown to differentiate well between naïve and sophisticated respondents (Lusardi and
Mitchell 2006, 2008). In what follows, we first report univariate analyses of the responses to the
three financial literacy questions across a wide range of characteristics. This allowed us to assess
which factors were associated with financial literacy. Subsequently, we performed a multivariate
analysis to determine which variables continued to have an impact on financial literacy later in
life, even when accounting for a wide range of characteristics.
These survey data are unique in that they permitted us to link financial literacy later in
life to characteristics measured when respondents were teenagers. Several considerations guided
our selection of the variables for the empirical analysis. First, we were interested in variables that
could proxy for preferences, such as impatience, which might influence whether young people
invest in financial knowledge. Second, we considered variables related to costs and opportunities
for learning, such as cognitive ability, schooling, and exposure to financial knowledge via family
and peers.
Researchers have hypothesized that financial knowledge may be related to a person’s
time preferences: that is, those who discount the future more heavily may be less willing to
7

invest resources in acquiring financial knowledge, since such an investment has a delayed
payoff. For instance, a recent study found that it is disproportionately those who are patient who
self-select into financial education programs (Meier and Sprenger 2007). As a proxy for time
preference in this study, we used an indicator of whether a respondent had ever smoked. Prior
research has reported that impatience is associated with higher rates of smoking (Fuchs 1982),
and current smokers discount the value of delayed hypothetical monetary outcomes more than a
comparison group (Bickel, Odum, and Madden 1999). Benjamin, Brown, and Shapiro (2006)
also used smoking as a proxy for time preferences in their examination of NLSY79 data. We also
considered other demographic characteristics, such as gender and race/ethnicity, to account for
the many differences among the young.
One advantage of the NLSY is that it administered the Armed Services Vocational
Aptitude Battery (ASVAB), which is commonly used as an indicator of cognitive ability. The
ASVAB consists of several subtests that measure vocational aptitude in twelve areas.1 The
ASVAB variable that we examined was an aggregated percentile score based on four subtests:
mathematical knowledge, arithmetic reasoning, word knowledge, and paragraph comprehension.
This variable was similar to the Armed Forces Qualifying Test (AFQT) score in the NLSY79
dataset that other researchers have used as a proxy for cognitive ability (see Benjamin, Brown,
and Shapiro 2006; Cole and Shastry 2009). During Round 1 of the NLSY97, 79.3% of
respondents completed the computer-adaptive form of the ASVAB (we accounted for those
lacking a score in our empirical work).2
In addition to cognitive ability, we also included respondent educational attainment,
gathered from Wave 11.3 We were also interested in examining whether financial knowledge in
8
young adulthood might be related to teachers during the grade school years. Accordingly, we
measured this by respondent reports as to whether their teachers were interested in the students.
In addition to individual characteristics, we added family background variables to the
regressions. Much prior work has argued that individuals learn via interaction with others, in
particular, family and friends. For instance, Mandell (2008) reported that financially literate high
school students were disproportionately those whose parents had college degrees. Our analysis
therefore included the mother’s educational attainment.4 Sharing among family members can
also play an important role in household financial decisions; for instance, Li (2009) found that
people’s likelihood of entering the stock market within five years was 30 percent higher if their
parents or children had entered the market in the prior five years. Interestingly, the finding that
children are more likely to invest in stocks if the family of origin invested in stocks holds true
even among minorities (Chiteji and Stafford 1999). Because we were interested in the influences
of family financial circumstances, we also examined whether the respondent’s parent owned a
home, had retirement savings (pensions or retirement plans, tax-deferred plans such as
thrift/savings, 401(k)s, profit sharing or stock ownership plans, and IRAs or Keogh plans), was
banked or unbanked (had checking accounts, saving accounts, or money market mutual funds),
and owned stocks or mutual funds.5 The first two variables were indicators of family wealth,
while the latter two variables proxied for financial sophistication. In light of research by Hong,
Kubik, and Stein (2004) showing that churchgoers are more likely to invest in stocks, we also
looked at whether the respondent’s parents attended church regularly, as a proxy for social
interactions with non-family members. Our analysis improved upon previous work as it allowed
us to assess whether the interaction with others influences financial knowledge, which can in
turn affect financial behavior.
9
To pursue this issue further, we considered the influence not just of family or other
adults, but also of peers. In several studies of saving and financial decision-making, peers were
found to be one of the key contributors of information and financial advice (Hong, Kubik, and
Stein 2004; Brown et al. 2008). For example, when asked how they make financial decisions, a
high fraction of respondents reported consulting friends and colleagues (Lusardi and Mitchell
2006; van Rooij, Lusardi, and Alessie 2007). Peers were also important in decisions concerning
pension participation and contribution (Duflo and Saez 2003, 2004). This led us to investigate
the question of whether peer influences—even those that happen early in life—could be linked to
levels of financial knowledge later in life.
We also included several peer characteristics: percentage of peers going to college (as a
proxy for peer educational attainment), percentage of peers attending church (as a proxy for peer
social involvement), and percentage of peers who smoked (as a proxy for peer time preferences).
These percentages were reported by the respondent. Note that the peers in this study were not
“current peers,” but rather peers from the respondent’s teenage years. Our results therefore
examined the long-term effects of high school peer influences on subsequent financial literacy
(as opposed to the influences of current peers).
DESCRIPTIVE FINDINGS
Panel A of Table 1 reports results from the three questions that measured respondent
levels of financial literacy. While nearly 80% of respondents answered the interest rate question
correctly, only 54% answered the inflation question correctly, and 15% responded that they did
not know the answer to the inflation question. Only 47% answered the risk diversification
question correctly, and 38% responded that they did not know the answer. The large “don’t
know” response rate was particularly troubling, as previous research has found that “don’t know”
10
answers identified respondents with very low levels of financial knowledge (Lusardi and
Mitchell 2006, 2007a; Lusardi and Tufano 2009; van Rooij, Lusardi, and Alessie 2007). In any
case, the low correct response rates, particularly to the inflation and risk diversification
questions, indicated that many young people lack knowledge of basic financial concepts.
[Insert Table 1 about here]
Panel B of Table 1 shows that the correct answers to these three financial literacy
questions were highly positively correlated: those able to answer one of the financial literacy
questions correctly were also more likely to answer the other questions correctly. However, only
27% of respondents answered all three questions correctly, and only about 46% got the first two
questions right. Thus, our findings show that lack of financial knowledge is widespread among
the young.
Who Is Financially Illiterate?
While the overall level of financial knowledge was low among the young, there were
significant differences according to sociodemographic, family, and peer characteristics. Table 2
tabulates the proportions of correct answers to the three financial literacy questions according to
these characteristics. We highlight some of the more salient results below.
[Insert Table 2 about here]
Sociodemographic Characteristics
We found that there were large differences in financial literacy between women and men.
Women were less likely to respond correctly to each of the three questions, and there was a
nearly 13% gap for correct response rates to the inflation and risk diversification questions.
These differences between women and men were statistically significant. Lusardi and Mitchell
(2008) found similar sex differences among older HRS respondents. This finding is corroborated
11
by Lusardi and Tufano (2009), who explored debt literacy for a representative U.S. sample; in
studies of narrower samples (Agnew and Szykman 2005; Lusardi, Keller, and Keller 2008); and
in studies of other countries (van Rooij, Lusardi, and Alessie 2007; Lusardi and Mitchell 2007b;
Smith and Stewart 2008). Consequently, there is now fairly robust evidence confirming that
women do not do well in financial calculations and do not have a firm grasp of inflation and risk
diversification.
Table 2 also reveals differences in financial literacy according to race and ethnicity:
whites were more likely than Black and Hispanic respondents to answer all three financial
literacy questions correctly. The gap in the correct response rate between Black respondents and
white respondents was about 17% for the inflation question and nearly 12% for the risk
diversification question. The corresponding gaps for Hispanic respondents were about 12% and
7%. These differences were statistically significant. This finding was consistent with other
studies that have found differences in financial literacy according to racial and ethnic differences
among high school students (Mandell 2008) and other age groups (Lusardi and Mitchell 2007a;
Lusardi and Tufano 2009).
Table 2 also reveals a strong association between financial literacy and cognitive ability.
Correct response rates increased substantially for higher levels of cognitive ability. The
difference between the third quartile (ASVAB: 50-75) and the fourth quartile (ASVAB: 75+)
was particularly notable: the correct response rate for the inflation and risk diversification
questions was about 21 percentage points higher for those who were in the fourth quartile instead
of the third, and the differences were statistically significant. Our finding that cognitive ability
was strongly linked to financial literacy corroborates preliminary findings from another survey of
financial literacy among young people.6 There were also large differences in financial literacy
12
according to educational attainment, especially for those who attended college—their correct
response rates were over 20 percentage points higher than for those who graduated from high
school for the inflation and risk diversification questions, and the differences were statistically
significant.
Family Characteristics
Mother’s education was strongly associated with financial literacy, especially if a
respondent’s mother graduated from college: those whose mothers graduated from college had
correct response rates that were about 19 percentage points higher for the inflation question and
18 percentage points higher for the risk diversification question with respect to those whose
mothers graduated from high school, and the differences were statistically significant. Each of
our proxies for family wealth and family financial sophistication was also associated with
financial literacy: for instance, the difference in correct response rates to the inflation and risk
diversification questions was at least 11 percentage points for each of these variables, and these
differences were statistically significant. Whether it was wealth, financial sophistication, or both
that mattered for respondents’ financial literacy was analyzed in more detail in the next section,
where we considered all of these variables together. Nevertheless, this simple univariate analysis
revealed the importance of considering family characteristics when analyzing financial literacy
among young people.
Peer Characteristics
Table 2 also revealed associations between peer characteristics and financial literacy.
Those with a high percentage of peers who planned to attend college did about 7 percentage
points better on the inflation and risk diversification questions; those with a higher percentage of
peers who attended church did better on all three questions; and those with a low percentage of
13
peers who smoked also did substantially better on each of the three questions, with correct
response rates about 9 percentage points higher for the inflation and risk diversification
questions. All of these differences were statistically significant (except with whether peers
attended church for the interest rate question). Thus, peer characteristics may also play a role in
explaining differences in financial literacy.
MULTIVARIATE ANALYSIS
In this section, we performed a multivariate analysis that permitted us to assess which
factors were still linked to financial literacy, even when controlling for many other
characteristics. We used three different specifications in the analysis: in specification I, we
considered only sociodemographic characteristics; in specification II, we considered
sociodemographic characteristics as well as family characteristics; and in specification III, we
considered sociodemographic characteristics, family characteristics, and peer characteristics.7
Our underlying model was as follows:
y* = xβ + ε, ⎩⎨⎧ >
=else
yify
00*1
where y* is an unobservable characteristic: a respondent’s propensity to answer a financial
literacy question correctly, and y is a binary outcome variable indicating that a respondent gave
the correct response if his propensity to respond correctly was above zero. The vector x contains
respondent characteristics that depend on the specification, β is a vector of parameters to be
estimated, ε is a continuously distributed variable independent of x, and the distribution of ε is
symmetric about zero.
We used a probit model for our analysis so that this gave rise to a binary response model
of the form:
P( y = 1 | x) = Φ(xβ)
14

where Φ is a cumulative distribution function (cdf). Our primary goal was to explain the effects
of the respondent characteristics xj on the probability of responding correctly to a financial
literacy question. In our model, if xK is a binary explanatory variable, then the marginal effect
from changing xK fom zero to one, holding all other variables fixed, is simply
)....()...( 1122111221 −−−− +++Φ−++++Φ KKKKK xxxx βββββββ
Note that this expression depends on all other values of the other xj. We calculated the marginal
effects by setting all of the other independent variables to their mean values. Our model therefore
allowed us to interpret the marginal effect from changing a discrete explanatory variable xK fom
zero to one as the change in the probability of responding correctly to the financial literacy
question. If xj is continuous, as is the case for the ASVAB variable, then
=∂=∂
jxyP )|1( x g(xβ)βj, where ).()( z
dzdzg Φ
≡
However, Φ is a strictly increasing cdf, so that g(z) > 0 for all z. Therefore, the sign of the
marginal effect of a change in xj is given by the sign of βj. Our model closely followed the probit
model specified by Woolridge (2002). The marginal effects that we calculated are reported in
Table 3.
[Insert Table 3 about here]
Several important findings emerged from our estimates. Even after accounting for many
sociodemographic, family, and peer characteristics, women were still substantially less
financially literate than their male counterparts. Women were about 6 percentage points less
likely to answer the interest rate question correctly, 15 percentage points less likely to answer the
inflation question correctly, and nearly 16 percentage points less likely to answer the risk
15

diversification question correctly. This result shows that sex is a strong predictor of financial
literacy, even after accounting for many characteristics.
Financial literacy was also strongly associated with cognitive ability, and this relationship
was highly non-linear; financial literacy, as measured by each of the three questions, was a
convex function of the ASVAB score, which indicates that returns for financial literacy increased
sharply with increasing cognitive ability. These results showed that cognitive ability, even when
measured during a respondent’s teenage years, was a strong determinant of financial literacy.
Teachers’ interest in students (as reported by the respondents) had a small but significant
positive effect on a respondent’s probability of answering the inflation question correctly, even
after controlling for cognitive ability and educational attainment. This suggests that the quality
and motivation of teachers influence financial literacy among young people, consistent with the
findings of Lusardi and Mitchell (2009) that those living in states that mandated financial literacy
and spent more on education per pupil were more likely to display higher financial knowledge
later in life.
There was a strong positive relationship between educational attainment (measured in
wave 11 of the NLSY97) and financial literacy, in particular for those who had attended some
college: they were 6 percentage points more likely to answer the interest rate question correctly,
17 percentage points more likely to answer the inflation question correctly, and 18 percentage
points more likely to answer the risk diversification question correctly. Even having graduated
from high school made respondents more financially literate; for example, those who graduated
from high school were 7 percentage points more likely to answer the inflation question correctly.
Educational attainment was clearly a strong determinant of financial literacy.
16

Family characteristics were also found to be important determinants of financial literacy.
In particular, parents’ education was a strong predictor of financial literacy: those whose mothers
graduated from college were nearly 5 percentage points more likely to answer the inflation
question correctly. Family financial sophistication also played an important role: those whose
parents owned stocks were over 7 percentage points more likely to answer the risk diversification
question correctly, and those whose parents had retirement savings were 6 percentage points
more likely to answer this question correctly. Since retirement savings referred to 401(k)s, profit
sharing or stock ownership plans, IRA or Keogh plans, where individuals have to decide how to
allocate retirement wealth, this variable is likely to proxy for knowledge and experience in
dealing with stocks. Stocks and retirement savings were most likely not mere proxies for wealth;
we controlled for wealth in our specifications by including dummies for whether the parents
owned a home or had a checking account, two of the most common components of wealth
(Lusardi, Cossa, and Krupka 2001). The result that children whose parents owned stocks (either
in private wealth or retirement wealth) were more likely to understand risk diversification
suggests that some financial knowledge may be passed on directly from parents to their children,
as other papers have found (Chiteji and Stafford 1999; Li 2009).
Finally, although peer characteristics were not strongly associated with financial literacy
after controlling for so many other variables, there was still a negative relationship between
having a high percentage of peers who smoked and answering the inflation question correctly.
This suggests that characteristics of peers when respondents were teenagers can influence
respondents’ levels of financial literacy later in life.
Admittedly, the ten-year gap between the measurement of the dependent and independent
variables places some limitations on the interpretation of our results. For instance, it is difficult at
17
times to assign a causal interpretation to our estimated coefficients. And one might note that the
low pseudo R-squared values in our regressions indicated that our explanatory variables left
much variation unaccounted for, a fact that is unsurprising given the many factors that could
influence the accumulation of financial knowledge, especially over the course of ten years.
Nonetheless, it is remarkable that many of the characteristics we examined, even when measured
at a young age, still determined, to some extent, an individual’s level of financial knowledge
later in life.
WHAT HAVE WE LEARNED?
As the complexity of financial decisions increases and individuals are put in charge of
making these decisions even at a young age, it is important to find ways to equip people with
adequate financial knowledge. Previous studies have shown that broad groups of the population
are not financially literate; these people may be particularly unlikely and unable to manage their
finances effectively, and to plan adequately for the future. This paper added to the existing
knowledge by exploring what younger adults know and do not know as determined by a set of
simple questions that assessed their financial literacy. We found that financial literacy was
severely lacking among young adults; only 27% of young adults know about inflation and risk
diversification and can do simple interest rate calculations. Moreover, women proved to be the
least financially literate. Sex differences between women and men persisted even after
accounting for many demographic characteristics, family background characteristics, and peer
characteristics. Prior work showed that women tended to display low financial literacy later in
life (Lusardi and Mitchell 2006, 2008). Thus, lack of financial literacy seems to persist for long
periods and sometimes throughout the lifetime. Given the strong link between financial literacy
and financial management and retirement planning found in other studies (Lusardi and Mitchell
18
2007a, 2008; Hilgert, Hogarth, and Beverly 2003), it may be important to find ways to foster
financial knowledge in the population as a whole and among the groups who are more
disadvantaged. Similarly, it may be important to develop programs targeted specifically to
women, since they display not only much lower financial knowledge but also large differences in
investment and saving behavior (Hira and Loibl 2008; Lusardi, Keller, and Keller 2008).
Our study also found an important channel through which young adults acquire financial
knowledge: parents. In both the univariate and multivariate analyses, those whose mothers had
high education or whose families had stocks or retirement savings were more financially literate,
specifically on questions related to advanced financial knowledge, such as the workings of risk
diversification. These findings confirmed the results of work analyzing financial knowledge
among high school students. The small fraction of students (7 percent) who were deemed
financially literate in the Jump$tart Coalition for Personal Financial Literacy survey in 2006
were disproportionately white males whose parents had college degrees (Mandell 2008). It also
confirmed findings of previous work among college students, where again parents were found to
play a role in students’ financial socialization (Cude et al. 2006).
Lack of financial knowledge may also be traced back to impatience or discounting the
future heavily. In our study, we used smoking as a proxy for high rate of time preference. We
found that those respondents who smoked when they were teenagers or whose peers smoked
were less likely to be financially literate. Thus, in order to be effective, financial education
programs have to take into account the many differences that exist among individuals, not just in
terms of economic circumstances but also in terms of preferences. We also found that cognitive
ability was a strong predictor of financial literacy; those with higher cognitive ability, as
measured by ASVAB scores in high school, were more likely to display higher financial
19

knowledge as young adults. However, many other variables remained statistically significant
after accounting for cognitive ability; thus, cognitive ability was not the sole determinant of
financial knowledge. In other words, there was a lot of heterogeneity in financial literacy, even
when examining a narrow age group in the population.
Implications for Researchers and Consumers
Overall, the findings from this study have important implications for research related to
financial literacy and household financial security. As the government and employers continue to
shift the responsibility for saving and investing onto workers, it is becoming more and more
important to equip workers with some basic tools to make financial decisions. While young
workers face or will soon face decisions about mortgages, college funds, and retirement savings,
their financial knowledge seems dangerously low and potentially inadequate to deal with the
complexity of current financial markets and products. It is also important to recognize that the
population of young adults displays very large differences in financial knowledge. Thus, young
adults should not be considered one homogeneous group of consumers. Rather, the differences
by race, sex, educational attainment, and other observable characteristics should be taken into
account both in research and when considering public policy initiatives geared toward improving
financial literacy.
Given the low levels of financial knowledge documented in this work, simplification of
financial decisions could be very beneficial to young people. For example, this study supports
the findings of Choi, Laibson, and Madrian (2006) that simplifying the way in which workers
enroll into pension plans can foster pension participation, particularly among disadvantaged
groups, such as Blacks and low-income workers. It also supports the findings of Lusardi, Keller,
and Keller (2008) that providing a planning aid to new employees can more than double
20

participation in supplementary retirement accounts. New employees at the not-for-profit
institution considered in that study were disproportionately young women who had very low
levels of financial literacy.
Implications for Financial Education Programs
The findings from this study also have implications for financial education programs.
There were several findings in this paper supporting financial education in high school. First, if
financial knowledge is acquired from parents or via interaction with others, there are groups who
will not be able to benefit from these sources because their parents or friends do not have college
degrees or are not financially knowledgeable. In this respect, providing financial education in
high school may be particularly beneficial to children from disadvantaged backgrounds.
According to our estimates, respondents whose parents did not have a college degree and lacked
financial sophistication (did not have stocks or retirement savings) are approximately 15
percentage points less likely to know about risk diversification, an essential concept for making
saving and investment decisions.
Second, financial literacy is not entirely determined by cognitive ability. While this
variable plays a role in explaining the differences in financial knowledge among the young, it is
not the only relevant factor. Thus there is a role for education in improving financial knowledge.
Third and most important, it is likely to be beneficial to provide financial education before
individuals engage in financial contracts and before they start making financial decisions. In this
respect, it may be important to find ways to improve the effectiveness of financial literacy
programs currently offered in high school.
This study also illuminated the importance of parental influences on young people’s
acquisition of financial knowledge. Involving parents in a financial education program could be
21
more effective than only involving young people. First, parents who are engaged in such a
program may take a more active role in guiding their children’s financial behaviors. Second,
such a program could aid those parents who lack sufficient financial knowledge to provide their
children with sound financial advice.
Given the low level of financial knowledge displayed by young adults who are already
out of school, it may also be important to pursue other financial education initiatives. Several
firms, particularly those offering defined contribution pensions, have offered financial education
programs (Bernheim and Garrett 2003; Lusardi 2004). The findings from this study show that
young workers are particularly in need of these programs. Other studies also show that the young
are those more susceptible to making financial mistakes (Agarwal et al. 2007). Given the
substantial differences that exist among the young, “one-size-fits-all” programs are unlikely to be
effective. Instead, programs should be targeted to women, minorities, such as Blacks and
Hispanics, and those with low educational attainment.
We would also like to highlight, as already argued in Lyons and Neelakantan (2008), that
it may be particularly difficult to evaluate the effectiveness of financial education among the
young. For example, according to the life-cycle model of saving, young individuals facing an
upward-sloping age-earnings profile should borrow rather than save to smooth consumption over
the life-cycle. However, many financial education programs simply assess whether individuals
increase their saving after having been exposed to financial education programs. In this respect,
it is important to develop new ways to assess the impact of financial education on the young,
including examining levels of debt and borrowing behavior among the young.8
22
28
ENDNOTES
1. The areas were arithmetic reasoning, assembling objects, auto information, coding speed,
electronics information, general science, mathematics knowledge, mechanical comprehension,
numerical operations, paragraph comprehension, shop information, and word knowledge.
2. We did not have ASVAB responses for 1,128 of respondents so we included a missing
variable dummy for this group in all regressions.
3. Note that this was the only control variable measured during Wave 11; the remainder were
measured in Wave 1.
4. Similar results were obtained when we considered data about the father. Nevertheless, because
there were many missing observations for father’s education, we relied instead on mother’s
education for which the missing data problem was far less pervasive.
5. Parental information was missing for approximately 10% of the sample. Statistics reported in
the tables refer to the sample for which parents’ wealth was available. We added a dummy for
missing data about parents’ wealth in our regressions. For a detailed analysis of the wealth data
in the NLSY97, see Lusardi, Cossa, and Krupka (2001).
6. We thank Lewis Mandell for sharing with us preliminary results from the 2008 wave of the
Jump$tart Coalition for Personal Financial Literacy, where he linked financial literacy with the
score on the ACT or SAT exam. His preliminary findings indicated that these scores were very
powerful predictors of differences in financial literacy among high school seniors.
7. Because data were missing for family characteristics and respondent’s educational level, we
included dummies for missing observations in all of our regressions. For brevity, these estimates
are not reported in the tables, but are available upon request.
23

8. See also the discussion of financial education programs and their evaluation in Lyons et al.
(2006).
24

REFERENCES
Agarwal, Sumit, John C. Driscoll, Xavier Gabaix, and David Laibson. 2007. The Age of Reason: Financial Decisions over the Lifecycle. NBER Working Paper n. 13191.
Agnew, Julie, and Lisa Szykman. 2005. Asset Allocation and Information Overload: The Influence of Information Display, Asset Choice and Investor Experience. Journal of Behavioral Finance, 6: 57–70.
Benjamin, Daniel J., Sebastian A. Brown, and Jesse M. Shapiro. 2006. Who Is “Behavioral”? Cognitive Ability and Anomalous Preferences. Mimeo, University of Chicago.
Bernheim, Douglas, and Daniel Garrett. 2003. The Effects of Financial Education in the Workplace: Evidence from a Survey of Households. Journal of Public Economics, 87: 1487–1519.
Bickel, Warren K., Amy L. Odum, and Gregory J. Madden. 1999. Impulsivity and Cigarette Smoking: Delay Discounting in Current, Never, and Ex-Smokers. Psychopharmacology, 146 (4):447-454.
Brown, Jeffrey, Zoran Ivkovich, Paul Smith, and Scott Weisbenner. 2008. Neighbors Matter: Causal Community Effects and Stock Market Participation. Journal of Finance, 63 (3): 1509-1531.
Chiteji, Ngina and Frank Stafford. 1999. Portfolio Choices of Parents and Their Children as Young Adults: Asset Accumulation by African American Families. American Economic Review Papers and Proceedings, 89: 377-380
Choi, James, David Laibson, and Brigitte Madrian. 2006. Reducing the Complexity Costs of 401(k) Participation Through Quick Enrollment (TM). NBER Working Paper n. 11979.
Cole, Shawn, and Gauri Kartini Shastry. 2009. Smart Money: The Effect of Education, Cognitive Ability, and Financial Literacy on Financial Market Participation. Harvard Business School Working Paper n. 09-071.
Cude, Brenda, Frances Lawrence, Angela Lyons, Kaci Metzger, Emily LeJeune, Loren Marks, and Krisanna Machtmes. 2006. College Students and Financial Literacy: What They Know and What We Need to Learn. Proceedings of the Eastern Family Economics and Resource Management Association, 102-109.
Duflo, Esther, and Emmanuel Saez. 2003. The Role of Information and Social Interactions in Retirement Plan Decisions: Evidence from a Randomized Experiment. Quarterly Journal of Economics, 118: 815–842.
Duflo, Esther, and Emmanuel Saez. 2004. Implications of Pension Plan Features, Information, and Social Interactions for Retirement Saving Decisions. In Pension Design and Structure: New Lessons from Behavioral Finance, edited by Olivia S. Mitchell and Stephen Utkus (137-153). Oxford: Oxford University Press.
25
Fuchs, Victor R. 1982. Time Preference and Health: An Exploratory Study. In Economic Aspects of Health, edited by Victor R. Fuchs (93-120). Chicago: The University of Chicago Press.
Hastings, Justine, and Lydia Tejeda-Ashton. 2008. Financial Literacy, Information, and Demand Elasticity: Survey and Experimental Evidence from Mexico. NBER Working Paper n. 14538.
Hilgert, Marianne, Jeanne Hogarth, and Sondra Beverly. 2003. Household Financial Management: The Connection Between Knowledge and Behavior. Federal Reserve Bulletin, 309–322.
Hira, Tahira, and Cazilia Loibl. 2008. Gender Differences in Investment Behavior. In Handbook of Consumer Finance Research, edited by Jing Jian Xiao (253-270). New York: Springer.
Hong, Harrison, Jeffrey Kubik, and Jeremy Stein. 2004. Social Interaction and Stock Market Participation. Journal of Finance, 59: 137–163.
Li, Geng. 2009. Information Sharing and Stock Market Participation: Evidence from Extended Families. Mimeo, Federal Reserve Board.
Lusardi, Annamaria. 2004. Savings and the Effectiveness of Financial Education. In Pension Design and Structure: New Lessons from Behavioral Finance, edited by Olivia S. Mitchell and Stephen Utkus (157–184). Oxford: Oxford University Press.
Lusardi, Annamaria, Ricardo Cossa, and Erin Krupka. 2001. Savings of Young Parents. Journal of Human Resources, 34: 762-794.
Lusardi, Annamaria, Punam Keller, and Adam Keller. 2008. New Ways to Make People Save: A Social Marketing Approach. In Overcoming the Saving Slump: How to Increase the Effectiveness of Financial Education and Saving Programs, edited by Annamaria Lusardi (209-236). Chicago: University of Chicago Press.
Lusardi, Annamaria, and Olivia S. Mitchell. 2006. Financial Literacy and Planning: Implications for Retirement Wellbeing. Working Paper, Pension Research Council, Wharton School, University of Pennsylvania.
Lusardi, Annamaria, and Olivia S. Mitchell. 2007a. Baby Boomer Retirement Security: The Role of Planning, Financial Literacy, and Housing Wealth. Journal of Monetary Economics, 54: 205–224.
Lusardi, Annamaria, and Olivia S. Mitchell. 2007b. Financial Literacy and Retirement Preparedness: Evidence and Implications for Financial Education. Business Economics, 42 (1): 35–44.
Lusardi, Annamaria, and Olivia S. Mitchell. 2008. Planning and Financial Literacy: How Do Women Fare? American Economic Review, 98: 413-417.
26
Lusardi, Annamaria, and Olivia S. Mitchell. 2009. How Ordinary People Make Complex Economics Decisions: Financial Literacy and Retirement Readiness, mimeo, Dartmouth College.
Lusardi, Annamaria, and Peter Tufano. 2009. Debt Literacy, Financial Experiences, and Overindebtedness. NBER Working Paper n. 14808.
Lyons, Angela, Lance Palmer, Koralalage Jayaratne, and Erik Scherpf. 2006. Are We Making the Grade? A National Overview of Financial Education and Program Evaluation. The Journal of Consumer Affairs, 40 (2): 208-235.
Lyons, Angela, and Urvi Neelakantan. 2008. Potential and Pitfalls of Applying Theory to the Practice of Financial Education. The Journal of Consumer Affairs, 42 (1): 106-112.
Mandell, Lewis. 2004. Financial Literacy: Are We Improving? Results of the 2004 National Jump$tart Survey. Washington, D.C.: Jump$tart Coalition for Personal Financial Literacy.
Mandell, Lewis. 2008. Financial Literacy in High School. In Overcoming the Saving Slump: How to Increase the Effectiveness of Financial Education and Saving Programs, edited by Annamaria Lusardi (257-279). Chicago: University of Chicago Press.
Meier, Stephan, and Charles Sprenger. 2007. Selection into Financial Literacy Programs: Evidence from a Field Study. Federal Reserve Bank of Boston Discussion Paper n. 07-5.
National Council on Economic Education. 2005. What American Teens and Adults Know About Economics. http://207.124.141.218/WhatAmericansKnowAboutEconomics_042605-3.pdf.
Reed, Matthew. 2008. Student Debt and the Class of 2007. The Project on Student Debt. http://projectonstudentdebt.org/files/pub/classof2007.pdf.
Roberts, James A., and Eli Jones. 2001. Money Attitudes, Credit Card Use, and Compulsive Buying Among American College Students. The Journal of Consumer Affairs, 35 (21): 213-240.
Sallie Mae. 2009. How Undergraduate Students Use Credit Cards. http://www.salliemae.com/NR/rdonlyres/0BD600F1-9377-46EA-AB1F-6061FC763246/10744/SLMCreditCardUsageStudy41309FINAL2.pdf.
Smith, Barbara, and Fiona Stewart. 2008. Learning from the Experience of OECD Countries: Lessons for Policy, Programs, and Evaluations. In Overcoming the Saving Slump: How to Increase the Effectiveness of Financial Education and Saving Programs, edited by Annamaria Lusardi (345-367). Chicago: University of Chicago Press.
Stango, Victor, and Jonathan Zinman. 2007. Fuzzy Math and Red Ink: When the Opportunity Cost of Consumption Is Not What It Seems. Mimeo, Dartmouth College.
27

USA Today/National Endowment for Financial Education. 2006. Young Adults’ Finances Poll. http://www.nefe.org/Portals/0/NEFE_Files/USATodaySurvey.pdf.
van Rooij, Maarten, Annamaria Lusardi, and Rob Alessie. 2007. Financial Literacy and Stock Market Participation. NBER Working Paper n. 13565.
Woolridge, Jeffrey M. 2002. Econometric Analysis of Cross Section and Panel Data. Cambridge, MA: The MIT Press.
28
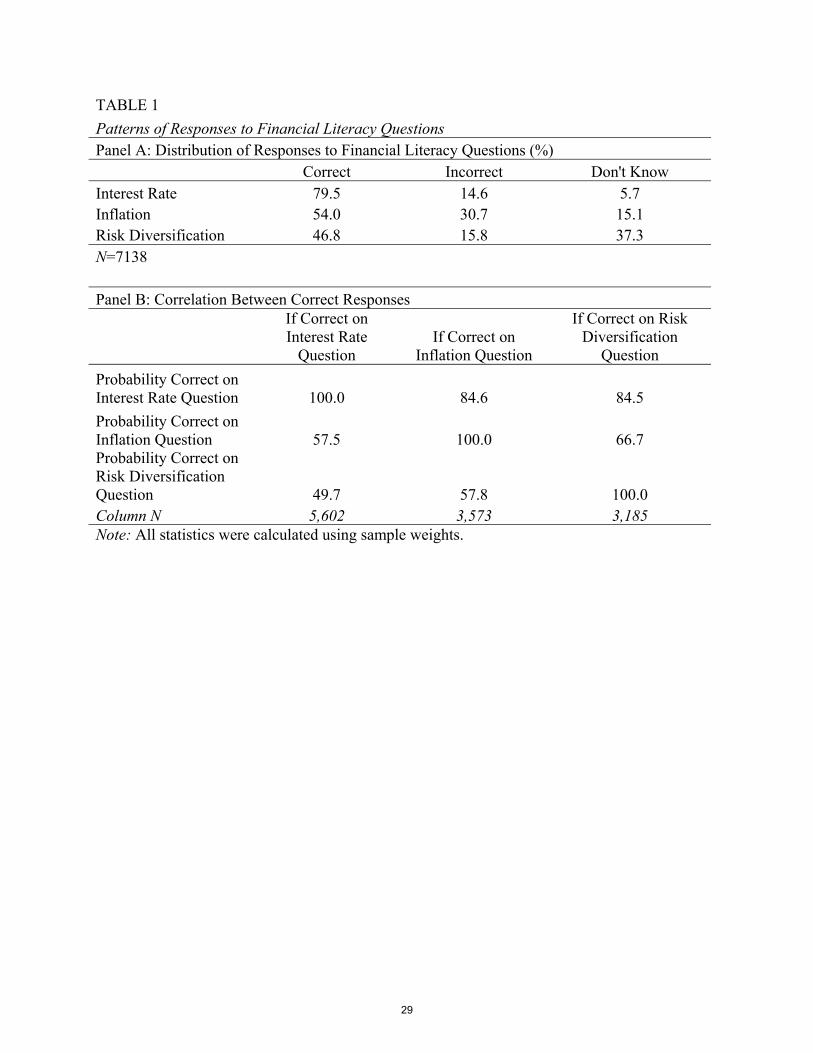
TABLE 1 Patterns of Responses to Financial Literacy Questions Panel A: Distribution of Responses to Financial Literacy Questions (%) Correct Incorrect Don't Know Interest Rate 79.5 14.6 5.7 Inflation 54.0 30.7 15.1 Risk Diversification 46.8 15.8 37.3 N=7138 Panel B: Correlation Between Correct Responses
If Correct on Interest Rate
Question If Correct on
Inflation Question
If Correct on Risk Diversification
Question Probability Correct on Interest Rate Question 100.0 84.6 84.5 Probability Correct on Inflation Question 57.5 100.0 66.7 Probability Correct on Risk Diversification Question 49.7 57.8 100.0 Column N 5,602 3,573 3,185 Note: All statistics were calculated using sample weights.
29

TABLE 2 Percent Correct by Sociodemographic, Family, and Peer Characteristics Interest Rate Inflation Risk Diversification Sociodemographic Characteristics Female 76.7 47.8 40.1 Male 82.2 60.1 53.3 White 80.8 58.5 49.6 Black 77.3 41.4 37.9 Hispanic 74.6 46.1 42.3 ASVAB: 0-25* 69.9 33.8 32.9 ASVAB: 25-50 76.9 46.6 40.5 ASVAB: 50-75 81.4 58.9 47.3 ASVAB: 75+ 90.5 80.9 68.3 Teachers interested in students 81.5 58.5 48.7 Teachers not interested in students 78.8 52.6 46.2 Ever smoked cigarette 77.2 50.8 43.7 Never smoked cigarette 81.2 56.3 49.0 Educ: < HS* 71.1 33.6 30.5 Educ: HS grad 75.6 44.2 35.7 Educ: ≥ college 84.1 65.2 57.4 Family Characteristics Parents attended church regularly* 80.7 58.0 50.6 Parents did not attend church regularly 79.3 52.4 44.9 Mother's educ:<HS* 74.2 40.6 36.9 Mother's educ: HS grad 78.3 50.4 43.2 Mother's educ: some college 80.2 58.0 48.7 Mother's educ: college grad+ 85.6 69.7 61.0 Parents owned home* 81.6 58.6 50.8 Parents did not own home 76.0 45.3 38.7 Parents owned stocks* 84.8 66.5 62.7 Parents did not own stocks 78.7 51.9 43.7 Parents had retirement savings* 82.0 61.6 54.2 Parents had no retirement savings 77.2 45.8 38.0 Parents unbanked* 77.7 46.0 39.7 Parents banked 81.0 58.7 50.6 Peer Characteristics High % of peers planned to attend college 81.2 57.0 49.9 Low % of peers planned to attend college 77.3 50.1 42.7 High % of peers attended church regularly 81.0 58.3 50.7 Low % of peers attended church regularly 79.0 52.6 45.5 High % of peers smoked 75.5 46.0 40.6 Low % of peers smoked 81.0 57.1 49.1 N=7138 Notes: All statistics were calculated using sample weights. For the characteristics denoted by an asterisk, statistics were calculated on a smaller sample due to missing data.
30

TABLE 3 Multivariate Analysis of Financial Literacy: Probit Marginal Effects of Association with Correct Answers Interest Rate Inflation Risk Diversification
I II III I II III I II III Female -0.0617*** -0.0618*** -0.0606*** -0.155*** -0.154*** -0.151*** -0.159*** -0.158*** -0.157*** (0.0102) (0.0103) (0.0103) (0.0134) (0.0134) (0.0135) (0.0132) (0.0132) (0.0133) Black 0.0195 0.0211* 0.0215* -0.0348** -0.0275 -0.0288 -0.0204 -0.00496 -0.00494 (0.0122) (0.0127) (0.0127) (0.0169) (0.0176) (0.0177) (0.0170) (0.0178) (0.0178) Hispanic -0.0164 -0.0153 -0.0163 -0.0209 -0.0101 -0.0133 0.00508 0.0207 0.0200 (0.0135) (0.0143) (0.0144) (0.0176) (0.0187) (0.0188) (0.0177) (0.0189) (0.0189) Mixed 0.0309 0.0334 0.0337 -0.113* -0.112* -0.115* -0.0146 -0.00611 -0.00634 (0.0461) (0.0456) (0.0457) (0.0640) (0.0639) (0.0637) (0.0637) (0.0641) (0.0641) ASVAB score -0.0268 -0.0169 -0.0193 -0.00896 -0.0250 -0.0312 -0.224** -0.237** -0.238** (0.0787) (0.0794) (0.0793) (0.106) (0.107) (0.107) (0.104) (0.105) (0.105) ASVAB score2 0.282*** 0.271*** 0.272*** 0.570*** 0.566*** 0.572*** 0.551*** 0.533*** 0.532*** (0.0774) (0.0780) (0.0781) (0.104) (0.105) (0.105) (0.0997) (0.100) (0.101) Teachers int. 0.0109 0.0109 0.0101 0.0296* 0.0287* 0.0307* -0.00413 -0.00637 -0.00713 (0.0119) (0.0119) (0.0121) (0.0158) (0.0158) (0.0160) (0.0156) (0.0157) (0.0159) Ever smoked -0.0114 -0.0117 -0.00991 0.00991 0.00965 0.0134 0.00645 0.00805 0.00976 (0.0107) (0.0107) (0.0109) (0.0142) (0.0143) (0.0146) (0.0141) (0.0142) (0.0144) Educ: HS grad 0.0229 0.0243* 0.0236* 0.0761*** 0.0704*** 0.0696*** 0.0441** 0.0347* 0.0342 (0.0142) (0.0142) (0.0142) (0.0202) (0.0204) (0.0205) (0.0208) (0.0210) (0.0210) Educ: ≥ college 0.0603*** 0.0618*** 0.0607*** 0.189*** 0.173*** 0.174*** 0.209*** 0.185*** 0.184*** (0.0155) (0.0160) (0.0160) (0.0204) (0.0212) (0.0213) (0.0202) (0.0211) (0.0212) Parents church -0.00997 -0.00986 0.00604 0.00635 0.0142 0.0143 (0.0116) (0.0116) (0.0151) (0.0152) (0.0149) (0.0150) Mom's educ: HS -0.00291 -0.00290 -0.00190 -0.000764 -0.0150 -0.0150 (0.0152) (0.0152) (0.0210) (0.0210) (0.0209) (0.0209) Mom's educ: some coll -0.00542 -0.00543 0.0275 0.0300 -0.000622 -0.000538 (0.0173) (0.0173) (0.0232) (0.0232) (0.0230) (0.0230) Mom's educ: coll grad+ 0.00586 0.00575 0.0436* 0.0464* 0.0191 0.0190 (0.0199) (0.0200) (0.0261) (0.0262) (0.0260) (0.0261) Parents owned home 0.0137 0.0137 -0.00235 -0.00204 -0.00214 -0.00223 (0.0129) (0.0129) (0.0169) (0.0170) (0.0168) (0.0168) Parents owned stocks 0.0103 0.0101 0.000325 0.00183 0.0747*** 0.0747*** (0.0169) (0.0169) (0.0220) (0.0220) (0.0213) (0.0213) Parents ret savings -0.00555 -0.00603 0.0237 0.0232 0.0602*** 0.0600*** (0.0130) (0.0130) (0.0173) (0.0173) (0.0171) (0.0171) Parents unbanked 0.0143 0.0141 -0.00662 -0.00763 0.00307 0.00293 (0.0125) (0.0125) (0.0170) (0.0170) (0.0168) (0.0168) Peers college 0.00540 -0.0242* 0.000663 (0.0108) (0.0143) (0.0142) Peers church -0.0110 -0.00752 -0.00130 (0.0125) (0.0163) (0.0161) Peers smoked -0.0132 -0.0274* -0.00979 (0.0120) (0.0160) (0.0158) Pseudo R-squared 0.0453 0.0468 0.0472 0.119 0.120 0.121 0.0811 0.0875 0.0875 Robust standard errors in parentheses. N=7138 Note: Marginal effects were calculated at the means of the independent variables. * p<0.1; ** p<0.05; *** p<0.01
31
APPENDIX TABLE 1 Statistical Summary of Variables Mean Std. Dev.Responses to Financial Literacy Questions Interest Rate: Correct Response 0.80 0.40 Inflation: Correct Response 0.54 0.50 Risk Diversification: Correct Response 0.47 0.50 Sociodemographic Characteristics Female 0.49 0.50 Black 0.16 0.37 Hispanic 0.13 0.33 Mixed 0.01 0.11 ASVAB score 0.50 0.27 ASVAB score2 0.32 0.28 Teachers interested in students 0.25 0.43 Ever smoked a cigarette 0.42 0.49 Educ: HS grad 0.29 0.45 Educ: ≥ college 0.55 0.50 Family Characteristics Parents attended church regularly 0.33 0.47 Mother's Educ: HS 0.32 0.47 Mother's Educ: Some College 0.23 0.42 Mother's Educ: College grad+ 0.20 0.40 Parents owned home 0.62 0.49 Parents owned stocks 0.15 0.36 Parents had retirement savings 0.48 0.50 Parents unbanked 0.30 0.46 Peer Characteristics High % of peers planned to attend college 0.57 0.50 High % of peers attended church regularly 0.25 0.44 High % of peers smoked 0.28 0.45 N=7138 Note: All statistics were calculated using sample weights.
32