Financial intermediation and the transmission mechanism ... · BIS Papers No 83 193 Financial...
22
BIS Papers No 83 193 Financial intermediation and the transmission mechanism: learning from a case study on Israeli banks 1 Emanuel Barnea, Nadine Baudot-Trajtenberg and Ziv Naor Abstract The emergence of institutional investors managing the long-term retirement savings of Israeli households has clearly altered the pattern of financial intermediation in the past decade. Households increasingly hold their savings through these institutions, which in turn provide a growing share of credit to large non-financial businesses. However, Israeli banks are still mainly funded by deposits, but these are less sticky than traditional retail deposits, which have shrunk from 62% to 48% of total deposits. The case study on banks’ intermediation of capital points to friction in the banking sector, particularly where the recent fall in the coverage ratio implies a widening of the gap between deposit and lending rates. This does not unequivocally imply a weakening of the transmission mechanism. Indeed, the increased competition from institutional investors is refocusing banks’ lending to SMEs and households, areas where the oligopolistic nature of the banking system is likely to allow them broader margins. If this is the case, then the transmission mechanism is likely to have become more efficient overall, assuming of course that the corporate bond market and direct credit lending by institutional investors appropriately price the risk involved. A more troublesome finding of the case study is that the financial crisis seems to have had a lingering effect on deposit-lending spreads, beyond the increase in risks and the coverage ratio drop, affecting all borrowers. Thus, unrelated to the transformation of the financial intermediation map, the global financial crisis seems to have weakened the transmission mechanism. Keywords: banks, credit, financial intermediation, transmission mechanism JEL classification: E44, E51, G18, G21, G23 1 Bank of Israel. This work makes use of a policy memo by Barnea, Dijvre and Naor (2012) on the effects of the 2007 global financial crisis on the monetary policy transmission mechanism in Israel.
Transcript of Financial intermediation and the transmission mechanism ... · BIS Papers No 83 193 Financial...

BIS Papers No 83 193
Financial intermediation and the transmission mechanism: learning from a case study on Israeli banks1
Emanuel Barnea, Nadine Baudot-Trajtenberg and Ziv Naor
Abstract
The emergence of institutional investors managing the long-term retirement savings of Israeli households has clearly altered the pattern of financial intermediation in the past decade. Households increasingly hold their savings through these institutions, which in turn provide a growing share of credit to large non-financial businesses. However, Israeli banks are still mainly funded by deposits, but these are less sticky than traditional retail deposits, which have shrunk from 62% to 48% of total deposits. The case study on banks’ intermediation of capital points to friction in the banking sector, particularly where the recent fall in the coverage ratio implies a widening of the gap between deposit and lending rates. This does not unequivocally imply a weakening of the transmission mechanism. Indeed, the increased competition from institutional investors is refocusing banks’ lending to SMEs and households, areas where the oligopolistic nature of the banking system is likely to allow them broader margins. If this is the case, then the transmission mechanism is likely to have become more efficient overall, assuming of course that the corporate bond market and direct credit lending by institutional investors appropriately price the risk involved. A more troublesome finding of the case study is that the financial crisis seems to have had a lingering effect on deposit-lending spreads, beyond the increase in risks and the coverage ratio drop, affecting all borrowers. Thus, unrelated to the transformation of the financial intermediation map, the global financial crisis seems to have weakened the transmission mechanism.
Keywords: banks, credit, financial intermediation, transmission mechanism
JEL classification: E44, E51, G18, G21, G23
1 Bank of Israel. This work makes use of a policy memo by Barnea, Dijvre and Naor (2012) on the
effects of the 2007 global financial crisis on the monetary policy transmission mechanism in Israel.

194 BIS Papers No 83
Introduction
The pattern of financial intermediation has seen significant changes in Israel during the past decades, in large part due to regulatory reforms affecting both the banking sector and long-term retirement savings rules and institutions, as well as the continued contraction of public sector debt since 1985.
The reforms affecting long-term retirement savings include the gradual elimination of pay-as-you-go pension schemes in the public sector and their replacement by defined contribution schemes (DC), the homogenisation of fiscal and investment rules and regulations between pension funds, provident funds and life insurance policies, and the expansion of the range assets that can be held by these long-term saving schemes, including foreign assets.2 These various reforms have engendered a rapid growth of the public‘s assets held through these independent asset managers, most of them insurance companies, and they have reduced the share of assets held directly, such as bank deposits or direct holdings of stocks and bonds.
The reform that most affected the structure of the rather concentrated banking sector has been the 2005 Bachar reform, which at its core separates the financial advisory role from the asset management role of financial institutions. This has forced the banks to spin off their asset management operations, particularly their provident funds, which had been mostly held by the banks until then, and to focus on distributing those funds as well as providing financial advice to their clients. Thus starting in 2006, the financial market structure evolved from one dominated by five banking groups, to one where five large asset managers are also playing a major role in the intermediation process.
For the past 30 years, fiscal policy has remained focused on reducing the overall burden of debt, from its peak of 284% of GDP in 1985 to 68% by the end of 2014. The path has been a gradual one and not without deviations from its downward trend, particularly during times of recession such as in the deep downturn of 2000–03 and the much shorter and shallower one of the recent global financial crisis in 2009. But the trend has been maintained throughout, including during the past decade.
2 For further details on the changes in the long-term savings market in Israel, see L Achdut and
A Spibak, “The pension system in Israel after 15 years of reforms”, Policy Studies, no 8, Van Leer Institute, 2010.

BIS Papers No 83 195
Total Debt as a % of GDP
Government and Private Non Financial Sector Figure 1
Thus, both sides of the financial intermediation have been affected: on the borrowing side, the public sector’s retrenchment has left more space for business and household borrowing, and on the lending side, pension reforms have led to the rise of long-term retirement savings institutions that are competing with banks particularly in the corporate borrowing segment.
Intertwined with the change in the relative importance of these different types of borrower and lender, the intermediation process itself has undergone a different transformation, increasingly relying on the markets to allocate the funds, away from the face-to-face transactions of the traditional banking environment. The evolution of financial intermediation activity in Israel has taken place gradually over the past two decades, at a more or less accelerated pace, sometimes with substantial flows of capital in and out of the country and sometimes not. Although not quite indifferent to global developments, its metamorphosis does not appear to have been significantly influenced by the global financial crisis.3
It is still unclear to what extent the transmission mechanism of monetary policy has been affected by these changes. Later in this paper we introduce a case study in which we find some evidence for the existence and characterisation of the effects of the global financial crisis on the transmission mechanism in Israel. Furthermore, the emergence of new players with different tastes, horizons, constraints and expectation formations, as well as the move away from closed doors to (more)
3 The Israeli banks went through the global financial crisis relatively unscathed and, although banking
regulations have since raised the capital requirements for banks, banks in Israel do not appear to have gone through anything like the “credit crunch” that was observed elsewhere.
225
184
150
165
180
195
210
225
240
196 BIS Papers No 83
transparent market transactions, may well have affected the speed and the price at which new information is processed.
Overview of developments
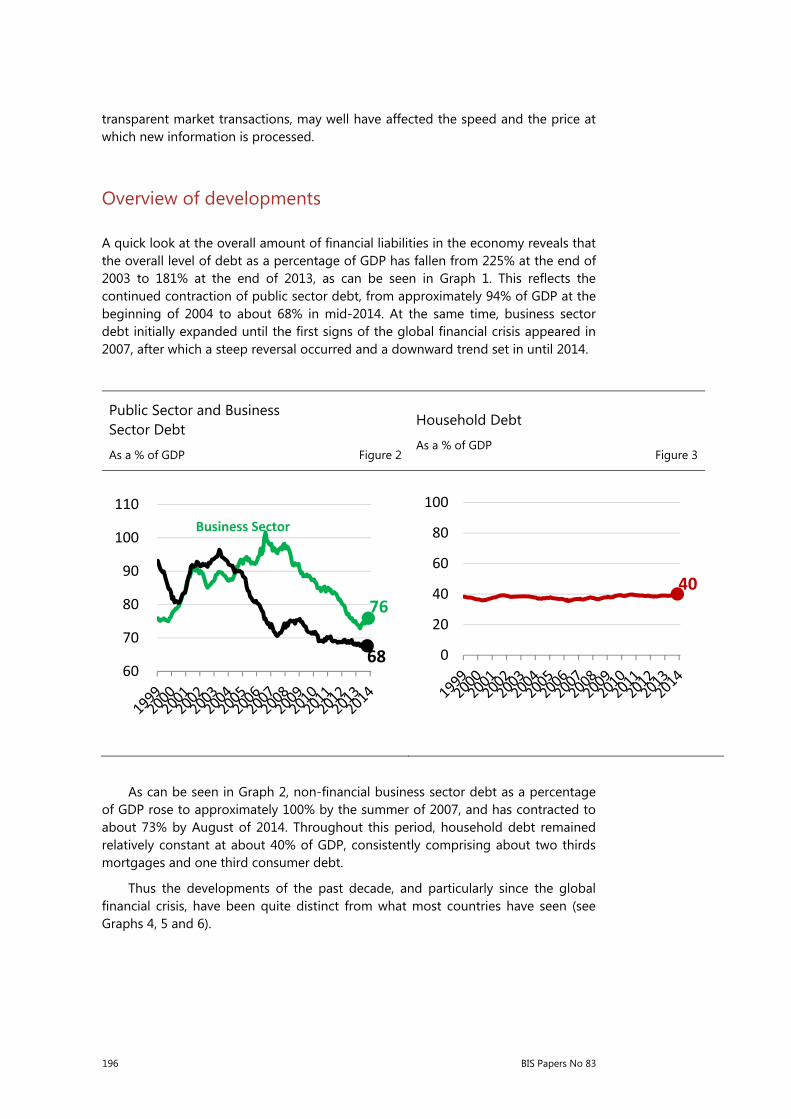
A quick look at the overall amount of financial liabilities in the economy reveals that the overall level of debt as a percentage of GDP has fallen from 225% at the end of 2003 to 181% at the end of 2013, as can be seen in Graph 1. This reflects the continued contraction of public sector debt, from approximately 94% of GDP at the beginning of 2004 to about 68% in mid-2014. At the same time, business sector debt initially expanded until the first signs of the global financial crisis appeared in 2007, after which a steep reversal occurred and a downward trend set in until 2014.
Public Sector and Business Sector Debt
As a % of GDP Figure 2
Household Debt
As a % of GDP Figure 3
As can be seen in Graph 2, non-financial business sector debt as a percentage of GDP rose to approximately 100% by the summer of 2007, and has contracted to about 73% by August of 2014. Throughout this period, household debt remained relatively constant at about 40% of GDP, consistently comprising about two thirds mortgages and one third consumer debt.
Thus the developments of the past decade, and particularly since the global financial crisis, have been quite distinct from what most countries have seen (see Graphs 4, 5 and 6).
76
68 60
70
80
90
100
110Business Sector
40
0
20
40
60
80
100

BIS Papers No 83 197
Change in Public Debt as a % of GDP 2007-2013
Figure 4
Change in Business Sector Debt as a % of GDP 2007-2013 Figure 5
Change in Household Debt as a % of GDP 2007-2013
Figure 6
Role of banks
Following a rapid rise in the early part of the last decade, the public’s financial portfolio has hovered around 275% of GDP 2007. However, pension reforms have substantially altered the recipients of the public’s long-term savings which are increasingly held through institutional investors, away from direct holdings of stocks, bonds and bank deposits as can be seen in Graph 7. Bank deposits now account for 27% of the public’s financial assets, down from some 40% a decade ago. The mirror image of this phenomenon is that retail deposits, which traditionally had been the main source of funding for banks, have dropped from 51% in 2004 to 44% of banks total liabilities by 2013. In addition, the share of funding raised directly through bonds has doubled in the past decade, up from 4.6% of total bank liabilities in 2004 to 9.2% in 2013. Thus, while Israeli banks are still mostly funded through deposits, these have become less “sticky” than in the past.
40.5
28.8
-7.5
-50 0 50 100
IrelandGreece
PortugalSpain
UKUSAItaly
Euro AreaCanada
Tcheck RepSingaporeDenmark
AustriaGermany
PolandHungary
MexicoThailand
KoreaHong Kong
SwedenTurkey
SwitzerlandIsrael
IndonesiaNorway
14.3
11.0
-25.5
-50 0 50 100
TurkeyHong Kong
IrelandHungaryPortugalSweden
IndonesiaKorea
NorwayThailandDenmark
AustriaSingapore
CanadaSwitzerland
PolandEuro Area
GreeceItalyUK
USATchek Repuglic
MexicoSpain
GermanyIsrael
8.0
1.9
-10.1
-50 0 50 100
TurkeyThailand
IndonesiaDenmark
NorwayCanada
SingaporeGreece
KoreaSwedenPoland
Hong KongSwitzerland
Tcheck RepublicItaly
Euro AreaUK
HungaryAustriaMexico
PortugalIsrael
GermanySpain
IrelandUSA

198 BIS Papers No 83
Composition of the Public’s Financial Assets Between direct and indirect holdings Figure 7
Looking at the asset side of banks’ portfolios, a very clear trend appears, one undiminished by the global financial crisis: a continued rise of the share of credit to households, in the form of both mortgages and consumer credits, while corporate credit has gradually fallen from 38% of the total balance sheet to 27% by the third quarter of 2014, as can be seen in Graph 8.
48
52
30
40
50
60
70
2000
2001
2002
2003
2004
2005
2006
2007
2008
2009
2010
2011
2012
2013
2014
%
Direct holdings of Financial Assets by the Public
Public’s Financial Assets managed by Institutional Investors

BIS Papers No 83 199
Composition of Bank Credit by Segments 2008-2014
Figure 8
Sources of Credit to the Non Financial Business Sector
2000- 7/2014, billions of NIS Figure 9
The reduction in the role of banks as providers of credit to the non-financial business sector is perhaps more easily seen when one looks at the source of funding for that sector, as seen in Graph 9. Total bank credit provided to that sector has remained flat for the past decade, while the share of tradable bonds and non-bank credit has risen steadily. Foreign funding has accounted throughout the period for about 18% of total credit to the non-financial business sector. Thus, business sector funding from banks has fallen from 75% in 2000 to slightly less than 50% by mid-2014. The new vehicles of long-term retirement savings, pensions, provident and life insurance funds have filled the gap and are the principal holders of domestic corporate bonds as well as providing direct credit to the business sector.
The trends just described gained way before the global financial crisis and have continued throughout the period. We now turn our attention to their potential impact on the transmission mechanism.
Potential impact on the transmission mechanism
The transmission mechanism of monetary policy has three main channels: first, directly through its impact on the market interest rate, second, indirectly through the impact of the interest rate on the exchange rate and, third, indirectly through its impact on the stock market and other assets making up household wealth. Note that for a small open economy like that of Israel, the second channel is likely to be the most powerful one, and there is plenty of evidence to show that the interest rate gap between Israel and the rest of the world affects the exchange rate, and that the latter impacts exports (particularly of traditional industries) as well as imports. However, the changing structure of the financial intermediation is most likely to affect the first channel, which is the question we want to investigate further.4
4 Note that the wealth effect could also be affected by the way in which household savings are held.
It is not clear whether households are more “aware” of their wealth if they directly hold the financial
0%
10%
20%
30%
40%
50%
Households
Large Firms
Medium size Firms (commercial)
Private Banking
Small Firms 0
100
200
300
400
500
600
700
800
Foreign debt
Non tradable bonds and non bank credit
Tradable bonds
Bank Credit

200 BIS Papers No 83
It is relevant to decompose the first channel into steps and see how the changing structure of the intermediation process weaves into it: (i) the extent to which the central bank’s interest rate affects the market interest rate; (ii) the gap between lenders’ and borrowers’ interest rates (the efficiency of the financial intermediation process); (iii) the risk premium required by lenders (another aspect of the efficiency of financial intermediation); and (iv) the sensitivity of investment and consumption to the interest rate, which is also affected by borrowers’ access to funds.
At first sight, it is not obvious in what direction will the transmission mechanism be impacted. On the one hand, the introduction of more players in the financial intermediation arena, particularly in a market that was very concentrated and oligopolistic in nature, is likely to reduce the spread between lending and deposit rates, and the enhanced competition could also improve accessibility to financial markets. Both these effects – steps (ii) and (iv) – should strengthen the transmission mechanism by improving the efficiency of the financial intermediation process. On the other hand, asymmetric information between borrowers and lenders may be more pronounced in the arm’s length transactions which characterise these new players in the financial markets. If this is the case, the lenders will likely require a higher risk premium to compensate for this asymmetric information; thus, a move away from bank lending to market-based transactions could actually widen the interest spread, so weakening the transmission mechanism.
The picture painted earlier does not point to a significantly increased accessibility to financial markets. Indeed, Graph 8 clearly shows that the share of credit to small and medium-sized borrowers has not changed, while households’ debt has increased on par with GDP.5 The focus on the transformation of intermediation has been on large borrowers, who have increasingly turned to the domestic bond market to raise funds, away from banks. What has happened to pricing, and particularly to the interest rate gap and the risk premium in that market?
From an empirical standpoint, it is not straightforward to compare pricing in the corporate bond market with that of similar bank loans. To do so we would need very granular data on both types of transactions, since they are likely to involve different types of customer and particularly of risk on borrowers, including the availability of collateral. Indeed, in the absence of securitisation (as is still the case in Israel), only the largest corporate clients are likely to be able to raise funds directly by issuing bonds. In fact, just by looking at the composition of bank loans and corporate bonds by industry, one can see that they differ substantially. At the end of 2013, the share of bank credit to industry amounted to 19% of lending to the non-financial business sector, compared to 11% only of corporate bonds issued by non-financial businesses, and the exposure to real estate and construction was even
assets, as opposed to when those are held through institutional investors. However, one could conjecture that direct holdings, and the liquidity it bestows, are likely to imply a larger wealth effect – thus pointing to a weakening of this channel following the change in the holdings of household assets during the past decade.
5 Although note that, starting in 2011, macroprudential policies have been introduced that have made mortgages both pricier and less leveraged, without which we are likely to have seen a further rise in credit to housing.

BIS Papers No 83 201
more distinct, at 32% of banks’ non-financial credit portfolio6 versus 50% in the corporate bond market.
However, we can focus on the banking sector and try to assess how the spreads between deposit and lending appear to be set, to what extent do they incorporate the appropriate level of risk, and whether or not they appear to have been altered.
Case study: assessing the transmission mechanism in the banking sector
We assume that there exists asymmetry of information between lenders and borrowers, regarding the perceived repayment abilities of the latter, and between savers and lenders, pertaining to their exposure to risk. Thus, financial intermediation will introduce a wedge between borrower and lender interest rates, reflecting the risk premium assessment of the lenders, beyond the expected value of future losses.
The cost of banks’ deposits and liquidity are influenced by the depositors’ and bond holders’ assessment of the banks’ risk exposure, the latter depending on the asset side of the banks’ balance sheet. In addition, a rise in the risk of the borrowers may lead to a reduction in the supply of credit by the banks, due to the higher risk premium needed to compensate for the extra risk.7
Increasing the lending rate (ex ante) and/or requiring guarantees (ex post) helps creditors to partly overcome the uncertainty pertains to the borrowers‘ ability to repay. To that end, creditors price the credit risk such that, in the margin, their cost of monitoring equals the cost of preventing the realisation of the risk. In this way, there emerges a wedge (an external finance premium) between the alternative use of the firm‘s internal finance resources and its external finance resources, leading to inefficient allocation of resources. Indeed, better borrowers, for whom the asymmetry of information problem is less severe, would probably get credit more easily and suffer less during financial crises.
This approach can be found in empirical works that validate the existence of asymmetric information in the intermediation process. Hoshi et al (1991) find that firms in Japan that had close relationships with banks, thus mitigating the asymmetry of information or reducing the cost of monitoring, had better access to bank credit. Gertler and Gilchrist (1992) as well as Oliner and Rudebusch (1996) find, respectively, that small firms in the United States, and their credit supply, suffer more (in comparison with larger firms), and that small firms‘ investments depend more on internal financing especially during recessions. These findings are consistent with the notion that smaller firms are more exposed to asymmetry of information and to higher monitoring costs.
Here, we will take a similar approach to set testable hypotheses regarding the existence of frictions in the monetary policy transmission mechanism through the
6 The latter is also affected by banking regulations that limits the banks’ exposure to the construction and real estate sectors and/or mobilises a higher level of bank’ capital.
7 For further discussion on credit channel see Freixas and Rochet, (2008).

202 BIS Papers No 83
credit channel, based on data from the banking sector. Again, our analysis depends on the existence of asymmetry of information in the deposit and credit markets. We will model the intermediation process as one where the deposit market is competitive, but where the credit market is monopolistic, reflecting Israel’s strongly concentrated banking sector. This allows us to model non-trivial pricing strategies that include pricing of risk as are necessary to show the possible existence of frictions in the transmission mechanism.
The global financial crisis offers us an experiment where we can more easily identify the frictions in the transmission mechanism, as such frictions must have been amplified during that period of high uncertainty and volatility in the markets.
Indeed, the conjecture that frictions in the transmission mechanism exist and in fact were amplified during the last global financial crisis is supported by our findings, whereby the pricing of the deposit and lending rates include an element that goes beyond the effects of the banks‘ exposure to risk and the credit risk itself. The main findings are the following:
1. There is no evidence for the existence of market discipline in the public supply of deposits. In fact, the effect of the banks’ exposure to risk, as measured by the ratio of problem loans to total lending, is found insignificant in the regression of the deposit interest rate. At the same time, the onset of the financial crisis was clearly internalised by the bond market, whereby the spread on bank-issued bonds increased dramatically following the Lehman bankruptcy, to fall back gradually in 2009 and 2010 as can be seen in Graph 10.
Average Bond Spread of the 5 large Bank Groups
2005-2012 Figure 10
0.00
0.50
1.00
1.50
2.00
2.50
3.00
07-0
5
01-0
6
07-0
6
01-0
7
07-0
7
01-0
8
07-0
8
01-0
9
07-0
9
01-1
0
07-1
0
01-1
1
07-1
1
01-1
2

BIS Papers No 83 203
This discrepancy in response between the bond and deposit markets could indicate that a market that is dominated by risk-insensitive depositors results in a transmission mechanism that can oversupply credit to the market as well as severely misallocate credit between sectors. Alternatively, it may be that depositors assume the existence of an implicit bank deposit insurance, an assumption that may not be far-fetched in a small country with a concentrated banking sector.
2. The regression results partly support the possible existence of a trade-off between the banks’ interest income and their net non-interest income, as is reflected by the coverage ratio.8 The further from unity the banks’ coverage ratio lies, the more the banks will need to earn in net interest income to compensate for their lack of efficiency in the intermediation process. In fact the data show a downward trend in the average coverage ratio of the Israeli banks, starting from 2009, and this led, in line with the aforementioned trade-off, to an increase in the lending interest rate. This suggests that the transmission mechanism through the banking system has weakened. Alternatively, it could be that the competition for large customers who have direct access to the bond market has reoriented banks into the less competitive markets of SMEs and households, where they can more easily widen the wedge between borrowing and lending rates. If this is the case, the overall transmission mechanism might not have been weakened, but rather the changing intermediation channels have further revealed the friction that exists in the banking intermediation mechanism.
Average Coverage ratio of 5 large Bank Group
2001-9/2014 Figure 11
Coverage Ratio = Non-interest Income ÷ Operational Expenses
8 The coverage ratio is defined as the ratio of non-interest income divided by the operational
expenses.
35%
45%
55%
65%
03.0
1
03.0
2
03.0
3
03.0
4
03.0
5
03.0
6
03.0
7
03.0
8
03.0
9
03.1
0
03.1
1
03.1
2
03.1
3
03.1
4

204 BIS Papers No 83
3. There emerged in the data an indiscriminate rise in the banks’ lending rate from 2008 that goes beyond the effect of the credit risk and the trade-off effect mentioned above. This result may indicate that, due to the asymmetry of information between borrowers and creditors, banks have increased their lending rates to all borrowers including the good ones, as a lingering effect of the crisis. This persistence points to a weakening of the intermediation process, again perhaps reflecting and exacerbating the lack of competition in the SME and household sectors.
Conclusion
The emergence of institutional investors managing the long-term retirement savings of Israeli households has clearly altered the pattern of financial intermediation in the past decade. Households increasingly hold their savings through these institutions, which in turn provide a growing share of credit to the large non-financial businesses. However, Israeli banks are still funded mainly by deposits, but those are less sticky than the traditional retail deposits as these have shrunk from 62% to 48% of total deposits. The case study on banks’ intermediation of capital points to friction in the banking sector, particularly where the fall in their coverage ratio of recent years implies a widening of the gap between deposit and lending rates. This does not unequivocally infer a weakening of the transmission mechanism. Indeed, increased competition from the institutional investors is refocusing banks’ lending to SMEs and households, areas where the oligopolistic nature of the banking system is likely to allow them broader margins. If this is the case, then the transmission mechanism is likely to have become more efficient overall, assuming of course that the corporate bond market and direct credit lending by institutional investors appropriately price the risk involved. A more troublesome finding of the case study on banks is that the financial crisis seems to have had a lingering effect on deposit-lending spreads, affecting all borrowers. Thus unrelated to the transformation of the financial intermediation map, the global financial crisis seems to have weakened the transmission mechanism.

BIS Papers No 83 205
Appendix
Conceptual framework
This section details the conceptual framework which we use for the empirical analysis and, in particular, the identification of the effects of a change in the credit risk on the transmission mechanism. We focus here on the banking financial intermediation and thus the conceptual framework is of the banking sector.
We assume that there are two types of households in the model – each one is characterised by a representative agent. The first one deposits its savings with the financial intermediary in order to smooth its consumption. The second type of agent turns to the financial intermediary for loans to finance the operation of their projects. For simplicity, we assume that the imperfect competitive financial industry is represented by one monopolistic financial intermediary operating in this economy.
We also assume that there exists a central bank that, in the money market, sets an infinitely elastic supply of money at a policy rate rm. We assume that the market for deposits is perfectly competitive, while the loan market is a monopolistic market. Since the financial intermediary can either use the deposit money to extend loans to investors or borrows from the central bank for the same purpose, the reserve
requirement adjusted deposit rate 1
dtrrr−
must at equilibrium be equal to the policy
rate. As for the supply of loans, we further assume that granting loans exposes the financial intermediary to credit risk. There is asymmetry of information between the borrower and the financial intermediary and therefore the credit risk can only partially be priced by the lending rate rL. In particular real investment of one unit involves a loss of 1-λ units, 0< λ<1 at the end of the period. The parameter λ is unobservable, but there exists a relationship between λ and various observable credit risk indicators (eg loan loss reserves, problematic loans ratio and so on). In fact λ satisfies the following relationship
.10 ,0 ,)( ≤≤<Γ′+Γ= λεγλ
where γ is an observable credit risk indicator and ε is an i.i.d random variable that is normally distributed with zero mean and a constant variance σ2. We assume that only the investors (the borrowers) are aware of the realisation of εt at period t.
The pricing of the loans is done by the financial intermediary in accordance with its profit-maximising first-order conditions. The households are the financial intermediary owners and they are risk-neutral. The expected profit function is given by
(1 ) ( )t t t t Lt t dt mt mt tE Lr rr Dr r L c wλΠ = − − − −
where L is the aggregate outstanding loan balances, D is the total bank deposit balances, Lm is total monetary loans balances granted to the financial intermediary by the central bank. Where rr is reserve requirement, and c(w) is the total net operational expenses which is a function of the wage rate, w.

206 BIS Papers No 83
Assuming that the financial intermediary holds equity at an amount of K (as required), the intermediary resource constraint is
t t t mt tL rrD D L K+ = + + From the first-order conditions for profit maximisation, we get the following
pricing relationships:
(1) 1
dtmt
rr
rr=
−
(2) 1
11
dtt Lt
t
rr
rrλ
η
+ = −
where η is the price elasticity of the demand for loans.
The specification of the banking profit equation and condition (2) hint at the perception that, due to the asymmetry of information where the borrower knows more about his/her probability of default, the financial intermediary requires an inadequate credit risk premium. Given rd, it transpires from (2) that, in reaction to an increase in the credit risk (λ decreases), the financial intermediary increases its lending rate rL so that its exposure to the credit risk is divided over fewer borrowers. Of course, if the financial intermediary had all the information it would price (adequately) only the borrowers whose probability of default changed (increased).
Log-linearisation of (2) and of the function ( )λ γ= Γ around the equilibrium * * * *[ , , , ( )]dt Lt t tr r η γΓ yields
(3) *
* * * * ** * * *
1 1[ ] [ ] [ ]
1 (1 )t
Lt dt tr r λγ
γ γα α α η α ηη γ η η
−= − + − +
+ +
where *
**L
d
rr
α ≡ is the equilibrium interest rate ratio, and *
**
λγ
γ ληγλ
∂≡∂
.
We use the estimated coefficients of equation (3) to examine the operation of the transmission mechanism since the onset of the global financial crisis. We note that the estimation of the constant (the markup) in equation (3) is affected by the credit demand price elasticity. When the elasticity is larger (the sector is more competitive) the estimated constant will be larger. This methodology allows us to study the effect of changes in the degree of the competition on the transmission mechanism. In the regressions, we let these constants vary utilising dummy variables. The transmission mechanism relies on the relationship between the monetary policy rate and the market interest rates (deposit and lending). Thus we can use the estimated equations (1) and (3) as a basis for the examination of the effects of credit risk on the transmission mechanism.
Estimating equation (3) requires the use of instrumental variables since this equation describes the relationship between endogenous variables that are determined simultaneously. For that purpose, we utilise as instrument lagged variables as well as deviations of GDP from HP trend and the key policy rate of the central bank of Sweden, which is found to be highly correlated with that of the Bank of Israel, rm, and, at least to some extent, it is exogenous.

BIS Papers No 83 207
The quantitative analysis
The data
To study the effects of the financial market reforms on the monetary policy transmission mechanism, we utilise monthly data on the marginal lending and deposit rates that commercial banks charge and pay, respectively, during the previous month. In addition, we use the Bank of Israel (henceforth BOI) key policy rate.9 We use panel data that consist of an individual bank’s interest rates with duration one to three months, three to six months, six to 12 months and above 12 months. For the banks’ exposure to credit risk, we use quarterly data on the bank’s loan loss reserves. We also use the pricing of the commercial bank issued bonds vs risk-free government bonds. The sample includes monthly data from January 1999 up to April 2012 in the five largest banking groups in Israel.10 To control for shifts in the demand for bank loans, we use seasonally adjusted monthly GDP and the monthly composite state of the economy index. We also use in the regression quarterly data on the banks’ non-interest income and operational expenses, as well as their total assets and total risk-adjusted assets.
We use the BOI key rate as the benchmark interest rate on which the market participants based their pricing. Banks in addition follow the monopolistic bank’s first-order conditions in the pricing of the loans. Given that the commercial bank deposit rates closely followed the BOI key rate – supporting the assumption of perfect competition in the deposit market – the analysis in this study focused on the correlation between the dynamics of the BOI key rate and dynamics of the banking lending rates. In fact, this is the essence of the monetary policy transmission mechanism.
Regression results
Quarterly panel data on the marginal banking (deposit and loan) interest rates and on banking loan loss reserves allow the transmission mechanism to be estimated as is reflected by the relationship between the lending rate, the credit risk and the marginal cost of raising the bank liabilities equations (2) and (3). We also study the trade-off between banking interest income and net operational income. To that end, we include in the regressions three alternative indicators of net operational income: (i) the coverage ratio (operational income vs operational expenses); (ii) the ratio of operational income to total assets; and (iii) total operational income to risk-weighted assets. We use 2SLS in the empirical estimation to overcome the endogeneity of the various interest rates as well as of the loan loss reserves.11
Result 1. The determination of the deposit rates depends on the BOI policy key rate but does not depend on the degree of risk the bank is exposed to. Market discipline by depositors doesn’t seem to be present.
On the other hand, during the period of the sample years, variations emerge in the wedge between the banks’ bond yield and the government bond yield,
9 We use only fix nominal rates.
10 Since these micro-banking data cannot be displayed publicly, we report only the regression results.
11 For instrument variables we use the Bank of Israel key policy rate, lagged market interest rates and the lagged problematic loan ratio.
208 BIS Papers No 83
indicating variations in the capital market credit risk premium (see Graph 10). This result is inconsistent with the aforementioned regression estimates, unless we interpret the regression result as an empirical indication of the fact that large banks in Israel are considered too big to fail, or that there exists (de facto) bank deposit insurance. The estimated coefficients on RM in both regressions (see Tables (1) and (2)) are significantly positive and robust and in most cases smaller than unity.
From the regression results displayed in Tables (1) and (2) it transpires that the deposit rates are insensitive to the commercial bank’s exposure to credit risk, and we thus expect the credit risk dynamics to be embedded in the lending interest rates.
Result 2. The estimated coefficient of the problem loan ratio is found significantly positive and robust (see Tables 3 and 4), indicating that the lending rate increases with the credit risk. We interpret this positive coefficient as an indication that banks know and price their exposure to credit risk imbedded in extending loans to individual borrowers.
In these regressions we also include a dummy variable, (see Dum08 in Tables 3 and 4), that takes the value 0 before and including the fourth quarter of 2007 and the value one thereafter.
Result 3. The dummy variable is found significantly positive in the estimated regression of the short run (one to three months) lending rate (see Table 3) reflecting a ceteris paribus rise in the lending rate and thereby in the interest rate differential in the first quarter of 2008. This increase is beyond the effect of the ratio of the problem loans on the lending rate.
In an asymmetry of information environment, this indiscriminate increase of the lending rate affects all borrowers (including the good ones) and thus has the potential of impairing the monetary policy transmission mechanism. The coincidence of this dummy effect on the lending rate and the timing of the onset of the global financial crisis and the persistence of the shock hint at the possibility that the likelihood of a realisation of a systemic credit risk increased in 2008 and that this increase was not just an idiosyncratic one.
In these lending rate regressions, we also examine the hypothesis that commercial banks utilise the trade-off between net interest income and net non-interest (operational) income. That is, in situations where banks are faced with a reduction in net non-interest income (eg due to a downturn in the economy), they raise the interest rate differential by, for instance, increasing the lending rate for which demand is relatively inelastic, and vice versa. This is, of course, problematic because an irrelevant factor (eg the banks’ operating expenses) enters the pricing for investors/borrowers, causing inefficiency. It also has the potential to impair the transmission mechanism. For this purpose, we include in the regressions the coverage ratios, COV RATIO (see Tables 3 and 4).
Result 4. The coverage ratio is found to be negative (as expected) but weakly significant in the regression of the short run (one to three months) lending rate (Table 3). This empirical result is consistent with the use of the aforementioned trade-off and in itself implies a potential effect on the transmission mechanism.
In equation (3) there appears the elasticity of the public demand for loans, which depends among other things on macro variables. However, these variables (eg the deviations of GDP from its HP trend) are not significant.

BIS Papers No 83 209
The data we use for the aforementioned statistical tests include marginal pricing of the banking supply of deposit and demand for loans. For robustness, we also perform the regression utilising panel data on the average interest rates for households’ utilisation of lines of credit. For this regression, we use similar explanatory variables (as above) and use similar regression methodology of 2SLS. To allow for differential effects of rm on the lending rate when it is raised vs the case where it is decreased, we include in addition to rm as explanatory variables the variables rm*ddown and rm*dup, where the ddown gets the value 1 when rm falls and 0 otherwise, and dup gets the value 1 when rm rises and 0 otherwise.12 The results are summarised in Table 5. All the explanatory variables came out significant with the expected signs (including the coverage ratio) and qualitatively similar to the results reported in Tables 3 and 4. Although the coefficients of rm*ddown and rm*dup turn out to be significant with the right signs, the differential effect is not.
Regression results of the one- to three-month deposit interest rates Table 1
Where CYCLE_PRL_CR(-1) is the rate of the problematic loans in total loans (in deviations from HP trend). Among the instrument variables (see list in Table 1) we use CYCLEGDP(-1) which is the deviations from HP trend in GDP, and SWEDEN which is the Swedish policy interest rate.
12 Note that by construction dup + ddown does not add up to unity since there are instances where rm
remains unchanged.
Dependent Variable: RD_13CMethod: Panel Two-Stage Least SquaresSample (adjusted): 2002Q2 2011Q4Periods included: 39Cross-sections included: 5Total panel (balanced) observations: 195
Convergence achieved after 29 iterationsInstrument list: C SWEDEN CYCLE_PRL_CR(-1) CYCLEGDP(-1)
Lagged dependent variable & regressors added to instrument listCoefficient Std. Error t-Statistic Prob.
C -0.3421 0.0858 -3.9857 0.0001RM 0.8929 0.0190 47.1057 0.0000CYCLE_PRL_CR(-1) 0.0234 0.0143 1.6424 0.1022AR(1) 0.7596 0.0509 14.9245 0.0000Cross-section fixed (dummy variables)R-squared 0.9953 Mean dependent var 3.2365Adjusted R-squared 0.9951 S.D. dependent var 1.9586S.E. of regression 0.1372 Sum squared resid 3.5195F-statistic 180.6488 Durbin-Watson stat 1.8266Prob(F-statistic) 0 Second-Stage SSR 95.8769Instrument rank 11Inverted AR Roots 0.76

210 BIS Papers No 83
Dependent Variable: RD_612CMethod: Panel Two-Stage Least SquaresSample (adjusted): 2004Q1 2011Q4Periods included: 32Cross-sections included: 5Total panel (balanced) observations: 160Convergence achieved after 6 iterationsInstrument list: C RM(-1) CYCLE_PRL_CR(-1) CYCLEGDP(-1) SWEDENLagged dependent variable & regressors added to instrument list
Coefficient Std. Error t-Statistic Prob.
C 0.5519 0.1437 3.8415 0.0002RM 0.8110 0.0432 18.7534 0.0000CYCLE_PRL_CR 0.0791 0.0667 1.1854 0.2377AR(1) 0.4080 0.0930 4.3860 0.0000Cross-section fixed (dummy variables)R-squared 0.9383 Mean dependent var 3.1771Adjusted R-squared 0.9355 S.D. dependent var 1.2419S.E. of regression 0.3154 Sum squared resid 15.1214F-statistic 81.5604 Durbin-Watson stat 1.9800Prob(F-statistic) 0 Second-Stage SSR 51.5620Instrument rank 10Inverted AR Roots 0.41
Regression results of the six to 12-month deposit interest rates Table 2

BIS Papers No 83 211
Dependent Variable: RL_13CMethod: Panel Two-Stage Least SquaresDate: 01/06/13 Time: 20:35Sample (adjusted): 2002Q4 2011Q4Periods included: 37Cross-sections included: 5Total panel (balanced) observations: 185Convergence achieved after 8 iterationsInstrument list: C DUM08 SWEDEN CYCLE_PRL_CR(-4) COV_RATIO(-1) CYCLE_PRL_CR(-1)Lagged dependent variable & regressors added to instrument list
Coefficient Std. Error t-Statistic Prob.
C 5.4147 0.7629 7.0975 0.0000DUM08 0.4815 0.2260 2.1304 0.0345RD_13C 0.9568 0.1476 6.4847 0.0000CYCLE_PRL_CR 0.4338 0.2206 1.9670 0.0508COV_RATIO(-1) -1.6339 1.1538 -1.4161 0.1585AR(1) 0.7856 0.0518 15.1616 0.0000Cross-section fixed (dummy variables)R-squared 0.9353 Mean dependent var 7.6645Adjusted R-squared 0.9320 S.D. dependent var 1.9263S.E. of regression 0.5024 Sum squared resid 44.1724F-statistic 172.9788 Durbin-Watson stat 2.1471Prob(F-statistic) 0 Second-Stage SSR 68.9898Instrument rank 14Inverted AR Roots 0.79
Regression results of the one- to three-month lending interest rates Table 3
212 BIS Papers No 83
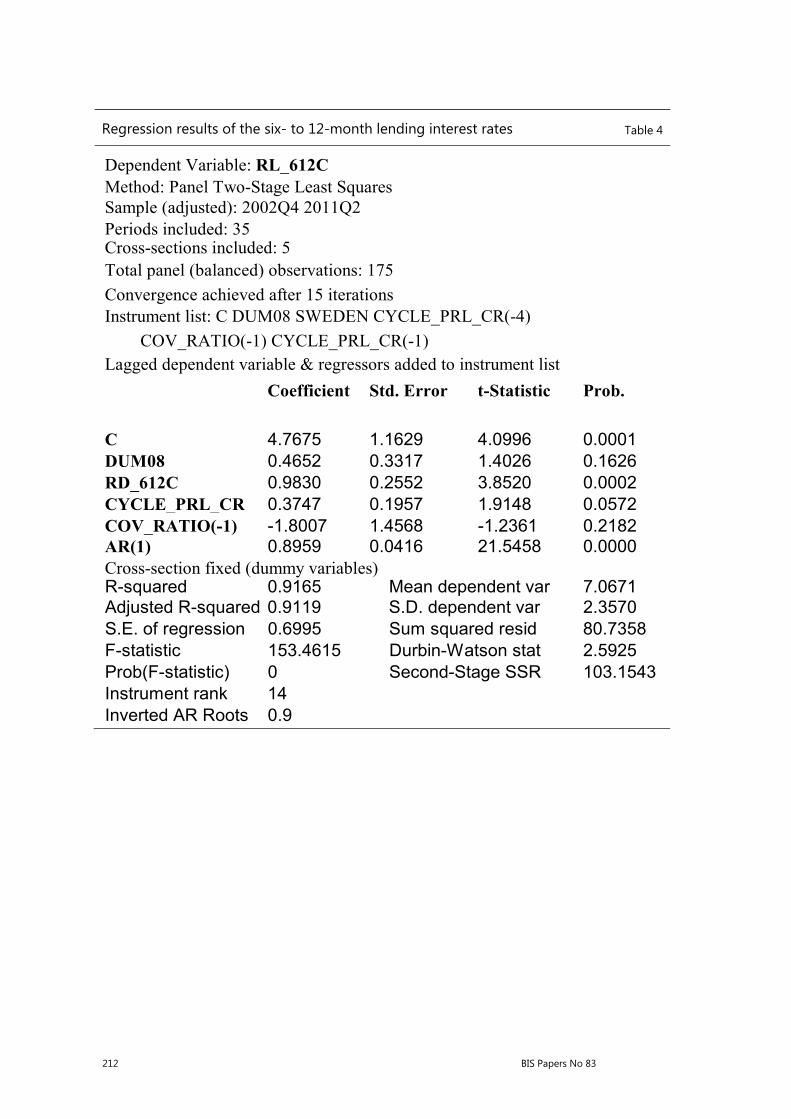
Dependent Variable: RL_612CMethod: Panel Two-Stage Least SquaresSample (adjusted): 2002Q4 2011Q2Periods included: 35Cross-sections included: 5Total panel (balanced) observations: 175
Convergence achieved after 15 iterationsInstrument list: C DUM08 SWEDEN CYCLE_PRL_CR(-4)
COV_RATIO(-1) CYCLE_PRL_CR(-1)Lagged dependent variable & regressors added to instrument list
Coefficient Std. Error t-Statistic Prob.
C 4.7675 1.1629 4.0996 0.0001DUM08 0.4652 0.3317 1.4026 0.1626RD_612C 0.9830 0.2552 3.8520 0.0002CYCLE_PRL_CR 0.3747 0.1957 1.9148 0.0572COV_RATIO(-1) -1.8007 1.4568 -1.2361 0.2182AR(1) 0.8959 0.0416 21.5458 0.0000Cross-section fixed (dummy variables)R-squared 0.9165 Mean dependent var 7.0671Adjusted R-squared 0.9119 S.D. dependent var 2.3570S.E. of regression 0.6995 Sum squared resid 80.7358F-statistic 153.4615 Durbin-Watson stat 2.5925Prob(F-statistic) 0 Second-Stage SSR 103.1543Instrument rank 14Inverted AR Roots 0.9
Regression results of the six- to 12-month lending interest rates Table 4

BIS Papers No 83 213
Dependent Variable: HHDMethod: Panel Two-Stage Least SquaresSample (adjusted): 2002Q3 2012Q1Periods included: 39Cross-sections included: 5Total panel (balanced) observations: 195Convergence achieved after 25 iterationsInstrument list: C DUM08 COV_RATIO(-2) SWEDEN(-1) SWEDEN(-1) *DDOWN SWEDEN(-1)*DUP COV_RATIO(-1) CYCLE_PRL_CR( -1) CYCLE_PRL_CR(-3)Lagged dependent variable & regressors added to instrument list
Coefficient Std. Error t-Statistic Prob.
C 9.5733 1.0798 8.8657 0.0000RM 0.7709 0.0466 16.5458 0.0000RM*DDOWN -0.0320 0.0137 -2.3279 0.0210COV_RATIO -6.6855 1.9202 -3.4818 0.0006CYCLE_PRL_CR 0.2523 0.1328 1.8996 0.0591DUM08 0.2839 0.1665 1.7051 0.0899RM*DUP 0.0346 0.0160 2.1574 0.0323AR(1) 0.8321 0.0496 16.7815 0.0000Cross-section fixed (dummy variables)R-squared 0.9647 Mean dependent var 9.2586Adjusted R-squared 0.9625 S.D. dependent var 1.9362S.E. of regression 0.3748 Sum squared resid 25.7018F-statistic 201.0984 Durbin-Watson stat 2.3002Prob(F-statistic) 0 Second-Stage SSR 55.5664Instrument rank 18Inverted AR Roots 0.83
Regression results of the average interest rates on households’ utilisation of lines of credit Table 5

214 BIS Papers No 83
References
Freixas, X and J Rochet (2008): Microeconomics of Banking, MIT Press.
Gertler, M and S Gilchrist (1992): “The role of credit market imperfections in the monetary transmission mechanism: arguments and evidence”, mimeo, New York University.
Hoshi, T, A Kashyap and D Scharfstein (1991): “Corporate structure liquidity, and investment: Evidence from Japanese industrial groups”, Quarterly Journal of Economics, vol 33, no 60.
Oliner, S and G Rudenbusch (1996): “Monetary policy and credit conditions: evidence from the composition of external finance: Comment”, American Economic Review, March, pp 300–9.