Final Version: 21/09/2015 Pharma industry’s contribution to health and wealth Health & Wealth.
40
Final Version: 21/09/2015 Pharma industry’s contribution to health and wealth www.efpia.eu Health & Wealth
-
Upload
justin-parker -
Category
Documents
-
view
215 -
download
1
Transcript of Final Version: 21/09/2015 Pharma industry’s contribution to health and wealth Health & Wealth.

Final Version: 21/09/2015
Pharma industry’s contribution to health and wealth
www.efpia.eu
Health & Wealth

2
Health & Wealth – Rationale
The purpose of this document is to address some of the key questions regarding the contribution of the pharmaceutical industry to health and wealth in Europe:
What has been the contribution of the pharmaceutical sector to improve health outcomes in Europe ?
How are medicines contributing to economic productivity and wealth creation in Europe ?
The document has been divided in two sections which gather a rich and robust collection of evidence aiming at tackling these questions. The objective is to facilitate an evidence-based discussion amongst stakeholders including payers, policymakers and regulators.

3
Index
Health and Wealth – Rationale ………………………………………………………………………………………..................................................................................................Index ……………………………………………………………………………………………………………………………………………………………………………………………………………………………..Part I: What has been the contribution of the pharmaceutical sector to improve health outcomes in Europe ?............................................................. Europe has shown substantial improvements in life expectancy during the last 65 years………………………………………………………………………………………….
Life expectancy continues to improve today – and medicines usage has made major contribution to recent advances…………………………………………….In areas like cancer, medicines innovation continues to play a key role in increasing life expectancy………………………………………………………………………..Medicines have made substantial progress to improve patients’ conditions in many difficult areas……………….............................................................Cure rates of hepatitis C patients are rising thanks to the launch of innovative treatments………………………………………………………………………………………Improvement in treatments and earlier detection have contributed to an increase in cancer survival rates……………………………………………………………..Progress in the treatment of HIV/AIDS has contributed to a significant decline in death rates………………………………………………………………………………….Industry pipelines have historically been targeting the major unmet needs of European society…………………………………..………………………………………….The pharmaceutical industry remains firmly committed to investing in finding solutions to key unmet needs…………………………………….………..............With over 16 000 compounds currently in development, over 80% of projects are focused on degenerative diseases, non communicable diseases (NCDs) and cancer………………………………………………………………………………………………………………….......................................................................................For degenerative diseases, Non Communicable Diseases and Cancer balanced mix can be found across all phases of compound development….……………………………………………………………………………………………………………………………………….………………………………………………The industry continues to invest in innovating new oral forms in line with patient preference………………………………………………………………………………….The advent of social media and more connected patients are opening up new opportunities to support patients and physicians………………………………………................................................................................................................................................................................Innovative medicines are showing superior results in health outcomes and cost effectiveness compared to existing treatments…………………………………………………………………………………………………………………………………………………………………….…………………………………………
23
67
89
1011121314
15
1617
5
18
19

4
Index
Part 2: How are medicines contributing to economic productivity and wealth creation in Europe? ..........................................................Demographic changes and higher longevity cause major health challenges for Europe……………………………………………...…….....................Workforce reduction and increasing dependency ratio put increased pressure of society’s healthcare financing but also increase the importance of keeping working age people healthy and productive………………………………………………………………………..……………………………Chronic diseases are already a major part of healthcare bill and, unmanaged, risks factors indicate it will keep rising….........................Forecast show an acceleration in lost output due to illness; high income economies like Europe are the most exposed…......................Health-related disability increases sharply with age and across Europe there is an increase in reported disabilities……….......................With an aging population living with disabilities focus needs to shift from preventing mortality to improving quality of life and function…………………………………………………………………………………………………...........................................................................................Health is a major cause of productivity loss and early labour market exit, with many causes being addressable.....................................Keeping the population healthy and productive is a critical priority and medicines have and can continue to be part of the solution……………………………………………………………………………………………………………………………………………………………………….……………………….Reducing disability and sickness transfers, by improving outcomes, can further contribute to Europe’s ability to fund future investments…………………………………………………………………………………………………………………………………………………………….....……………………..Medicines offer an opportunity to reduce the cost of productivity loss and disability by improving workforce health……......................
Bibliography…………………………………………………………………………………………………………………………………………………………………..............................
2021
22232425
2627
28
293031

5
Part 1: key messages
Part 1: What has been the contribution of the pharmaceutical sector to improve health outcomes in Europe ?
Europe has shown substantial improvements in life expectancy over the last 65 years Life expectancy continues to improve today – and medicines usage has made major contribution to recent advancesIn areas like cancer, medicines innovation continues to play a key role in increasing life expectancyMedicines have made substantial progress to improve patients’ conditions in many difficult areas Cure rates of hepatitis C patients are rising thanks to the launch of innovative treatmentsExperience from the US shows that improvement in treatments and earlier detection have contributed to an increase in cancer survival ratesProgress in the treatment of HIV/AIDS has contributed to a significant decline in death ratesIndustry pipelines have historically been targeting the major unmet needs of the European society The pharmaceutical industry remains firmly committed to investing in finding solutions to key unmet needsWith over 16 000 compounds currently in development, over 80% of projects are focused on degenerative diseases, Non Communicable Diseases (NCDs) and cancer For degenerative diseases, NCDs and Cancer balanced mix can be found across all phases of compound developmentThe industry continues to invest in innovating new oral forms in line with patient preferenceThe advent of social media and more connected patients are opening up new opportunities to support patients and physicians
6
Part 1: health outcomes
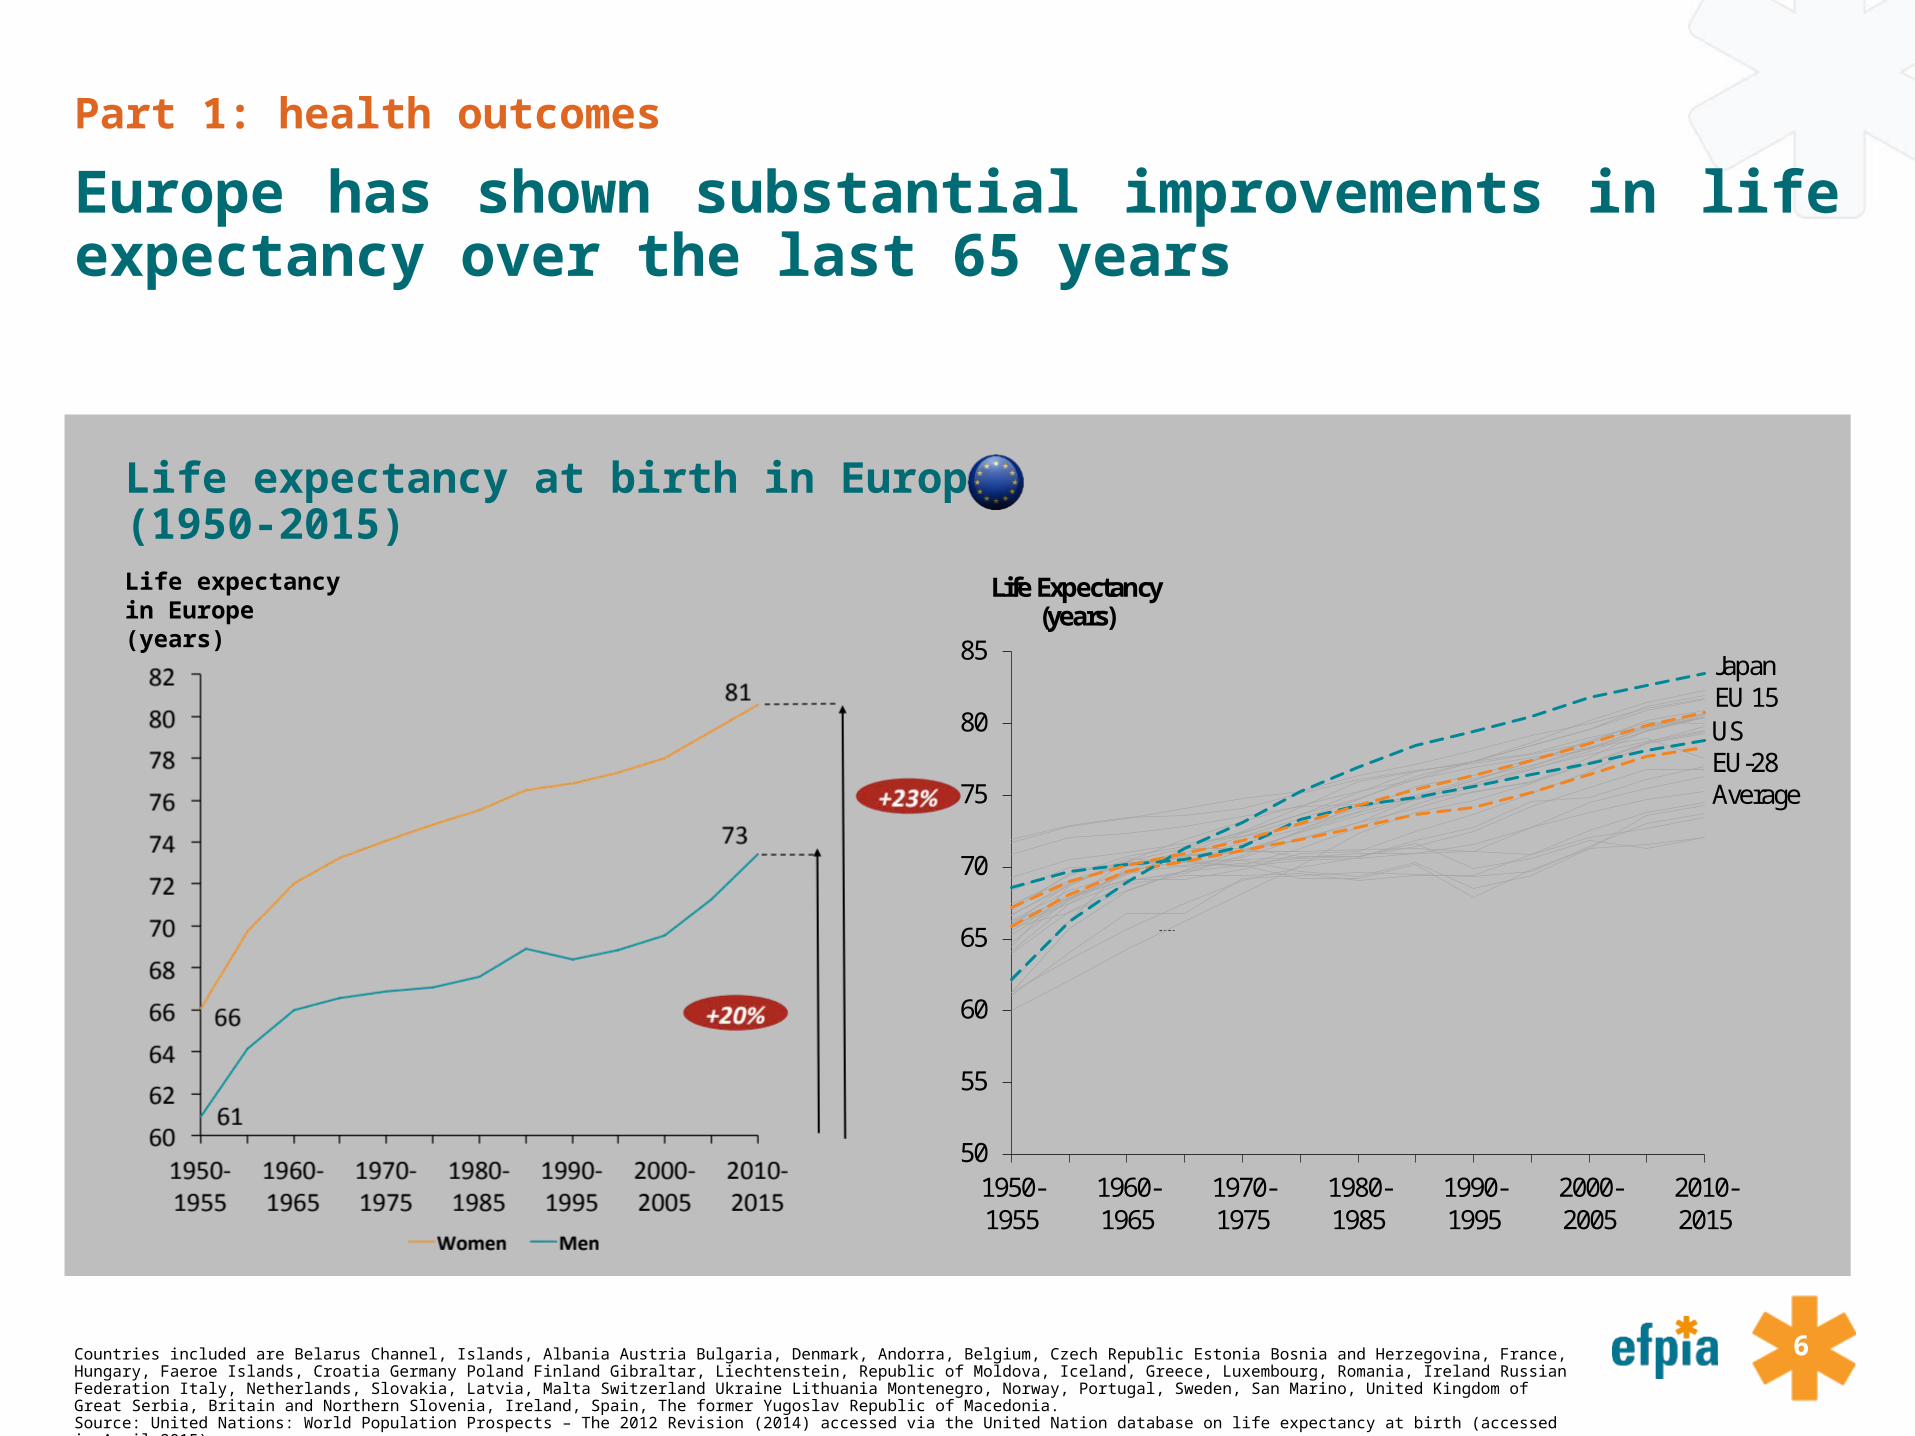
Europe has shown substantial improvements in life expectancy over the last 65 years
Countries included are Belarus Channel, Islands, Albania Austria Bulgaria, Denmark, Andorra, Belgium, Czech Republic Estonia Bosnia and Herzegovina, France, Hungary, Faeroe Islands, Croatia Germany Poland Finland Gibraltar, Liechtenstein, Republic of Moldova, Iceland, Greece, Luxembourg, Romania, Ireland Russian Federation Italy, Netherlands, Slovakia, Latvia, Malta Switzerland Ukraine Lithuania Montenegro, Norway, Portugal, Sweden, San Marino, United Kingdom of Great Serbia, Britain and Northern Slovenia, Ireland, Spain, The former Yugoslav Republic of Macedonia.Source: United Nations: World Population Prospects – The 2012 Revision (2014) accessed via the United Nation database on life expectancy at birth (accessed in April 2015);
Life expectancy at birth in Europe (1950-2015)
50
55
60
65
70
75
80
85
1950-1955
1960-1965
1970-1975
1980-1985
1990-1995
2000-2005
2010-2015
JapanEU 15USEU-28 Average
Life Expectancy(years)
Life expectancy in Europe (years)

7
Part 1: health outcomes
Life expectancy continues to improve today and medicines usage has made major contribution to recent advances
Source: Lichtenberg, F: Pharmaceutical innovation and longevity growth in 30 developing OECD and high-income countries, 2000 - 2009 (2012)
Contribution of innovative medicines to increase in life expectancy (2004-2009)
From 2000 – 2009, an improvement in population weighted mean life expectancy at birth of 1.74 years was seen across 30 OECD countries.
Innovative medicines are estimated to have contributed to 73% of this improvement once other factors are taken into account (e.g. income, education, immunization, reduction in risk factors, health system access).
27%
73%
72,0
72,5
73,0
73,5
74,0
74,5
75,0
75,5
76,0
76,5
77,0
2000 Other Contribution ofInnovative Medicines
20090
+1.74 years
Life Expectancy(years)

8
Part 1: health outcomes
In areas like cancer, medicines innovation continues to play a major role in increasing life expectancy
Source: Smith, B: The Future of Pharma (2011)
Increases in life expectancy 1980 - 2008 Contribution to increased life expectancy from new treatments incl. new medicines
0,0
0,5
1,0
1,5
2,0
2,5
3,0
3,5
1980 2008
Life expectancy of cancer patients
(0 = base value)
Increase in life expectancy
(in years)+ 3 years
Contribution to increased life expectancy in %
83%
17%
100%
0%
10%
20%
30%
40%
50%
60%
70%
80%
90%
100%
New Treatments/Medicines
other Total

9
Part 1: health outcomes
Medicines have made substantial progress to improve patients’ conditions in many difficult areas
*Note: National Cancer Institute. Surveillance, Epidemiology, and End Results Program. http://seer.cancer.gov/faststats/selections.php?#Output. Rockville, Md.: National Institutes of Health. Cited in PhRMA, biopharmaceutical in perceptive, spring 2015.Source: PhRMA, biopharmaceutical in perceptive, spring 2015
HIV/AIDS In the last 20 years, progress in treatment have contributed to a decline of approximately 85% in HIV death rates. HIV has been transformed from a fatal disease to a chronic condition.
CancerNew therapies have contributed to a 22% decrease in cancer deaths since the 1990s in the USA. According to a recent study*, 83% of survival gains in cancer are attributable to new treatments, including medicines.
Rheumatoid Arthritis The treatment of this disease has significantly improved in the last two decades. While the previous treatments focused on the management of the symptoms, the current therapies target the causes of inflammation which can lead to disease remission.
Cystic Fibrosis New treatments have contributed to improve the life of patients and have increased their life expectancy.

10Note: Cure rates are based on the results of clinical trials reported by the Food and Drug Administration for different drugs against Hepatitis C. Sources: PhRMA (2014), 25 years of Progress against Hepatitis C and PhRMA (2015), 2015 profile. PhRMA (2014), 25 years of Progress against Hepatitis C and PhRMA (2015), 2015 profile.
Part 1: health outcomes
Cure rates of Hepatitis C patients are rising thanks to the launch of innovative treatments
Cures rates and treatment period for hepatitis C patients
0
10
20
30
40
50
60
70
80
90
100
1st generation (2001-2010) 2nd generation (2011-2013) 3nd generation (2013-2014) 4th generation (2014-2015)
41% cured
63-80% cured
95-96%cured
Interferon and Ribavarin Polymerase inhibitorsProtease inhibitors
90% cured
48 weeks treatment
24-48 weeks treatment
12 weeks treatment
8 to 12 weektreatment
Combination Therapies

11
Part 1: health outcomes
Experience from the US shows that improvement in treatments and earlier detection have contributed to an increase in cancer survival rates
National Cancer Institute website. Available at http://seer.cancer.gov/csr/1975_2012/browse_csr.php (accessed in August 2015)
5 years cancer survival rates by year of diagnosis (%)
48,9 49
50,1
52,455,3
59,961,3
63,365,9
67 68,7
74,8 74,4 76,178,9
84
85,2 86,3 88,2 89,7 89,9 90,7
46,547,9
50,5
51,5 50,9 50,7
52,5
58,8
63,9
69,771,9
67,770,1
7275,1
82,8
92,995,2
97,399,3 99,6
99,4
40
50
60
70
80
90
100
1975-1977 1978-1980 1981-1983 1984-1986 1987-1989 1990-1992 1993-1995 1996-1998 1999-2001 2002-2004 2005-2011
All types of cancer Breast cancer Non-Hodgkin Lymphoma Prostate

12
Part 1: health outcomes
Progress in the treatment of HIV/AIDS has contributed to a significant decline in death rates
Source: HIV/AIDS surveillance in Europe 2013, WHO Regional Office for Europe & European Centre for Disease Prevention and Control (ECDC), November 2014 cited in EFPIA, the pharmaceutical industry in figures (2015).
Number of deaths among Aids cases in Europe (Total EU/EEA)
-75%

13
Part 1: health outcomes
Industry pipelines have historically been targeting the major unmet needs of European society
Source: Catala-Lopez, F. et al: Development of new medicinal products in the European Union (2010); A.T. Kearney analysis
Share of EMA approvals 1995 – 2009 and share of DALYs per 100,000 in EU-25 The pharmaceutical industry have to a large extent
focused their innovation on the unmet needs of EU-25 countries.
The comparative lack of output in neuropsychiatric conditions can be explained by the relatively underdeveloped basic scientific understanding of causes of these conditions. Both public and private sectors are investing.
Whilst the chart implies a more than proportionate output in infectious and parasitic diseases it is widely recognized that these conditions are a societal priority
Infectious and parasitic diseases
Respiratory infections
Maternal conditions
Malignant neoplasms
Diabetes mellitus
Blood and endocrine disorders
Neuropsychiatric conditions
Sense organ diseases
Cardiovascular diseases
Respiratory diseases
Digestive diseases
Genitourinary diseases
Musculoskeletal diseases
Congenital anomalies
0%
5%
10%
15%
20%
25%
30%
35%
0% 5% 10% 15% 20%
Shar
e of
DAL
Ys p
er 1
00 0
00 E
U-2
5 (2
004)
Share of EMA approvals 1995 - 2009
Optimal Value for society
Size of bubble illustrates share of DALYs per 100 000 in EU-25
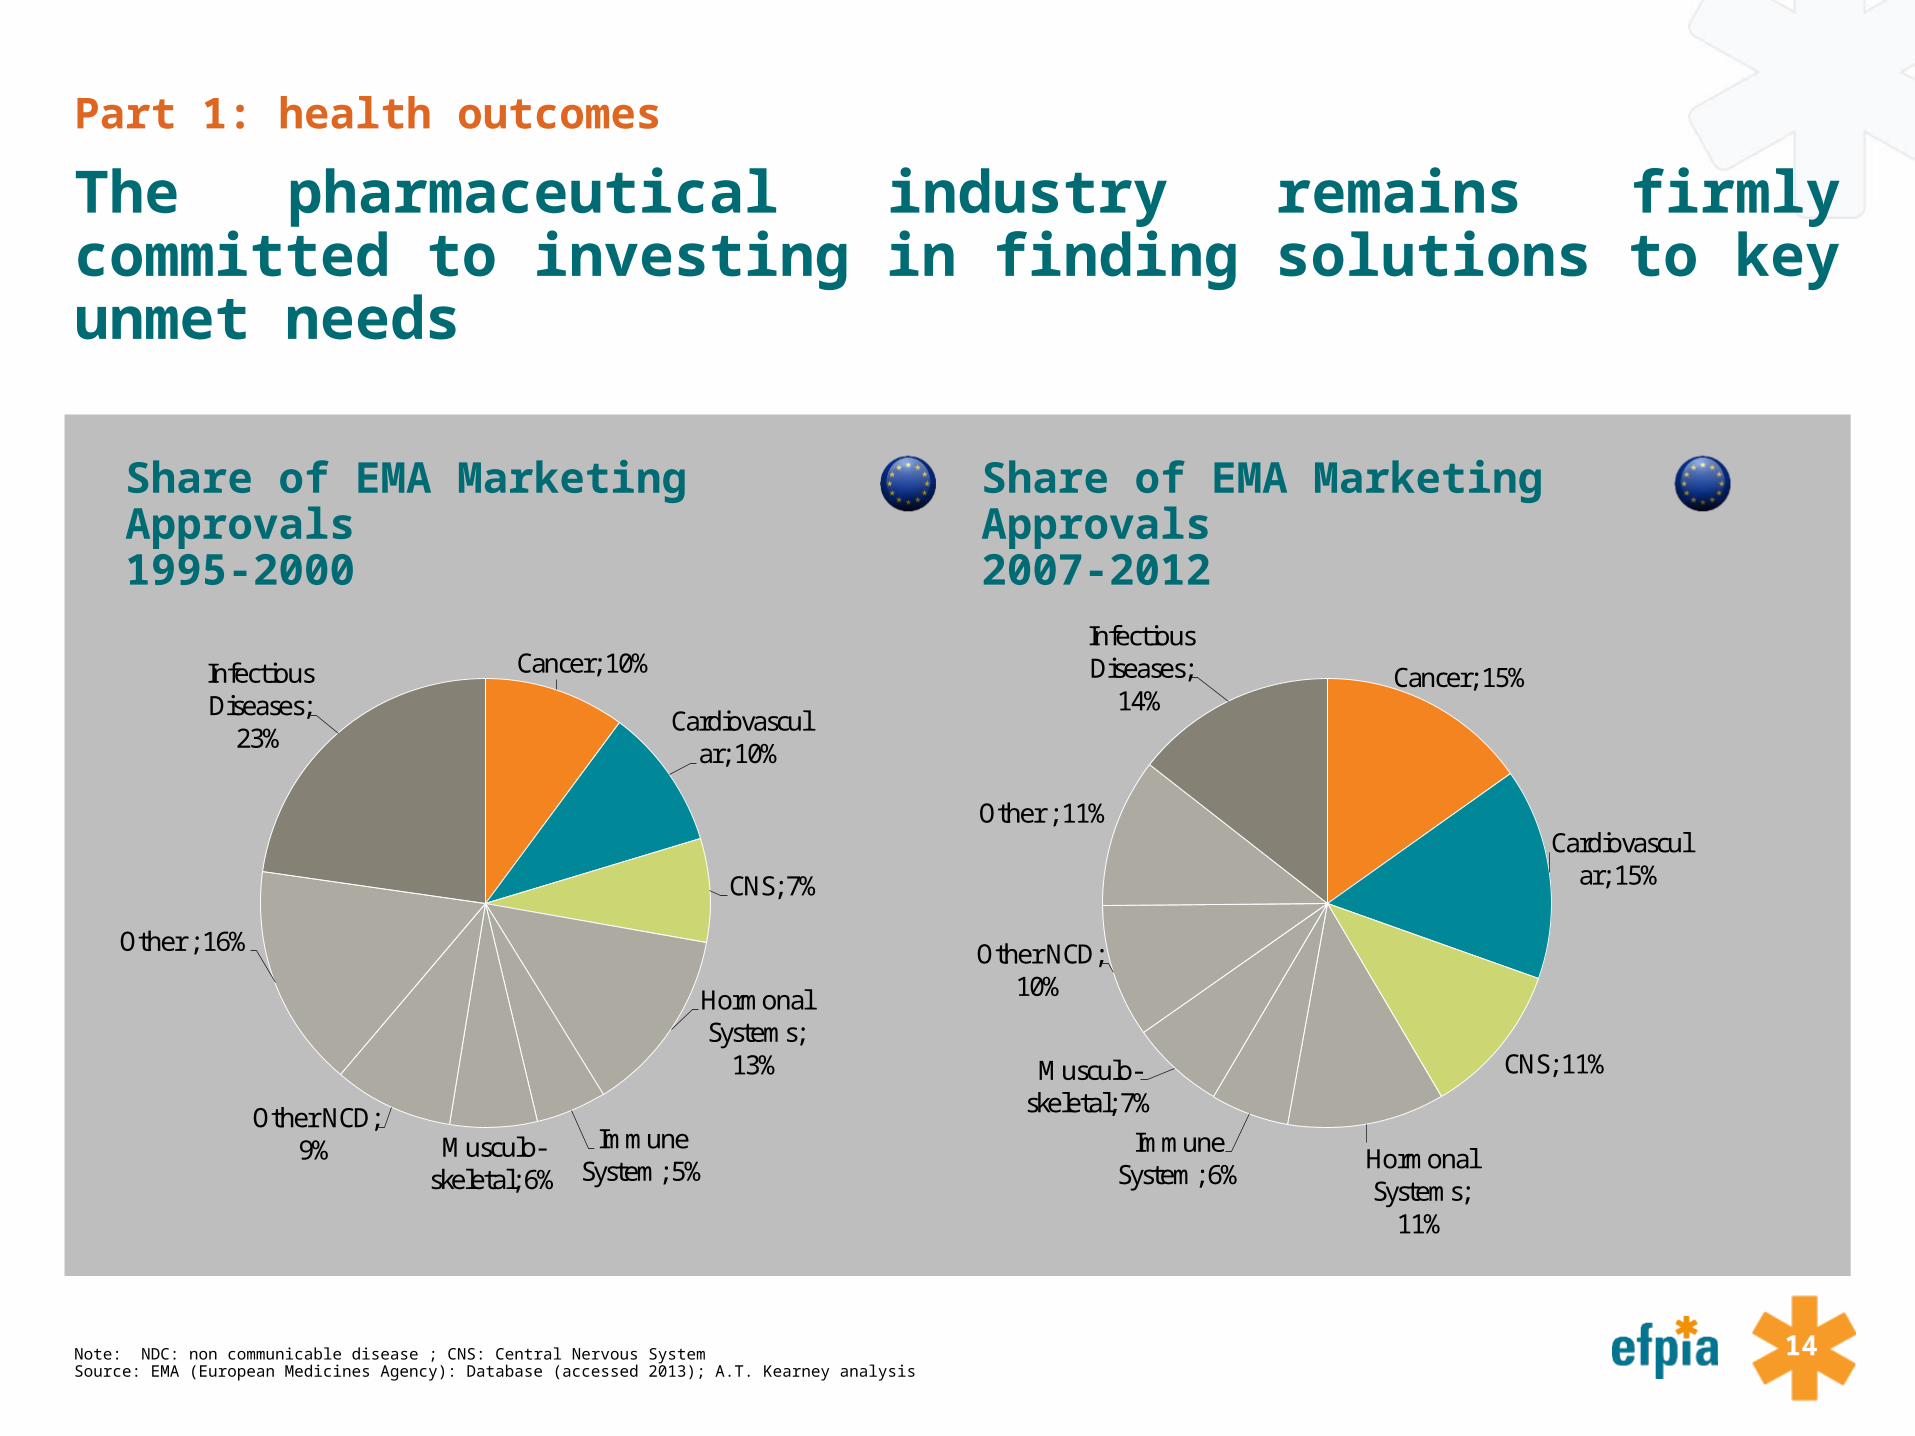
14Note: NDC: non communicable disease ; CNS: Central Nervous System Source: EMA (European Medicines Agency): Database (accessed 2013); A.T. Kearney analysis
Share of EMA Marketing Approvals 1995-2000
Share of EMA Marketing Approvals 2007-2012
Part 1: health outcomes
The pharmaceutical industry remains firmly committed to investing in finding solutions to key unmet needs
Cancer; 10%
Cardiovascular; 10%
CNS; 7%
Hormonal Systems;
13%
Immune System; 5%
Musculo-skeletal; 6%
Other NCD; 9%
Other ; 16%
Infectious Diseases;
23%
Cancer; 15%
Cardiovascular; 15%
CNS; 11%
Hormonal Systems;
11%
Immune System; 6%
Musculo-skeletal; 7%
Other NCD; 10%
Other ; 11%
InfectiousDiseases;
14%
15
Part 1: health outcomes
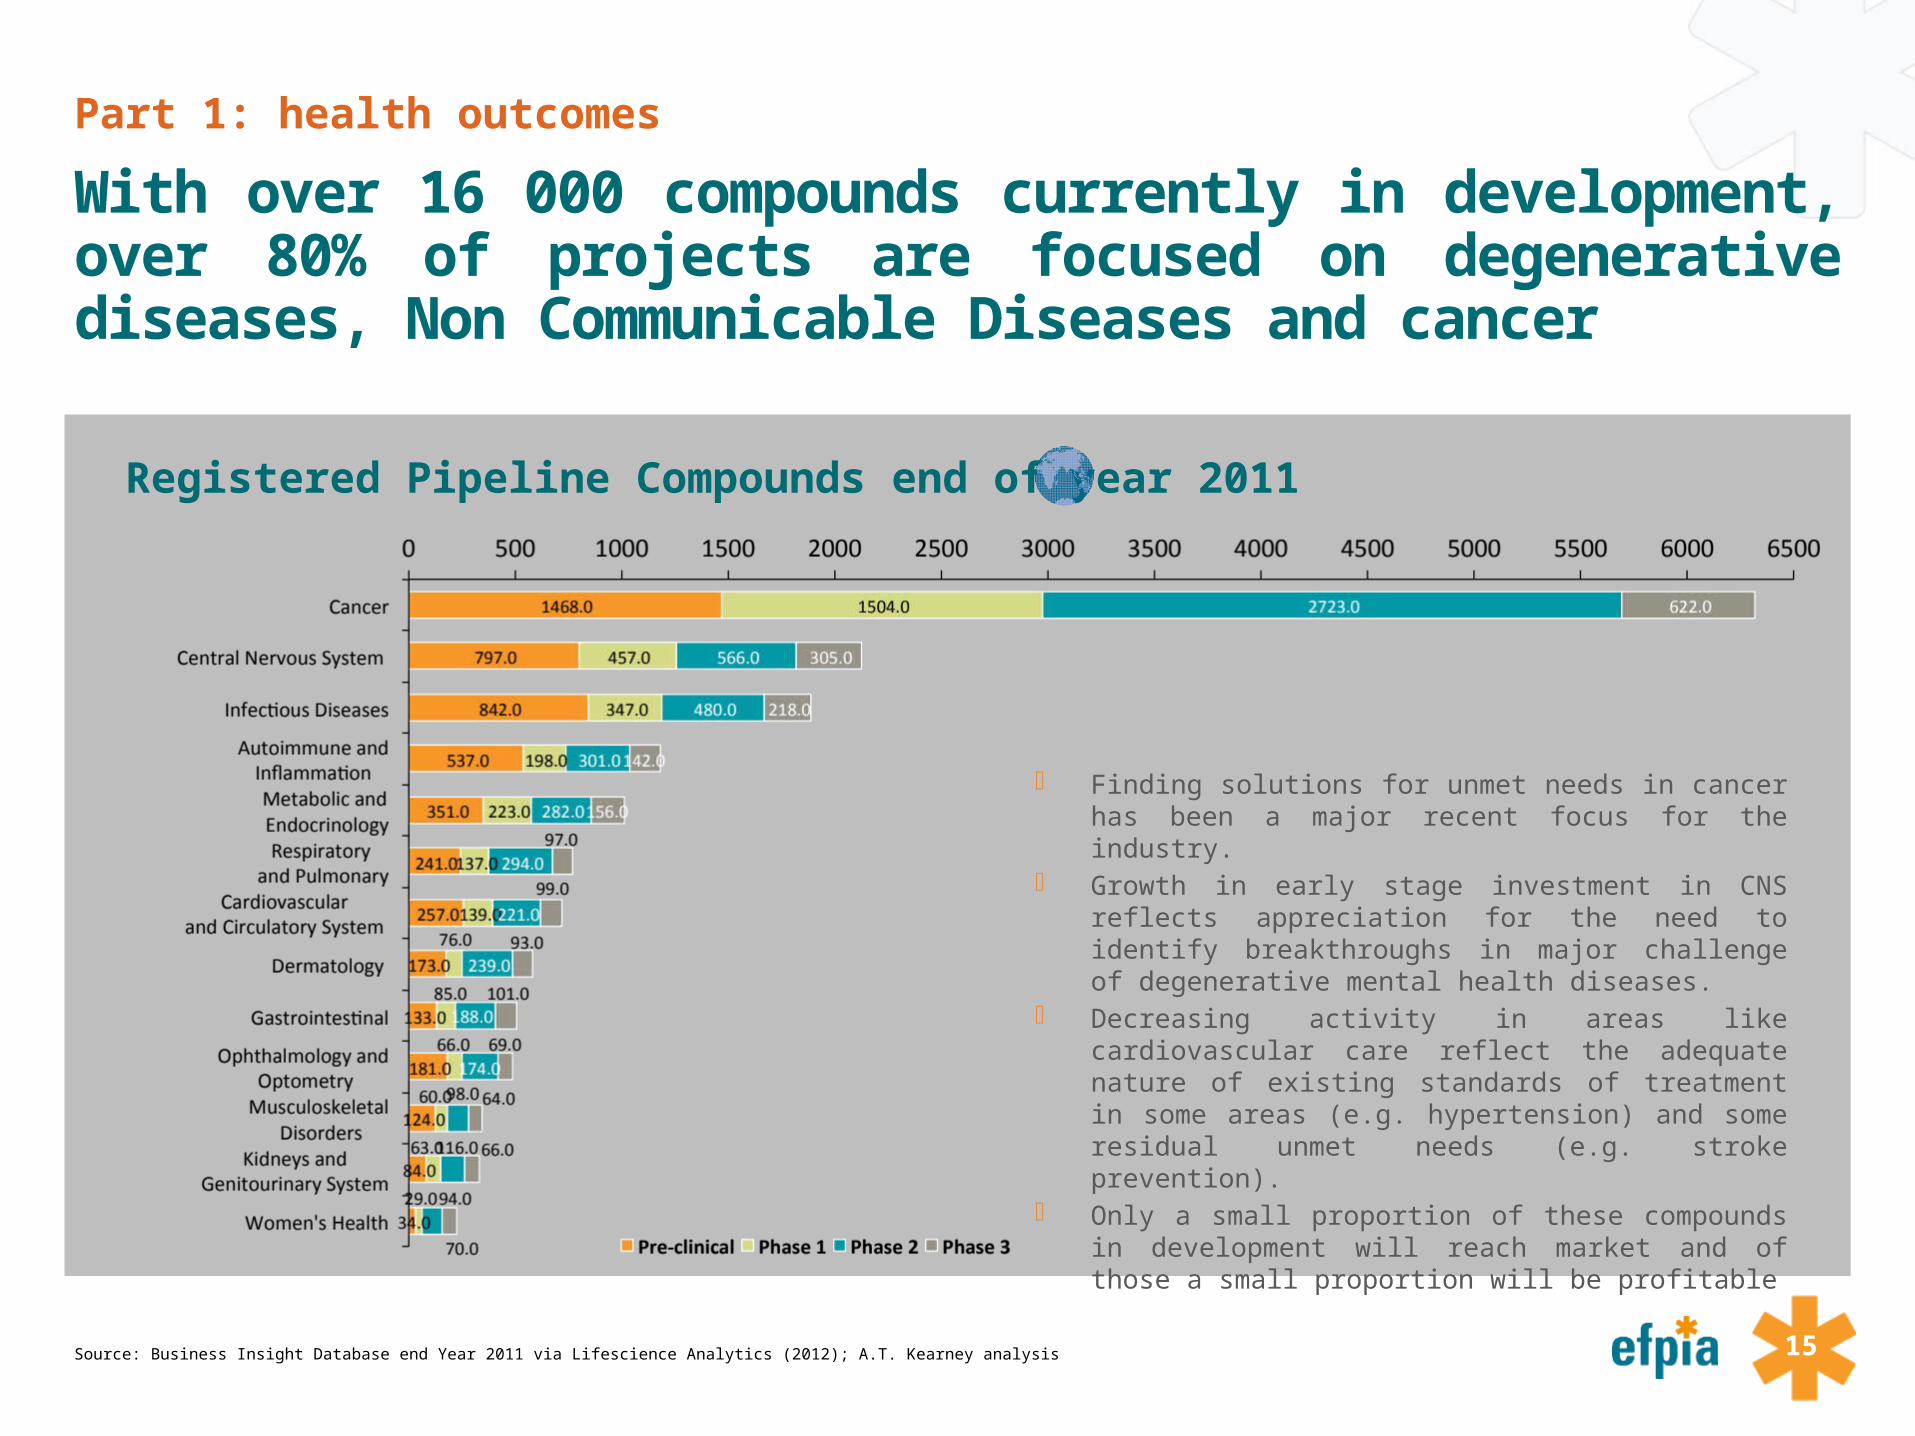
With over 16 000 compounds currently in development, over 80% of projects are focused on degenerative diseases, Non Communicable Diseases and cancer
Source: Business Insight Database end Year 2011 via Lifescience Analytics (2012); A.T. Kearney analysis
Registered Pipeline Compounds end of year 2011
Finding solutions for unmet needs in cancer has been a major recent focus for the industry.
Growth in early stage investment in CNS reflects appreciation for the need to identify breakthroughs in major challenge of degenerative mental health diseases.
Decreasing activity in areas like cardiovascular care reflect the adequate nature of existing standards of treatment in some areas (e.g. hypertension) and some residual unmet needs (e.g. stroke prevention).
Only a small proportion of these compounds in development will reach market and of those a small proportion will be profitable

16
Part 1: health outcomes
For degenerative diseases, Non Communicable Diseases and Cancer balanced mix can be found across all phases of compound development
Source: Business Insight Database end Year 2011 via Lifescience Analytics (2012); A.T. Kearney analysis
Registered Pipeline Compounds per phase end of year 2011
23%
38%
45%
46%
35%
31%
36%
30%
26%
37%
36%
26%
15%
24%
22%
18%
17%
22%
18%
19%
13%
17%
13%
17%
19%
13%
43%
27%
25%
26%
28%
38%
31%
41%
37%
36%
28%
35%
41%
10%
14%
12%
12%
15%
13%
14%
16%
20%
14%
18%
20%
31%
0% 5% 10% 15% 20% 25% 30% 35% 40% 45% 50% 55% 60% 65% 70% 75% 80% 85% 90% 95% 100%
Cancer
Central Nervous System
Infectious Diseases
Autoimmune andInflammationMetabolic and Endocrinology
Respiratory and Pulmonary
Cardiovascularand Circulatory System
Dermatology
Gastrointestinal
Ophthalmology and OptometryMusculoskeletal
DisordersKidneys and
Genitourinary System
Women's Health
Pre-clinical Phase 1 Phase 2 Phase 3
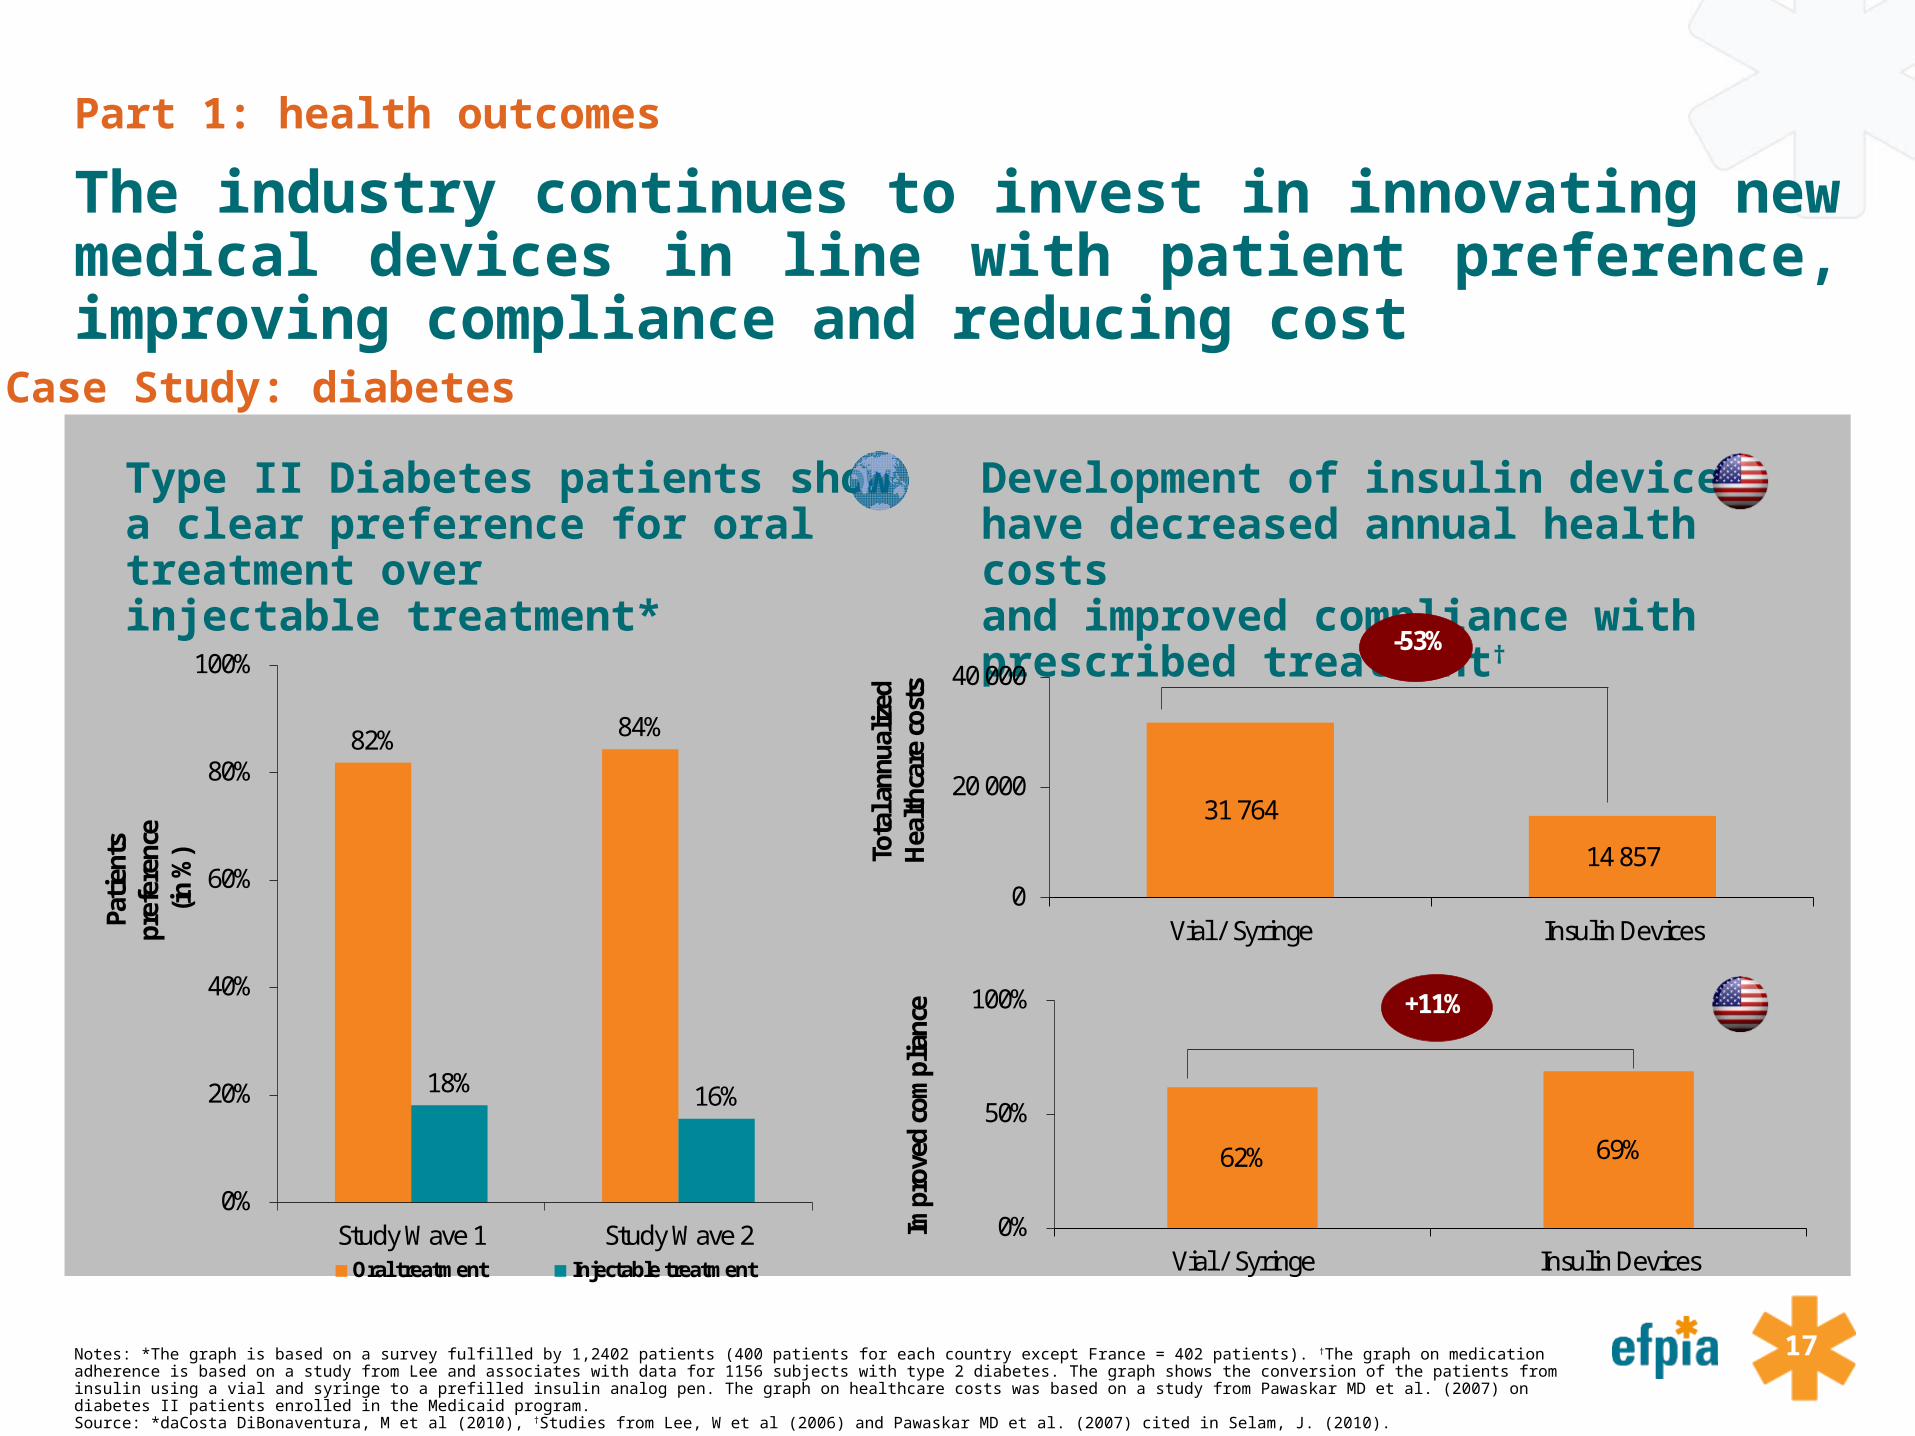
17Notes: *The graph is based on a survey fulfilled by 1,2402 patients (400 patients for each country except France = 402 patients). †The graph on medication adherence is based on a study from Lee and associates with data for 1156 subjects with type 2 diabetes. The graph shows the conversion of the patients from insulin using a vial and syringe to a prefilled insulin analog pen. The graph on healthcare costs was based on a study from Pawaskar MD et al. (2007) on diabetes II patients enrolled in the Medicaid program. Source: *daCosta DiBonaventura, M et al (2010), †Studies from Lee, W et al (2006) and Pawaskar MD et al. (2007) cited in Selam, J. (2010).
Type II Diabetes patients show a clear preference for oral treatment over injectable treatment*
Development of insulin devices have decreased annual health costs and improved compliance with prescribed treatment†
Part 1: health outcomes
The industry continues to invest in innovating new medical devices in line with patient preference, improving compliance and reducing cost
Case Study: diabetes
82% 84%
18% 16%
0%
20%
40%
60%
80%
100%
Study Wave 1 Study Wave 2
Patie
nts
pref
eren
ce
(in %
)
Oral treatment Injectable treatment
31 764
14 8570
20 000
40 000
Vial / Syringe Insulin Devices
Tota
l ann
ualiz
ed
Hea
lthca
re c
osts
-53%
62% 69%
0%
50%
100%
Vial / Syringe Insulin Devices
Impr
oved
com
plia
nce +11%

18
Part 1: health outcomes
The advent of social media and more connected patients are opening up new opportunities to support Patients and physicians
Source: * Changingdiabetesbarometer.com; † Peyrot, M. (2005); ∆ Vincze, G et al (2004); ♯ Blonde, L. et al (2002)
Development of mobile disease management tools
Case Study: diabetes
Situation Situation
Diabetes relies heavily on self-management†, but the majority of patients are not adhering to their recommended therapy∆.
Diabetes patients across Europe are not in good glycemic control resulting in elevated risks for severe macro- and microvascular complications*.
Regular Self-monitoring of Blood glucoses (SMBG) increases the proportion of individuals achieving their glycemic targets♯
Industry’s Response
The pharmaceutical industry has responded to the need for a more integrated way of blood glucose monitoring by establishing new paradigms around mobile and seamless disease management.
Example: ‘iBGStar system’ – an integrated system of blood glucose monitoring, data capture, -storage, and –transmitting and management tool as integrated into an iPhone
83%74%
50% 48% 44% 40%
0%
20%
40%
60%
80%
100%
Ger
man
y
Pola
nd
Fran
ce
Net
herla
nds
Italy
Swed
en
% of patients with HbA1c > 7
64%36%
0%
50%
100%
Non-adherent Adherent
0%
50%
100%
RegularSMBG
IrregularSMBG
NotMonitored
HbA1c<8 HbA1c>82
19
Part 1: health outcomes
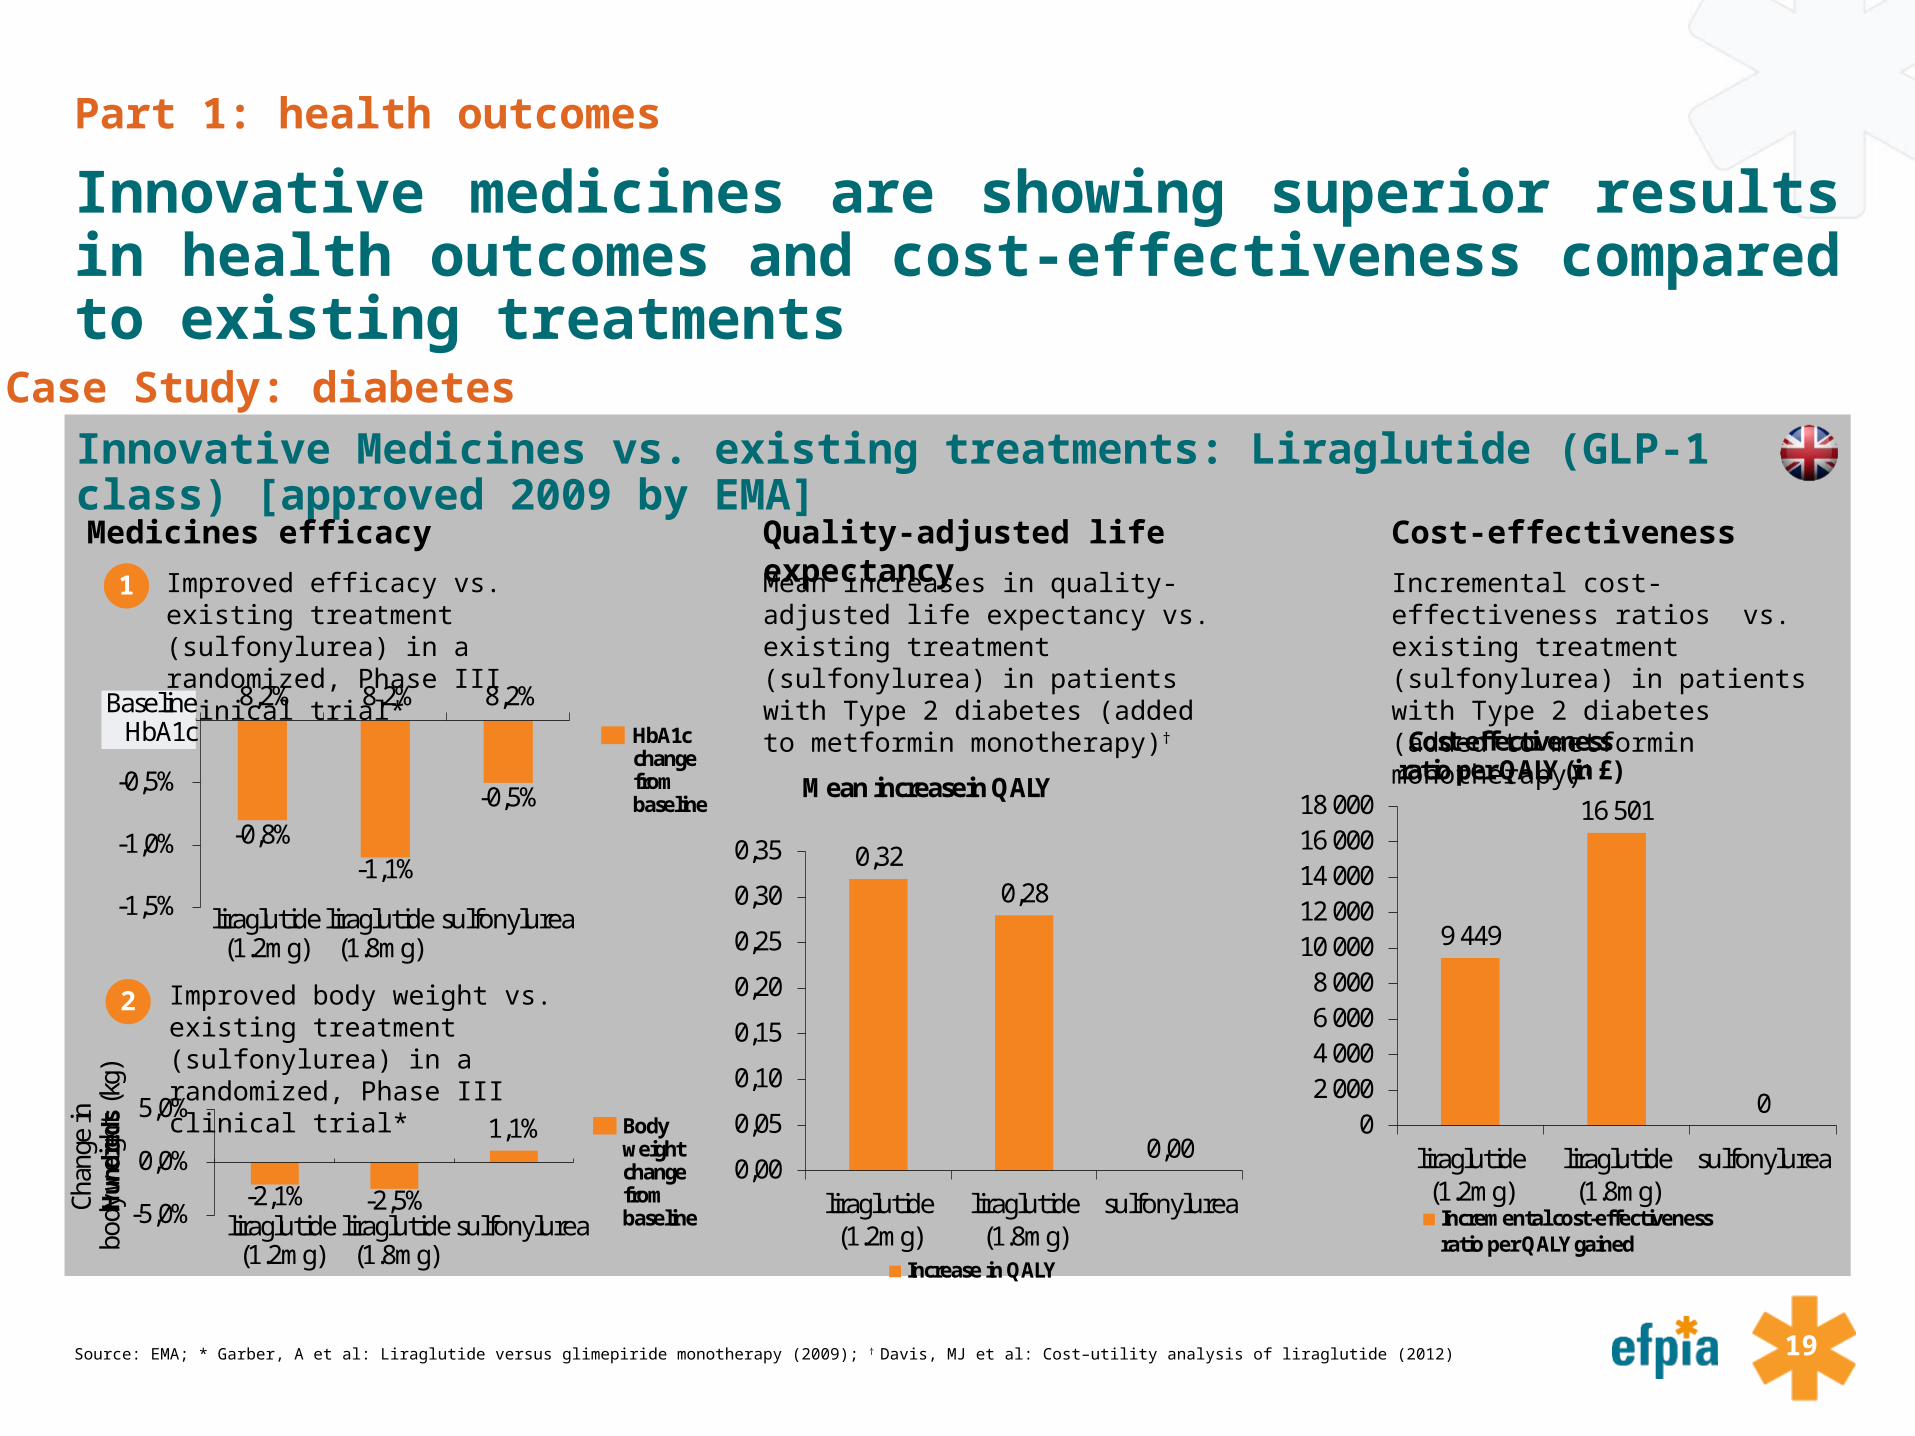
Innovative medicines are showing superior results in health outcomes and cost-effectiveness compared to existing treatments
Source: EMA; * Garber, A et al: Liraglutide versus glimepiride monotherapy (2009); † Davis, MJ et al: Cost–utility analysis of liraglutide (2012)
Innovative Medicines vs. existing treatments: Liraglutide (GLP-1 class) [approved 2009 by EMA]Case Study: diabetes
Medicines efficacy Quality-adjusted life expectancy Cost-effectiveness
1 Improved efficacy vs. existing treatment (sulfonylurea) in a randomized, Phase III clinical trial*
2 Improved body weight vs. existing treatment (sulfonylurea) in a randomized, Phase III clinical trial*
Mean increases in quality-adjusted life expectancy vs. existing treatment (sulfonylurea) in patients with Type 2 diabetes (added to metformin monotherapy)†
Incremental cost-effectiveness ratios vs. existing treatment (sulfonylurea) in patients with Type 2 diabetes (added to metformin monotherapy)†
-0,8%-1,1%
-0,5%
-1,5%
-1,0%
-0,5%
0,0%8,2% 8,2% 8,2%
liraglutide (1.2mg)
liraglutide (1.8mg)
sulfonylurea
BaselineHbA1c HbA1c
change from baseline
-2,1% -2,5%
1,1%
-5,0%
0,0%
5,0%
Hun
dred
s
sulfonylurealiraglutide (1.8mg)
liraglutide (1.2mg)
Body weightchange from baseline
Chan
ge in
bo
dy w
eigh
t (k
g)
0,320,28
0,000,00
0,05
0,10
0,15
0,20
0,25
0,30
0,35
liraglutide(1.2mg)
liraglutide(1.8mg)
sulfonylurea
Increase in QALY
Mean increasein QALY
9 449
16 501
00
2 0004 0006 0008 000
10 00012 00014 00016 00018 000
liraglutide(1.2mg)
liraglutide(1.8mg)
sulfonylurea
Incremental cost-effectivenessratio per QALY gained
Cost-effectivenessratio per QALY (in £)

20
Part 2: Key messages
Part 2: How are medicines contributing to economic productivity and wealth creation in Europe ?
Demographic changes and higher longevity cause major health challenges for Europe. Workforce reduction and increasing dependency ratio put increased pressure on society’s healthcare financing but also increase the importance of keeping working age people healthy and productiveChronic diseases are already a major part of healthcare bill and, unmanaged, risks factors indicate it will keep rising Forecast show an acceleration in lost output due to illness; high income economies like Europe are the most exposed. Health-related disabilities increase sharply with age and across Europe there is an increase in reported disabilities For many diseases the real cost to the system is lost productivity and new medicines are making a differenceKeeping the population healthy and productive is a critical priority and medicines have and can continue to be part of the solution Reducing disability and sickness transfers, by improving outcomes, can further contribute to Europe’s ability to fund future investmentsMedicines offer an opportunity to reduce the cost of productivity loss and disability by improving workforce health

21
Part 2: wealth & productivity
Demographic changes and higher longevity cause major health challenges for Europe
Sources: *European Commission (2015). The Aging report. †Freddie Bray et al (2012). “Global cancer transition according to human index a population based study”. Lancet oncology. 13:8. Available at: http://www.thelancet.com/journals/lanonc/article/PIIS1470-2045(12)70211-5/abstract
Demographic development in the EU-28* Projected increase of cancer in the world†
16% 16% 15% 15% 15% 15% 15% 15% 15% 15%
66% 64% 63% 61% 60% 58% 57% 57% 57% 57%
18% 21% 22% 24% 26% 27% 28% 28% 28% 28%
0%
10%
20%
30%
40%
50%
60%
70%
80%
90%
100%
0-14 15-64 65 and over
+56%
12,7
22,2
0
5
10
15
20
25
2008 2030
Incidence of cancer in the world (million) †
+75%

22
Part 2: wealth & productivity
Workforce reduction and increasing dependency ratio put increased pressure on society’s healthcare financing and increases the need to keep working age people healthy
Source: The European Commission (2015). The aging report.
Social impact: decline in workforce due to demographic changes (mn people)*
Ratio of workers to pensioners will decrease
335
328323
317
311306
302299 297 296
270
280
290
300
310
320
330
340
2013 2020 2025 2030 2035 2040 2045 2050 2055 2060
-12%+75%
4 workers / 1 pensioner
2 workers / 1 pensioner
2013 2060
-50%

23
Part 2: wealth & productivity
Chronic diseases are already a major part of the healthcare bill and, unmanaged, risk factors indicate it will keep rising
Source: * The Economist Intelligence Unit (2012); † World Health Organisation database on obesity (accessed in April 2015); ∆ Population Reference Bureau website (accessed in April 2015); ♯ European Commission (2015) , the Aging report.
Impact of chronic diseases on distribution of healthcare bill*
Development of risk factors (obesity, urbanisation, aging)
~75% of Europe’s healthcare bill is spent on chronic diseases amounting to €700 bn*.
Chronic diseases like heart disease, diabetes, lung disease, and Alzheimer's Disease are overwhelming healthcare with soaring annual costs.
25%
75%
other chronic diseases
Increased Adult Obesity†
25% 21%12%
27% 23%13%
0%
10%
20%
30%
America Europe Global
% of population
Increased UrbanisationRates∆
Urbanisation rate (%)
51%72% 78%
0%20%40%60%80%
1950 2007 2030
+8%
Aging♯
(65+ years)
Population (mn)
93 105 125 141 148 1480
100
200
2013 2020 2030 2040 2050 2060

24
Part 2: wealth & productivity
Forecasts show an acceleration in lost output due to illness; high income economies like Europe are the most exposed
Note: NCD = Non-communicable Diseases; Analysis based on EPIC modelSource: * World Economic Forum /Harvard School of Public Health (2011); † Eurostat: various databases (accessed 2015); A.T. Kearney analysis
Projected non communicable disease cost, 2011-2030*
Share of Disability Life Years and Healthy Life Years in Europe†
0
5
10
15
20
25
30
2011
2012
2013
2014
2015
2016
2017
2018
2019
2020
2021
2022
2023
2024
2025
2026
2027
2028
2029
2030
High income Upper-middle income
Lower-middle income Low income
Lost output, trillions (2010 US$)
77.883.3

25
Part 2: wealth & productivity
Health-related disability increases sharply with age and across Europe there is an increase in reported disabilities
Source: *Harbers MM & Achterberg PW, Europeans of retirement age: chronic diseases and economic activity (2012); † OECD: Sickness, Disability and Work (2010)
Percentage of people reporting a long-standing illness or health problem (2010)*
Increase in reported disability, EU27†
1013
19
29
43
54
1115
21
32
44
56
0
10
20
30
40
50
60
16-24 25-34 35-44 45-54 55-64 65-74
Men Women
Population (in %)
year
% reporting long-term restrictions in daily activities
23.7%
25.1%
20,0
20,5
21,0
21,5
22,0
22,5
23,0
23,5
24,0
24,5
25,0
25,5
2005 2011
+6%

26
Part 2: wealth & productivity
With an ageing population living with disabilities focus needs to shift from preventing mortality to improving quality of life and function
Source: Lancet: Healthy life expectancy for 187 countries, 1990–2010 (2010); A.T. Kearney analysis
Male Disability Life Years as a % of total life expectancy in 1990 and 2010
In all 27 EU countries, disability life years as % of life expectancy has increased in the period 1990 – 2010.
In future the old-age dependency ratio and the impact of chronic diseases on disability could result in additional increases with productivity losses and increases in incapacity benefits as a result.
14,1%12,6%
13,2%12,6%
13,0%12,6%
12,9%13,1%
12,6%13,0%
12,5%12,5%
12,7%12,2%
12,7%12,4%
12,8%12,6%12,6%
12,5%12,7%
12,7%11,9%
11,7%12,3%
11,9%11,6%
1,3%1,7%
0,9%1,2%
0,7%1,1%
0,7%0,4%
0,9%0,5%
1,0%0,9%
0,8%1,2%
0,6%0,8%
0,3%0,4%
0,4%0,4%
0,1%0,1%
0,8%0,9%
0,1%0,4%
0,6%
11% 12% 13% 14% 15% 16%
FinlandLuxembourg
SwedenAustria
UKDenmark
FranceCyprus
NetherlandsMalta
SloveniaItaly
GermanyIreland
BelgiumHungary
GreecePortugal
LatviaPoland
SlovakiaLithuania
Czech RepublicEstonia
RomaniaBulgaria
Spain 1990 2010
Disability life years in % of total life expectancy
12.2%12.3%
12.4%12.6%
12.8%12.8%
12.8%12.9%12.9%
13.0%13.1%
13.2%13.3%
13.4%13.4%13.4%13.4%
13.5%13.5%13.5%
13.7%13.8%13.8%
13.5%
14.1%14.2%
15.4%
27
Part 2: wealth & productivity
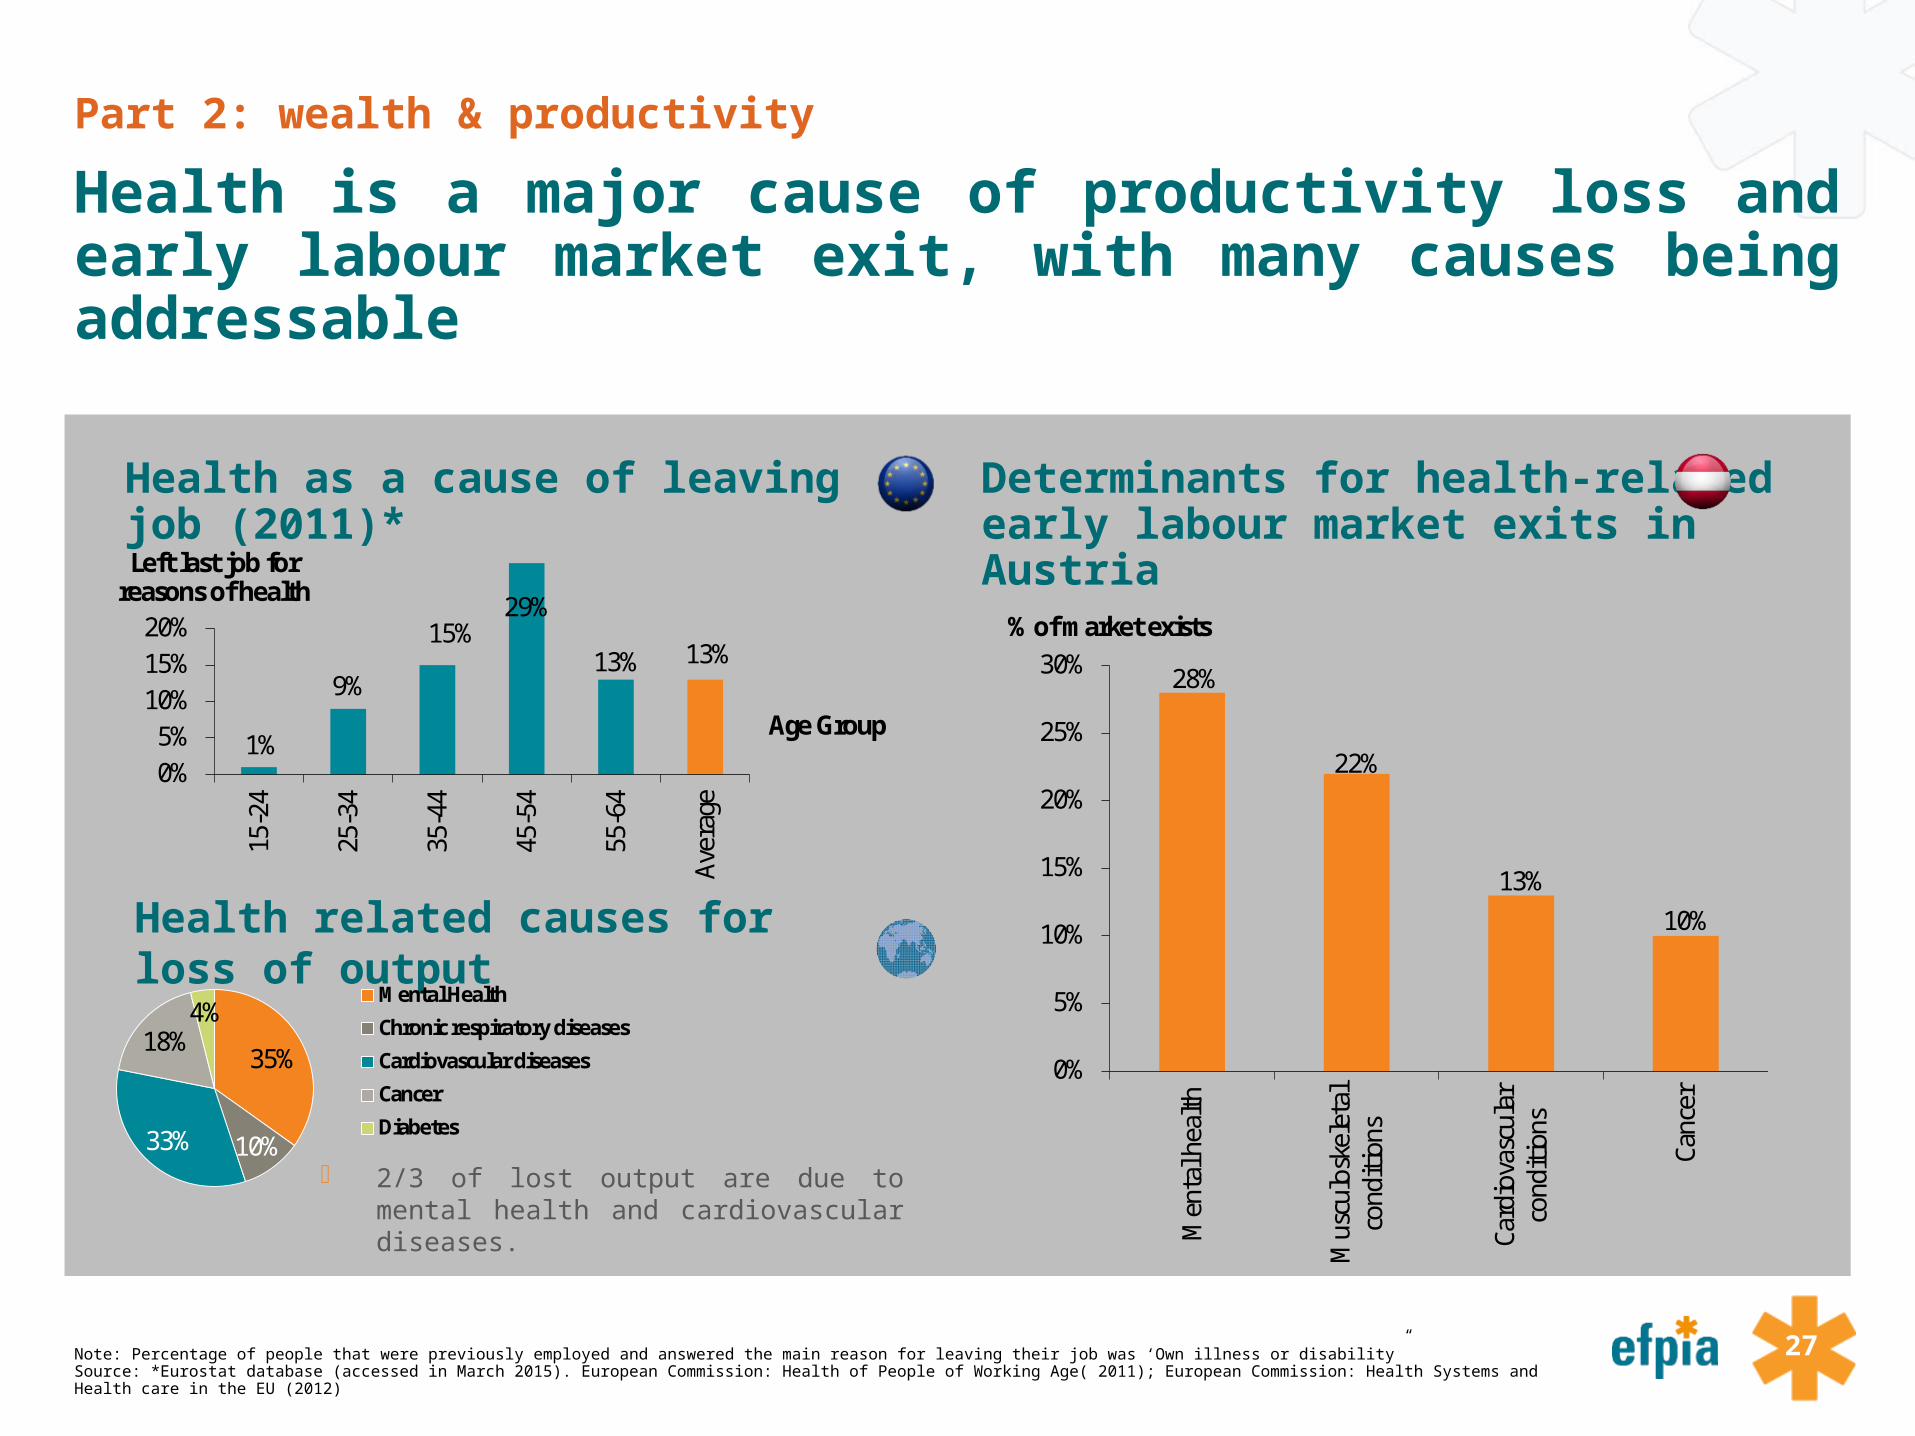
Health is a major cause of productivity loss and early labour market exit, with many causes being addressable
Note: Percentage of people that were previously employed and answered the main reason for leaving their job was ‘Own illness or disability”Source: *Eurostat database (accessed in March 2015). European Commission: Health of People of Working Age( 2011); European Commission: Health Systems and Health care in the EU (2012)
Health as a cause of leaving job (2011)* Determinants for health-related early labour market exits in Austria
Health related causes for loss of output
2/3 of lost output are due to mental health and cardiovascular diseases.
Left last job forreasons of health
Age Group1%
9%
15%29%
13% 13%
0%5%
10%15%20%
15-2
4
25-3
4
35-4
4
45-5
4
55-6
4
Aver
age
35%
10%33%
18%4%
Mental Health
Chronic respiratory diseases
Cardiovascular diseases
Cancer
Diabetes
28%
22%
13%10%
0%
5%
10%
15%
20%
25%
30%
Men
tal h
ealth
Mus
culo
skel
etal
cond
ition
s
Card
iova
scul
arco
nditi
ons
Canc
er
% of market exists
28
Part 2: wealth & productivity
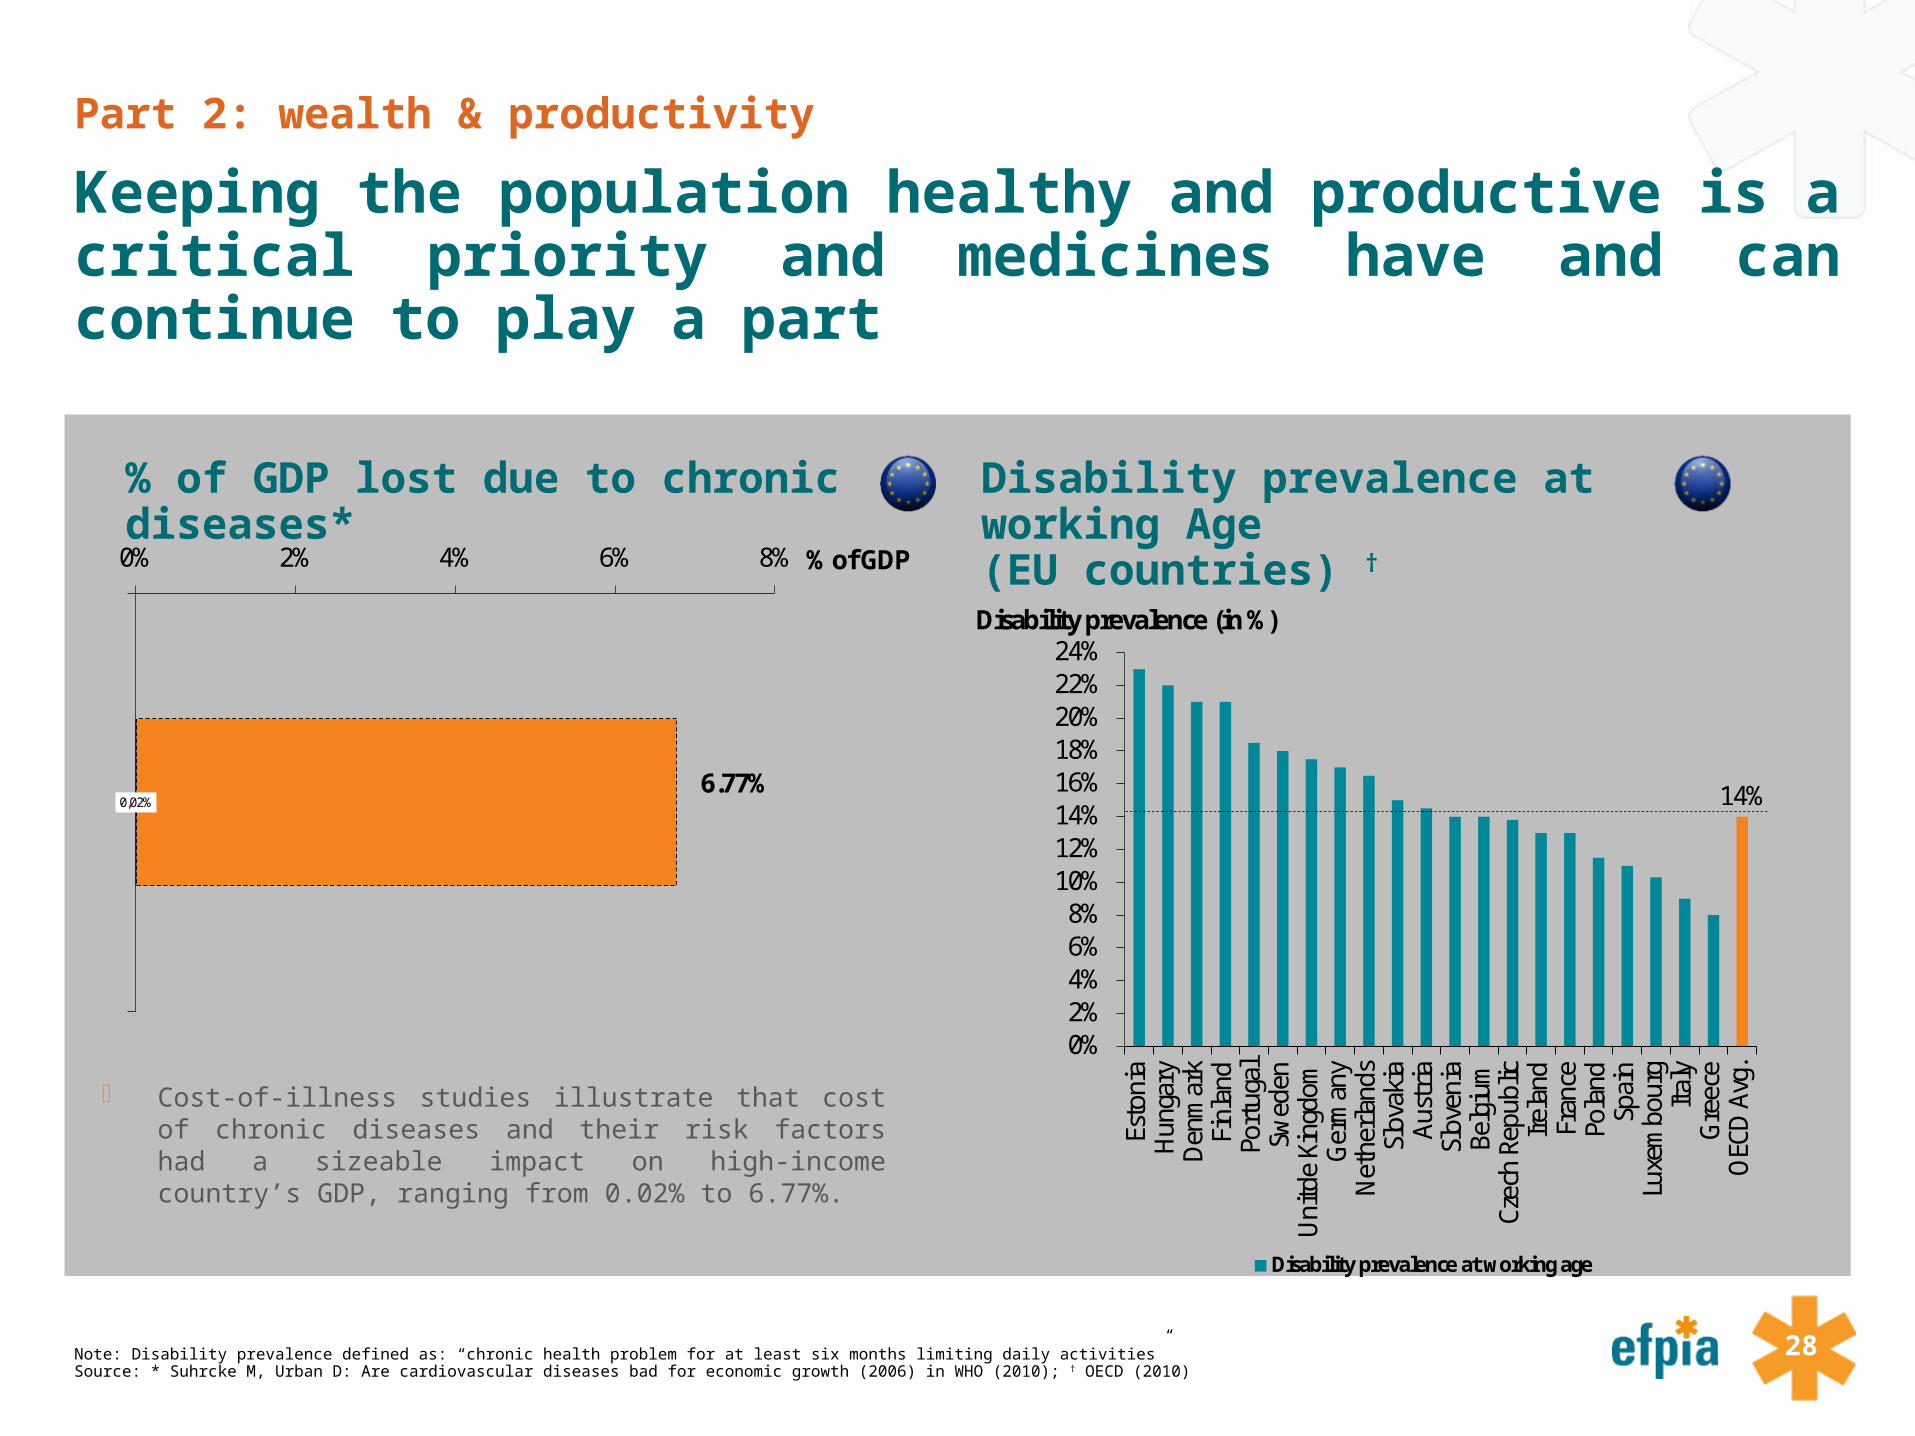
Keeping the population healthy and productive is a critical priority and medicines have and can continue to play a part
Note: Disability prevalence defined as: “chronic health problem for at least six months limiting daily activities”Source: * Suhrcke M, Urban D: Are cardiovascular diseases bad for economic growth (2006) in WHO (2010); † OECD (2010)
% of GDP lost due to chronic diseases* Disability prevalence at working Age(EU countries) †
Cost-of-illness studies illustrate that cost of chronic diseases and their risk factors had a sizeable impact on high-income country’s GDP, ranging from 0.02% to 6.77%.
0,02%
0% 2% 4% 6% 8% % of GDP
6.77% 14%
0%2%4%6%8%
10%12%14%16%18%20%22%24%
Esto
nia
Hun
gary
Den
mar
kFi
nlan
dPo
rtug
alSw
eden
Uni
tde
King
dom
Ger
man
yN
ethe
rland
sSl
ovak
iaAu
stria
Slov
enia
Belg
ium
Czec
h Re
publ
icIre
land
Fran
cePo
land
Spai
nLu
xem
bour
gIta
lyG
reec
eO
ECD
Avg
.
Disability prevalence at working age
Disability prevalence (in %)
29
Part 2: wealth & productivity
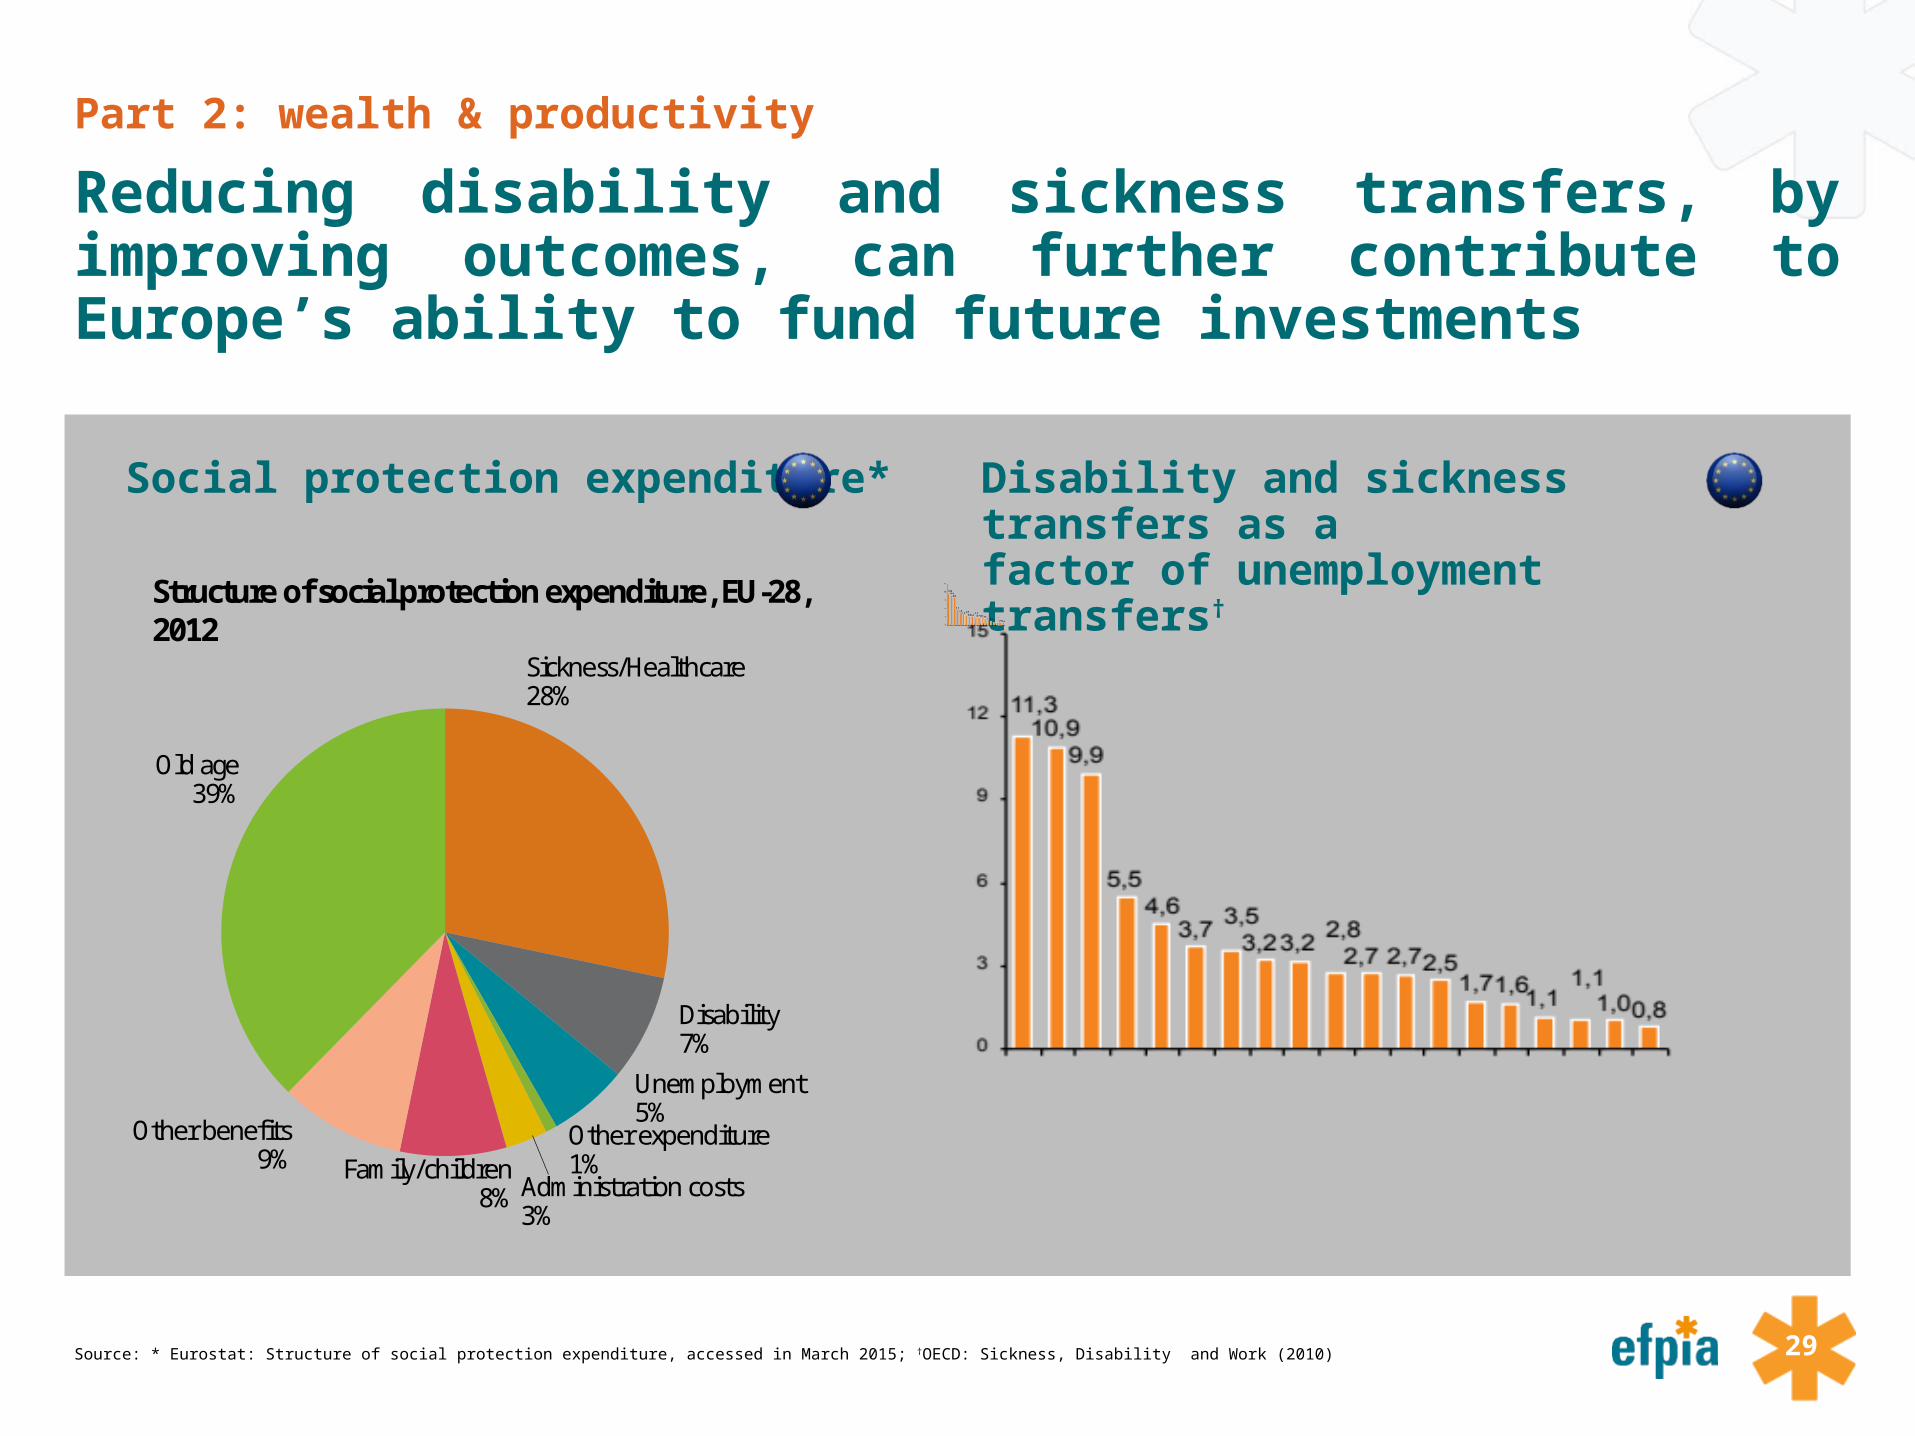
Reducing disability and sickness transfers, by improving outcomes, can further contribute to Europe’s ability to fund future investments
Source: * Eurostat: Structure of social protection expenditure, accessed in March 2015; †OECD: Sickness, Disability and Work (2010)
Social protection expenditure* Disability and sickness transfers as a factor of unemployment transfers†
Old age39%
Other benefits9% Family/children
8% Administration costs3%
Other expenditure1%
Unemployment5%
Disability7%
Sickness/Healthcare28%
Structure of social protection expenditure, EU-28, 2012
30
Part 2: wealth & productivity
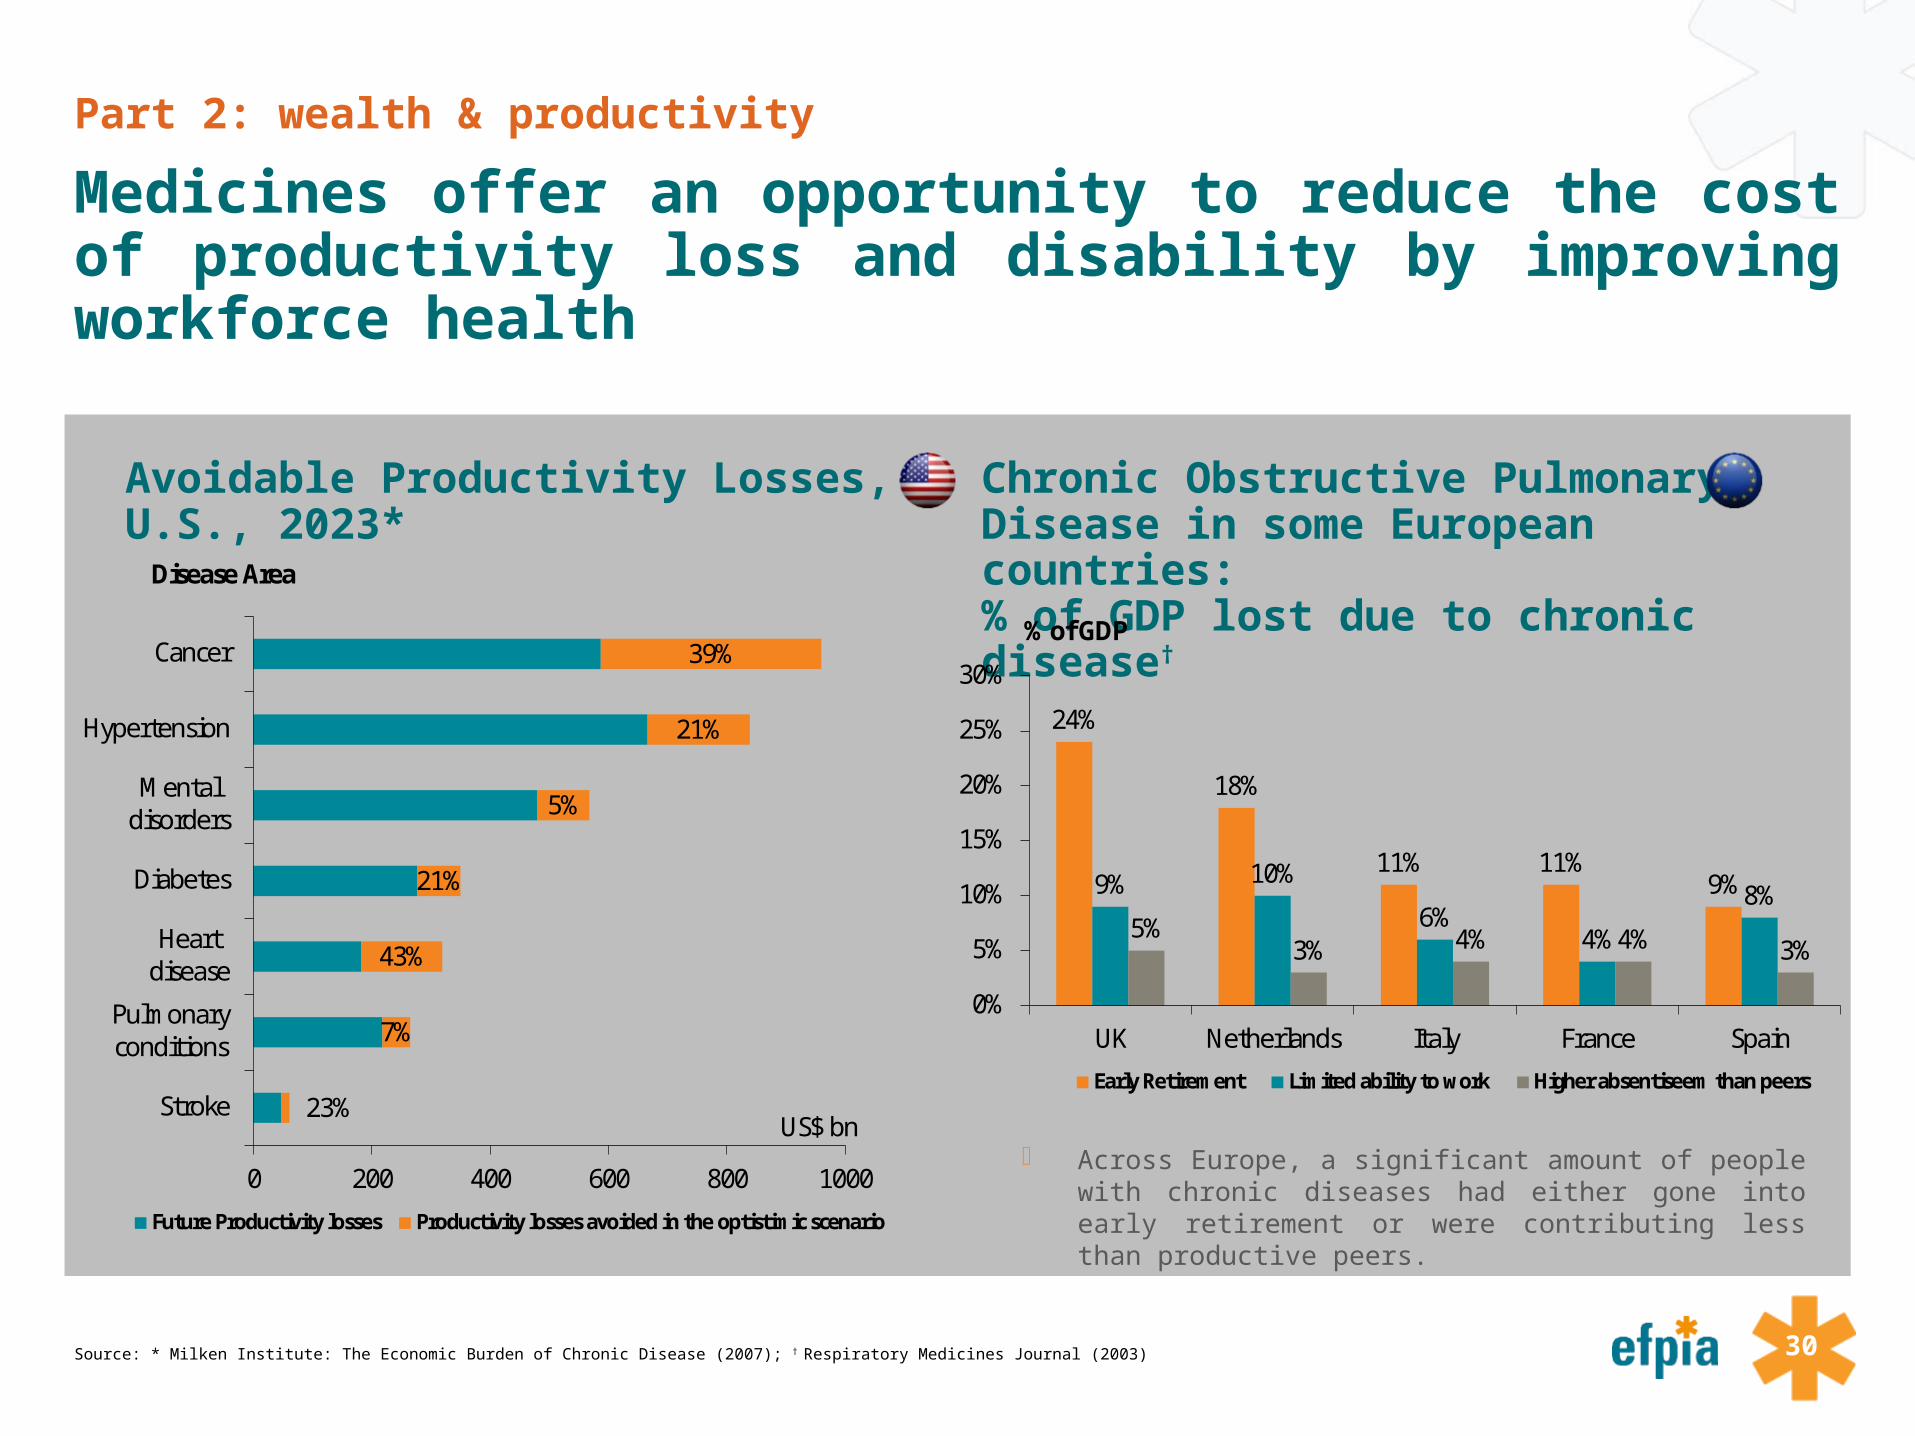
Medicines offer an opportunity to reduce the cost of productivity loss and disability by improving workforce health
Source: * Milken Institute: The Economic Burden of Chronic Disease (2007); † Respiratory Medicines Journal (2003)
Avoidable Productivity Losses, U.S., 2023* Chronic Obstructive Pulmonary Disease in some European countries: % of GDP lost due to chronic disease†
Across Europe, a significant amount of people with chronic diseases had either gone into early retirement or were contributing less than productive peers.
23%
7%
43%
21%
5%
21%
39%
0 200 400 600 800 1000
Stroke
Pulmonaryconditions
Heartdisease
Diabetes
Mentaldisorders
Hypertension
Cancer
Future Productivity losses Productivity losses avoided in the optistimic scenario
Disease Area
US$ bn
24%
18%
11% 11%9%9% 10%
6%4%
8%5%
3% 4% 4% 3%
0%
5%
10%
15%
20%
25%
30%
UK Netherlands Italy France Spain
Early Retirement Limited ability to work Higher absentiseem than peers
% of GDP

31
SourcesHealth & Wealth
Blonde, L. et al (2002)Frequency of blood glucose monitoring in relation to glycemic control in patients with type 2 diabetesDiabetes Care 2002; 25: 245-246
Brookmeyer R. et al. (2007)Forecasting the Global burden of Alzheimer’s diseaseJohns Hopkins University, Dept. of Biostatistics Working Papers. Paper 130. 2007
Business Insight database Accessed via Lifescience analytics (2012)
Website on diabeteshttp://www.changingdiabetesbarometer.com (accessed in September 2015)
Catalá-López, F. et al. (2010)Does the development of new medicinal products in the European Union address global and regional health concerns?Population Health Metrics 2010, 8:34 al
1/9

32
SourcesHealth & Wealth
David, MJ. (2012)Cost utility analysis of liraglucide
DiBonaventura et al, (2010).Multinational Internet-based survey of patient preference for newer oral or injectable Type 2 diabetes medication. Patient Preference and adherence, 4: 397-406.
Economist Intelligence Unit website http://www.eiu.com/home.aspx (accessed in 2012)
European Commission (2011)Health of people of working age - Full Report. (2011)European Commission Directorate General for Health and Consumers. Luxembourg. ISBN 978-92-79-18526-7
European CommissionHealth Systems and Healthcare in the European UnionPresentation by Paola Testori Coggi, Director General for Health and Consumers
2/9

33
SourcesHealth & Wealth
European Commission (2010)Projecting future healthcare expenditure at European levelEconomic Papers 417 / July 2010
European Commission (2015)The 2015 Aging Report: Underlying Assumptions and Projected MethodologiesEuropean Economy 8/2014
European Commission (2015)The 2015 Ageing Report: European Economy 3|2015. Economic and Financial Affairs. Economic and budgetary projections for the 28 EU Member States (2013-2060).
European Commission (2011)The situation of working-age people with disabilities across the EUResearch Note 5/11
European Medicines Agency Database on EMA Medicines Approvals
3/9

34
SourcesHealth & Wealth
EurostatDatabase on structure of social protection expenditurehttp://epp.eurostat.ec.europa.eu/statistics_explained/index.php?title=File:Structure_of_social_protection_expenditure,_EU-27,_2009_(1)_(%25).png&filetimestamp=20130102113739 (accessed April 2013)
Garber, A. et al (2009)Liraglucide versus glimepiride monotherapy
Harbers, MM & Achterberg, PW (2012)Europeans of retirement age: chronic diseases and economic activity http://ec.europa.eu/health/major_chronic_diseases/docs/rivm_report_retirement_en.pdf (consulted in July 2015)
IMS Health MIDAS database
Kobelt, G. Kasteng, F. (2009)Access to innovative treatments in multiple sclerosis in EuropeEFPIA 2009
4/9

35
SourcesHealth & Wealth
Salomon, J.A et al. (2012)Healthy life expectancy for 187 countries, 1990–2010: a systematic analysis for the Global Burden Disease Study 2010 in the Lancet, vol. 380, n°39859.
Lee, W, et al (2006)Medication adherence and the associated health-economic impact among patients with type 2 diabetes mellitus converting to insulin pen therapy: an analysis of third-party managed careClinical Therapy 2006;28(10):1712–25; discussion 1710–11
Lichtenberg, F. (2012)Pharmaceutical Innovation and Longevity Growth in 30 Developing and High-income Countries, 2000-2009NBER Working Papers 18235, National Bureau of Economic Research, Inc. (2012)
Milken Institute (2007)An Unhealthy America: The Economic Burden of Chronic Disease2007
National Cancer Institute website Accessed in August 2015
5/9

36
SourcesHealth & Wealth
National Social Marketing Centre (2006)Key Health and Lifestyle Areas – Current rates and past trendsNSCM Report 12 – 2006
OECD (2010)Report on sickness and disability at work.
PhRMA (2014) 25 years of Progress against Hepatitis C: Setbacks and Stepping Stones
PhRMA (2015) 2015 profile
PhRMA (2015) Chart Pack: Biopharmaceuticals in perceptive, spring 2015.
Population Reference Bureau Article on urbanisation rateshttp://www.prb.org/Publications/Articles/2007/623Urbanization.aspx (accessed in April 2015)
Peyrot, M, et al (2005)Psychosocial problems and barriers to improved diabetes management: results of the Cross-National Diabetes Attitudes, Wishes and Needs (DAWN) StudyDiabetes Medicines, 22 (2005), pp. 1379 – 1385
6/9

37
SourcesHealth & Wealth
Selam, J, (2010)Evolution of Diabetes Delivery DevicesJournal of Diabetes Science and Technology. Volume 4, Issue 3, May 2010
Peyrot, M, et al (2005)Psychosocial problems and barriers to improved diabetes management: results of the Cross-National Diabetes Attitudes, Wishes and Needs (DAWN) StudyDiabetes Medicines, 22 (2005), pp. 1379 – 1385
Selam, J, (2010)Evolution of Diabetes Delivery DevicesJournal of Diabetes Science and Technology. Volume 4, Issue 3, May 2010
Smith, B. (2011)The Future of PharmaGower Publishing Limited (2011)
Suhrcke M., Urban, D. (2006)Are Cardiovascular diseases bad for economic growth?CESifo Working Paper No. 1845
7/9

38
SourcesHealth & Wealth
The Economist Intelligence Unit (2012)Never too early: Tackling chronic disease to extend healthy life years (2012)
Twelves, C. et al. (2006)A randomized cross-over trial comparing patient preference for oral capecitabine and 5-fluorouracil/leucovorin regimens in patients with advanced colorectal cancerAnnals of Oncology 17: 239–245, 2006
UK Department of Health (2010)Equity Audit of Diabetes Services in Lothian – 2010
United Nations, Database on life expectancy https://data.un.org/Search.aspx?q=life+expectancy (accessed in April 2015)
United Nations, Department of Economic and Social Affairs (2012)World Population Prospects – The 2012 Revision (2014)Accessed via the United Nations database on life expectancy at birth (April 2015)
8/9
39
SourcesHealth & Wealth
Vicenze, G. et al. (2004)Factors associated with adherence to self-monitoring of blood glucose among persons with diabetesDiabetes Educator 2004; 30 (1) 112 – 15
World Economic Forum (2011)The Global Economic Burden of Non-communicable DiseasesSeptember 2011
World Heath Organisation (2015)Database on obsesity (accessed in April 2015)
9/9

EFPIA Brussels Office
Leopold Plaza Building * Rue du Trône 108
B-1050 Brussels * Belgium
Tel: + 32 (0)2 626 25 55
www.efpia.eu * [email protected]