Final Thesis Virva Anttila v.2 - Theseus
52
CARBON FOOTPRINT OF HUMANITARIAN LOGISTICS Case: The Finnish Red Cross Virva Anttila Bachelor’s Thesis November 2011 Degree Programme in International Business Tampereen ammattikorkeakoulu Tampere University of Applied Sciences
Transcript of Final Thesis Virva Anttila v.2 - Theseus
CARBON FOOTPRINT OF
HUMANITARIAN LOGISTICS
Case: The Finnish Red Cross
Virva Anttila
Bachelor’s Thesis November 2011 Degree Programme in International Business Tampereen ammattikorkeakoulu Tampere University of Applied Sciences

2
INTERNATIONAL BUSINESS Bachelor’s thesis Author: Virva Anttila Degree programme: International Business Title of thesis: Carbon footprint of humanitarian l ogistics: Case the Finnish Red Cross Year of completion: 2011 Supervisor: Anasse Bouhlal Number of pages: 37 Number of appendix pages: 15
ABSTRACT
This thesis was written on the basis that despite all studies and analyses companies,
governments and industries have about pollution and carbon footprint voluntary organi-
zations have very little information about that. This will serve as background informa-
tion for the Finnish Red Cross for the procurement operations. Although many relief
item deliveries to areas suffered from natural disasters are very urgent, certain factors
allow planners to take environmental impact and carbon emissions into account.
The Finnish Red Cross has its logistics centre in Tampere, from where all logistics op-
erations are organized. Majority of the products never come to Finland as they are pro-
cured internationally from where they are directly transported to the destination. This
thesis proves that relief items purchased as close to the destination and are transported
by truck or train produce significantly less emissions than items purchased from distant
countries and are transported by plane. This decision can significantly reduce carbon
emissions and the products should be procured locally and transported by train or ship
when and wherever possible.
Key words: Pollution, carbon dioxide, the Red Cross, humanitarian logistics, green lo-
gistics, carbon footprint
3
TABLE OF CONTENTS
1. Introduction.................................................................................................................5
1.2. Background ............................................................................................................5
1.3. Research methods...................................................................................................7
1.5. Limitations of the research.....................................................................................8
2. The Red Cross ...........................................................................................................10
2.1. The Red Cross and Red Crescent movement.......................................................10
2.2. The International Federation of Red Cross and Red Crescent Societies .............10
2.2.1. History...........................................................................................................10
2.1.2. Vision and mission........................................................................................11
2.1.3. Organization..................................................................................................11
2.1.4. Logistics in IFRC ..........................................................................................12
2.2. The Finnish Red Cross.........................................................................................12
2.2.1. General information ......................................................................................12
2.2.2. Logistics operations ......................................................................................13
3. Logistics......................................................................................................................15
3.1. Logistics and supply chain management .............................................................15
3.2. Humanitarian logistics .........................................................................................16
3.2.1. Continuous aid work and disaster relief........................................................16
3.2.2. Humanitarian logistics versus business logistics ..........................................17
3.3. Pollution and the carbon footprint........................................................................19
3.4. Green logistics......................................................................................................20
4. Logistics capacity assessments .................................................................................21
4.1. Kenya ...................................................................................................................21
4.2. Tajikistan..............................................................................................................22
4.3. Pakistan ................................................................................................................23
4.4. Zimbabwe.............................................................................................................24
4.5. Haiti......................................................................................................................26
5. Case studies................................................................................................................27
5.1. Emergency background........................................................................................27
5.1.1. Kenya ............................................................................................................27
5.1.2. Tajikistan.......................................................................................................27
5.1.3. Pakistan .........................................................................................................27
5.1.4. Zimbabwe......................................................................................................28
5.1.5. Haiti...............................................................................................................28
6.1. Transported items and emissions .........................................................................29
6.1.1. Kenya ............................................................................................................29
4
6.1.2. Tajikistan.......................................................................................................29
6.1.3. Pakistan .........................................................................................................30
6.1.4. Zimbabwe......................................................................................................30
6.1.5. Haiti...............................................................................................................31
7. Analysis ......................................................................................................................31
7.2. Conclusions..........................................................................................................31
7.3. Recommendations................................................................................................33
8. References:.................................................................................................................35
8.1. Literature ..............................................................................................................35
8.2. Articles and presentations ....................................................................................35
8.3.Websites ................................................................................................................35
9. Appendices.................................................................................................................38
9. 1. Tables acquired from Kirsi Pohjola, the Finnish Red Cross...............................38
9.2. Emission calculation tables..................................................................................39
9.3. Comments from Kirsi Pohjola, the Finnish Red Cross........................................52

5
1. Introduction
1.2. Background
Nowadays, carbon emissions have become a widely known issue among people. Ac-
cording to a survey carried out by Deutsche Post DHL in 2009, the greenhouse effect
was considered one of the major issues in the world, among such threats as terrorism
and economic insecurity. The fact if the global warming is actually caused by people or
is it just an inevitable phenomenon remains under controversy, at least to some extent.
For instance in the United States some representatives of the new Republican branch,
the Tea Party, deny the existence of global warming (The Guardian, 2011). However,
many countries, industries and private citizens share their concern and try to reduce
their “carbon footprint” in order to secure this world as we know it also for future gen-
erations.
According to the International Panel on Climate Change (2007), the logistics industry is
a major source of CO2 emissions. According to the same source, the industry accounts
for approximately 13% of global greenhouse gases. However, this figure includes the
passenger transportation in which this thesis will not focus on.
Many transportation and logistics companies such as TNT, DHL, and Finnair already
have a wide range of different research papers and reports on their carbon footprint and
they all share a concern regarding the emissions from their operations. They are spend-
ing time and effort to do research on how they can operate in a more sustainable man-
ner. This does not only include the environmental aspect but they also talk about social
responsibility and the well being of their staff. Companies call this “corporate responsi-
bility”. For example, as Mr. Vesa-Matti Jussila from TNT Finland states (2011), TNT
has calculated and gathered information concerning carbon emissions. 50 % of their
emissions are derived from truck transport, 40% from airplanes and 10% of buildings.
As TNT has 30 000 trucks and 50 airplanes, it is evident that a proportional amount of
emissions of airplanes is significantly higher. As an example, an average TNT airplane
consumes 8000 kilograms kerosene per hour thus creating 3 kilograms carbon emission
under the same time period.
6
In order to reduce the emissions, TNT has gathered and applied different strategies. For
instance, they have a target of having more and more electric trucks to transport road
freight and they try to optimize flight routes so that the routes are as short as possible
and that the waiting time before landing is minimized. Also refilling the tank of an air-
craft will occur more often. As the tank is not full at all times, it will reduce the total
weight of the aircraft thus reducing emissions.
According to various websites and reports of different humanitarian organizations, their
reports and publications about their supply chain models or logistics operations do not
include any big emission reduction projects. Mainly organizations in the field of hu-
manitarian logistics focus on the respond times to emergencies and how efficiently they
can run their operations. Since their operations are mostly reactive and respond to emer-
gencies and other disasters in order to save human lives, respond times are the most
critical factor when planning the operational functions. However, not all the situations
are the same. Different humanitarian organizations take part into development projects,
such as long-term disaster reduction, livelihood and health related programmes.
In addition, not all emergency situations require the same respond times. For example,
there are slow onset disaster types such as draught and rapid onset disaster types such as
earthquakes. This is why there are five different case studies in this thesis. They repre-
sent different urgency levels and so they all have different opportunities to plan more
environmentally friendly logistics operations to destinations. It is obvious, that a sudden
disaster, such as the earthquake in Haiti, needs faster reactions than long-term develop-
ment projects. However, there are a few aspects that define the urgency level for the
operation more accurately: the nature of the disaster, the number of people in need of
disaster relief and, in case of the International Federation of Red Cross and Red Cres-
cent Societies, the capacity of the local National Red Cross or Red Crescent Society. In
addition, the coordination by the Finnish Red Cross of the deliveries also plays an im-
portant role so that the correct amount of goods is delivered, and the staff working on
the project has sufficient skills and expertise. Also one factor that affects the carbon
footprint is the fact if the supplies are available locally or if they need to be transported
from different countries.
7
1.2. Objectives
The objective is to gather and provide information to the Finnish Red Cross about the
carbon dioxide emissions of different types of transport modes and also to demonstrate
how different types of procurement processes cause different amount of CO2 emissions.
For example, when the relief items are purchased locally, internationally or if they are
transported from the warehouse of the Finnish Red Cross have different procurement
processes and environmental impact
The calculations only take into consideration the transport of the finished products from
the point of purchase to the point of consumption.
1.3. Research methods
The case studies included in this thesis are the following:
Monsoon floods in Pakistan in 2010
Earthquake in Haiti in 2010
Floods in Kenya in 2010
Food security project between the Finnish Red Cross and Zimbabwe Red Cross Na-
tional Society
Long term project including 2nd hand clothing deliveries from the Finnish Red Cross to
Tajikistan Red Crescent Society
Each case study consists of the following elements: Logistics capacity assessment pre-
sents the country focusing on the infrastructure, transportation network and geographi-
cal facts. The emergency or disaster background information is derived from actual
emergency appeal that is the project plan published by International Federation of the
Red Cross and according to it the Red Cross National Societies are contributing and
supporting the operation by cash, material assistance or staffing. Tables present the
amount of goods, routes and the modes of transport of the deliveries of each operation
with the support of the Finnish Red Cross.
8
As a research method for emission calculations, I used the emission calculator called
EcoTransIT. EcoTransIT, or Ecological Transport Information Tool Worldwide, de-
scribes itself as “an easy to handle web based software tool for assessing the environ-
mental impact of transporting freight by various transport modes worldwide” (Ecotran-
sit, 2010). It is free and available to everyone. Partners who established and maintain
this tool are, among others, Trenitalia S.p.A., Renfe, GreenCargo AB and DB
Schencker Rail GmbH.
According to Ecotransit.org, there are various impacts on environment the traffic can
cause, such as consumption of resources, land use, greenhouse effect, depletion of the
ozone layer, acidification toxic effects on ecosystems and on human beings, summer
smog and noise. The EcoTransIT calculator takes the air quality issues into considera-
tion and compares the energy consumption and emissions of all freight transported by
rail, road, aircraft and ship. Primary energy consumption takes into account the direct
energy consumption by the vehicle and the processes involved in generating and dis-
tributing of the final product. The calculator also takes into account the distance and the
comparison between routes. The calculator considers the route change and calculates the
emissions also according to the correct distance. I calculated the emissions for each de-
livery transported to the destination.
1.5. Limitations of the research
The Finnish Red Cross has only limited information available about the exact types of
the vehicles used for transport. The locations and routes for deliveries do not include the
information about the exact address of the storages and warehouses as the goods are
procured up to the destination and the supplier is responsible to arrange the transporta-
tion to the final point of consumption.
As a consequence, the calculations are approximate and only provide a rough picture of
the consumption and pollution levels the different modes cause. EcoTransIT gives the
opportunity for an accurate emission calculation by defining the load factor, empty trip
factor, the vehicle type and the emission standard. However, these facts are not avail-
able for the cases presented in this thesis. As a rule of thumb, the container type used for

9
most transports organized by the Finnish Red Cross is the 40 ft container. Those con-
tainers are used both for multi-modal transports and many times for intercontinental
transports for example in Kenya and Pakistan from warehouse to warehouse, but not to
the final point of consumption.
As the purpose if this study is not to calculate the accurate emissions caused by previous
operations, the accurate calculations are not necessary to achieve this target. The target
is to provide background information about emission levels of different types of trans-
port modes and also to compare the emission levels of different types of operations. The
types of operations I refer to are the procurement processes; whether the supplies are
shipped from the warehouse of the Finnish Red Cross, if they are shipped from local
supplier or other countries.
We can still take a better look at some of the factors that affect the total emissions and
energy consumption caused by transport. First of all, geography has a significant impact
on the total energy consumption of a vehicle (Ecotransit, 2011). It goes without saying
that the steeper the uphill is on the way, the more the vehicle will consume energy.
When it comes to rail transport, the method to produce electricity is a very significant
factor. For example, in Sweden GreenCargo’s source of energy is hydropower (Ecotran-
sit, 2010). The transportation network also has restrictions, as the road network is often
denser than the rail. As such, the route by rail might be longer than by truck and thus
increasing the comparative emission level from trains.
Other factors are the vehicle type, the age, the type of tires used and the loading capac-
ity. If the maximum level of capacity is reached in the vehicle, the load factor is 100%
thus taking the full advantage of the vehicle. Vehicle type indicates to the size, model
and even to the emission standard that are all essential facts when calculating accurate
emission level of a particular transport mode.
Since conflicts and war situations require strict objectivity and neutrality from humani-
tarian organizations, and these operations are planned in a different manner, they are
excluded from this thesis. In addition, the emissions calculations only include the trans-
portation of the finished goods, not the emissions occurred during the production or
manufacturing of the goods, nor the waste management in the destination.

10
2. The Red Cross
2.1. The Red Cross and Red Crescent movement
The Red Cross is one of the best-known humanitarian organizations in the world (The
Red Cross, 2010). The origin goes back to Northern Italy in 1859, where a Swiss man,
Henry Dunant organized volunteers to help the victims of the battle of Solferino. In
1862, the International Committee of Red Cross (ICRC) was established in Geneva
where it still has its headquarters. From there operate the essential branches for the in-
ternational aid (The Red Cross, 2010).
The Red Cross and the Red Crescent movement operate globally and consists of inde-
pendent bodies that all share the common mission and principles. The movement con-
sists of the International Committee of the Red Cross (ICRC), the International Federa-
tion of Red Cross and Red Crescent Societies (IFRC), and 186 Red Cross and Red
Crescent Societies worldwide. ICRC is an independent organization working in war and
conflict zones. IFRC directs and coordinates international assistance for victims of natu-
ral disasters. The National Societies act as auxiliaries to the public authorities of their
own countries in the humanitarian field and provide a range of services including disas-
ter relief, health and social programmes. All parties of the movement have their own
individual status and mandate, and exercise no authority over the other.
2.2. The International Federation of Red Cross and Red Crescent Societies
2.2.1. History
The International Federation of Red Cross and Red Crescent Societies were founded in
1919 in Paris after the First World War (IFRC, 2010). After the war, there was a need
for the Red Cross Societies to work together. Henry Davidson, who was the president of
American Red Cross War Committee, suggested about establishing a federation of all
Red Cross Societies. The first objective of the IFRC was to improve the health of people
in countries that had suffered the most during the years of war. The founding countries
were Britain, France, Italy, Japan and the United States. Nowadays there are 186 recog-

11
nized Red Cross and Red Crescent National Societies in the world and the IFRC is the
biggest humanitarian organization in the world.
2.1.2. Vision and mission
IFRC provides assistance without discrimination towards nationality, religion, race,
class or political opinion (IFRC, 2010). The symbol of a red crescent is used in place of
the red cross of many Islamic countries. IFRC focuses on four areas in its work: promo-
tion of humanitarian values, disaster response, preparedness and community care.
Strategy 2020 is guiding the actions of the IFRC from the beginning of the year 2011
throughout the end of 2020. It defines the aims and actions for the IFRC and the mem-
ber National Societies in order to achieve the common vision: “To inspire, encourage,
facilitate and promote at all times all forms of humanitarian activities by National So-
cieties, with a view to preventing and alleviating human suffering, and thereby contrib-
uting to the maintenance and promotion of human dignity and peace in the world”
(IFRC, 2011).
The strategic aims are to save lives, protect livelihoods, strengthen recovery from disas-
ters and crises, enable healthy and safe living and promote social inclusion and a culture
of non-violence and peace (IFRC, 2011).
The enabling actions to achieve the strategic goals are to build strong National Socie-
ties, pursue humanitarian diplomacy to prevent and reduce vulnerability in a globalized
world and to function effectively as an International Federation (IFRC, 2011).
2.1.3. Organization
As any big organization, IFRC also has many departments and administrative levels.
IFRC consists of all the Red Cross and Red Crescent National Societies and the secre-
tariat. The secretariat, which is located in Geneva, is responsible for the daily operations
of the IFRC. It has been decentralized to the regions and there are seven zones globally
to support the work of the National Societies. All decisions and policies are made by the
governing bodies, from which the highest sector is the General Assembly (IFRC, 2010).
12
2.1.4. Logistics in IFRC
The IFRC has three logistics centers located in Panama, Dubai and Kuala Lumpur
(IFRC, 2010). The logistics centers are mandated to cover three different areas. The
base located in Panama covers the American continent and the one in Dubai covers
Europe, Africa and Central Asia. The one in Kuala Lumpur is for the Far East Asia,
Australia and Oceania. The objective for these centers is to deliver assistance and relief
to certain number of people in a certain amount of time. They are prepared to support
5000 families in 48 hours and 15 000 families in two weeks with such items as tents or
shelter tool kits, water canisters, blankets and kitchen utilities. It also provides stocking
and procurement and training services for National Societies (IFRC, 2010).
Picture 1: Location of the headquarters and three logistics centers of the IFRC.
Source: IFRC, 2011
2.2. The Finnish Red Cross
2.2.1. General information
The Finnish Red Cross was established in 1877 and is now one of the biggest humani-
tarian organizations in Finland (Finnish Red Cross, 2010). It operates both domestically
and internationally. Domestic projects and activities include first aid education, blood
donation service, and HIV and AIDS Support. Internationally the Finnish Red Cross
provides help and assistance in dozens of countries in cooperation with IFRC in natural
disaster situations and with ICRC in conflict areas. Finnish Red Cross also has several
bilateral long-term projects with other Red Cross and Red Crescent National Societies
worldwide. The actions on the Finnish Red Cross are based on the seven Fundamental

13
Principles of the International Red Cross and Red Crescent movement. They are human-
ity, impartiality, neutrality, independence, voluntary service, unity and universality. In
addition, the Finnish Red Cross also has three main goals in its own recommendations
and guidelines for the years 2011-2014 (The Finnish Red Cross, 2011). According to
those guidelines The Finnish Red Cross provides relief assistance in disasters and emer-
gencies, reinforces health and secure life, and supports humanity.
2.2.2. Logistics operations
The Finnish Red Cross provides international aid in three forms: goods, delegates and
money. The aid is delivered internationally and is focused on disaster relief as well as
on development programmes. The logistics center of the Finnish Red Cross is located in
Kalkku, Tampere and it is responsible of the procurement, warehousing, transport of
relief supplies, packing of the 2nd hand clothing, as well as developing and producing
Emergency Response Units (Finnish Red Cross, 2010). Area of the warehouse is 4000
m2 and there are always certain items to be deployed:
Two field hospitals
Four health clinics
Water and sanitation equipment
IT/Telecom Emergency Response Unit
Two Logistics Emergency Response Units
Two relief Emergency Response Units
The Finnish Red Cross is stocking also relief items to support 10 000 people, or ap-
proximately 2000 families. Therefore there are also blankets, clothes, medicine, mos-
quito nets, tents, tarpaulins or other necessary products available for shipping. The Fin-
nish Red Cross always works through the network of Red Cross movement in order to
guarantee the most efficient operation. Monetary transfers and consumption of goods
are in control of the Red Cross and usage in destination is supervised. The logistics cen-
ter employs currently approximately ten permanent workers and the personnel reserve
includes approximately 500 trained delegates with expertise on different fields.
14
The rules of procurement guarantee that all material is purchased effectively and the
process is transparent. The Finnish Red Cross is constantly developing and improving
its procurement functions in order to ensure effective and efficient procurement but still
flexible enough to be able to respond to urgent situations. Price of the product is not the
only criteria, but also quality and the fact that it is suitable for local circumstances. For
example, agricultural products and foodstuff is always purchased as close to the final
destination as possible and 90% of all procured items never come to Finland, as the ori-
gin is overseas. Usually the offers and procurements are made during a longer time pe-
riod, but sudden emergencies, such as earthquakes, require faster processes. For those
the Red Cross is using its emergency stock from Finland. The Red Cross has defined
standards for the most common products in order to guarantee the good quality and the
typical characteristic is to purchase goods in big quantities and few basic relief com-
modities for rapid onset operations.
Picture 2: Stock of Emergency Respond Units
Source: The Finnish Red Cross (2010)
The logistics center also stocks supplies for the National Emergency Supply Agency.
The Finnish Red Cross takes care of the procurement of those items so they are pur-
chased according to the standards of the Red Cross and can be used as international re-

15
lief items. In that case, The Finnish Red Cross asks for permit to use those items and the
procures replacement to be stocked.
Picture 3: Warehouse stock
Source: The Finnish Red Cross (2010)
3. Logistics
3.1. Logistics and supply chain management
Logistics itself is a very limited expression, as it is only one part of a bigger picture
called the supply chain management, or SCM (Hugos, 2003). As logistics mainly indi-
cates to transport of an item from one point to another, supply chain includes all aspects
related to logistics, such as inbound and outbound transportation management, fleet
management, warehousing, materials handling, order fulfillment, logistics network de-
sign, inventory management, supply and demand planning, management of third party
logistics service providers (CSCMP, 2011) quality, manufacturing, procurement, distri-
bution and sales. The Council of Supply Chain Management Professionals (2011) de-
fine logistics management as a “part of supply chain that plans, implements, and con-
trols the efficient, effective forwards and reverses flow and storage of goods, services
and related information between the point of origin and the point of consumption in
order to meet customer’s requirements”.

16
Other branches involved in today’s supply chain can include such functions as engineer-
ing, R&D, marketing, advertising, and sales representation, customer service, procure-
ment, packaging and assembly, production planning and scheduling. Logistics manage-
ment is involved in all levels of planning and execution, and it is an integrating func-
tion, which coordinates and optimizes all logistics activities, as well as integrates with
other functions in the whole supply chain (CSCMP, 2011). All kinds of logistics opera-
tions require an accurate and efficient coordination of all these functions. Basically, the
concept of supply chain management means the whole chain of the product from the
acquisition of the raw materials to the completed service or product delivered to the
final consumer.
According to Michael Hugos (2003) a concept of “JIT”, or just-in-time production is
nowadays closely linked with supply chain management. Manufacturers, vendors and
retailers all work towards the same goal; to meet their customer’s demands and to do
that in the minimum amount of time eliminating all wasteful efforts on the way.
One essential way how the concept of SCM has changed in recent years is the involve-
ment of what some people call the “information society” (Hugos, 2003). The Internet
and thus the constant connection between locations make on time data available to all
parties involved in the supply chain. This helps to plan and maintain efficient and cus-
tomer oriented operations and customer service. On-going reporting and effortless in-
formation flow are crucial for any kind of operations or enterprise in order to keep up
the competitive advantage. Despite the assistance and support the information technol-
ogy brings to the markets, the companies face some unprecedented challenges in the
markets (Haapanen & Vepsäläinen, 1999). The competition is harder and harder and
many enterprises need to be able to offer something value added to their customers.
3.2. Humanitarian logistics
3.2.1. Continuous aid work and disaster relief
Humanitarian logistics can be distinguished into these main categories; continuous aid
work and disaster relief (Kovacs & Spens, 2007). Usually, the term disaster relief covers
natural disasters and some man-made disasters such as terrorist attacks or nuclear at-
17
tacks. Generally, disaster relief includes three distinguished phases, which are the prepa-
ration phase, the immediate response phase and the reconstruction phase (Kovacs &
Spens, 2007). The first phase includes preparing to the possible disaster, such as having
an evacuation plan for possible volcano eruption in Iceland. As stated in the report writ-
ten by Kovacs and Spens (2007), most material about humanitarian logistics concentrate
on the first phase of preparedness often assuming particular scenarios and the fact that
there is only demand for particular goods. Reconstruction phase includes the rebuilding
and long-term recovery of the disaster.
3.2.2. Humanitarian logistics versus business logistics
There are a few key characteristics that are distinctive to humanitarian logistics as op-
posed to commercial operations (Tomasini & Wassenhove, 2009):
Non-profit operations
Equality and neutrality
Impartiality
Limited resources
Limited amount of skilled staff
Bias or restrictions
Donors
Unstable and unpredictable supply chain
First of all, and this of course goes without saying, humanitarian operations are non-
profit. The word “humanitarian” relates to the word “humanity” (Tomasini & Wassen-
hove, 2009), which implies to the idea that all humans are equal and anyone suffering
should always be helped. Equality is guaranteed by neutrality of the organizations,
which means that the help should be offered without any bias towards the people in
need. For example, in conflict zones the relief items or food commodities distributed by
the Red Cross do not have any markings implicating to donors or organizations. Impar-
tiality means that help should be offered first to the people most in need without any
discrimination. These operations also very often include cooperation of the local gov-
ernment or military (Oloruntoba & Gray, 2006). Sometimes governments can even hin-

18
der or prevent the aid deliveries. For example, the Russian customs has imposed restric-
tions to the development aid (Yle, 2011).
Humanitarian logistics projects also face very distinctive problems versus business lo-
gistics. Very often the resources are more limited with humanitarian projects. With hu-
man resources the challenge is to have sufficient personnel available with enough skills
and expertise (Tomasini & Wassenhove, 2009). Other problem is money as funds are
not always available when needed. Richard Oloruntoba (2006) states that according to a
survey many humanitarian organizations had people working in the field of logistics but
only few had actual specialization on that area. In addition, many people, organizations
and donors have different levels of commitment and there is a different amount of re-
sources to meet different amount of demand every time, which also creates uncertainty
(Tomasini and Wassehove, 2009).
One distinctive difference is the fact that one actor in a humanitarian logistics is the
donor. As the demand for the disaster relief is not man-created and the customer or the
final consumer is not the buyer, humanitarian logistics need to get their funding and
supplies from somewhere else. Although non-governmental organizations usually are
the main actors in humanitarian operations, in recent years private donors and private
sector have become a major source of funding and supplies (Kovacs and Spens, 2007).
Many humanitarian organizations also compete with each other for donors, as donors
are more prone to offer their money for sudden disasters rather than long-term devel-
opment (Oloruntoba, 2006). Some donors might offer unwanted help, for instance
medicine with passed expiry dates or unsuitable clothes for certain climatic circum-
stances. Donors also often want to see their aid to be delivered directly to the destination
(Oloruntoba & Gray, 2006), although all actors in the whole supply chain are dependent
on the finance and donations. For instance, sometimes it would do greater good to do-
nate forklift parts in order to secure the ability to transport and deliver certain products
to the destination.
Another resource problem is directly related to transport. In many cases, infrastructure
can be seriously damaged in disaster areas (Kovacs & Spens, 2007). In addition, in
many cases disasters are more prone to less developed regions and in that kind of places
the infrastructure is inadequate already before any destruction. In addition, short-term

19
disaster aid is often more luring rather than long-term development aid. Often regions
need long-term funding for long-term recovery after the disaster and immediate aid.
The model of the whole supply chain in humanitarian operations is often more complex
than in business logistics (Oloruntoba & Gray, 2006). International humanitarian supply
chains are clearly unstable and unpredictable due to constant change of circumstances,
donors and funding. In that way, the operations require accurate and efficient planning
and the project can fail after a lot of effort due to insufficient organization (Kovacs &
Spens, 2007). For example, the abundance of aid providers can lead to duplicate efforts
in operations and material. After the tsunami to Eastern Asia in 2006, several small or-
ganizations collected money for the victims of the tsunami but they did not have means
to transport the goods to the destination. In that case they allocated their funds to bigger
operators who took care of the actual delivery of disaster relief.
Whereas businesses often have rather stable situation with suppliers and buyers, disas-
ters do not warn about themselves and they are very difficult to predict. To be able to
respond quickly to situations also means that sufficient inventory and supplies should be
stored in warehouses at all times.
In short, the key performance indicators, or KPI, for the humanitarian logistics are gen-
erally stated to be good pre-planning, correct organization and allocation of the goods
and staff and the readiness to react to the changing situations. This is why we will take a
deeper look in the matter of pollution in this thesis. And the need for humanitarian lo-
gistics is not reducing, but the contrary: in the future, as the man-made and natural dis-
asters are predicted to increase, there will be a growing “market” for humanitarian logis-
tics (Kovacs & Spens, 2007).
3.3. Pollution and the carbon footprint
One of the big challenges of the logistics companies is to respond to the environmental
requirements and the reduction of emissions (Springer, 2002). As already mentioned
before, the transportation companies are one of major sources of greenhouse gas emis-
sions. One very positive aspect is that often planning and carrying out more environ-
20
mental friendly and sustainable operations bring long-term savings to companies and
organizations.
First of all, what are global warming and greenhouse gases? When people talk about
global warming, they mean the increase of the average temperature on the Earth. This
can be an evolutionary fact as the Earth has gone through different phases, such as the
ice age over ten thousand years ago. Greenhouse gases are on the other hand atmos-
pheric gases that trap sun’s heat inside the Earth’s atmosphere thus causing warming of
the average temperature (The World Watch Institute, 2009). One of the most common
greenhouse gases is the carbon dioxide, but there are also others such as methane, ni-
trous oxide, ozone and water vapor (The World Watch Institute, 2009).
The global warming is mostly considered a threat for the nature and ecosystems and
most people recognize this problem as caused by human beings. According to the World
Watch Institute, a safe level of warming would be at maximum two Celsius degrees.
Unfortunately the predicted warmth level will reach the two degrees thus creating a se-
rious threat to the ecosystems and human beings as well (Greenpeace, 2010).
What individuals and organizations can do in order to alleviate the climate change?
They can reduce the consumption of the fossil fuels and the overall energy consump-
tion. Small steps such as taking the bus instead of a car combined to the master opera-
tional changes towards more environmentally friendly method can make a big differ-
ence. All it takes is some effort from all of us.
3.4. Green logistics
As already mentioned before, many commercial logistics companied have plans to re-
duce their carbon footprint and means to achieve this goal. However, according to Rod-
rigue, Slack and Comtois (2001) green logistics is a paradox as an idea. Logistics refers
to transportation, and transportation creates different kind of emissions. Logistics inher-
ently causes pollution and thus the combination “green logistics” may sound contradic-
tive. However, maybe the term “greener logistics” would be more meaningful. As logis-
tics itself cannot be green, one can always bee “greener” than the other, in other words
minimize the pollution level. For example, TNT plans to have level zero emissions in

21
the future (Jussila, 2011). This can be achieved, for example, by balancing the pollution
by planting trees whose ability to absorb carbon dioxide equal the level the vehicles and
planes operated by TNT cause in a certain period of time.
4. Logistics capacity assessments
4.1. Kenya
Picture 4: Map of Kenya
Source: CIA, 2011
General information: The total area of Kenya is 580 367 km2 and it has borders with
Somalia in the east, Tanzania in the south, Uganda in the west, short borderline with
Sudan in the northwest, Ethiopia in the north and long coastline to the Indian Ocean in
the southeast.
Road network: Kenya has a comprehensive road network. However, as only 1800 kilo-
meters or 20% of the roads are paved, rain seasons and natural phenomena have an ef-
fect on the roads thus making some routes inaccessible.
Rail network: The rail network is obsolete, as it has very limited capacity in tonnage
volume and very limited delivery speed. In 2006, Rift Valley Railways (RVR) won the
right to run Kenya’s railways for the next 25 years.

22
Inland waterways: Although country has numerous rivers, waterways due to their shal-
lowness are not particularly used for transport.
Airports: Jomo Kenyatta International Airport (NBO) is the biggest airport facility in
Kenya. Accurate location is Embakasi, a suburb 15 kilometers of the center of Nairobi.
There are thirteen other airports in Kenya, located in different areas.
Harbors: Port of Mombasa is the biggest seaport in Kenya. In addition, it also serves
Uganda, Rwanda, Burundi, DRC, Southern Sudan, Ethiopia, Somalia and Northern
Tanzania.
4.2. Tajikistan
Picture 5: Map of Tajikistan
Source: CIA, 2011
General info: Tajikistan has borders with Uzbekistan in the west, China in the east,
Kyrgyzstan in the north and Afghanistan in the south and its area is 143 100 km2.
Road network: Country has a fairly good road network and it connects all regions of the
country by paved roads. However, snow and harsh winters, rock falls or landslides can
cause delays and blockages on the roads. If some ways are disconnected, secondary
roads are generally passable.
23
Rail network: Rail enters Tajikistan in Aivaj in the south, Dushanbe in the middle of the
country and in Khujad in the north. The rail network was well established during Soviet
times and connected all Soviet Republics. Tajikistan was a part of this system and is
able to move and receive any cargo to any of these countries relatively easily.
Airports: Cargo transport is concentrated in Dushanbe airport. In total, there are seven-
teen airports with paved runways and nine with unpaved runways (CIA, 2011).
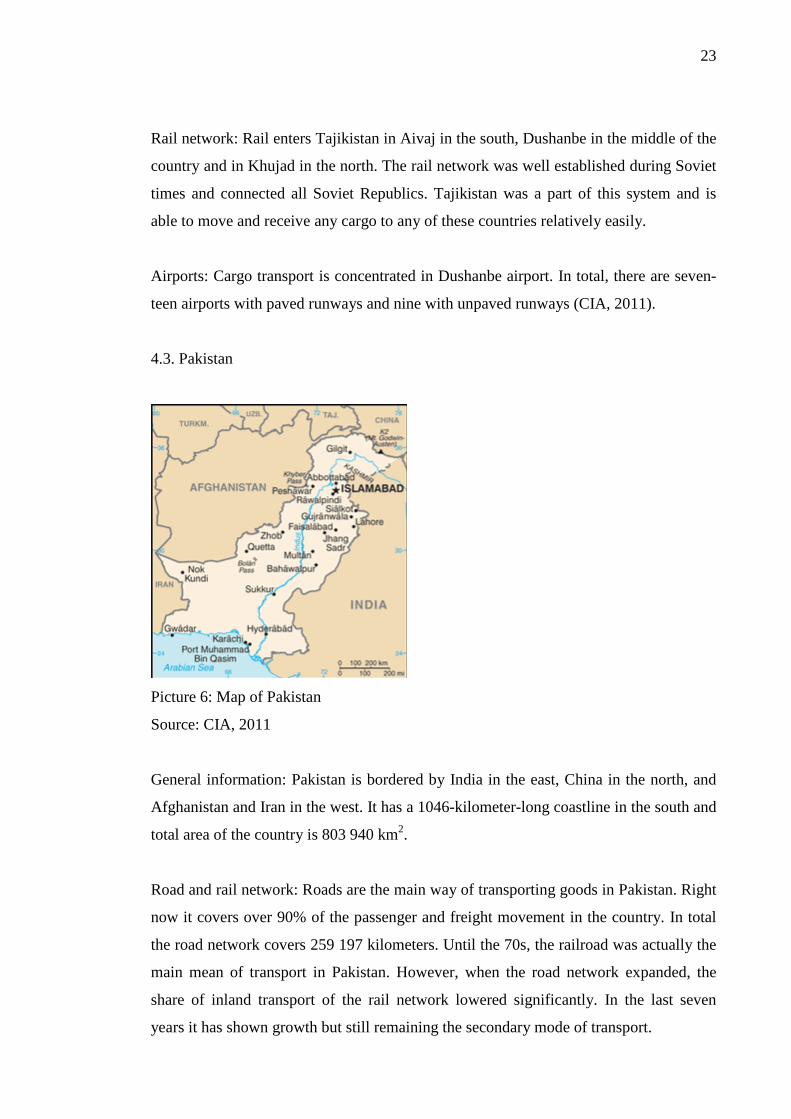
4.3. Pakistan
Picture 6: Map of Pakistan
Source: CIA, 2011
General information: Pakistan is bordered by India in the east, China in the north, and
Afghanistan and Iran in the west. It has a 1046-kilometer-long coastline in the south and
total area of the country is 803 940 km2.
Road and rail network: Roads are the main way of transporting goods in Pakistan. Right
now it covers over 90% of the passenger and freight movement in the country. In total
the road network covers 259 197 kilometers. Until the 70s, the railroad was actually the
main mean of transport in Pakistan. However, when the road network expanded, the
share of inland transport of the rail network lowered significantly. In the last seven
years it has shown growth but still remaining the secondary mode of transport.

24
Harbors: The first built port is located in Karachi and is called Port of Muhammed bin
Qasim. The Gwardar port was built in 2007. The district of Balochistan has 600 kilome-
ters of coastline where this newer port is located. The flow of cargo arriving to the ports
has grown strongly lately due to country’s economic growth. Now the problem is that
the ports do not have sufficient capacity to handle all the cargo. For that reason, various
projects have been implemented to improve the operations at the port.
4.4. Zimbabwe
Picture 7: Map of Zimbabwe
Source: CIA ,2011
General information: Zimbabwe is bordered by four countries; Mozambique in the east,
South Africa in the south, Botswana in the southwest and Zambia in the northwest. One
distinctive feature on Zimbabwe’s geography is the high plateau that goes all the way
from southwest to northeast across the whole country. It is 650 kilometers long, 80
kilometers wide and its altitude is mostly between 1200 and 1500 meters above sea
level. The total area is 390 580 km2.
Road network: The road network consists of total over 18 000 kilometers of road, of
which 8600 kilometers are paved. The primary roads are in good condition and mostly
free from obstructions. A loaded truck can maintain an average speed of 50 km/h. The
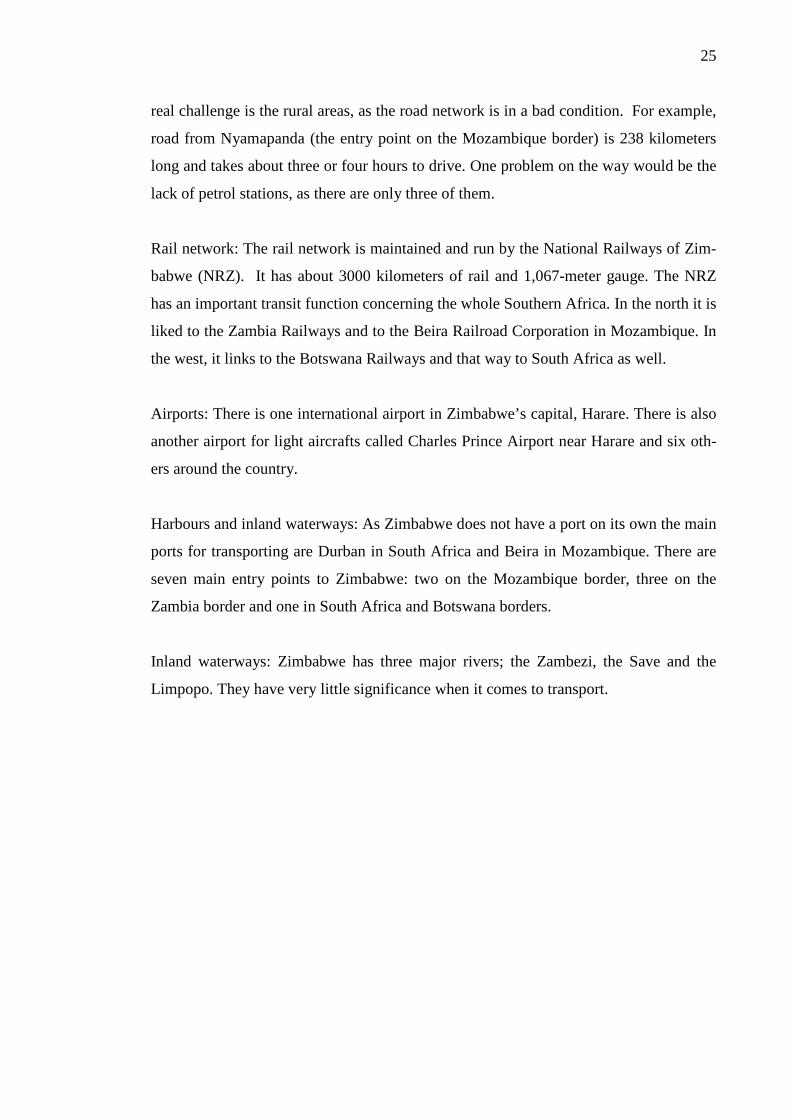
25
real challenge is the rural areas, as the road network is in a bad condition. For example,
road from Nyamapanda (the entry point on the Mozambique border) is 238 kilometers
long and takes about three or four hours to drive. One problem on the way would be the
lack of petrol stations, as there are only three of them.
Rail network: The rail network is maintained and run by the National Railways of Zim-
babwe (NRZ). It has about 3000 kilometers of rail and 1,067-meter gauge. The NRZ
has an important transit function concerning the whole Southern Africa. In the north it is
liked to the Zambia Railways and to the Beira Railroad Corporation in Mozambique. In
the west, it links to the Botswana Railways and that way to South Africa as well.
Airports: There is one international airport in Zimbabwe’s capital, Harare. There is also
another airport for light aircrafts called Charles Prince Airport near Harare and six oth-
ers around the country.
Harbours and inland waterways: As Zimbabwe does not have a port on its own the main
ports for transporting are Durban in South Africa and Beira in Mozambique. There are
seven main entry points to Zimbabwe: two on the Mozambique border, three on the
Zambia border and one in South Africa and Botswana borders.
Inland waterways: Zimbabwe has three major rivers; the Zambezi, the Save and the
Limpopo. They have very little significance when it comes to transport.

26
4.5. Haiti
Picture 8: Map of Haiti
Source: CIA, 2011
General information: Haiti is situated in the Caribbean sharing an island with Domini-
can Republic. The total area of the country is 27 750 km2.
Road and rail network: For inland transportation, road is the primary route to move
people and goods. There is no reliable information about the road network available and
the conditions vary significantly across the country. Only a small part of the roads are
paved and there might be problem crossing rivers as the secondary roads not always
have bridges connecting the roads on each side of the waterway. As far as rail network
goes, it is not currently functioning in Haiti.
Airports: The main international airport is called Toussaint Louverture International
Airport, abbreviation of which is PAP
Harbours: There are two main ports that are open for international trade. They are the
Port of Port-au Prince and Cap Haïtien. There are also other eight ports that receive in-
ternational trade.
27
5. Case studies
5.1. Emergency background
5.1.1. Kenya
In 2010, exceptionally heavy rainfall was recorded in Kenya and it resulted in floods
and destruction of infrastructure and property in northwestern districts, western and cen-
tral highlands and in a few areas in the southeast. Approximately 40 people lost their
lives and 8270 households suffered either partial or total loss of their property. In addi-
tion, 50 000 people were affected by the floods and needed humanitarian assistance. By
the end of the project, Kenya Red Cross Society (KRCS) was able to rescue and relocate
92 people, distribute 13,330 non-food items to affected people, and distribute 322 200
aqua tabs and 66 700 PUR sachets.
As the Finnish Red Cross has good connections and good cooperation with the local
National Society and its supply chain team and they have several Kenyan suppliers on
their database and have experience on their services and products, the goods for this
operation were acquired and transported from local suppliers in Kenya and manufactur-
ers. This was done in order to support the local economy and reduce the delivery time
and minimize the transit distance.
5.1.2. Tajikistan
The 2nd hand clothing deliveries are part of the other projects run with partner National
Societies. In Tajikistan the Finnish Red Cross has been active already almost for two
decades. Climaticwise and also culturally the 2nd hand clothing from Finland is very
suitable for those countries and there is a high need for them.
5.1.3. Pakistan
In July 2010 the worst flood hit Pakistan since 1929. According to the estimation, over
20 million people of Pakistan’s 170 million were affected by the flood. It also caused
severe damage to farmland, infrastructure and to multiple essential buildings such as
hospitals and health clinics. The majority of the country was seriously affected, except

28
the northernmost parts. The need of aid was predicted to last until the year of 2011, as
the sowing season would be missed in most areas.
5.1.4. Zimbabwe
This case concerns a continuous seed distribution project between The Finnish Red
Cross and the local National Society in Zimbabwe. The need for this derives from 2008
of increasing food insecurity. The problem originates from worsening economic envi-
ronment, which set challenges to people already having problems with food insecurity.
In addition, HIV and AIDS epidemic made the situation even worse weakening all the
positive gains in human development. In total, the situation was severe and there were
an estimated 5,1 million people suffering from lack of nutrition.
As in the case of Kenya, the Zimbabwe National Red Cross Society took the main re-
sponsibility of the coordination of the humanitarian aid with support of the IFRC. Also
the World Food Program, Food and Agriculture Organizations and the government of
Zimbabwe worked closely with ZNRCS in this project.
The origin for the seeds is Zimbabwe and the manure is from South Africa. The Finnish
Red Cross assisted with the purchase of the fertilizer but no seeds or other products in
this project originated from Finland. The whole distribution was carried out by a collec-
tive distribution from the capital.
5.1.5. Haiti
In January 12th 2010, an earthquake of a magnitude of 7 Mw, hit the Haitian coast. After
the incident, it was impossible to estimate the accurate number of deaths and injuries.
Considering the condition of infrastructure, the residents and slum housing the damages
were massive around the country. The most important target of the Red Cross was to
prevent any more loss of life and to provide support and relief for the survivors. The
living conditions in Haiti are very poor as over 76% of the population living with less
than 2 USD per day. That made international support crucial for the victims suffering
from the damages caused by the earthquake.

29
Picture 9: Loading of a plane to Haiti
Source: The Red Cross (2010)
6.1. Transported items and emissions
6.1.1. Kenya
Material Pieces Weight (kg)
Volume (m3)
Origin Route
CO2 emis-sions (tons)
Blankets 19 875 35 775 224 Kenya Thika-Nairobi:truck 0,14 Cooking sup-plies Mosquito nets Tarpaulins
53587 150 600 583,2 Within 50 kilometers within Nairobi: truck
0,38
Total CO2 emissions 0,52
Table 1: Transported items in Kenya
6.1.2. Tajikistan
Table 2: Transported items in Tajikistan
Destination Material Weight (kg)
Volume (m3)
Origin Route CO2 emis-sions (tons)
Tajikistan 2nd hand clothing
37166 190 The Finnish Red Cross Logistics center
Tampere-Kouvola: truck Kouvola-Dushanbee: train
0,79 4,61
Total CO2 emissions 5,40
30
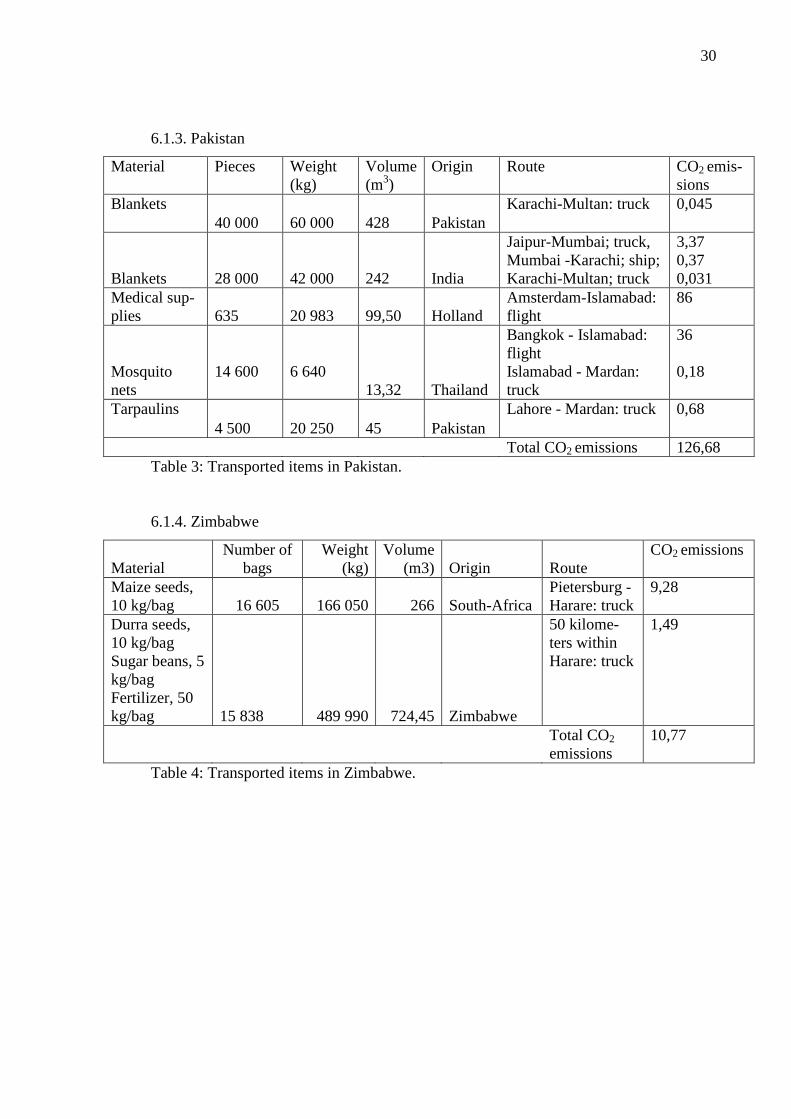
6.1.3. Pakistan
Material Pieces Weight (kg)
Volume (m3)
Origin Route CO2 emis-sions
Blankets 40 000 60 000 428 Pakistan
Karachi-Multan: truck 0,045
Blankets 28 000 42 000 242 India
Jaipur-Mumbai; truck, Mumbai -Karachi; ship; Karachi-Multan; truck
3,37 0,37 0,031
Medical sup-plies 635 20 983 99,50 Holland
Amsterdam-Islamabad: flight
86
Mosquito nets
14 600
6 640
13,32 Thailand
Bangkok - Islamabad: flight Islamabad - Mardan: truck
36 0,18
Tarpaulins 4 500 20 250 45 Pakistan
Lahore - Mardan: truck 0,68
Total CO2 emissions 126,68 Table 3: Transported items in Pakistan.
6.1.4. Zimbabwe
Material Number of
bags Weight
(kg) Volume
(m3) Origin Route
CO2 emissions
Maize seeds, 10 kg/bag 16 605 166 050 266 South-Africa
Pietersburg -Harare: truck
9,28
Durra seeds, 10 kg/bag Sugar beans, 5 kg/bag Fertilizer, 50 kg/bag 15 838 489 990 724,45 Zimbabwe
50 kilome-ters within Harare: truck
1,49
Total CO2
emissions 10,77
Table 4: Transported items in Zimbabwe.

31
6.1.5. Haiti
Material Weight (kg)
Volume (m3) Origin Routing
CO2 emissions (tons)
Autoclaves Tarpaulins Family tents Buckets
23 169 85 The Finnish Red Cross logistics center
Tampere-Berlin: truck Berlin-Santo Domingo: flight Santo Domingo-Port-au-Prince: truck
3,79 132,90 0,015
Family tents Medical items Vehicles 125 000
613 Tampere - Helsinki: truck Helsinki-Port-au-Prince: flight
1,54 751,36
Medical supplies Office Supplies Spare parts
239 3 Tampere - Helsinki: truck Helsinki - Santo Domingo: flight Santo Domingo - Port-au-Prince: truck
0,0025 1,21 0,00013
Health clinic 14 423 1 260 Tampere - Port-au-Prince: flight
83,79
Field hospital Relief emergency unit Family tents
21 062 94 Tampere - Helsinki: truck Helsinki - Berlin: flight Berlin-Port-au-Prince: flight (with 10 tons more freight)
0,26 34 177,54
Total CO2 emissions 1186,41 Table 5: Transported items in Haiti.
7. Analysis
7.2. Conclusions
By far the most polluting transport process was the goods to Haiti from the Red Cross,
Tampere warehouse, whose total carbon dioxide emissions were over 1000 tons. In or-
der to guarantee fast response to rapid onset disasters, there is always a certain amount
of stock ready to be shipped abroad. In these cases, the material has to be available im-
mediately and there is no time to start procurement processes with local suppliers espe-
cially if there is no guarantee about the quality and reliability of the products and sup-
pliers. Especially in case of Haiti, the best option to transport the items to destination
was by flight as the products were stocked in Finland and had to be transported as fast
as possible to meet the urgent demand.
32
Although rapid onset disasters require fast and thus more polluting modes of transport,
emissions can be minimized by different coordination of the routes. For example, 23
tons of relief items were transported from Tampere to Berlin by truck thus creating less
than four tons of emissions. Direct flight from Tampere to Port-au-Prince would have
created almost 139 tons of emissions whereas the flight from Berlin to Haiti created
them 133 tons. Given the fact the calculations are approximate, the fact of part of the
trip was taken by truck did not create significant difference, only 2 tons. Also when tak-
ing into consideration the unloading and reloading, the most direct route would be more
useful if the plane is full and thus avoiding the empty trip factor. In this case, the emer-
gency response units and health clinics items were transported to the destination in a
charter flight from Tampere via Berlin in order to guarantee the fastest delivery. More
people and goods from other western Red Cross National Societies were loaded there in
order to have a full aircraft arriving to Haiti.
Other emergency situation that required rather fast reaction was the flood in Pakistan.
Many items for this were purchased form Pakistan and thus long transportation dis-
tances could be avoided. Over 80 tons of items were supplied locally, whose transport
caused approximately 0,7 tons of carbon dioxide. 21 tons of items were transported
from Amsterdam, Netherlands and that alone created 86 tons of carbon dioxide emis-
sions. Had the route been Amsterdam-Karachi by ship and then from Karachi to Islama-
bad by truck, the emissions would have been significantly lower, 1,22 tons from sea
transport and 2 tons of truck transport. So the difference would have been over 80 tons.
42 tons of items that were purchased from India were transported partly by truck and
ship, caused 3,7 tons of carbon emissions.
It was proven in many tables that trains are the least consumptive method for inland
transport. Considering the distance from Tampere to Dushanbe, the emissions for 2nd
hand clothing deliveries were only 5,40 tons thus making this the least consumptive
operations with a long distance. Transport from Finland to Central Asia is ideal with
non-stop route almost to the destination and due to the functioning railway. However, it
is not as simple in all locations. Rails do not lead directly to the warehouse or the point
of consumption, but the goods have to be loaded, unloaded and reloaded in different
points. It creates additional risks about damage and even theft.
33
In cases of Kenya and Zimbabwe, the majority of goods were transported within the
capital because of the fact that the products were purchased from local suppliers. As the
delivery routes were short, a few dozen of kilometers, it makes these operations the least
consumptive. Operations in Kenya only caused approximately 0,52 tons of carbon diox-
ide emissions. Operation in Zimbabwe caused as much as approximately 10,77 tons, but
the difference is caused by the fact that part of the seeds were transported from South
Africa. This transport caused over 9 tons of CO2 emissions.
Different factors create challenges when deciding between different transportation
methods in order to send goods to crisis areas. The lack of proper infrastructure, the
location of the country, and the fact that many natural disasters have destroyed the exist-
ing network and environment make the transport as quickly as possible very difficult to
the destination and the lack or non existence of possible local suppliers. The fact that
central Asian countries are in the middle of the continent prevents the usage of ferries.
The location of Haiti makes rail transport impossible.
It is also very important thing to take into consideration, that greenhouse gases are not
the only way in what way the different transport vehicles pollute the environment. With
boats and ferries, they create noise that distracts underwater animals. Mammals such as
dolphins and whales speak with such voices and signals with frequency that can be dis-
turbed by the noise of the ferries. In addition, they also pollute water with the fuel.
However, it is difficult to acquire information about local vessels and the fuel they use
and influence the quality of those in one-time operations.
7.3. Recommendations
Taking the different cases into consideration, the recommendations for the Finnish Red
Cross are the following. In urgent cases, such as Haiti, the rapid response is the most
important thing. The most direct route to the destination is the most environmentally
friendly way to transport goods as fast as possible or in cases where flight is the only
option to transfer the goods to the destination in a minimum amount of time. There
might also be a change to take different supplies in different routes, especially when the
volumes are high and the empty load factor would be minimized. For example, the

34
medical supplies to Haiti should be taken to the destination as fast as possible whereas
other items might not have the equal urgency.
For on-going deliveries, such as clothing to Central Asia, the best way to transport the
goods is by train, depending on the location of the country. Of course, the availability of
the functioning rail network has to be taken into consideration. If the goods are trans-
ported to other continents, the best way to deliver these is by ship.
In cases, such as Pakistan, where the urgency level is high, but the situation evolves
gradually, part of things can be transported in a more environmental friendly way, such
as rail or ship. It depends on the initial incident, but if the flood evolves slowly and the
affected areas can be predicted, the first freight can be transported directly with the fast-
est way. Then, more goods can be shipped at the same time but with slower and more
environmentally friendly transport modes. For example, if less urgent items could be
purchased from Europe and the most urgent items could be procured locally. This way
the items that are purchased from further could be transported by ship or train to the
final destination.
In cases, such as Kenya, where the local country can provide needed supplies, the situa-
tion is ideal. In these cases the transportation distances and thus the delivery times can
be minimized. In every case, local procurement is the best option when it comes to envi-
ronment and pollution. Compared to the case of Haiti, the carbon emissions were over
99% higher than in the one of Kenya.
One of the problems with this thesis was the fact that the Finnish Red Cross has insuffi-
cient information about the transportation details. It would be recommended to have the
suppliers to make delivery reports including the local warehouse locations and the exact
delivery route, and the type of the transport vehicle. However, this is a challenge for the
Red Cross as this information is not always possible to gather. Having good relations
with the local National Society and doing research of the possible suppliers would be
helpful with this matter.

35
8. References:
8.1. Literature Haapanen, Marko & Vepsäläinen, Ari P.J. 1999. Jakelu 2020 - Asiakkaan läpimurto. 1999. Gummerus Kirjapaino Oy. Jyväskylä Hugos, Michael. 2003. Essentials of Supply Chain Management. John Wiley & Sons, Inc. Hoboken, New Jersey. Springer, Katrin. 2002. Climate policy in a globalizing world.. Springer-Verlag. Berlin Heidelberg The St. Lucie Press/APICS Series on Resource management. 2002. Basics of supply chain management. CRC Press LLC The World Watch Institute. 2009. State of the world – into the warming world. First edition. W.W. Norton & Company. Inc. New York Tomasini, Rolando & Luk Van Wassenhove. 2009. Humanitarian logistics. CPI Antony Rowe. Chippenham and Eastbourne 8.2. Articles and presentations Ehrhart, Christof. 2010. Delivering tomorrow - towards sustainable development. How business innovation and green demand drive a carbon-efficient industry. [pdf] First edi-tion. Deutsche Post AG. Bonn. Oloruntoba, Richard & Gray, Richard. 2006. Humanitarian aid: an agile supply chain? [pdf] Emerald Group Publishing Limited Kovács, Gyöngyi & Spens, Karen M. 2007. Humanitarian logistics in disaster relief operations. [pdf] Emerald Group Publishing Limited. Jussila, V-M., 2011. Environmental impact of TNT logistics. TNT Suomi Oy, Vantaa., unpublished. Pohjola, K. 2011. The Finnish Red Cross: International Operations and Programmes, Logistics and Procurement [pdf] 8.3.Websites Central Intelligence Angency. 2011. The World Factbook. Haiti. https://www.cia.gov/library/publications/the-world-factbook/geos/ha.html Viewed on 23.7.2011 Central Intelligence Angency. 2011. The World Factbook. Kenya. https://www.cia.gov/library/publications/the-world-factbook/geos/ke.html Viewed on 23.7.2011

36
Central Intelligence Angency. 2011. The World Factbook. Tajikistan. https://www.cia.gov/library/publications/the-world-factbook/geos/ti.html Viewed on 22.3.2011 Central Intelligence Agency. 2011. The World Factbook. Zimbabwe. https://www.cia.gov/library/publications/the-world-factbook/geos/zi.html Viewed on 5.5.2011 Comtois, Claude & Rodrigue, Jean-Paul & Slack, Brian. 2001. Green logistics (the paradoxof). http://people.hofstra.edu/jean-paul_rodrigue/downloads/Green%20Logistics.pdf Viewed on 1.10.2011 Council of Supply Chain Management Professionals.2010. Glossary of terms. http://cscmp.org/digital/glossary/glossary.asp Viewed on 19.7.2011 Ecologicsl Transport Information Tool Worldwide. 2010. http://www.ecotransit.org/ Viewed on 1.4.2011 Finnair. 2010. Corporate responsibility. http://www.finnairgroup.com/linked/en/konserni/Finnair_Corporate_Responsibility_Report_2010.pdf Viewed at 1.2.2011 Greenpeace.2010. Ilmastonmuutos: ongelmat http://www.greenpeace.org/finland/fi/kampanjat/ilmastonmuutos/Ongelmat/ Viewed on 22.7.2011 The Guardian. 2011. Republican hopefuls deny global warming. http://www.guardian.co.uk/world/2010/sep/14/republican-hopefuls-deny-global-warming Viewed at 6.6.2011 IFRC.org Appeal 2008-2009. Zimbabwe http://www.ifrc.org/docs/appeals/annual08/MAAZW001app.pdf Viewed on 30.4.2011 IFRC.org Federation Procurement services. Our global structure. 2011. http://procurement.ifrc.org/en/aboutus/Pages/Ourglobalstructure.aspx Viewed on 8.2.2011 IFRC.org History. 2011. http://www.ifrc.org/en/who-we-are/history/.Viewed on 7.2.2011 IFRC.org. DREF Operational final report. Kenya: floods 2010. 2010. http://www.ifrc.org/docs/appeals/09/MDRKE011final.pdf Viewed on 27.4.2011 IFRC.org. Emergency appeal. Pakistan: Monsoon flash floods. 2010. http://www.ifrc.org/docs/appeals/10/MDRPK006rea.pdf Viewed on 22.4.2011 IFRC.org. Final report. Zimbabwe - Food Insecurity. 2010 http://www.ifrc.org/docs/appeals/08/MDRZW003_final.pdf Viewed at 30.4.2011 IFRC.org. Strategy 2020. 2010. http://www.ifrc.org/en/who-we-are/vision-and-mission/strategy-2020/ Viewed on 19.7.2011
37
IFRC.org. Vision and mission. 2001. http://www.ifrc.org/en/who-we-are/vision-and-mission/ Viewed on 7.2.2011 IFRC.org. Who we are. Governance. 2011 http://www.ifrc.org/en/who-we-are/governance/ Viewed on 19.4.2011 Logistics cluster. 2011. Logistics capacity assessment. Kenya. http://www.logcluster.org/ops/hornofafrica/ken/view Viewed at 1.7.2011 Punainen Risti. Punaisen Ristin liikkeen historia. 2011. http://www.redcross.fi/punainenristi/historiaa/fi_FI/ Viewed on 11.2.2011 Punainen Risti. Suomen Punainen Risti. 2011. http://www.redcross.fi/punainenristi/suomenpunainenristi/fi_FI/ Viewed on 11.2.2011. Punainen Risti. Suomen Punaisen Ristin toimintalinjaus vuosille 2011-2014. 2011. http://www.redcross.fi/aktiivit/osastotoimisto/strategiat/fi_FI/toimintalinjaus/ Viewed on 1.8.2011 The Infrastructure Project Development Facility. Ministry of Finance. 2010. Facts about Pakistan. http://ipdf.gov.pk/home/facts-about-pakistan/physical/ Viewed at 1.5.2011 World Food Program. WFP.org. Logistics. Tajikistan. 2010 http://logistics.wfp.org/country-operations/asia/central/tajikistan Viewed on 15.4.2011 Yle.fi. Uutiset. Venäjä rajoittaa avustuskuljetuksia. 2011. http://yle.fi/alueet/kymenlaakso/2011/05/venaja_rajoittaa_avustuskuljetuksia_2587441.html Viewed at 16.5.2011.

38
9. Appendices
9. 1. Tables acquired from Kirsi Pohjola, the Finnish Red Cross
KOHDE MATERIAALI
kpl/ pakkaus/
hoitoyksikkö kg m³ Tavaran toimittaja
alkuperä/ lähetys-
maa Reititys
HAITI 2 Autoklaaveja 2 18,509.50 75.50 SPR Logistiikkakeskus Suomi Tre-Berliini auto, Berliini-Santo Domingo lento, Santo Domingo-Port au Prince auto..
HAITI 2 Pressuja 4x6m 900 SPR Logistiikkakeskus Suomi Tre-Berliini auto, Berliini-Santo Domingo lento, Santo Domingo-Port au Prince auto..
HAITI 2 Ämpäreitä, 10 ltr 4,000 SPR Logistiikkakeskus Suomi Tre-Berliini auto, Berliini-Santo Domingo lento, Santo Domingo-Port au Prince auto..
HAITI 2 Perhetelttoja 340 4,660.00 10.00 SPR Logistiikkakeskus Suomi Tre-Berliini auto, Berliini-Santo Domingo lento, Santo Domingo-Port au Prince auto..
HAITI 3 Liikkuvan ERU-klinikan lisälaitteet ja tarvikkeet 4,142 95,300.00 510.00 SPR Logistiikkakeskus Suomi Tre-Hki auto, HKI- Port au Prince (PAP) lento.
HAITI 3 ERU majoitusleiri tarvikkeita (Base Camp) 1 SPR Logistiikkakeskus Suomi Tre-Hki auto, HKI- Port au Prince (PAP) lento.
HAITI 3 Hätämajoitus-yksikkö (Shelter) 1 SPR Logistiikkakeskus Suomi Tre-Hki auto, HKI- Port au Prince (PAP) lento.
HAITI 3 Nissan Pickup 3 SPR Logistiikkakeskus Suomi Tre-Hki auto, HKI- Port au Prince (PAP) lento.
HAITI 3 Peräkärryjä 2 SPR Logistiikkakeskus Suomi Tre-Hki auto, HKI- Port au Prince (PAP) lento.
HAITI 3 Perhetelttoja 500 29,000.00 100.00 SPR Logistiikkakeskus Suomi Tre-Hki auto, HKI- Port au Prince (PAP) lento.
HAITI 3 Suihkuteltat 2 744.00 3.30 Eurovinil S.p.A Italia Milano-Santo Domingo lento, Santo Domingo-Port au Prince auto
HAITI 4 Lääkinnällisiä tuotteita ERU-klinikalle ja sairaalaan 4 126.80 0.44 SPR Logistiikkakeskus Suomi Tre-Hki auto, HEL-Santo Domingo lento, Santo Domingo- Port au Prince auto.
HAITI 4 Toimistotarvikkeita 26 50.00 1.50 SPR Logistiikkakeskus Suomi Tre-Hki auto, HEL-Santo Domingo lento, Santo Domingo- Port au Prince auto.
HAITI 4 Ilma-,polttoaine- ja öljyn-suodattimia 173 63.00 1.13 SPR Logistiikkakeskus Suomi Tre-Hki auto, HEL-Santo Domingo lento, Santo Domingo- Port au Prince auto.
KENIA Huopia, 50% villa 19,875 35,775.00 224.00 Spinners & Spinners Ltd Kenia Thika-NBO (n.60km) auto
KENIA Keitto- ja ruokailuvälineitä 5 henk.perheelle 17,762 88,810.00 432.00 Kaluworks Limited Kenia NBO-NBO auto,
KENIA Moskiittoverkkoja, 190x180x150cm 32,440 16,220.00 62.00
Spartan Relief Supplies Ltd Kenia NBO-NBO auto,
KENIA Pressuja 4x6m 3,385 45,570.00 89.20 Reltex Tarpaulins (Africa) EPZ Ltd Kenia NBO-NBO auto,
KENIA Saippuaa, yleiskäyttö, 800g 15,000 12,000.00 22.00 Spartan Relief Supplies Ltd Kenia NBO-NBO auto,
KENIA Vesikanistereita, 20L 33,120 10,500.00 119.00 Spartan Relief Supplies Ltd Kenia Taiwan-Mombasa laiva, Mombasa-NBO auto
PAKISTAN
Huopia, synteettinen (akryyli/polyesteri), 150 x 200 cm 68,000 90,800.00 688.00 Alpinter Ltd Pakistan Karachi-Multan auto
PAKISTAN Lääkinnällisiä tarvikkeita 10 000 hengelle 635 20,983.00 99.50 IDA Hollanti Amsterdam-Islamabad lento
PAKISTAN Moskiittoverkkoja, 160x180x150cm 14,400 3,960.00 13.32 Netto Group Co. Ltd Pakistan Bangkok-Islamabad lento, Islamabad-Mardan auto
PAKISTAN Moskiittoverk-koja,190x180x150cm 200 2,680.00 6.32 AIPACS OACG Pakistan Karachi-Mardan auto.
PAKISTAN Pressuja, 4x6m 4,500 20,250.00 45.00 Baldev Woollen International Intia Bunjab-Mumbai auto, Mumbai-Karachi laiva, Karachi-Mardan auto
ZIMBABWE Maissin siemeniä, 10 kg pussi 16,605 166,050.00 266.00 V & M Grains C.C
Etelä-Afrikka Pietersburg- Harare- ks.liite
ZIMBABWE Durran siemeniä, 10 kg/pussi 1,340 13,400.00 20.10 V & M Grains C.C Zimbabwe Harare- ks.liite
ZIMBABWE Sokeripavun siemeniä, 5 kg/pussi 5,518 27,590.00 30.35 V & M Grains C.C Zimbabwe Harare- ks.liite
ZIMBABWE Pintalannoite, 50 kg/säkki 8,980 449,000.00 674.00 V & M Grains C.C Zimbabwe Harare- ks.liite
Materiaalitoimitukset yhteensä 287,798 2,290,717 5,365
HAITI 1 Liikkuva ERU-klinikka 1 14,423.00 1,260.00 ERU Suomi TMP-PAP lento
HAITI 2 Kirurginen ERU-sairaala 1 18,568.00 80.30 ERU Suomi TRE-HKI auto, HEL-PAP lento
HAITI 2 ERU avunjakelu-yksikkö (Relief) 1 2,500.00 13.50 ERU Suomi TRE-HKI auto, HEL-PAP lento
PAKISTAN ERU Logistiikka-yksikkö, airops ja ilmakaariteltta 5 617.00 2.98 ERU Suomi TRE-HKI auto, HEL-Kööpenhamina-Lontoo-Islamabad lento
ERUT yhteensä 8 36,108 1,357
paalit kg m³ Sierra Leone Käytettyjä vaatteita 414 14,255.00 62.00 SPR Logistiikkakeskus Suomi
Djibouti Käytettyjä vaatteita, neuleita ja ÄT-peittoja 430 14,353.00 64.50 SPR Logistiikkakeskus Suomi
Mongolia Käytettyjä vaatteita, kenkiä, neuleita ja ÄT-peittoja 558 19,542.00 120.00 SPR Logistiikkakeskus Suomi
Liberia
Käytettyjä vaatteita, apupupuja, neuleita ja ÄT-peittoja 401 13,570.00 60.00 SPR Logistiikkakeskus Suomi
Chad Käytettyjä vaatteita ja neuleita 407 12,749.00 61.00 SPR Logistiikkakeskus Suomi
Tadjikistan Käytettyjä vaatteita ja neuleita 641 19,705.00 96.20 SPR Logistiikkakeskus Suomi
Tadjikistan Käytettyjä vaatteita ja ÄT-peittoja 625 17,461.00 93.70 SPR Logistiikkakeskus Suomi
Vaatteet ym yhteensä 3,476
111,635.0
0 557.40

39
9.2. Emission calculation tables
37 tons of blankets from Thika to Nairobi by truck
Source: EcotransIT, 2011
150 tons of relief items 50 kilometers within Nairobi by truck
Source: EcotransIT, 2011

40
2nd hand clothing from Tampere-Kouvola by truck
Source: EcotransIT, 2011
2nd hand clothing from Kouvola to Dushanbee by train
Source: EcotransIT, 2011
41
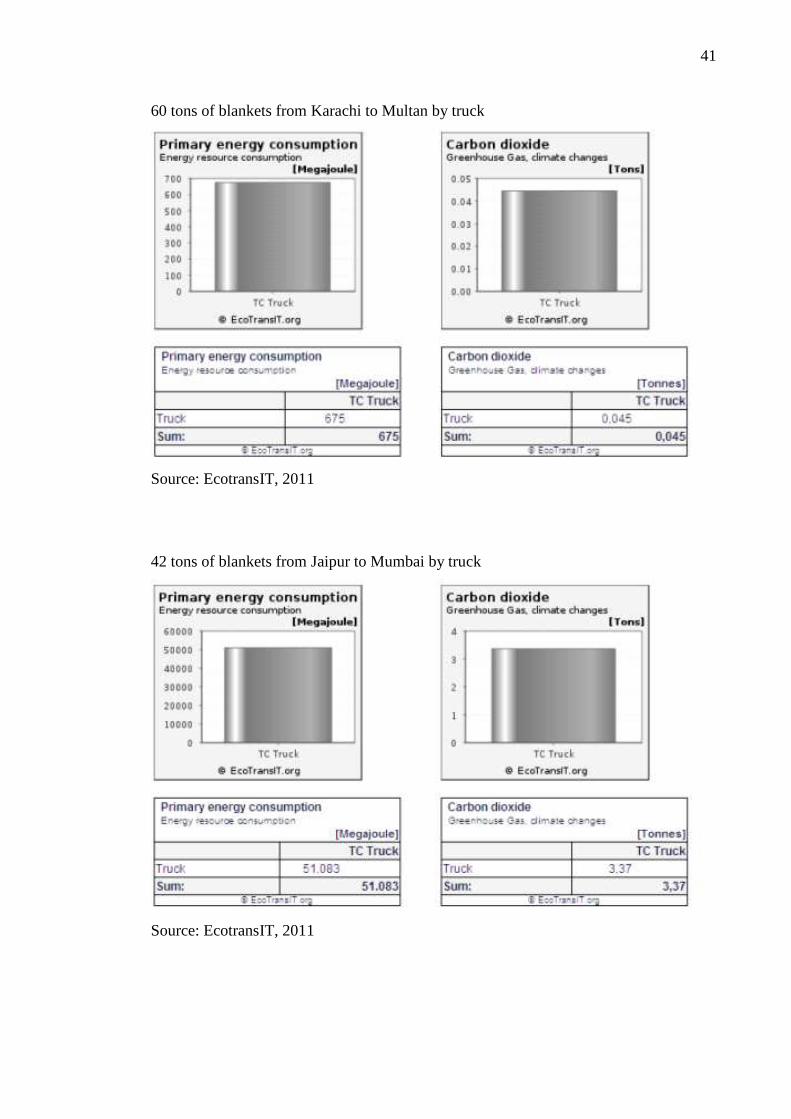
60 tons of blankets from Karachi to Multan by truck
Source: EcotransIT, 2011
42 tons of blankets from Jaipur to Mumbai by truck
Source: EcotransIT, 2011
42
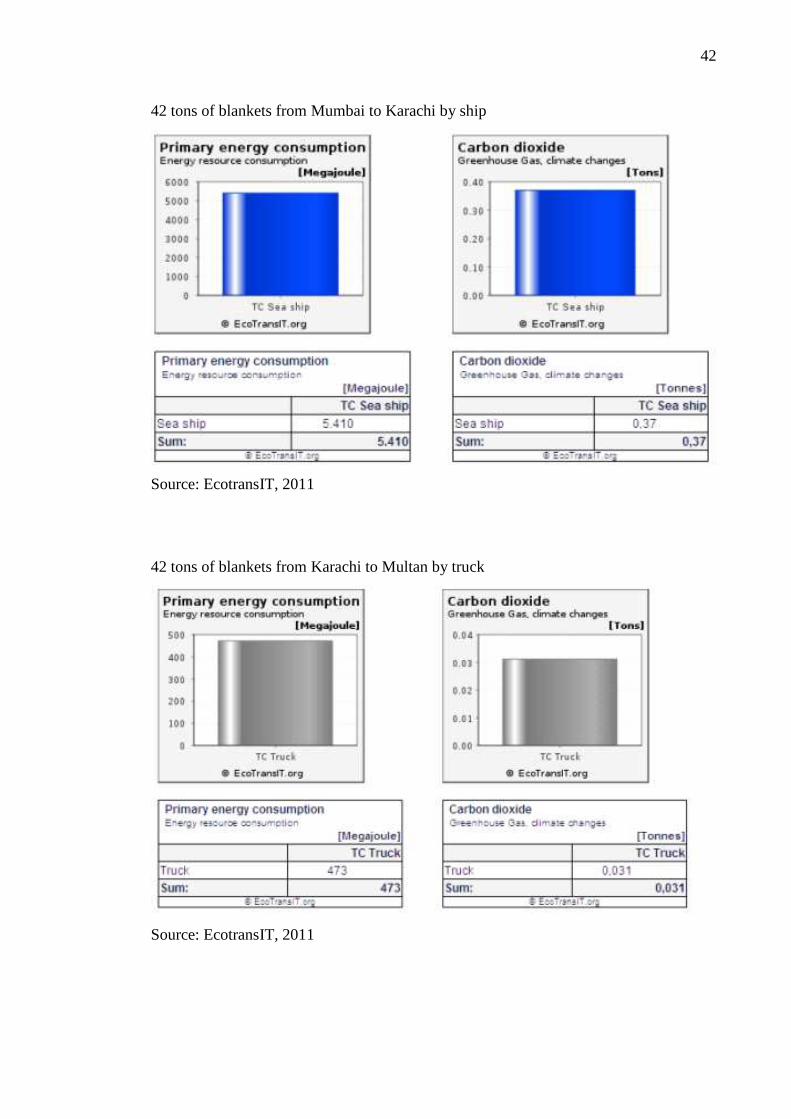
42 tons of blankets from Mumbai to Karachi by ship
Source: EcotransIT, 2011
42 tons of blankets from Karachi to Multan by truck
Source: EcotransIT, 2011
43
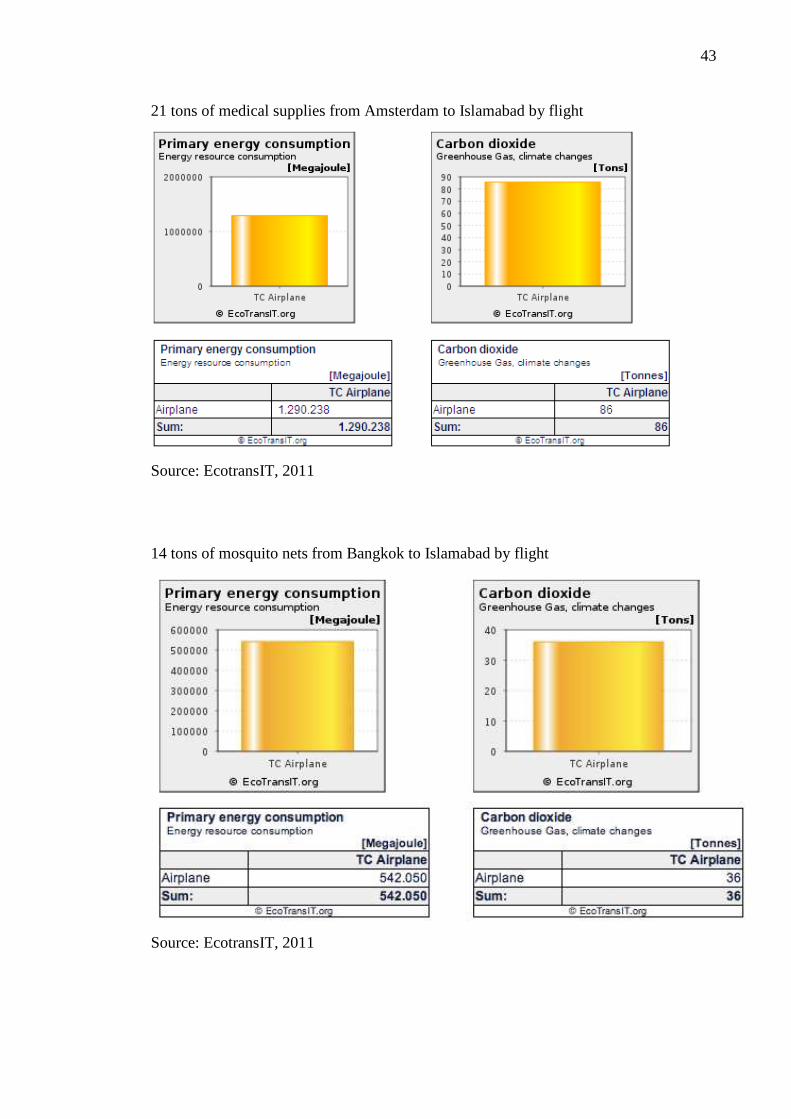
21 tons of medical supplies from Amsterdam to Islamabad by flight
Source: EcotransIT, 2011
14 tons of mosquito nets from Bangkok to Islamabad by flight
Source: EcotransIT, 2011

44
14 tons of mosquito nets from Islamabad to Mardan by truck
Source: EcotransIT, 2011
20 tons of tarpaulins from Lahore to Mardan by truck
Source: EcotransIT, 2011

45
166 tons of seeds from Pietersburg to Harare by truck
Source: EcotransIT, 2011
499 tons of seeds 50 km within Harare by truck
Source: EcotransIT, 2011
46
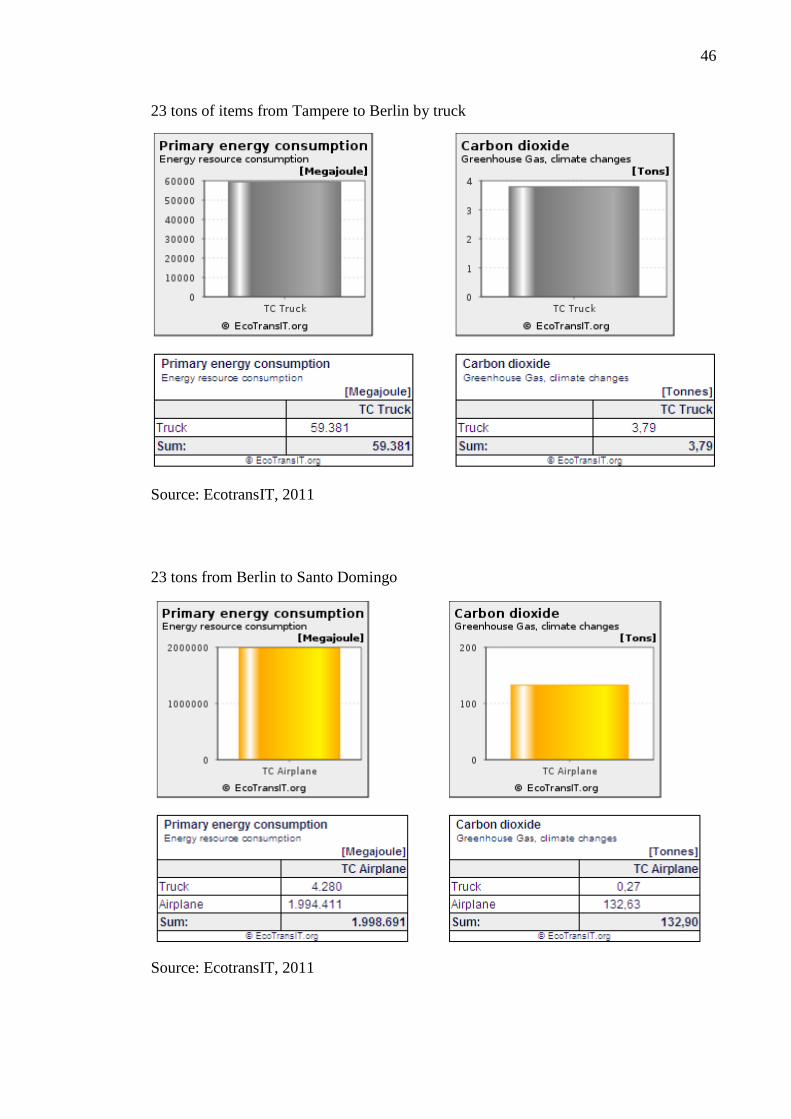
23 tons of items from Tampere to Berlin by truck
Source: EcotransIT, 2011
23 tons from Berlin to Santo Domingo
Source: EcotransIT, 2011
47
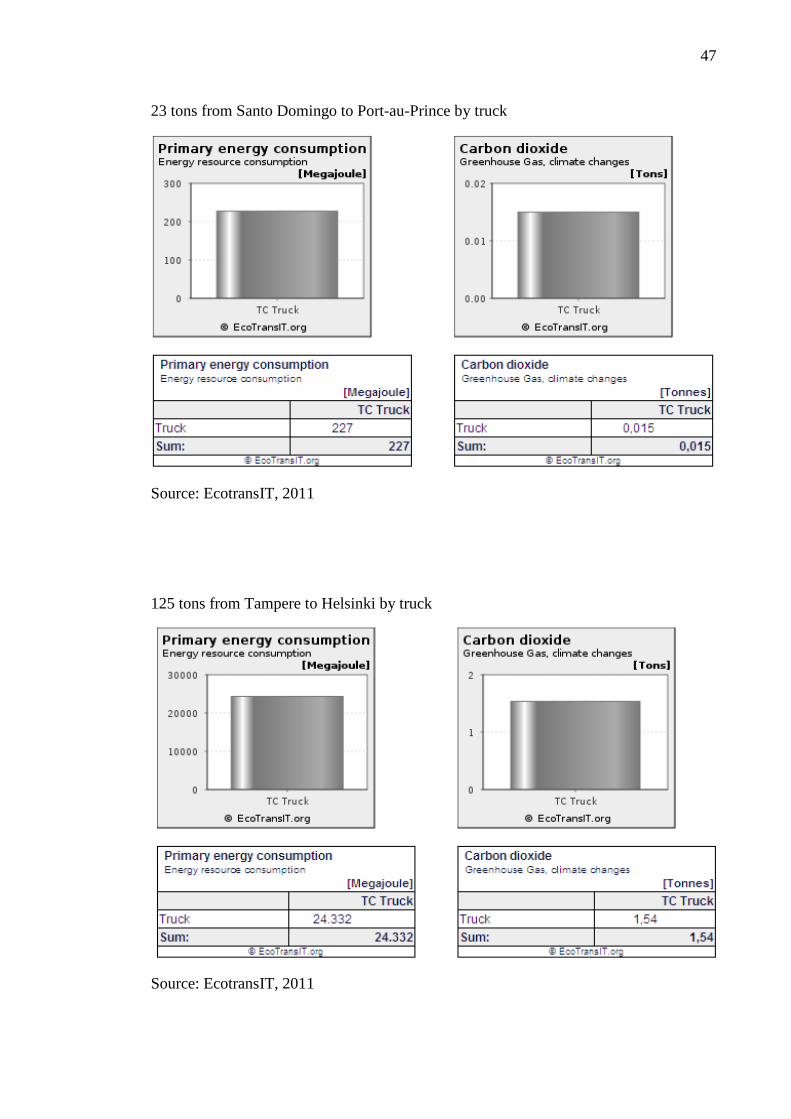
23 tons from Santo Domingo to Port-au-Prince by truck
Source: EcotransIT, 2011
125 tons from Tampere to Helsinki by truck
Source: EcotransIT, 2011
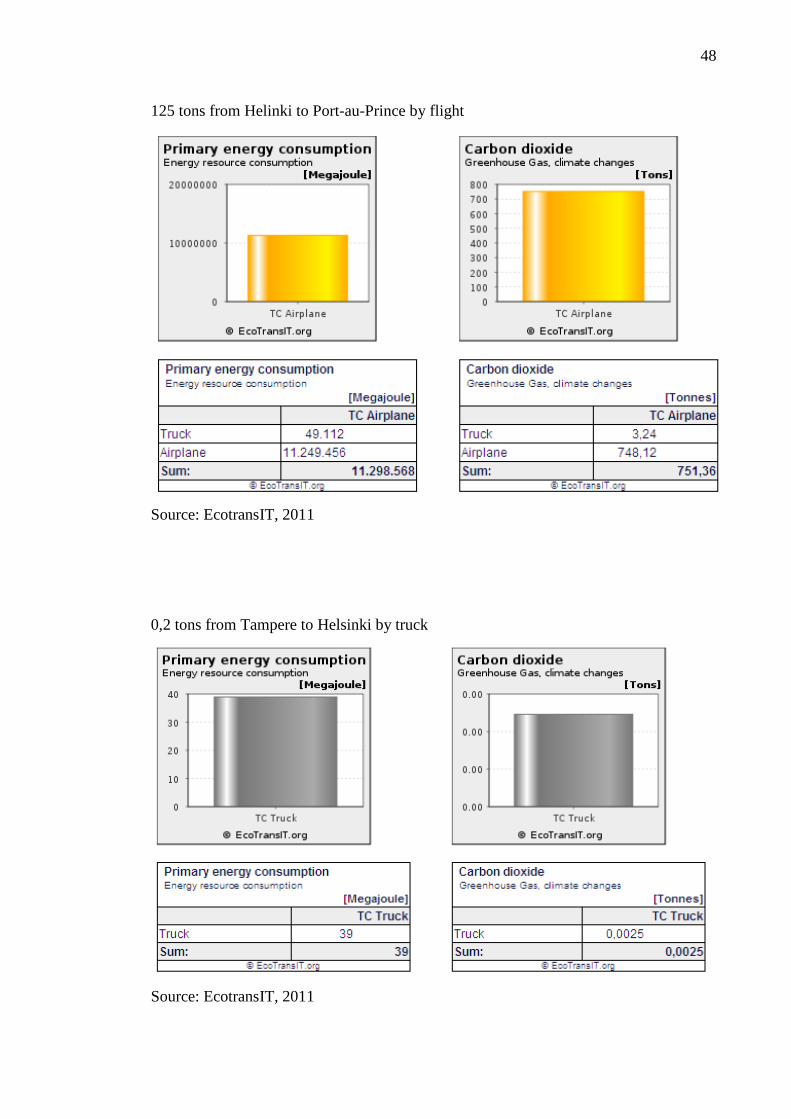
48
125 tons from Helinki to Port-au-Prince by flight
Source: EcotransIT, 2011
0,2 tons from Tampere to Helsinki by truck
Source: EcotransIT, 2011
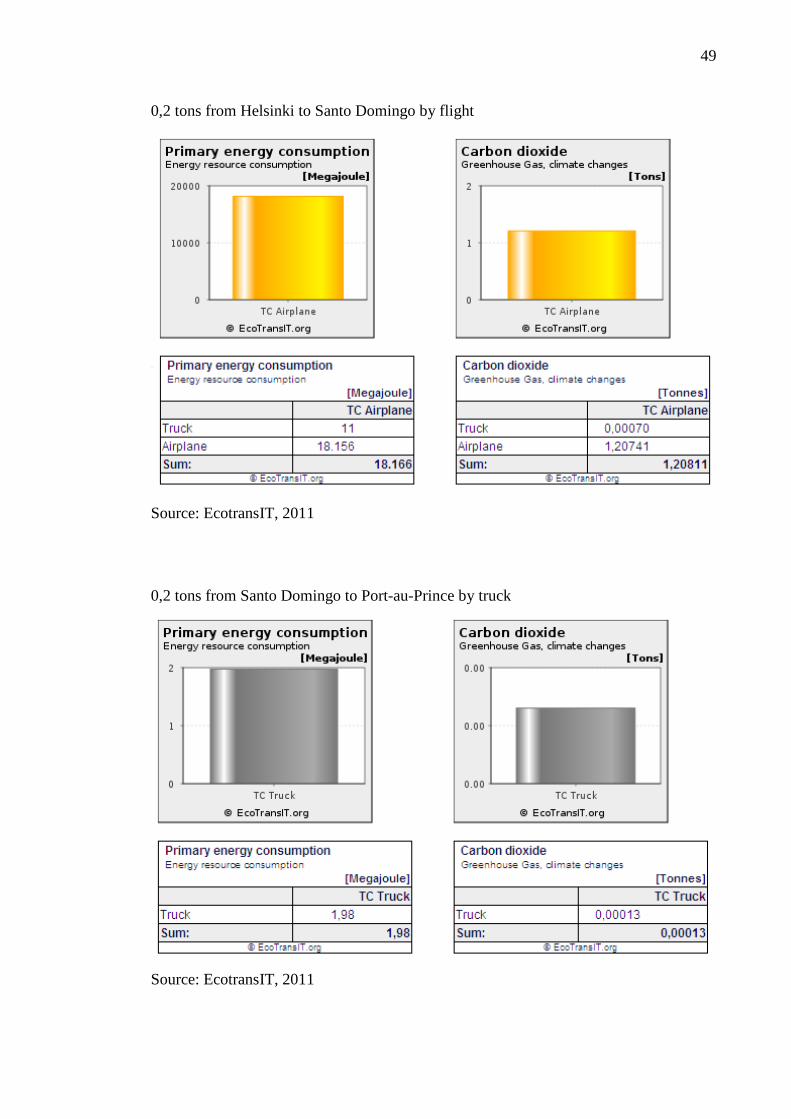
49
0,2 tons from Helsinki to Santo Domingo by flight
Source: EcotransIT, 2011
0,2 tons from Santo Domingo to Port-au-Prince by truck
Source: EcotransIT, 2011
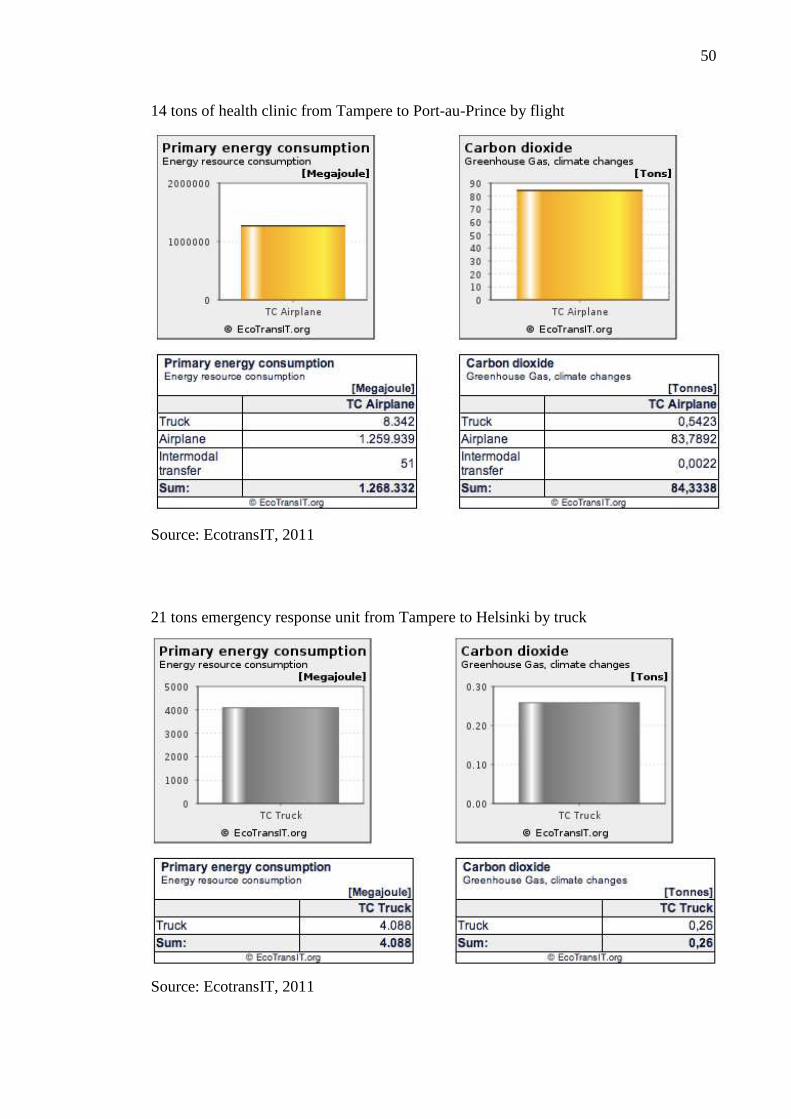
50
14 tons of health clinic from Tampere to Port-au-Prince by flight
Source: EcotransIT, 2011
21 tons emergency response unit from Tampere to Helsinki by truck
Source: EcotransIT, 2011

51
21 tons emergency response unit from Helsinki to Berlin by flight
Source: EcotransIT, 2011
31 tons of relief items from Berlin to Port-au-Prince by flight
Source: EcotransIT, 2011
52
9.3. Comments from Kirsi Pohjola, the Finnish Red Cross
Kuljetusten päästöt on aiheena hyvin ajankohtainen. Paljon kuljetuksia käyttävät
organisaatiot pohtivat miten laskea ja raportoida ympäristövaikutukset, joista kuljetus
on vain yksi tekijä . Asia on tärkeä myös puhtaasti hankinnan näkökulmasta.
Useammissa organisaatioissa ympäristötekijät tulisi huomioida kriteerinä
hankintapäätöstä tehdessä, mutta yksinkertaisia ja luotettavia työkaluja tasapuoliseen
kuljetusten ympäristövaikutusten analysointiin ei yleisessä käytössä löydy.
Tässä työssä tuli esiin eri kuljetusmuotojen ympäristövaikutukset hiilidioksidimäärinä
sekä paikallisesti tai alueellisesti hankittujen tuotteiden ympäristövaikutukset vs. kaukaa
kuljetettaviin. Työn tulokset mahdollisti vertailun karkealla tasolla, mikä oli työn
tavoitteena. Työlle annetut tavoitteet täyttyivät.
Teoriapohjana oli humanitaarinen logistiikka ja green logistics. Jos näistä teorioista tai
esim. ympäristötieteen puolelta olisi löytynyt selvä malli olisi loppupäätelmiä voinut
tehdä mallinnuksen mukaan ja näin helpottanut ja syventänyt loppupäätelmiä. Tai
työelämää enemmän palvelevana tarkistellut käytännön ongelmaa perehtymällä muiden
organisaatioiden ympäristövaikutusten laskemisen toimintamalleihin ja miten ne
toimivat humanitaarisessa logistiikassa.
Raportoinnissa olisi voinut muotoilla taulukoita enemmän lukijaystävälliseksi eli tässä
tarkoitan lukijoita, joille operaatiot eivät ole tuttuja. Lhyt ja selkeä maakohtainen
logistiikkaosio teki työstä selkeän, koska se loi operaatiokuvausten lisäksi raamit
logistiikka toiminnoille. Loppupäätelmiin enemmän konkretiaa esim. suhteutuksia
painoihin ja kuutioihin, joita kuljetettu. Kuitenkaan tämä ei ole iso asia, sillä tiedot ovat
työssä ja sieltä saatavissa.
Kokonaisvaltaisesti työ oli hyvä ja SPR:n määrittelemät tavoitteet täyttyivät. Työssä
näkyi, että organisaation toimintaan oli perehdytty ja ulkopuolisena se vaati paljon työtä
ja aikaa.